Embed Size (px)
Citation preview
Comprehensive Nutrient Management PlanData and Calculations (Draft)
Last Revised: 24-July-2009Copyright © 2008-2009 Purdue Research Foundation
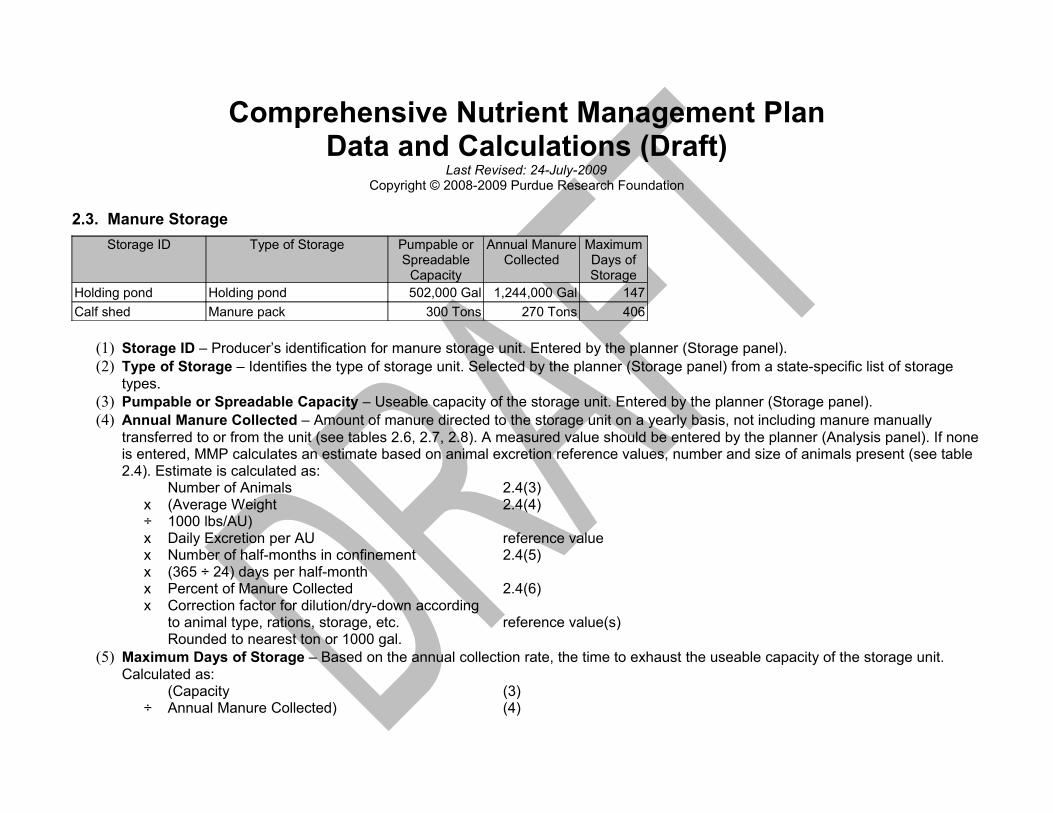
2.3. Manure StorageStorage ID Type of Storage Pumpable or
SpreadableCapacity
Annual ManureCollected
MaximumDays ofStorage
Holding pond Holding pond 502,000 Gal 1,244,000 Gal 147Calf shed Manure pack 300 Tons 270 Tons 406
(1) Storage ID – Producer’s identification for manure storage unit. Entered by the planner (Storage panel).(2) Type of Storage – Identifies the type of storage unit. Selected by the planner (Storage panel) from a state-specific list of storage
types.(3) Pumpable or Spreadable Capacity – Useable capacity of the storage unit. Entered by the planner (Storage panel).(4) Annual Manure Collected – Amount of manure directed to the storage unit on a yearly basis, not including manure manually
transferred to or from the unit (see tables 2.6, 2.7, 2.8). A measured value should be entered by the planner (Analysis panel). If none is entered, MMP calculates an estimate based on animal excretion reference values, number and size of animals present (see table 2.4). Estimate is calculated as:
Number of Animals 2.4(3) x (Average Weight 2.4(4) ÷ 1000 lbs/AU)x Daily Excretion per AU reference valuex Number of half-months in confinement 2.4(5)x (365 ÷ 24) days per half-monthx Percent of Manure Collected 2.4(6)x Correction factor for dilution/dry-down according
to animal type, rations, storage, etc. reference value(s)Rounded to nearest ton or 1000 gal.
(5) Maximum Days of Storage – Based on the annual collection rate, the time to exhaust the useable capacity of the storage unit. Calculated as:
(Capacity (3)÷ Annual Manure Collected) (4)

x 365 days/yearRounded to the nearest full day
CNMP – Data and Calculations - 2 - Rev. 24-July-2009
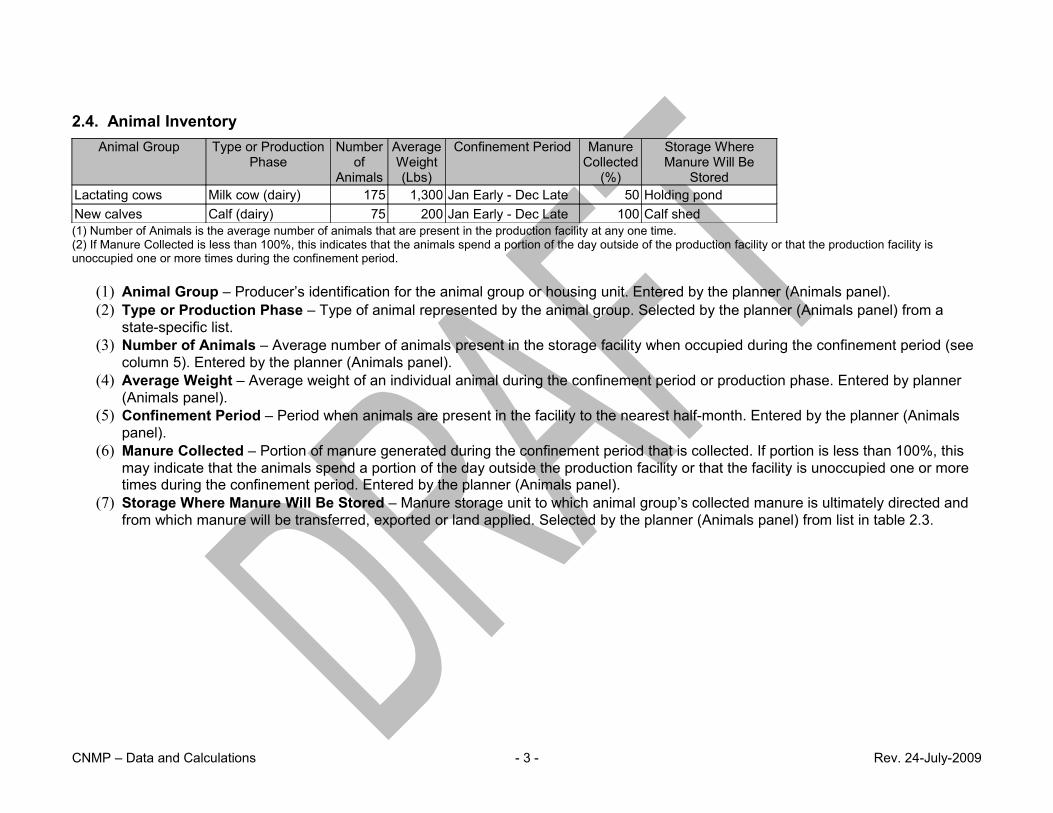
2.4. Animal InventoryAnimal Group Type or Production
PhaseNumber
ofAnimals
AverageWeight(Lbs)
Confinement Period ManureCollected
(%)
Storage WhereManure Will Be
StoredLactating cows Milk cow (dairy) 175 1,300 Jan Early - Dec Late 50 Holding pondNew calves Calf (dairy) 75 200 Jan Early - Dec Late 100 Calf shed(1) Number of Animals is the average number of animals that are present in the production facility at any one time.(2) If Manure Collected is less than 100%, this indicates that the animals spend a portion of the day outside of the production facility or that the production facility is unoccupied one or more times during the confinement period.
(1) Animal Group – Producer’s identification for the animal group or housing unit. Entered by the planner (Animals panel).(2) Type or Production Phase – Type of animal represented by the animal group. Selected by the planner (Animals panel) from a
state-specific list.(3) Number of Animals – Average number of animals present in the storage facility when occupied during the confinement period (see
column 5). Entered by the planner (Animals panel).(4) Average Weight – Average weight of an individual animal during the confinement period or production phase. Entered by planner
(Animals panel).(5) Confinement Period – Period when animals are present in the facility to the nearest half-month. Entered by the planner (Animals
panel).(6) Manure Collected – Portion of manure generated during the confinement period that is collected. If portion is less than 100%, this
may indicate that the animals spend a portion of the day outside the production facility or that the facility is unoccupied one or more times during the confinement period. Entered by the planner (Animals panel).
(7) Storage Where Manure Will Be Stored – Manure storage unit to which animal group’s collected manure is ultimately directed and from which manure will be transferred, exported or land applied. Selected by the planner (Animals panel) from list in table 2.3.
CNMP – Data and Calculations - 3 - Rev. 24-July-2009
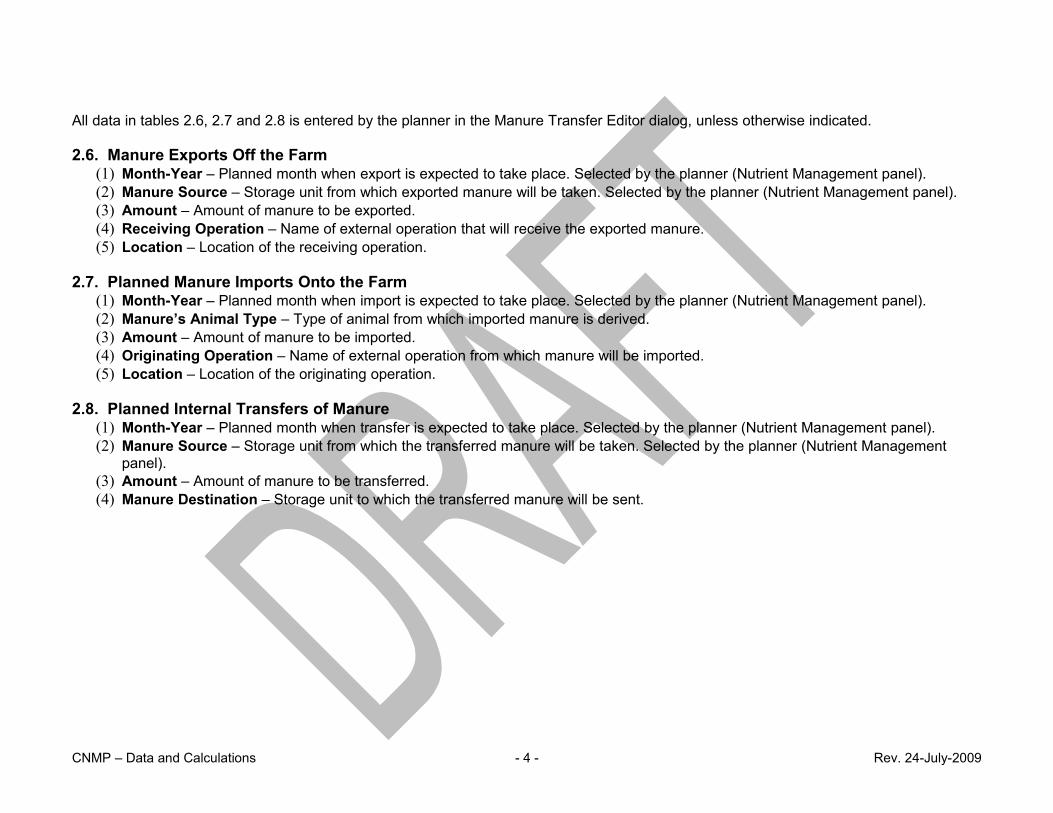
All data in tables 2.6, 2.7 and 2.8 is entered by the planner in the Manure Transfer Editor dialog, unless otherwise indicated.
2.6. Manure Exports Off the Farm(1) Month-Year – Planned month when export is expected to take place. Selected by the planner (Nutrient Management panel).(2) Manure Source – Storage unit from which exported manure will be taken. Selected by the planner (Nutrient Management panel).(3) Amount – Amount of manure to be exported.(4) Receiving Operation – Name of external operation that will receive the exported manure.(5) Location – Location of the receiving operation.
2.7. Planned Manure Imports Onto the Farm(1) Month-Year – Planned month when import is expected to take place. Selected by the planner (Nutrient Management panel).(2) Manure’s Animal Type – Type of animal from which imported manure is derived.(3) Amount – Amount of manure to be imported.(4) Originating Operation – Name of external operation from which manure will be imported.(5) Location – Location of the originating operation.
2.8. Planned Internal Transfers of Manure(1) Month-Year – Planned month when transfer is expected to take place. Selected by the planner (Nutrient Management panel).(2) Manure Source – Storage unit from which the transferred manure will be taken. Selected by the planner (Nutrient Management
panel).(3) Amount – Amount of manure to be transferred.(4) Manure Destination – Storage unit to which the transferred manure will be sent.
CNMP – Data and Calculations - 4 - Rev. 24-July-2009

5.1. Soil InformationField Soil
SurveyMap Unit Soil Component
NameSurfaceTexture
SlopeRange
(%)4 157 Em Emory SIL 1-3%6a 157 DcD2 Decatur SICL 12-20%
Information contained in this table will vary depending on the requirements of the state, and will include at a minimum:(1) Field – Field and subfield names (6.1(1), (2)).(2) Soil Survey – Soil survey identifier.(3) Map Unit – Soil survey map unit symbol. Selected by the planner (Fields panel) or determined by GIS.(4) Soil Component Name – Soil component name.(5) Surface Texture – Surface texture of the soil type.(6) Slope Range – Slope range of the soil type.
CNMP – Data and Calculations - 5 - Rev. 24-July-2009

5.2. Predicted Soil Erosion
Field Predominant Soil TypeSlope(%)
Wind(Ton/Ac/Yr)
Irrigation(Ton/Ac/Yr)
Gully(Ton/Ac/Yr)
Ephemeral(Ton/Ac/Yr)
Plan Avg. Soil Loss
(Ton/Ac/Yr)4 Em (Emory SIL) 2.0 1.56a DcD2 (Decatur SICL) 16.0 3.4
Field Crop YearStarting Date(mm/dd/yyyy)
Ending Date(mm/dd/yyyy)
Soil Loss(Ton/Ac) Primary Crop
4 2008 9/2/2007 9/1/2008 1.5 Corn silage2009 9/2/2008 9/1/2009 1.5 Corn silage2010 9/2/2009 9/1/2010 1.5 Corn silage
6a 2008 9/2/2007 9/1/2008 3.7 Corn silage2009 9/2/2008 9/1/2009 3.3 Corn silage2010 9/2/2009 9/1/2010 3.1 Corn silage
The content of this table will vary depending on whether the planner has used RUSLE2 within MMP to calculate soil loss.(1) Field – Field and subfield names (6.1(1), (2)).(2) Predominant Soil Type – Map unit, component name and surface texture of the dominant soil type within the field (see table 5.1).(3) Slope – Representative slope of the field. Entered by the planner (6.1(9)); otherwise calculated as the midpoint of soil type slope
range (5.1(5)), rounded to nearest 0.1 %.(4) Wind – Average annual wind erosion. Entered by the planner (Assessment panel).(5) Irrigation – Average annual irrigation induced erosion. Entered by the planner (Assessment panel).(6) Gully – Average annual gully erosion. Entered by the planner (Assessment panel).(7) Ephemeral – Average annual ephemeral erosion. Entered by the planner (Assessment panel).(8) Plan Avg. Soil Loss – Average RULSE2-calculated soil loss value across the length of the plan. Rounded to nearest 0.1
tons/acre/year.
(9) Field – Field and subfield names (6.1(1), (2)).(10) Crop Year – Crop year.(11) Starting Date – Month, date and year on which the RUSLE2 crop year begins. Calculated based on RUSLE2 management
operations.(12) Ending Date – Month, date and year on which the RUSLE2 crop year ends. Calculated based on RUSLE2 management
operations.
CNMP – Data and Calculations - 6 - Rev. 24-July-2009
(13) Soil Loss – RUSLE2-calculated soil loss for the crop year. Rounded to nearest 0.1 tons/acre.(14) Primary Crop – Primary harvested crop for the crop year (6.5(3)).
5.2. Predicted Soil Erosion (without RUSLE2)(1) Field – Field and subfield names (6.1(1), (2)).(2) Predominant Soil Type – Map unit, component name and surface texture of the dominant soil type within the field (see table 5.1).(3) Slope – Representative slope of the field. Entered by the planner (6.1(9)); otherwise calculated as the midpoint of soil type slope
range (5.1(5)), rounded to nearest 0.1 %.(4) Water – Average annual water erosion. Entered by the planner (Assessment panel).(5) Wind – Average annual wind erosion. Entered by the planner (Assessment panel).(6) Irrigation – Average annual irrigation induced erosion. Entered by the planner (Assessment panel).(7) Gully – Average annual gully erosion. Entered by the planner (Assessment panel).(8) Ephemeral – Average annual ephemeral erosion. Entered by the planner (Assessment panel).(9) Total – Total of the above erosion values.
CNMP – Data and Calculations - 7 - Rev. 24-July-2009
5.3. Nitrogen and Phosphorus Risk AnalysisThe content of this table(s) will vary depending on the requirements of the state nitrate and/or phosphorus risk assessments, if any. See notes accompanying risk assessment tools or source publications for calculation details.
5.4. Additional Field Data Required by Risk Assessment ProcedureThe content of this table will vary depending on the requirements of the state nitrate and/or phosphorus risk assessments. All information here is entered by the planner.
CNMP – Data and Calculations - 8 - Rev. 24-July-2009

6.1. Field InformationField ID Sub-
field IDTotalAcres
Spread-able
Acres
FSAFarm
FSATract
FSAField
County Predominant Soil Type Slope(%)
4 33.9 33.9 1234 4 Washington Em (Emory SIL)6a 17.6 16.9 1234 6 Washington DcD2 (Decatur SICL)
(1) Field ID – Producer’s identification for field. Entered by the planner (Fields panel).(2) Subfield ID – Subfield identification. Entered by the planner (Fields panel).(3) Total Acres – Total farmed acres in the field. Entered by the planner (Fields panel) or calculated by GIS. Rounded to nearest 0.1
acres.(4) Spreadable Acres – Portion of the field available for manure application, i.e. excluding areas within application setbacks. Entered by
the planner (Fields panel) or calculated by GIS. Rounded to nearest 0.1 acres.(5) FSA Farm – FSA farm identification number. Entered by the planner (Fields panel).(6) FSA Tract – FSA tract identification number. Entered by the planner (Fields panel).(7) FSA Field – FSA field identification number. Entered by the planner (Fields panel).(8) County – County in which the field is located. Selected by the planner (Fields panel). If no county is selected, the operation’s county
is used instead.(9) Predominant Soil Type – Map unit, component name and surface texture of the dominant soil type within the field (see table 5.1).(10) Slope – Representative slope of the field, if different from typical slope of the soil survey unit. Entered by the planner (Fields panel).
CNMP – Data and Calculations - 9 - Rev. 24-July-2009

6.2. Manure Application Setback DistancesSetback Requirements: NRCS Standard
Feature Setback Criteria Setback Distance
(Feet)Well Application upgradient of feature 300Well Application down-gradient of feature 150Waterbody Predominant slope <5% with good vegetation 30Waterbody Predominant slope >8% 100Waterbody Poor vegetation 100Public road All applications 50Dwelling (other than producer) All applications 300Public use area All applications 300Property line Application upgradient of feature 30Source: Nutrient Management Standard 590
Data in the setbacks table is drawn from state and national regulations and guidance. This information, as used by MMP, can be reviewed at http://nmplanner.missouri.edu/software/setbacks.asp.(1) Feature – Physical feature from which manure application setback is measured.(2) Setback Criteria – Application conditions under which setback must be observed.(3) Setback Distance – Distance from feature (1) within which manure application is prohibited under the given conditions (2).
CNMP – Data and Calculations - 10 - Rev. 24-July-2009
6.3. Soil Test DataField Test
YearOM(%)
P Test Used P K Mg Ca Units SoilpH
BufferpH
CEC(meq/100g)
4 2003 220 340 lbs/a 6.46a 2003 86 208 lbs/a 6.0
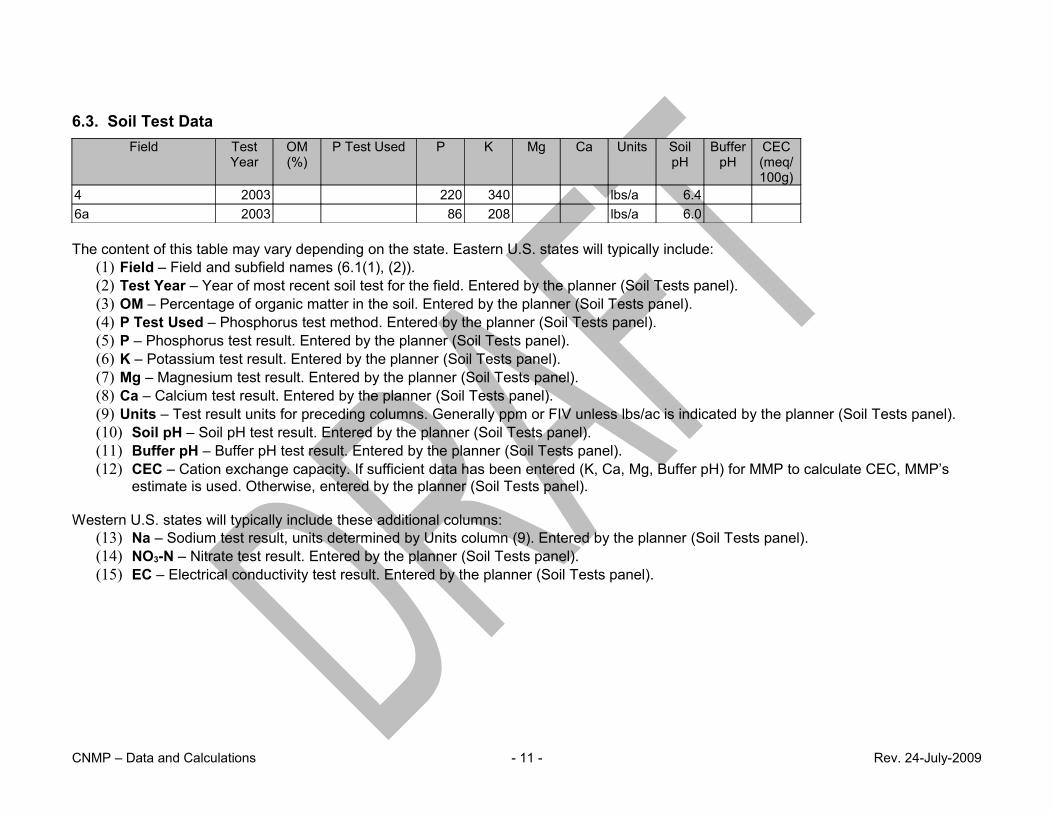
The content of this table may vary depending on the state. Eastern U.S. states will typically include:(1) Field – Field and subfield names (6.1(1), (2)).(2) Test Year – Year of most recent soil test for the field. Entered by the planner (Soil Tests panel).(3) OM – Percentage of organic matter in the soil. Entered by the planner (Soil Tests panel).(4) P Test Used – Phosphorus test method. Entered by the planner (Soil Tests panel).(5) P – Phosphorus test result. Entered by the planner (Soil Tests panel).(6) K – Potassium test result. Entered by the planner (Soil Tests panel).(7) Mg – Magnesium test result. Entered by the planner (Soil Tests panel).(8) Ca – Calcium test result. Entered by the planner (Soil Tests panel).(9) Units – Test result units for preceding columns. Generally ppm or FIV unless lbs/ac is indicated by the planner (Soil Tests panel).(10) Soil pH – Soil pH test result. Entered by the planner (Soil Tests panel).(11) Buffer pH – Buffer pH test result. Entered by the planner (Soil Tests panel).(12) CEC – Cation exchange capacity. If sufficient data has been entered (K, Ca, Mg, Buffer pH) for MMP to calculate CEC, MMP’s
estimate is used. Otherwise, entered by the planner (Soil Tests panel).
Western U.S. states will typically include these additional columns:(13) Na – Sodium test result, units determined by Units column (9). Entered by the planner (Soil Tests panel).(14) NO3-N – Nitrate test result. Entered by the planner (Soil Tests panel).(15) EC – Electrical conductivity test result. Entered by the planner (Soil Tests panel).
CNMP – Data and Calculations - 11 - Rev. 24-July-2009
6.4. Manure Nutrient AnalysisManure Source Dry
Matter (%)
Total N NH4-N TotalP2O5
TotalK2O
Avail.P2O5
Avail.K2O
Units Analysis Source and Date
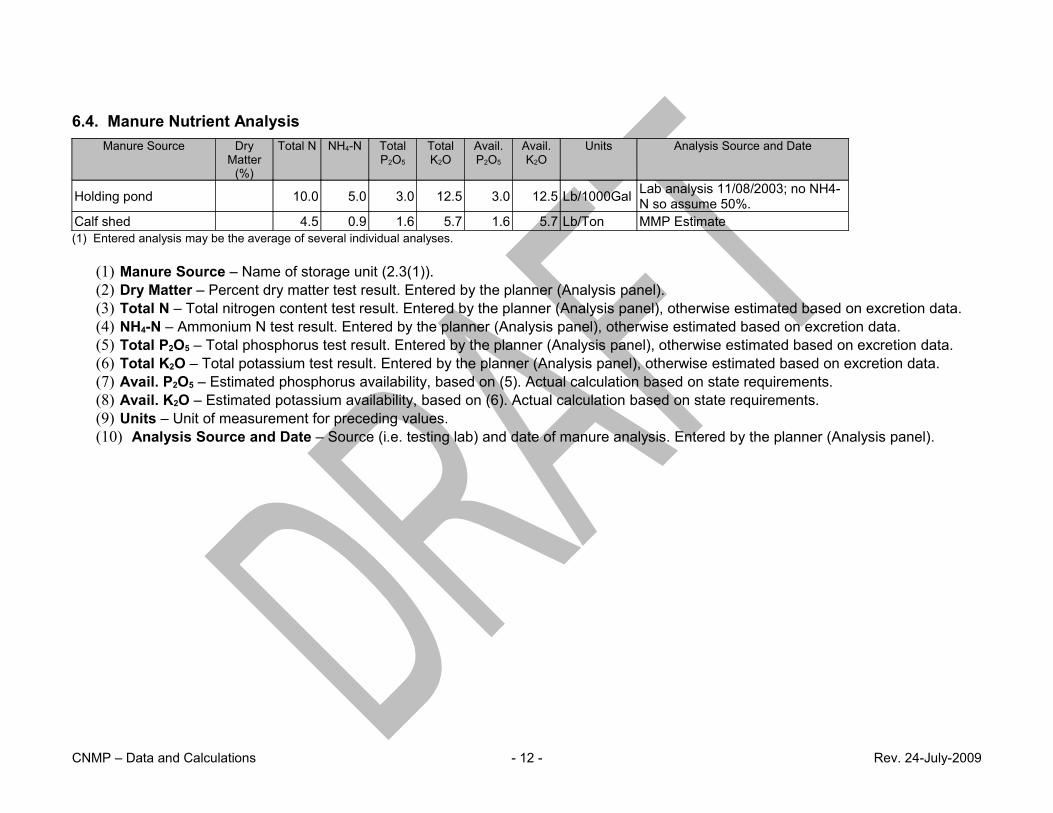
Holding pond 10.0 5.0 3.0 12.5 3.0 12.5 Lb/1000Gal Lab analysis 11/08/2003; no NH4-N so assume 50%.
Calf shed 4.5 0.9 1.6 5.7 1.6 5.7 Lb/Ton MMP Estimate(1) Entered analysis may be the average of several individual analyses.
(1) Manure Source – Name of storage unit (2.3(1)).(2) Dry Matter – Percent dry matter test result. Entered by the planner (Analysis panel).(3) Total N – Total nitrogen content test result. Entered by the planner (Analysis panel), otherwise estimated based on excretion data.(4) NH4-N – Ammonium N test result. Entered by the planner (Analysis panel), otherwise estimated based on excretion data.(5) Total P2O5 – Total phosphorus test result. Entered by the planner (Analysis panel), otherwise estimated based on excretion data.(6) Total K2O – Total potassium test result. Entered by the planner (Analysis panel), otherwise estimated based on excretion data.(7) Avail. P2O5 – Estimated phosphorus availability, based on (5). Actual calculation based on state requirements.(8) Avail. K2O – Estimated potassium availability, based on (6). Actual calculation based on state requirements.(9) Units – Unit of measurement for preceding values.(10) Analysis Source and Date – Source (i.e. testing lab) and date of manure analysis. Entered by the planner (Analysis panel).
CNMP – Data and Calculations - 12 - Rev. 24-July-2009

6.5. Planned Crops and Fertilizer RecommendationsField Crop
YearPlanned Crop Yield
Goal(per Acre)
NRec
(Lbs/A)
P2O5
Rec(Lbs/A)
K2ORec
(Lbs/A)
NRemoved(Lbs/A)
P2O5
Removed(Lbs/A)
K2ORemoved(Lbs/A)
Custom Fert. Rec. Source
4 2008 Small grain cover* 0 0 04 2008 Corn silage 22.0 Ton 150 0 0 176 66 1764 2009 Small grain cover* 0 0 04 2009 Corn silage 22.0 Ton 150 0 0 176 66 1764 2010 Small grain cover* 0 0 04 2010 Corn silage 22.0 Ton 150 0 0 176 66 1766a 2008 Small grain cover* 0 0 06a 2008 Corn silage 22.0 Ton 150 60 100 176 66 1766a 2009 Small grain cover* 0 0 06a 2009 Corn silage 22.0 Ton 150 60 100 176 66 1766a 2010 Small grain cover* 0 0 06a 2010 Corn silage 22.0 Ton 150 60 100 176 66 176
(1) Field – Field and subfield names (6.1(1), (2)).(2) Crop Year – Year in which primary crop will be harvested.(3) Planned Crop – Type of crop to be grown. An asterisk indicates that this is a cover crop or first crop in a double-crop system.
Entered by the planner (Crops panel).(4) Yield Goal – Expected yield. Entered by the planner (Crops panel).(5) N Rec – Nitrogen fertilizer recommendation, unless a custom recommendation is entered by the planner (Crops panel), this is
calculated according to published state recommendations (see References section for specific publications).(6) P2O5 Rec – P2O5 fertilizer recommendation.(7) K2O Rec – K2O fertilizer recommendation.(8) N Removed – Nitrogen removed by the expected yield of the crop, calculated according to published crop removal rates (see
References section for specific publications).(9) P2O5 Removed – P2O5 removed by the expected yield of the crop.(10) K2O Removed – K2O removed by the expected yield of the crop.(11) Custom Fert. Rec. Source – Source or reason for customer fertilizer recommendation entered by the planner.
CNMP – Data and Calculations - 13 - Rev. 24-July-2009
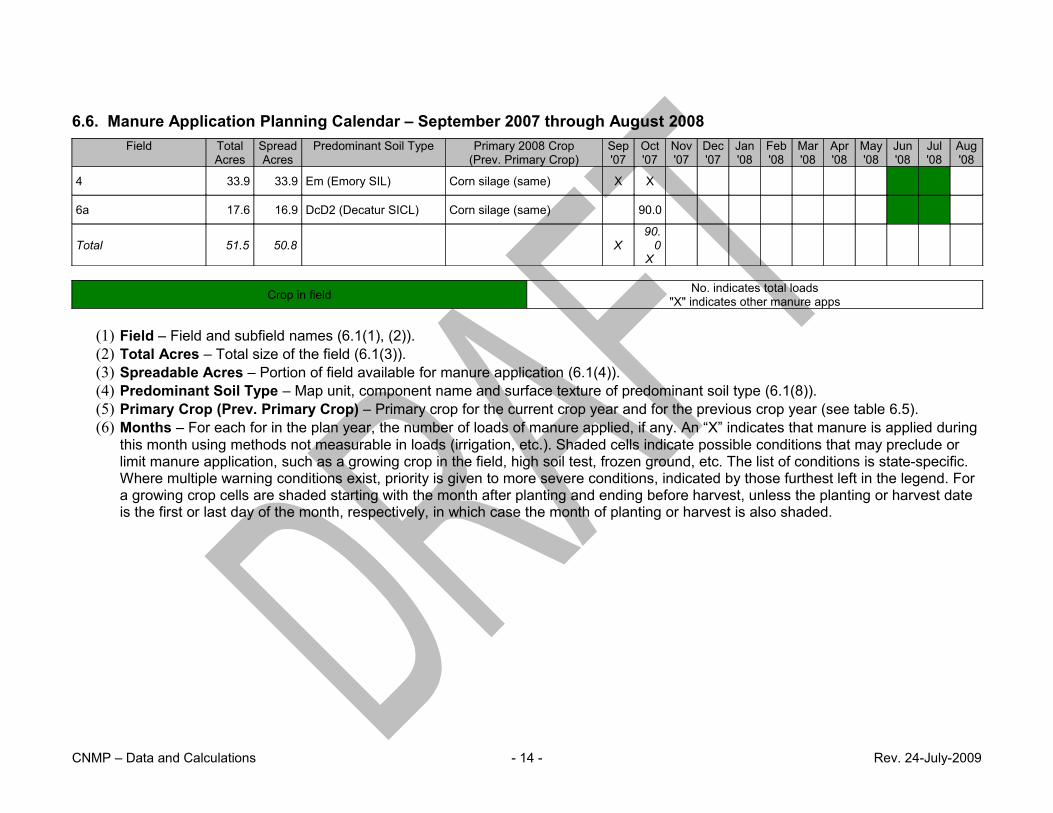
6.6. Manure Application Planning Calendar – September 2007 through August 2008Field Total
AcresSpreadAcres
Predominant Soil Type Primary 2008 Crop(Prev. Primary Crop)
Sep'07
Oct'07
Nov'07
Dec'07
Jan'08
Feb'08
Mar'08
Apr'08
May'08
Jun'08
Jul'08
Aug'08
4 33.9 33.9 Em (Emory SIL) Corn silage (same) X X
6a 17.6 16.9 DcD2 (Decatur SICL) Corn silage (same) 90.0
Total 51.5 50.8 X90.
0X
Crop in field No. indicates total loads"X" indicates other manure apps
(1) Field – Field and subfield names (6.1(1), (2)).(2) Total Acres – Total size of the field (6.1(3)).(3) Spreadable Acres – Portion of field available for manure application (6.1(4)).(4) Predominant Soil Type – Map unit, component name and surface texture of predominant soil type (6.1(8)).(5) Primary Crop (Prev. Primary Crop) – Primary crop for the current crop year and for the previous crop year (see table 6.5).(6) Months – For each for in the plan year, the number of loads of manure applied, if any. An “X” indicates that manure is applied during
this month using methods not measurable in loads (irrigation, etc.). Shaded cells indicate possible conditions that may preclude or limit manure application, such as a growing crop in the field, high soil test, frozen ground, etc. The list of conditions is state-specific. Where multiple warning conditions exist, priority is given to more severe conditions, indicated by those furthest left in the legend. For a growing crop cells are shaded starting with the month after planting and ending before harvest, unless the planting or harvest date is the first or last day of the month, respectively, in which case the month of planting or harvest is also shaded.
CNMP – Data and Calculations - 14 - Rev. 24-July-2009

6.7. Planned Nutrient ApplicationsField App.
MonthTarget Crop Nutrient Source Application Method Rate
BasisRate/Acre Loads,
Speed or Time
Total Amount Applied
Acres Cov.
Avail N(Lbs/A)
Avail P2O5
(Lbs/A)
Avail K2O
(Lbs/A)4 Sep 2007 Corn silage Holding pond Splash plate unit, Not incorporated Custom 19,000 Gal 0.8 mph 553,600 Gal 29.1 86 57 2384 Oct 2007 Corn silage Holding pond Splash plate unit, Not incorporated Custom 19,000 Gal 0.8 mph 91,200 Gal 4.8 86 57 2384 Jun 2008 Corn silage 28-0-0 Surface band Supp. N 22 Gal 746 Gal 33.9 66 0 04 Sep 2008 Corn silage Holding pond Splash plate unit, Not incorporated Custom 19,000 Gal 0.8 mph 562,200 Gal 29.6 86 57 2384 Oct 2008 Corn silage Holding pond Splash plate unit, Not incorporated Custom 19,000 Gal 0.8 mph 81,700 Gal 4.3 86 57 2384 Jun 2009 Corn silage 28-0-0 Surface band Supp. N 17 Gal 576 Gal 33.9 51 0 04 Sep 2009 Corn silage Holding pond Splash plate unit, Not incorporated Custom 19,000 Gal 0.8 mph 571,000 Gal 30.1 86 57 2384 Oct 2009 Corn silage Holding pond Splash plate unit, Not incorporated Custom 19,000 Gal 0.8 mph 72,200 Gal 3.8 86 57 2384 Jun 2010 Corn silage 28-0-0 Surface band Supp. N 15 Gal 509 Gal 33.9 45 0 06a Oct 2007 Corn silage Calf shed Flail spreader, Not incorporated Custom 16 Ton 90 Lds 270 Ton 16.9 29 26 916a Oct 2007 Corn silage 0-46-0 Surface broadcast Supp. P 73 Lbs 1,234 Lbs 16.9 0 34 06a Jun 2008 Corn silage 28-0-0 Surface band Supp. N 41 Gal 693 Gal 16.9 122 0 06a Oct 2008 Corn silage 0-46-0 Surface broadcast 1-yr P 73 Lbs 1,234 Lbs 16.9 0 34 06a Oct 2008 Corn silage Calf shed Flail spreader, Not incorporated Custom 16 Ton 90 Lds 270 Ton 16.9 29 26 916a Jun 2009 Corn silage 28-0-0 Surface band Supp. N 38 Gal 642 Gal 16.9 113 0 06a Oct 2009 Corn silage 0-46-0 Surface broadcast 1-yr P 73 Lbs 1,234 Lbs 16.9 0 34 06a Oct 2009 Corn silage Calf shed Flail spreader, Not incorporated Custom 16 Ton 90 Lds 270 Ton 16.9 29 26 916a Jun 2010 Corn silage 28-0-0 Surface band Supp. N 37 Gal 625 Gal 16.9 110 0 0
(1) Field – Field and subfield names (6.1(1), (2)).(2) App. Month – Calendar month and year in which the nutrient application will be made. Entered by the planner (Nutrient Management
panel).(3) Target Crop – Primary crop in the targeted crop year. MMP does not distinguish applications targeting different crops within the
same crop year.(4) Nutrient Source – For manure applications, the storage unit from which manure was applied; for fertilizer applications, the analysis
of the applied product (e.g. 82-0-0, 18-46-0, etc.) Entered by the planner (Nutrient Management panel or Fertilizer Application Editor dialog).
(5) Application Method – A description of the method of nutrient application. For manure applications, names the equipment used to apply the manure and how long until the manure will be incorporated, if at all; for fertilizer applications described the application method. Entered by planner (Nutrient Management panel or Fertilizer Application Editor dialog).
CNMP – Data and Calculations - 15 - Rev. 24-July-2009

(6) Rate Basis – Indicates the nutrient target for MMP-calculated application rates. Rates entered by the planner (Nutrient Management panel) will be designated as “Custom.” Fertilizer applications following other nutrient applications in the same year, also supplying the targeted nutrient are designated as supplemental.
(7) Rate/Acre – Manure or fertilizer application rate. This can be entered by the planner or calculated by MMP to target a specific nutrient amount or requirement (7). Rates calculated by MMP will never under-apply a targeted nutrient; MMP will always round up to the next applicable increment. For fertilizers, MMP will calculate to whole pounds or gallons of product per acre. For poultry litter MMP will calculate rates in 0.1 ton increments, 0.5 tons for other solid waste and 100 gallon increments for liquid waste. Calculated as:
Target nutrient amount per acre based on (6)÷ Available nutrient content per unit N availability per unit not listed in CNMP; 6.4(7), (8) for P and K
(8) Loads, Speed or Time – For manure applications with a conventional liquid or solid spreader, indicates the number of loads required to cover the field or empty the storage if not enough manure is on hand to finish the entire field. MMP calculates in 0.1 load increments and will not under-apply, as per (6). For irrigation systems, this is the amount of time required to apply based on the pump capacity of the system or the speed required for a hose pull or traveling gun to apply the given rate. For fertilizer applications, this column is left blank.
(9) Total Amount Applied – Total amount of material (fertilizer, manure, irrigation water, etc.) applied to the field. For conventional manure applications this is calculated as:
Number of loads (8)x Usable capacity of spreader not listed in CNMP
(10) Acres Covered – For fertilizer applications this is the area of the portion of the field covered by the applications (i.e. spreadable area, non-spreadable area or entire field). For manure applications, this is calculated as:
Total Amount Applied (9)÷ Rate/Acre (7)
Rounded to the nearest 0.1 acresThis result may be greater or less than the spreadable acres of the field if there is not sufficient manure available to cover the spreadable area or if rounding up to the nearest load increment in (8) results in over-application.
(11) Avail. N – First-year plant-available nitrogen from the application. For manure apps, calculated according to nutrient availability method specified by the state. Fertilizer nutrients are calculated as:
Application rate (7)x Product density reference value, liquids onlyx (Product analysis ÷ 100) (4)
(12) Avail P2O5 – First-year plant-available P2O5 from the application. For manure apps, calculated according to nutrient availability method specified by the state.
(13) Avail K2O – First-year plant-available K2O from the application. For manure apps, calculated according to nutrient availability method specified by the state.
CNMP – Data and Calculations - 16 - Rev. 24-July-2009
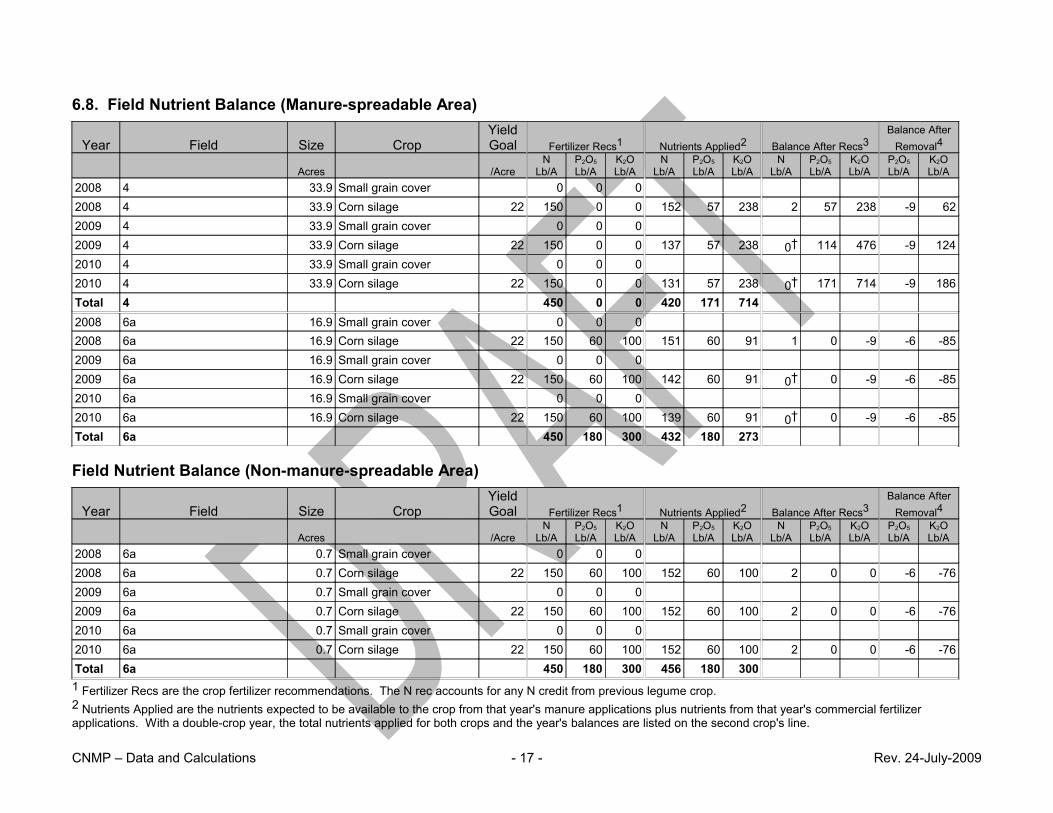
6.8. Field Nutrient Balance (Manure-spreadable Area)
Year Field Size CropYield Goal Fertilizer Recs1 Nutrients Applied2 Balance After Recs3
Balance After Removal4
Acres /AcreN
Lb/AP2O5
Lb/AK2OLb/A
NLb/A
P2O5
Lb/AK2OLb/A
NLb/A
P2O5
Lb/AK2OLb/A
P2O5
Lb/AK2OLb/A
2008 4 33.9 Small grain cover 0 0 02008 4 33.9 Corn silage 22 150 0 0 152 57 238 2 57 238 -9 622009 4 33.9 Small grain cover 0 0 02009 4 33.9 Corn silage 22 150 0 0 137 57 238 0† 114 476 -9 1242010 4 33.9 Small grain cover 0 0 02010 4 33.9 Corn silage 22 150 0 0 131 57 238 0† 171 714 -9 186Total 4 450 0 0 420 171 7142008 6a 16.9 Small grain cover 0 0 02008 6a 16.9 Corn silage 22 150 60 100 151 60 91 1 0 -9 -6 -852009 6a 16.9 Small grain cover 0 0 02009 6a 16.9 Corn silage 22 150 60 100 142 60 91 0† 0 -9 -6 -852010 6a 16.9 Small grain cover 0 0 02010 6a 16.9 Corn silage 22 150 60 100 139 60 91 0† 0 -9 -6 -85Total 6a 450 180 300 432 180 273
Field Nutrient Balance (Non-manure-spreadable Area)
Year Field Size CropYield Goal Fertilizer Recs1 Nutrients Applied2 Balance After Recs3
Balance After Removal4
Acres /AcreN
Lb/AP2O5
Lb/AK2OLb/A
NLb/A
P2O5
Lb/AK2OLb/A
NLb/A
P2O5
Lb/AK2OLb/A
P2O5
Lb/AK2OLb/A
2008 6a 0.7 Small grain cover 0 0 02008 6a 0.7 Corn silage 22 150 60 100 152 60 100 2 0 0 -6 -762009 6a 0.7 Small grain cover 0 0 02009 6a 0.7 Corn silage 22 150 60 100 152 60 100 2 0 0 -6 -762010 6a 0.7 Small grain cover 0 0 02010 6a 0.7 Corn silage 22 150 60 100 152 60 100 2 0 0 -6 -76Total 6a 450 180 300 456 180 3001 Fertilizer Recs are the crop fertilizer recommendations. The N rec accounts for any N credit from previous legume crop.2 Nutrients Applied are the nutrients expected to be available to the crop from that year's manure applications plus nutrients from that year's commercial fertilizer applications. With a double-crop year, the total nutrients applied for both crops and the year's balances are listed on the second crop's line.
CNMP – Data and Calculations - 17 - Rev. 24-July-2009
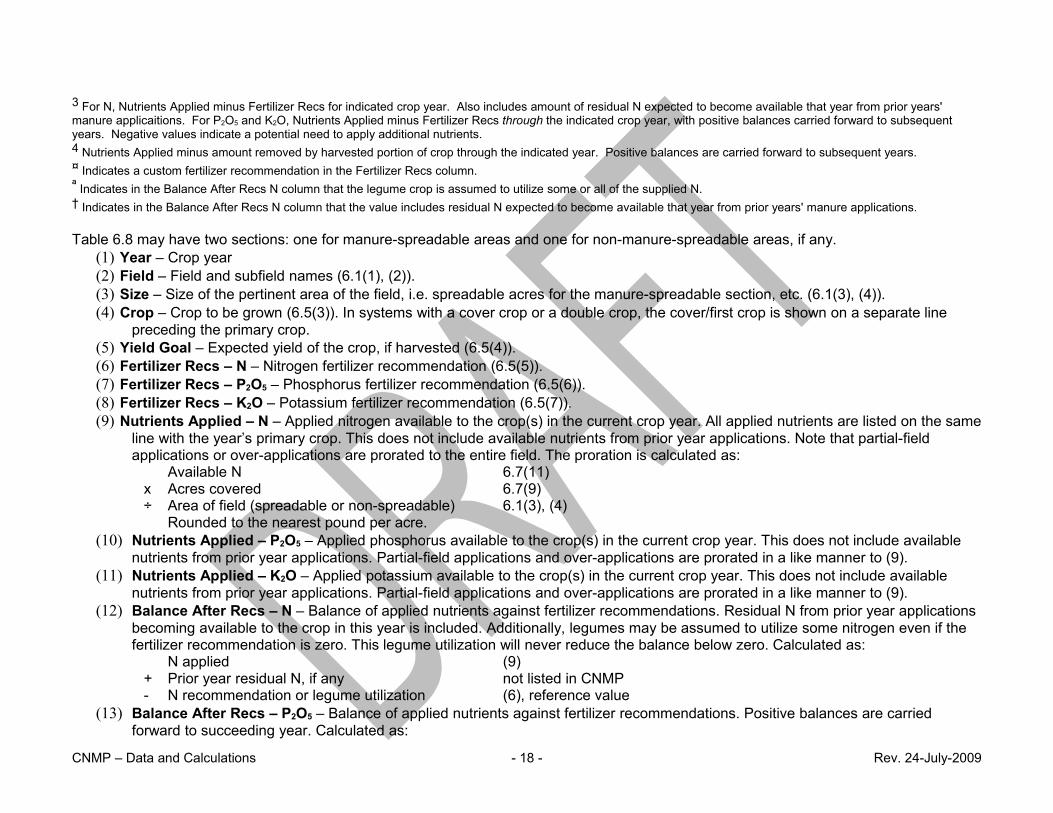
3 For N, Nutrients Applied minus Fertilizer Recs for indicated crop year. Also includes amount of residual N expected to become available that year from prior years' manure applicaitions. For P2O5 and K2O, Nutrients Applied minus Fertilizer Recs through the indicated crop year, with positive balances carried forward to subsequent years. Negative values indicate a potential need to apply additional nutrients.4 Nutrients Applied minus amount removed by harvested portion of crop through the indicated year. Positive balances are carried forward to subsequent years.¤ Indicates a custom fertilizer recommendation in the Fertilizer Recs column.ª Indicates in the Balance After Recs N column that the legume crop is assumed to utilize some or all of the supplied N.† Indicates in the Balance After Recs N column that the value includes residual N expected to become available that year from prior years' manure applications.
Table 6.8 may have two sections: one for manure-spreadable areas and one for non-manure-spreadable areas, if any.(1) Year – Crop year(2) Field – Field and subfield names (6.1(1), (2)).(3) Size – Size of the pertinent area of the field, i.e. spreadable acres for the manure-spreadable section, etc. (6.1(3), (4)).(4) Crop – Crop to be grown (6.5(3)). In systems with a cover crop or a double crop, the cover/first crop is shown on a separate line
preceding the primary crop.(5) Yield Goal – Expected yield of the crop, if harvested (6.5(4)).(6) Fertilizer Recs – N – Nitrogen fertilizer recommendation (6.5(5)).(7) Fertilizer Recs – P2O5 – Phosphorus fertilizer recommendation (6.5(6)).(8) Fertilizer Recs – K2O – Potassium fertilizer recommendation (6.5(7)).(9) Nutrients Applied – N – Applied nitrogen available to the crop(s) in the current crop year. All applied nutrients are listed on the same
line with the year’s primary crop. This does not include available nutrients from prior year applications. Note that partial-field applications or over-applications are prorated to the entire field. The proration is calculated as:
Available N 6.7(11)x Acres covered 6.7(9)÷ Area of field (spreadable or non-spreadable) 6.1(3), (4)
Rounded to the nearest pound per acre.(10) Nutrients Applied – P2O5 – Applied phosphorus available to the crop(s) in the current crop year. This does not include available
nutrients from prior year applications. Partial-field applications and over-applications are prorated in a like manner to (9).(11) Nutrients Applied – K2O – Applied potassium available to the crop(s) in the current crop year. This does not include available
nutrients from prior year applications. Partial-field applications and over-applications are prorated in a like manner to (9).(12) Balance After Recs – N – Balance of applied nutrients against fertilizer recommendations. Residual N from prior year applications
becoming available to the crop in this year is included. Additionally, legumes may be assumed to utilize some nitrogen even if the fertilizer recommendation is zero. This legume utilization will never reduce the balance below zero. Calculated as:
N applied (9)+ Prior year residual N, if any not listed in CNMP- N recommendation or legume utilization (6), reference value
(13) Balance After Recs – P2O5 – Balance of applied nutrients against fertilizer recommendations. Positive balances are carried forward to succeeding year. Calculated as:
CNMP – Data and Calculations - 18 - Rev. 24-July-2009
Previous year positive balance, if any line above+ P2O5 applied (10)- P2O5 recommendation (7)
(14) Balance After Recs – K2O – Balance of applied nutrients against fertilizer recommendations. Positive balances are carried forward to succeeding year. Calculated as:
Previous year positive balance, if any line above+ K2O applied (11)- K2O recommendation (8)
(15) Balance After Removal – P2O5 – Balance of applied nutrients against nutrients removed by the crop. Positive balances are carried forward to succeeding year. Calculated as:
Previous year positive balance, if any line above+ P2O5 applied (10)- P2O5 removed 6.5(9)
(16) Balance After Removal – K2O – Balance of applied nutrients against nutrients removed by the crop. Positive balances are carried forward to succeeding year. Calculated as:
Previous year positive balance, if any line above+ K2O applied (11)- K2O removed 6.5(10)
CNMP – Data and Calculations - 19 - Rev. 24-July-2009

6.9. Manure Inventory Annual SummaryManure Source Plan Period On Hand
at Start ofPeriod
TotalGenerated
TotalImported
TotalTrans-
ferred In
TotalApplied
TotalExported
TotalTrans-
ferred Out
On Handat End of
Period
Units
Holding pond Sep '07 - Aug '08 450,000 1,244,000 0 0 1,234,600 0 0 459,400 GalCalf shed Sep '07 - Aug '08 225 270 0 0 270 0 0 225 TonHolding pond Sep '08 - Aug '09 459,400 1,244,000 0 0 1,234,400 0 0 469,000 GalCalf shed Sep '08 - Aug '09 225 270 0 0 270 0 0 225 TonHolding pond Sep '09 - Aug '10 469,000 1,244,000 0 0 1,232,200 0 0 480,800 GalCalf shed Sep '09 - Aug '10 225 270 0 0 270 0 0 225 Ton
(1) Manure Source – Manure storage unit name (2.3(1)).(2) Plan Period – Twelve-month period starting with beginning of the plan.(3) On Hand at Start of Period – The amount of manure in storage at the beginning of the period. For the first year this number is
entered by the planner (Storage panel). Thereafter, it is equal to the amount on hand at the end of the previous period (line above (10)).
(4) Total Generated – Amount of manure produced during the plan period that is directed to this storage unit (2.3(4)).(5) Total Imported – Amount of manure imported from external operations to this storage unit (see table 2.7).(6) Total Transferred In – Amount of manure transferred to this storage unit from other units within the operation (see table 2.8).(7) Total Applied – Amount of manure applied to fields from this storage unit (see table 6.7).(8) Total Exported – Amount of manure exported to external operations from this storage unit (see table 2.6).(9) Total Transferred Out – Amount of manure transferred to other storage units within the operation (see table 2.8).(10) On Hand at End of Period – Amount of manure in the storage unit at the end of the plan period. Calculated as:
On hand at start of period (3)+ Additions (generated, imported or transferred) (4), (5), (6)- Reductions (applied, exported or transferred) (7), (8), (9)
(11) Units – Unit of measurement for the storage unit. Tons for solid manure storage, gals. for liquid.
CNMP – Data and Calculations - 20 - Rev. 24-July-2009

6.10. Fertilizer Material Annual SummaryProduct Analysis Plan Period Product
NeededSep - Dec
ProductNeeded
Jan - Aug
TotalProductNeeded
Units
0-46-0 Sep '07 - Aug '08 13,116 0 13,116 Lbs0-0-60 Sep '07 - Aug '08 17,845 0 17,845 Lbs28-0-0 Sep '07 - Aug '08 0 5,975 5,975 Gal33-0-0 Sep '07 - Aug '08 4,545 35,824 40,369 Lbs0-46-0 Sep '08 - Aug '09 12,252 0 12,252 Lbs0-0-60 Sep '08 - Aug '09 16,252 0 16,252 Lbs28-0-0 Sep '08 - Aug '09 0 5,212 5,212 Gal33-0-0 Sep '08 - Aug '09 4,545 37,026 41,571 Lbs0-46-0 Sep '09 - Aug '10 12,421 0 12,421 Lbs0-0-60 Sep '09 - Aug '10 15,857 0 15,857 Lbs28-0-0 Sep '09 - Aug '10 0 5,345 5,345 Gal33-0-0 Sep '09 - Aug '10 4,545 36,795 41,340 Lbs
(1) Product Analysis – Nutrient analysis of the fertilizer product selected by the planner (Fertilizer Application Editor).(2) Plan Period – Twelve-month period starting with beginning of the plan.(3) Product Needed – Amount of fertilizer product used during the given season. This will be either two or three columns in the table,
depending on the starting month of the plan.(4) Total Product Needed – Amount of fertilizer product used during the plan year. Calculated as the sum of value sum columns under
(3).(5) Units – Unit of measurement for the indicated storage product. Lbs for solids and gaseous products, gals. for liquid products.
CNMP – Data and Calculations - 21 - Rev. 24-July-2009

6.11. Whole-farm Nutrient BalanceN
(Lbs)P2O5
(Lbs)K2O(Lbs)
Total Manure Nutrients on Hand at Start of Plan1 5,512 1,710 6,908
Total Manure Nutrients Collected2 40,965 12,492 51,267
Total Manure Nutrients Imported3 0 0 0
Total Manure Nutrients Exported4 0 0 0
Total Manure Nutrients on Hand at End of Plan5 5,820 1,802 7,292
Total Manure Nutrients Applied6 40,661 12,422 50,928
Available Manure Nutrients Applied7 20,574 12,422 50,928
Commercial Fertilizer Nutrients Applied8 14,458 1,724 0
Available Nutrients Applied9 35,032 14,146 50,928
Nutrient Utilization Potential10 34,920 15,365 40,973
Nutrient Balance of Spreadable Acres11 112 -1,219 9,955
Average Nutrient Balance per Spreadable Acre per Year12* 0 -5 43
* Non-trivial, positive values for N indicate that the plan was not properly developed. Negative values for N indicate additional nutrient utilization potential which may or may not be intentional. For example, plans that include legume crops often will not utilize the full N utilization potential for legume crops if manure can be applied to non-legume crops that require N for optimum yield. Positive values for P2O5 and/or K2O do not necessarily indicate that the plan was not developed properly. For example, producers may be allowed to apply N-based application rates of manure to fields with low soil test P values or fields with a low potential P-loss risk based on the risk assessment tool used by the state. Negative values for P2O5 and K2O indicate that planned applications to some fields are less than crop removal rates.
Note that table 6.11 has two versions: one for spreadable area, as listed below, and one for non-spreadable areas, which omits the manure-related information, but is otherwise identical in content and calculation.(1) Total Manure Nutrients on Hand at Start of Plan – Total manure nutrients present in storage units at the start of the plan.
Calculated as the sum across all storage units of:Manure on hand at start 6.9(3)
x Total nutrient content 6.4(3), (5), (6)(2) Total Manure Nutrients Collected – Total manure nutrients collected on the farm. Calculated as the sum across all storage units of:
Manure generated 6.9(4)x Total nutrient content 6.4(3), (5), (6)
(3) Total Manure Nutrients Imported – Total manure nutrients imported onto the farm. Calculated as the sum across all storage units of:
Manure imported 6.9(5)
CNMP – Data and Calculations - 22 - Rev. 24-July-2009
x Total nutrient content 6.4(3), (5), (6)(4) Total Manure Nutrients Exported – Total manure nutrients exported from the farm to external operation(s). Calculated as the sum
across all storage units of:Manure exported 6.9(8)
x Total nutrient content 6.4(3), (5), (6)(5) Total Manure Nutrients on Hand at End of Plan – Total manure nutrients present in storage units at the end of the plan. Calculated
as the sum across all storage units of:Manure on hand at end 6.9(10)
x Total nutrient content 6.4(3), (5), (6)(6) Total Manure Nutrients Applied – Total nutrients in land-applied manure. Losses due to rate, timing and method of application are
not included. Calculated as the sum across all manure applications of:Application rate 6.7(7)
x Total nutrient content 6.4(3), (5), (6)x Area covered 6.7(10)
(7) Available Manure Nutrients Applied – Available manure nutrients applied on the farm based on rate, time and method of application. For nitrogen, this also includes residual N expected to become available prior to the end of the plan. Calculated as the sum across all manure applications of:
Available nutrient rate 6.7(11), (12), (13)x Area covered 6.7(10)
(8) Commercial Fertilizer Nutrients Applied – Nutrients applied as commercial fertilizers to spreadable areas of the fields. Calculated as the sum across all fertilizer applications of:
Available nutrient rate 6.7(11), (12), (13)x Area covered 6.7(10)
(9) Available Nutrients Applied – Applied nutrients available to the crops from all sources. Calculated as:Available manure nutrients (7)
+ Fertilizer nutrients (8)(10) Nutrient Utilization Potential – Nutrient utilization potential of crops grown. For N the value is generally based on crop N
recommendation for non-legume crops and crop N uptake or other state-imposed limit for N application rates for legumes. P2O5 and K2O values generally are based on the greater of fertilizer recommendation or crop removal.
(11) Nutrient Balance of Spreadable Acres – Balance of available nutrients against crop utilization potential. Positive values indicate over-application, and negative values indicate additional nutrient utilization potential. Calculated as:
Available nutrients applied (9)- Utilization potential (10)
(12) Average Nutrient Balance per Spreadable Acre per Year – Average per acre nutrient balance over the length of the plan. Calculated as:
Nutrient balance (11)÷ (Sum of spreadable acreage 6.1(4)
CNMP – Data and Calculations - 23 - Rev. 24-July-2009

x Number of years in plan) see page 1 of CNMP
CNMP – Data and Calculations - 24 - Rev. 24-July-2009