Embed Size (px)
Citation preview

Comprehensive PerformanceReport
December 31, 2020
Minnesota State Board of InvestmentQuarter Ending December 31, 2020
Quarterly Report

The Minnesota State Board of Investment is responsible for the investment management of various retirement funds, trust funds and cash accounts.
Combined Funds
The Combined Funds represent the assets for both the active and retired public employees in the statewide retirement systems, the biggest of which are the PublicEmployees Retirement Association (PERA), the Teachers Retirement Association (TRA), and the Minnesota State Retirement System (MSRS). The SBI commingles theassets of these plans into the Combined Funds to capture investment efficiencies. All assets in the Combined Funds are managed externally by investment managementfirms retained by contract.
Fire Plans + Other Retirement Plans
Fire Plans and Other Retirement Plans include assets from volunteer fire relief plans and other public retirement plans with authority to invest with the SBI, if they sochoose. Fire Plans that are not eligible to be consolidated with Public Employees Retirement Association (PERA) or elect not to be administered by PERA may investtheir assets with the SBI using the same asset pools as the Combined Funds. The Statewide Volunteer Firefighter Retirement Plan is administered by PERA and has itsown investment vehicle called the Volunteer Firefighter Account.
Participant Directed Investment Program
The Participant Directed Investment Program (PDIP) provides investment vehicles for a variety of retirement or other tax-advantaged savings plans. Investment goalsamong the PDIP’s many participants are varied. In order to meet the variety of goals, participants may allocate their investments among one or more accounts that areappropriate for their needs within statutory requirements and rules established by the participating organizations.
Non-Retirement
The Non-Retirement Funds are funds established by the State of Minnesota and other government entities for various purposes which include the benefit of publicschools, the environment, other post-employment benefits, workers compensation insurance, and other purposes.
State Cash
The State Cash accounts are cash balances of state government funds including the State General Fund. Most accounts are invested by SBI staff through a short-termpooled fund referred to as the Treasurer's Cash Pool. It contains the cash balances of special or dedicated accounts necessary for the operation of certain State agenciesand non-dedicated cash in the State Treasury. Because of special legal restrictions, a small number of cash accounts cannot be commingled.
Minnesota State Board of InvestmentQuarter Ending December 31, 2020
Description of SBI Investment Programs
Page 2
State Cash Accounts
12%
Non-Retirement Funds 4%
Participant Directed
Investment Programs
11%
Fire Plans and Other Retirement
1% Combined Funds 72%
State Cash Accounts
12%
Non-Retirement Funds 4%
Participant Directed
Investment Programs
11%
Fire Plans and Other Retirement
1% Combined Funds 72%
$ Millions
COMBINED FUNDS $82,140
FIRE PLANS + OTHER RETIREMENT 956
PARTICIPANT DIRECTED INVESTMENT PROGRAMS 12,782
State Deferred Compensation Plan 8,917
Health Care Savings Plan 1,486
Unclassified Employees Retirement Plan 373
Hennepin County Supplemental Retirement Plan 180
PERA Defined Contribution Plan 93
Minnesota College Savings Plan 1,717
Minnesota Achieve a Better Life Experience 17
NON-RETIREMENT FUNDS 4,834
Assigned Risk Plan 299
Permanent School Fund 1,814
Environmental Trust Fund 1,490
Miscellaneous Trust Funds 322
Other Postemployment Benefits Accounts 790
STATE CASH ACCOUNTS 13,655
Invested Treasurer's Cash 13,582
Other State Cash Accounts 74
TOTAL SBI AUM 114,367
Note: Differentials within column amounts may occur due to rounding
Minnesota State Board of InvestmentQuarter Ending December 31, 2020
Funds Under Management
Closed Landfill Investment Fund 119
Page 3

Table of Contents
5Combined Funds
Public Equity (Domestic, International, Global) Fixed Income (Core/Core Plus, Return Seeking, Treasuries, Laddered Bond + Cash)Private Markets (Invested, Uninvested)
Participant Directed Investment Program Supplemental Investment Fund
Deferred Compensation Program Minnesota
Minnesota College Savings Plan
Achieve a Better Life Experience
Non-Retirement Funds
Assigned Risk Plan
Permanent School Fund
Environmental Trust Fund
Closed Landfill Investment Fund
Non-Retirement Managers
State Cash Accounts
Invested Treasurer's Cash
Other State Cash Accounts
Addendum
Performance Reporting LegendCusip
Manager Level DataAggregate Level DataSub-Asset Class Level DataAsset Class Level Data
Note:
Throughout this report performance is calculated net of investment managementfees, aggregates include terminated managers, and returns for all periods greaterthan one year are annualized. Inception Date and Since Inception Returns refer tothe date of retention by the SBI. FYTD refers to the return generated by an accountsince July 1 of the most recent year. For historical benchmark details, please referto the addendum of this report. Inception to date return information is included formanager accounts and total asset class but not other aggregates becuase of portfoliomanagement decisions to group managers in different aggregates over time.
Minnesota State Board of InvestmentQuarter Ending December 31, 2020
Quarterly Report
Page 4
77
93
101
103
Combined FundsDecember 31, 2020
Minnesota State Board of InvestmentQuarter Ending December 31, 2020
Quarterly Report
Page 5

COMBINED FUNDS COMBINED FUNDS - COMPOSITE INDEX
3 Month 1 Year 3 Year 5 Year 10 Year 20 year 30 year
0.0
2.0
4.0
6.0
8.0
10.0
12.0
14.0
Re
turn
COMBINED FUNDS COMBINED FUNDS - COMPOSITE INDEX
3 Month 1 Year 3 Year 5 Year 10 Year 20 year 30 year
0.0
2.0
4.0
6.0
8.0
10.0
12.0
14.0
Re
turn
The change in market value of the Combined Funds since the end of last quarter is due tonet contributions and investment returns.
Performance (Net of Fees)
The Combined Funds' performance is evaluated relative to a composite of public marketindex and private market investment returns. The Composite performance is calculated bymultiplying the beginning of month Composite weights and the monthly returns of theasset class benchmarks.
Asset Growth
De
c-0
1
De
c-0
2
De
c-0
3
De
c-0
4
De
c-0
5
De
c-0
6
De
c-0
7
De
c-0
8
De
c-0
9
De
c-1
0
De
c-1
1
De
c-1
2
De
c-1
3
De
c-1
4
De
c-1
5
De
c-1
6
De
c-1
7
De
c-1
8
De
c-1
9
De
c-2
0
2 0
3 0
4 0
5 0
6 0
7 0
8 0
Bil
lio
ns
Asset Growth
De
c-0
1
De
c-0
2
De
c-0
3
De
c-0
4
De
c-0
5
De
c-0
6
De
c-0
7
De
c-0
8
De
c-0
9
De
c-1
0
De
c-1
1
De
c-1
2
De
c-1
3
De
c-1
4
De
c-1
5
De
c-1
6
De
c-1
7
De
c-1
8
De
c-1
9
De
c-2
0
2 0
3 0
4 0
5 0
6 0
7 0
8 0
Bil
lio
ns
Qtr FYTD 1 Yr 3 Yr 5 Yr 10 Yr 20 Yr 30 Yr
COMBINED FUNDS 10.8% 17.6% 14.7% 10.2% 11.2% 9.9% 7.3% 9.3%
COMBINED FUNDS -COMPOSITE INDEX
10.4 16.9 13.7 9.8 11.0 9.6 7.1 9.0
Excess 0.3 0.7 1.0 0.4 0.2 0.3 0.2 0.3
Combined Funds Change in Market Value ($Millions)
One Quarter
COMBINED FUNDS
Beginning Market Value $74,762
Net Contributions -611
Investment Return 7,990
Ending Market Value 82,140
Minnesota State Board of InvestmentQuarter Ending December 31, 2020Combined Funds
Combined Funds Summary
Page 6

(Millions) Actual Mix
Public Equity $42,990 52.3%
Total Fixed Income 18,962 23.1
Private Markets - Total 20,187 24.6
Private Markets - Invested 12,737 15.5
Private Markets - Uninvested 7,450 9.1
TOTAL 82,140 100.0
Private Markets
Uninvested9.1%
Private Markets
Invested 15.5%
Total Fixed
Income 23.1%
Public Equity 52.3%
Private Markets
Uninvested9.1%
Private Markets
Invested 15.5%
Total Fixed
Income 23.1%
Public Equity 52.3%
Asset Mix
The Combined Funds actual asset mix relative to the Strategic Asset Allocation PolicyTarget is shown below. Any uninvested portion of the Private Markets allocation is held inPublic Equity.
Policy Target
Minnesota State Board of InvestmentQuarter Ending December 31, 2020Combined Funds
Combined Funds Summary
Private Markets
Invested 15.8%
Total Fixed
Income 25.0%
Public Equity 59.2%
Private Markets
Invested 15.8%
Total Fixed
Income 25.0%
Public Equity 59.2%
Composite Index Comparison
The Combined Funds Composite is set as the Strategic Asset Allocation Policy Target. Asset class weights for Private Markets - Invested and Private Markets - Uninvested are reset at the start of each month. The Combined Funds Composite weighting shown below is as of the first day of the quarter.
Market Index
Public Equity BenchmarkTotal Fixed Income Benchmark
Private MarketsS&P 500
Policy Weight
Public Equity 59.2%
Total Fixed Income 25.0
Private Markets - Invested 15.8
Private Markets - Uninvested 0.0
Note:On 12/1/2020 the composite index included a weighting to Private Markets - Uninvested of 9.2%. Prior to 12/1/2020 the uninvested portion of private markets was allocated to public equity.
50.0%
25.0
25.0
Page 7

Note:Prior to 6/30/16 the returns of Domestic and International Equity were not reported as a total Public Equity return. For additional information regarding historical asset class performance and benchmarks,please refer to the Combined Funds Performance Report.
Global Equity 1.1 1.3
MSCI AC WORLD INDEXNET
Excess
Public Equity
The Combined Funds Public Equity includes Domestic Equity, International Equity and Global Equity.The Public Equity benchmark is 67% Russell 3000 and 33% MSCI ACWI ex US (net).
Minnesota State Board of InvestmentQuarter Ending December 31, 2020Combined Funds
Combined Funds Asset Class Performance Summary
Market Value Actual Weight Policy Weight Last Qtr FYTD 1 Year 3 Year 5 Year 10 Year 20 Year 30 Year
Public Equity $43.0 52.3% 50.0% 15.9% 25.6% 18.3% 11.5% 13.3% 11.5% 7.1% 10.0%
Public Equity Benchmark
Excess
Domestic Equity 28.0 34.1
Domestic Equity Benchmark
Excess
International Equity 13.9 16.9
International Equity Benchmark
Excess
0.0
33.5
16.5
15.8 25.1 17.4 11.2
0.1 0.5 1.0 0.3
15.4 26.0 21.7 14.6 15.3 13.8 7.7 10.6
15.2 25.6 20.8 14.4 15.4 13.8 7.8 10.7
0.2 0.4 0.9 0.2 -0.1 0.0 -0.1 -0.1
16.9 24.7 11.3 5.2 8.8 5.4 5.5
17.1 24.2 10.5 4.8 8.9 4.9 5.2
-0.1 0.6 0.8 0.4 -0.1 0.5 0.3
Page 8

Note: Since 12/1/2020 the Total Fixed Income includes allocations to Core/Core Plus Bonds, Return Seeking Bonds, Treasuries and Laddered Bond + Cash. From 7/1/2020 to 11/30/2020 Total Fixed Income was Core Bonds, Treasuries and Cash. From 2/1/2018-6/30/20 Total Fixed Income was Core Bonds and Treasuries. Prior to 2/1/2018, Total Fixed Income was Core Bonds. For additional information regarding historical asset class performance and benchmarks, please refer to the Combined Funds Performance Report.
Market Value Actual Weight Policy Weight Last Qtr FYTD 1 Year 3 Year 5 Year 10 Year 20 Year 30 Year
Total Fixed Income $19.0 23.1% 25.0% 0.1% 0.8% 11.2% 7.1% 5.8% 4.8% 5.4% 6.4%
Total Fixed Income Benchmark
Excess
Core/Core Plus 4.2 5.1 1.9 3.2 9.7 6.4 5.4 4.6 5.3 6.3
Fixed Income Benchmark 0.7 1.3 7.5 5.3 4.4 3.8 4.8 5.9
Excess 1.2 1.9 2.2 1.0 0.9 0.7 0.5 0.5
Return Seeking Fixed Income 3.5 4.3
BBG BARC Agg Bd
Excess
Treasury Protection 7.6 9.3 -1.7 -1.3 12.7 8.0
BBG BARC 5Y + Us Tsy Idx -1.9 -1.6 12.8 7.6
Excess 0.2 0.3 -0.2 0.4
Laddered Bond + Cash 3.6 4.4 0.0 0.1 0.6 1.6 1.3 0.8 1.8 3.4
ICE BofA US 3-MonthTreasury Bill
0.0 0.1 0.7 1.6 1.2 0.6 1.5 2.7
Excess 0.0 0.0 -0.1 -0.0 0.1 0.2 0.3 0.7
Total Fixed Income
The Combined Funds Fixed Income program includes Core/Core Plus, Return Seeking Fixed Income, Treasuries and Laddered Bond + Cash.The Total Fixed Income benchmark is 40% Bloomberg Barclays U.S. Aggregate Index/ 40% Bloomberg Barclays Treasury 5+ Years Index/ 20% ICE BofA US 3-Month Treasury Bill.
Minnesota State Board of InvestmentQuarter Ending December 31, 2020Combined Funds
Combined Funds Asset Class Performance Summary
5.0
5.0
10.0
5.0
10.3-0.5
0.5
-0.1
0.9 1.0
Page 9

Private MarketsLast Qtr FYTD 1 Year 3 Year 5 Year 10 Year 20 Year 25 year 30 Year
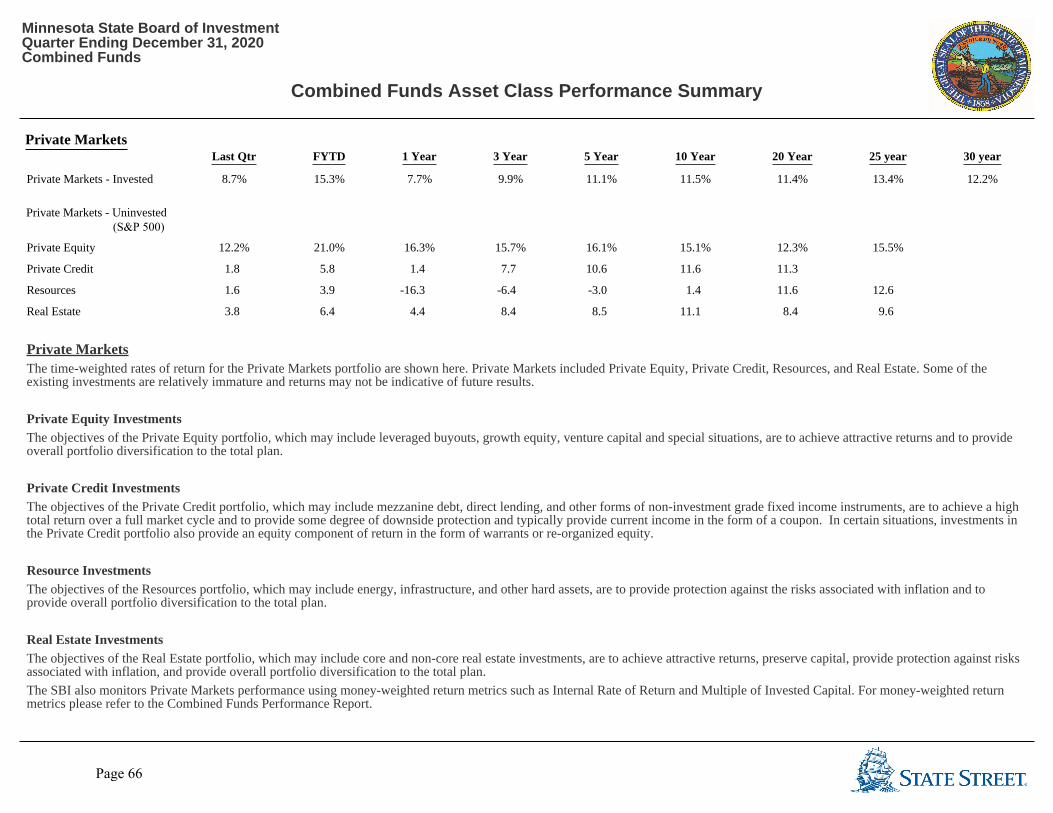
Private Markets - Invested 8.7% 15.3% 7.7% 9.9% 11.1% 11.5% 11.4% 13.4% 12.2%
Private Markets
The time-weighted rates of return for the Private Markets portfolio are shown here. Private Markets included Private Equity, Private Credit, Resources, and Real Estate. Some of theexisting investments are relatively immature and returns may not be indicative of future results.
Private Equity Investments
The objectives of the Private Equity portfolio, which may include leveraged buyouts, growth equity, venture capital and special situations, are to achieve attractive returns and to provideoverall portfolio diversification to the total plan.
Private Credit Investments
The objectives of the Private Credit portfolio, which may include mezzanine debt, direct lending, and other forms of non-investment grade fixed income instruments, are to achieve a hightotal return over a full market cycle and to provide some degree of downside protection and typically provide current income in the form of a coupon. In certain situations, investments inthe Private Credit portfolio also provide an equity component of return in the form of warrants or re-organized equity.
Resource Investments
The objectives of the Resources portfolio, which may include energy, infrastructure, and other hard assets, are to provide protection against the risks associated with inflation and toprovide overall portfolio diversification to the total plan.
Real Estate Investments
The objectives of the Real Estate portfolio, which may include core and non-core real estate investments, are to achieve attractive returns, preserve capital, provide protection against risksassociated with inflation, and provide overall portfolio diversification to the total plan.The SBI also monitors Private Markets performance using money-weighted return metrics such as Internal Rate of Return and Multiple of Invested Capital. For money-weighted returnmetrics please refer to the Combined Funds Performance Report.
Last Qtr FYTD 1 Year 3 Year 5 Year 10 Year 20 Year 25 year 30 year
Private Equity 12.2% 21.0% 16.3% 15.7% 16.1% 15.1% 12.3% 15.5%
Private Credit 1.8 5.8 1.4 7.7 10.6 11.6 11.3
Resources 1.6 3.9 -16.3 -6.4 -3.0 1.4 11.6 12.6
Real Estate 3.8 6.4 4.4 8.4 8.5 11.1 8.4 9.6
Minnesota State Board of InvestmentQuarter Ending December 31, 2020Combined Funds
Combined Funds Asset Class Performance Summary
Private Markets - Uninvested (S&P 500)
Page 10

Asset Class & Manager PerformanceDecember 31, 2020
The assets of the Combined Funds are allocated to public equity, fixed income, private markets, and cash. Each asset class may be further differentiated bygeography, management style, and/or strategy. Managers are hired to manage the assets accordingly. This diversification is intended to reduce widefluctuations in investment returns on a year-to-year basis and enhances the Funds' ability to meet or exceed the actuarial return target over the long-term.
The Combined Funds consist of the assets of active employees and retired members of the statewide retirement plans. The SBI commingles the assets ofthese plans into the Combined Funds to capture investment efficiencies. This sharing is accomplished by grouping managers by asset class, geography, andmanagement style, into several Investment Pools. The individual funds participate in the Investment Pools by purchasing units which function much like theshares of a mutual fund.
While the vast majority of the units of these pools are owned by the Combined Funds, the Supplemental Investment Fund also owns units of these pools.The Supplemental Investment Funds are mutual fund-like investment vehicles which are used by investors in the Participant Directed Investment Program.Please refer to the Participant Directed Investment Program report for more information.
The performance information presented on the following pages for Public Equity and Fixed Income includes both the Combined Funds and SupplementalInvestment Fund. The Private Markets is Combined Funds only. All assets in the Combined Funds are managed externally by investment management firmsretained by contract.
Minnesota State Board of InvestmentQuarter Ending December 31, 2020
Quarterly Report
Page 11

This page intentionally left blank.
Page 12

Public Equity - Domestic December 31, 2020
Minnesota State Board of InvestmentQuarter Ending December 31, 2020
Page 13

Ending Market Value Portfolio Weight Last Qtr Fiscal YTD 1 Year 3 Year 5 Year 10 Year Since Inception Inception Date
Total Domestic EquityACTIVE DOMESTIC EQUITYAGGREGATE (1)
$4,151,773,056 14.5% 24.9% 35.1% 27.3% 14.9% 15.2% 13.3%
Active Domestic EquityBenchmark
22.8 31.6 19.8 12.2 14.1 12.8
Excess 2.2 3.5 7.5 2.7 1.1 0.5
SEMI PASSIVE DOMESTICEQUITY AGGREGATE (2)
3,026,841,988 10.6 13.0 23.6 21.0 14.6 15.4 14.2
Semi Passive Domestic EquityBenchmark
13.7 24.5 21.0 14.8 15.6 14.0
Excess -0.7 -0.8 0.0 -0.2 -0.2 0.2
PASSIVE DOMESTIC EQUITYAGGREGATE (3)
21,494,553,038 75.0 14.0 24.7 20.8 14.6 15.5 13.8
Passive Domestic EquityBenchmark
14.0 24.7 20.8 14.6 15.5 13.8
Excess 0.0 0.0 0.0 -0.0 -0.0 -0.0
TRANSITION AGGREGATEDOMESTIC EQUITY (4)
659,656 0.0
(1) The Active Domestic Equity Benchmark is a weighted composite each of the individual active domestic equity manager’s benchmarks.
(2) The current Semi-Passive Domestic Equity Benchmark is the Russell 1000 index.
(3) The current Passive Domestic Equity Benchmark is a weighted average of the Russell 1000, Russell 2000 and Russell 3000.
(4) The Transition Domestic Equity Aggregate contains Domestic Equity securities that are being transitioned to a different manager.
(5) Since 12/1/20 the Domestic Equity Benchmark is the Russell 3000.
Note: All aggregates include the performance of terminated managers. For historical benchmark details please refer to the addendum of this report.
Ending Market Value Portfolio Weight 1 Qtr Fiscal YTD 1 Year 3 Year 5 Year 10 Year Since Inception Inception Date
TOTAL DOMESTIC EQUITY (5) 28,673,827,739 100.0 15.4 26.0 21.7 14.7 15.3 13.8 10.8 01/1984
Domestic Equity Benchmark 15.2 25.6 20.8 14.4 15.4 13.8 11.0 01/1984
Excess 0.2 0.4 0.9 0.2 -0.1 0.0 -0.2
Minnesota State Board of InvestmentQuarter Ending December 31, 2020Domestic Equity Managers
Page 14
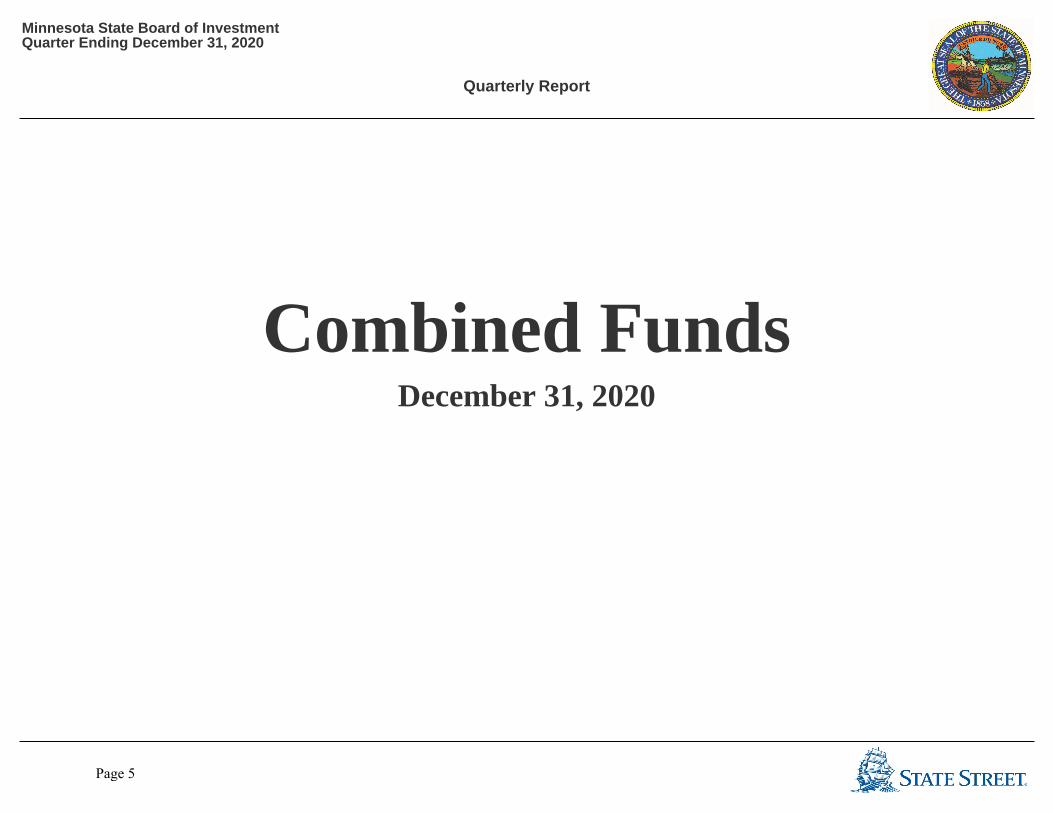
2019 Calendar Return 2018 Calendar Return 2017 Calendar Return 2016 Calendar Return 2015 Calendar Return
Total Domestic EquityACTIVE DOMESTIC EQUITYAGGREGATE (1)
27.6% -6.5% 20.6% 10.9% -0.4%
Active Domestic EquityBenchmark
28.2 -8.0 18.3 15.7 -0.6
Excess -0.6 1.4 2.3 -4.8 0.3
SEMI PASSIVE DOMESTICEQUITY AGGREGATE (2)
30.9 -4.9 22.5 11.1 0.5
Semi Passive Domestic EquityBenchmark
31.4 -4.8 21.7 12.1 0.9
Excess -0.5 -0.1 0.8 -1.0 -0.4
PASSIVE DOMESTIC EQUITYAGGREGATE (3)
31.3 -5.0 21.3 12.6 0.5
Passive Domestic EquityBenchmark
31.3 -5.0 21.5 12.5 0.5
Excess 0.0 -0.0 -0.2 0.1 0.0
TRANSITION AGGREGATEDOMESTIC EQUITY (4)
(1) The Active Domestic Equity Benchmark is a weighted composite each of the individual active domestic equity manager’s benchmarks.
(2) The current Semi-Passive Domestic Equity Benchmark is the Russell 1000 index.
(3) The current Passive Domestic Equity Benchmark is a weighted average of the Russell 1000, Russell 2000 and Russell 3000.
(4) The Transition Domestic Equity Aggregate contains Domestic Equity securities that are being transitioned to a different manager.
(5) Since 12/1/20 the Domestic Equity Benchmark is the Russell 3000.
Note: All aggregates include the performance of terminated managers. For historical benchmark details please refer to the addendum of this report.
2019 Calendar Return 2018 Calendar Return 2017 Calendar Return 2016 Calendar Return 2015 Calendar Return
TOTAL DOMESTIC EQUITY (5) 30.7% -5.3% 21.4% 11.5 0.3
Domestic Equity Benchmark 30.8% -5.2% 21.1% 12.7 0.5
Excess -0.1% -0.0% 0.2% -1.3 -0.2
Minnesota State Board of InvestmentQuarter Ending December 31, 2020Domestic Equity Managers
Page 15
Ending Market Value Portfolio Weight Last Qtr Fiscal YTD 1 Year 3 Year 5 Year 10 Year Since Inception Inception Date
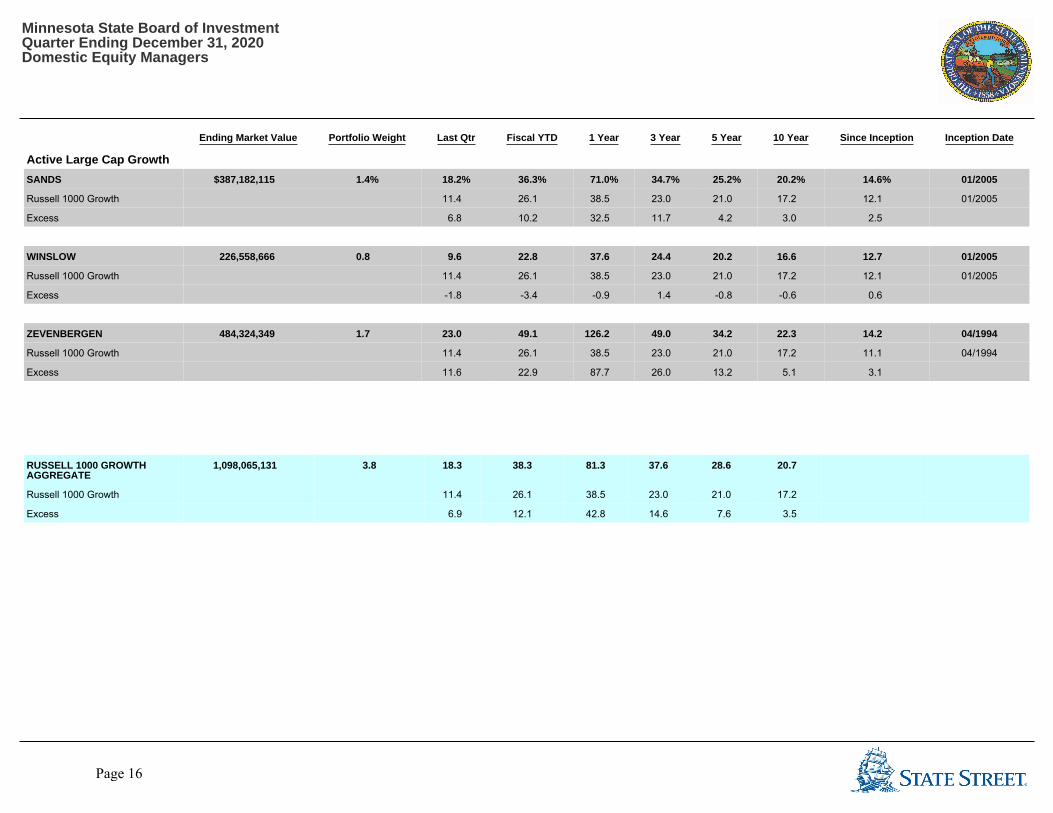
Active Large Cap GrowthSANDS $387,182,115 1.4% 18.2% 36.3% 71.0% 34.7% 25.2% 20.2% 14.6% 01/2005
Russell 1000 Growth 11.4 26.1 38.5 23.0 21.0 17.2 12.1 01/2005
Excess 6.8 10.2 32.5 11.7 4.2 3.0 2.5
WINSLOW 226,558,666 0.8 9.6 22.8 37.6 24.4 20.2 16.6 12.7 01/2005
Russell 1000 Growth 11.4 26.1 38.5 23.0 21.0 17.2 12.1 01/2005
Excess -1.8 -3.4 -0.9 1.4 -0.8 -0.6 0.6
ZEVENBERGEN 484,324,349 1.7 23.0 49.1 126.2 49.0 34.2 22.3 14.2 04/1994
Russell 1000 Growth 11.4 26.1 38.5 23.0 21.0 17.2 11.1 04/1994
Excess 11.6 22.9 87.7 26.0 13.2 5.1 3.1
Ending Market Value Portfolio Weight 1 Qtr Fiscal YTD 1 Year 3 Year 5 Year 10 Year Since Inception Inception Date
RUSSELL 1000 GROWTHAGGREGATE
1,098,065,131 3.8 18.3 38.3 81.3 37.6 28.6 20.7
Russell 1000 Growth 11.4 26.1 38.5 23.0 21.0 17.2
Excess 6.9 12.1 42.8 14.6 7.6 3.5
Minnesota State Board of InvestmentQuarter Ending December 31, 2020Domestic Equity Managers
Page 16

2019 Calendar Return 2018 Calendar Return 2017 Calendar Return 2016 Calendar Return 2015 Calendar Return
Active Large Cap GrowthSANDS 33.5% 7.0% 35.3% -6.9% 2.9%
Russell 1000 Growth 36.4 -1.5 30.2 7.1 5.7
Excess -2.8 8.6 5.1 -13.9 -2.8
WINSLOW 34.2 4.2 33.2 -1.9 6.7
Russell 1000 Growth 36.4 -1.5 30.2 7.1 5.7
Excess -2.2 5.7 3.0 -9.0 1.0
ZEVENBERGEN 43.0 2.3 35.1 -2.8 6.4
Russell 1000 Growth 36.4 -1.5 30.2 7.1 5.7
Excess 6.7 3.8 4.9 -9.9 0.7
2019 Calendar Return 2018 Calendar Return 2017 Calendar Return 2016 Calendar Return 2015 Calendar Return
RUSSELL 1000 GROWTHAGGREGATE
37.3% 4.7% 33.4% 1.0 4.6
Russell 1000 Growth 36.4% -1.5% 30.2% 7.1 5.7
Excess 0.9% 6.2% 3.2% -6.1 -1.1
Minnesota State Board of InvestmentQuarter Ending December 31, 2020Domestic Equity Managers
Page 17

Ending Market Value Portfolio Weight Last Qtr Fiscal YTD 1 Year 3 Year 5 Year 10 Year Since Inception Inception Date
Active Large Cap ValueBARROW HANLEY $359,790,154 1.3% 17.6% 24.3% 2.4% 6.9% 9.6% 10.8% 8.1% 04/2004
Russell 1000 Value 16.3 22.8 2.8 6.1 9.7 10.5 7.8 04/2004
Excess 1.3 1.5 -0.4 0.9 -0.1 0.3 0.3
EARNEST PARTNERS 659,656 0.0 21.2 27.5 9.0 8.8 12.4 10.7 7.5 07/2000
Russell 1000 Value 16.3 22.8 2.8 6.1 9.7 10.5 7.2 07/2000
Excess 5.0 4.7 6.2 2.8 2.7 0.2 0.2
LSV 423,597,709 1.5 19.9 25.4 -1.3 3.4 8.9 11.2 8.5 04/2004
Russell 1000 Value 16.3 22.8 2.8 6.1 9.7 10.5 7.8 04/2004
Excess 3.6 2.6 -4.1 -2.7 -0.8 0.7 0.7
Ending Market Value Portfolio Weight 1 Qtr Fiscal YTD 1 Year 3 Year 5 Year 10 Year Since Inception Inception Date
RUSSELL 1000 VALUEAGGREGATE
783,387,863 2.7 18.1 24.2 1.6 5.7 9.8 10.6
Russell 1000 Value 16.3 22.8 2.8 6.1 9.7 10.5
Excess 1.9 1.4 -1.2 -0.3 0.1 0.1
Minnesota State Board of InvestmentQuarter Ending December 31, 2020Domestic Equity Managers
Page 18

2019 Calendar Return 2018 Calendar Return 2017 Calendar Return 2016 Calendar Return 2015 Calendar Return
Active Large Cap ValueBARROW HANLEY 26.9% -5.9% 14.6% 12.8% -2.1%
Russell 1000 Value 26.5 -8.3 13.7 17.3 -3.8
Excess 0.4 2.4 0.9 -4.5 1.7
EARNEST PARTNERS 28.1 -7.7 19.9 16.2 -2.7
Russell 1000 Value 26.5 -8.3 13.7 17.3 -3.8
Excess 1.5 0.6 6.2 -1.1 1.1
LSV 26.9 -11.8 18.6 17.0 -2.2
Russell 1000 Value 26.5 -8.3 13.7 17.3 -3.8
Excess 0.4 -3.6 4.9 -0.4 1.6
2019 Calendar Return 2018 Calendar Return 2017 Calendar Return 2016 Calendar Return 2015 Calendar Return
RUSSELL 1000 VALUEAGGREGATE
27.4% -8.7% 17.3% 15.3 -3.2
Russell 1000 Value 26.5% -8.3% 13.7% 17.3 -3.8
Excess 0.9% -0.4% 3.7% -2.1 0.6
Minnesota State Board of InvestmentQuarter Ending December 31, 2020Domestic Equity Managers
Page 19

Ending Market Value Portfolio Weight Last Qtr Fiscal YTD 1 Year 3 Year 5 Year 10 Year Since Inception Inception Date
Semi-Passive Large CapBLACKROCK $1,526,564,074 5.3% 12.7% 23.1% 20.7% 14.7% 16.2% 14.7% 10.6% 01/1995
Semi Passive Domestic EquityBenchmark
13.7 24.5 21.0 14.8 15.6 14.0 10.2 01/1995
Excess -1.0 -1.4 -0.3 -0.1 0.6 0.7 0.4
J.P. MORGAN 1,500,277,914 5.2 13.2 24.2 21.2 14.6 15.5 14.3 10.5 01/1995
Semi Passive Domestic EquityBenchmark
13.7 24.5 21.0 14.8 15.6 14.0 10.2 01/1995
Excess -0.5 -0.3 0.3 -0.2 -0.1 0.3 0.3
Ending Market Value Portfolio Weight 1 Qtr Fiscal YTD 1 Year 3 Year 5 Year 10 Year Since Inception Inception Date
SEMI-PASSIVE DOMESTICEQUITY AGGREGATE
3,026,841,988 10.6 13.0 23.6 21.0 14.6 15.4 14.2
Semi Passive Domestic EquityBenchmark
13.7 24.5 21.0 14.8 15.6 14.0
Excess -0.7 -0.8 0.0 -0.2 -0.2 0.2
Minnesota State Board of InvestmentQuarter Ending December 31, 2020Domestic Equity Managers
Page 20

2019 Calendar Return 2018 Calendar Return 2017 Calendar Return 2016 Calendar Return 2015 Calendar Return
Semi-Passive Large CapBLACKROCK 30.4% -4.1% 24.6% 12.5% 0.8%
Semi Passive Domestic EquityBenchmark
31.4 -4.8 21.7 12.1 0.9
Excess -1.0 0.7 2.9 0.5 -0.1
J.P. MORGAN 31.3 -5.4 21.8 12.3 0.8
Semi Passive Domestic EquityBenchmark
31.4 -4.8 21.7 12.1 0.9
Excess -0.1 -0.6 0.1 0.2 -0.1
2019 Calendar Return 2018 Calendar Return 2017 Calendar Return 2016 Calendar Return 2015 Calendar Return
SEMI-PASSIVE DOMESTICEQUITY AGGREGATE
30.9% -4.9% 22.5% 11.1 0.5
Semi Passive Domestic EquityBenchmark
31.4% -4.8% 21.7% 12.1 0.9
Excess -0.5% -0.1% 0.8% -1.0 -0.4
Minnesota State Board of InvestmentQuarter Ending December 31, 2020Domestic Equity Managers
Page 21

Ending Market Value Portfolio Weight Last Qtr Fiscal YTD 1 Year 3 Year 5 Year 10 Year Since Inception Inception Date
Active Small Cap GrowthARROWMARK $220,160,722 0.8% 31.4% 37.6% 21.9% 13.9% 18.6% 11/2016
Russell 2000 Growth 29.6 38.9 34.6 16.2 19.7 11/2016
Excess 1.8 -1.3 -12.8 -2.3 -1.2
HOOD RIVER 314,997,773 1.1 30.9 50.1 61.7 23.2 24.1 11/2016
Russell 2000 Growth 29.6 38.9 34.6 16.2 19.7 11/2016
Excess 1.3 11.2 27.0 7.0 4.4
RICE HALL JAMES 222,700,218 0.8 20.9 27.5 23.8 10.8 17.4 11/2016
Russell 2000 Growth 29.6 38.9 34.6 16.2 19.7 11/2016
Excess -8.7 -11.4 -10.8 -5.4 -2.3
WELLINGTON 347,773,475 1.2 31.7 39.6 33.1 16.9 20.3 11/2016
Russell 2000 Growth 29.6 38.9 34.6 16.2 19.7 11/2016
Excess 2.1 0.7 -1.5 0.7 0.6
Ending Market Value Portfolio Weight 1 Qtr Fiscal YTD 1 Year 3 Year 5 Year 10 Year Since Inception Inception Date
RUSSELL 2000 GROWTHAGGREGATE
1,105,632,189 3.9 29.1 39.4 35.4 16.6 15.1 11.9
Russell 2000 Growth 29.6 38.9 34.6 16.2 16.4 13.5
Excess -0.5 0.5 0.8 0.4 -1.2 -1.6
Minnesota State Board of InvestmentQuarter Ending December 31, 2020Domestic Equity Managers
Page 22

2019 Calendar Return 2018 Calendar Return 2017 Calendar Return 2016 Calendar Return 2015 Calendar Return
Active Small Cap GrowthARROWMARK 20.1% 0.9% 26.2%
Russell 2000 Growth 28.5 -9.3 22.2
Excess -8.4 10.3 4.1
HOOD RIVER 24.3 -7.0 21.3
Russell 2000 Growth 28.5 -9.3 22.2
Excess -4.2 2.3 -0.9
RICE HALL JAMES 18.0 -6.9 27.9
Russell 2000 Growth 28.5 -9.3 22.2
Excess -10.5 2.4 5.8
WELLINGTON 35.6 -11.6 22.6
Russell 2000 Growth 28.5 -9.3 22.2
Excess 7.1 -2.3 0.4
2019 Calendar Return 2018 Calendar Return 2017 Calendar Return 2016 Calendar Return 2015 Calendar Return
RUSSELL 2000 GROWTHAGGREGATE
24.6% -6.2% 22.0% 4.7 1.0
Russell 2000 Growth 28.5% -9.3% 22.2% 11.3 -1.4
Excess -3.9% 3.2% -0.1% -6.6 2.4
Minnesota State Board of InvestmentQuarter Ending December 31, 2020Domestic Equity Managers
Page 23

Ending Market Value Portfolio Weight Last Qtr Fiscal YTD 1 Year 3 Year 5 Year 10 Year Since Inception Inception Date
Active Small Cap ValueGOLDMAN SACHS $415,492,645 1.4% 31.2% 35.3% 2.4% 3.0% 8.9% 9.9% 8.9% 01/2004
Russell 2000 Value 33.4 36.8 4.6 3.7 9.7 8.7 7.6 01/2004
Excess -2.1 -1.5 -2.3 -0.7 -0.7 1.2 1.3
HOTCHKIS AND WILEY 218,314,795 0.8 37.8 40.0 -0.2 0.8 5.8 8.3 7.4 01/2004
Russell 2000 Value 33.4 36.8 4.6 3.7 9.7 8.7 7.6 01/2004
Excess 4.4 3.2 -4.8 -3.0 -3.9 -0.4 -0.2
MARTINGALE 195,486,404 0.7 27.9 28.7 -4.6 -0.6 7.1 8.8 6.9 01/2004
Russell 2000 Value 33.4 36.8 4.6 3.7 9.7 8.7 7.6 01/2004
Excess -5.5 -8.1 -9.2 -4.3 -2.5 0.2 -0.7
PEREGRINE 335,394,029 1.2 36.4 40.4 7.3 2.9 9.4 9.1 9.7 07/2000
Russell 2000 Value 33.4 36.8 4.6 3.7 9.7 8.7 9.1 07/2000
Excess 3.0 3.7 2.7 -0.8 -0.3 0.4 0.6
Ending Market Value Portfolio Weight 1 Qtr Fiscal YTD 1 Year 3 Year 5 Year 10 Year Since Inception Inception Date
RUSSELL 2000 VALUEAGGREGATE
1,164,687,873 4.1 33.4 36.4 1.5 1.7 7.9 9.0
Russell 2000 Value 33.4 36.8 4.6 3.7 9.7 8.7
Excess 0.0 -0.4 -3.1 -2.1 -1.7 0.3
Minnesota State Board of InvestmentQuarter Ending December 31, 2020Domestic Equity Managers
Page 24

2019 Calendar Return 2018 Calendar Return 2017 Calendar Return 2016 Calendar Return 2015 Calendar Return
Active Small Cap ValueGOLDMAN SACHS 23.2% -13.3% 12.6% 24.6% -5.2%
Russell 2000 Value 22.4 -12.9 7.8 31.7 -7.5
Excess 0.8 -0.5 4.7 -7.1 2.3
HOTCHKIS AND WILEY 19.7 -14.4 7.9 19.9 -8.5
Russell 2000 Value 22.4 -12.9 7.8 31.7 -7.5
Excess -2.7 -1.5 0.0 -11.8 -1.0
MARTINGALE 21.1 -15.0 6.9 34.3 -5.2
Russell 2000 Value 22.4 -12.9 7.8 31.7 -7.5
Excess -1.3 -2.1 -0.9 2.5 2.3
PEREGRINE 21.1 -16.1 12.5 27.8 -6.7
Russell 2000 Value 22.4 -12.9 7.8 31.7 -7.5
Excess -1.3 -3.3 4.7 -3.9 0.8
2019 Calendar Return 2018 Calendar Return 2017 Calendar Return 2016 Calendar Return 2015 Calendar Return
RUSSELL 2000 VALUEAGGREGATE
21.3% -14.7% 10.2% 26.5 -6.5
Russell 2000 Value 22.4% -12.9% 7.8% 31.7 -7.5
Excess -1.1% -1.8% 2.3% -5.2 1.0
Minnesota State Board of InvestmentQuarter Ending December 31, 2020Domestic Equity Managers
Page 25

Ending Market Value Portfolio Weight Last Qtr Fiscal YTD 1 Year 3 Year 5 Year 10 Year Since Inception Inception Date
Total Passive DomesticEquityBLACKROCK RUSSELL 1000 $20,217,350,591 70.5% 13.7% 24.5% 20.9% 14.8% 17.4% 11/2016
RUSSELL 1000 (DAILY) 13.7 24.5 21.0 14.8 17.4 11/2016
Excess 0.0 -0.0 -0.0 -0.0 -0.0
BLACKROCK RUSSELL 2000 151,215,378 0.5 31.4 37.6 20.8 15.2 11/2018
RUSSELL 2000 (DAILY) 31.4 37.9 20.0 14.8 11/2018
Excess 0.0 -0.3 0.8 0.4
BLACKROCK RUSSELL 3000 (1) 1,125,987,069 3.9 14.8 25.3 21.2 14.6 15.5% 13.8% 10.0 07/1995
Passive Manager Benchmark 14.7 25.2 20.9 14.5 15.4 13.8 9.9 07/1995
Excess 0.1 0.1 0.3 0.1 0.1 0.0 0.1
(1) The current Passive Manager Benchmark is the Russell 3000. For historical benchmark details please refer to the addendum of this report.
(2) The current Passive Domestic Equity Benchmark is a weighted average of the Russell 1000, Russell 2000 and Russell 3000.
Ending Market Value Portfolio Weight 1 Qtr Fiscal YTD 1 Year 3 Year 5 Year 10 Year Since Inception Inception Date
PASSIVE DOMESTIC EQUITYAGGREGATE (2)
21,494,553,038 75.0 14.0 24.7 20.8 14.6 15.5 13.8
Passive Domestic EquityBenchmark
14.0 24.7 20.8 14.6 15.5 13.8
Excess 0.0 0.0 0.0 -0.0 -0.0 -0.0
Minnesota State Board of InvestmentQuarter Ending December 31, 2020Domestic Equity Managers
Page 26

2019 Calendar Return 2018 Calendar Return 2017 Calendar Return 2016 Calendar Return 2015 Calendar Return
Total Passive DomesticEquityBLACKROCK RUSSELL 1000 31.4% -4.8% 21.7%
RUSSELL 1000 (DAILY) 31.4 -4.8 21.7
Excess 0.0 -0.0 -0.0
BLACKROCK RUSSELL 2000 25.2
RUSSELL 2000 (DAILY) 25.5
Excess -0.3
BLACKROCK RUSSELL 3000 (1) 31.1 -5.2 21.1 12.7% 0.5%
Passive Manager Benchmark 31.0 -5.2 21.1 12.7 0.5
Excess 0.0 -0.0 0.0 0.0 0.0
(1) The current Passive Manager Benchmark is the Russell 3000. For historical benchmark details please refer to the addendum of this report.
(2) The current Passive Domestic Equity Benchmark is a weighted average of the Russell 1000, Russell 2000 and Russell 3000.
2019 Calendar Return 2018 Calendar Return 2017 Calendar Return 2016 Calendar Return 2015 Calendar Return
PASSIVE DOMESTIC EQUITYAGGREGATE (2)
31.3% -5.0% 21.3% 12.6 0.5
Passive Domestic EquityBenchmark
31.3% -5.0% 21.5% 12.5 0.5
Excess 0.0% -0.0% -0.2% 0.1 0.0
Minnesota State Board of InvestmentQuarter Ending December 31, 2020Domestic Equity Managers
Page 27

This page intentionally left blank.
Page 28
Public Equity - InternationalDecember 31, 2020
Minnesota State Board of InvestmentQuarter Ending December 31, 2020
Page 29

Ending Market Value Portfolio Weight Last Qtr Fiscal YTD 1 Year 3 Year 5 Year 10 Year Since Inception Inception Date
Total International EquityDEVELOPED MARKETS (1) $9,453,049,443 67.1% 15.8% 22.3% 9.1% 4.9% 7.9% 5.9%
BENCHMARK DM 15.8 21.5 7.6 4.2 7.6 5.2
Excess -0.1 0.7 1.5 0.7 0.2 0.7
EMERGING MARKETS (2) 4,262,687,920 30.3 20.2 31.9 17.7 6.2 12.2 3.3
BENCHMARK EM 19.7 31.1 18.3 6.2 12.8 3.6
Excess 0.5 0.8 -0.6 0.1 -0.7 -0.3
ACWI EX-US AGGREGATE 379,242,942 2.7
MSCI AC WORLD ex US (NET) -DAILY
Excess
TRANSITION AGGREGATEINTERNATIONAL EQUITY (3)
971,351 0.0
(1) The current benchmak for Developed Markets, Benchmark DM, is the Standard (large + mid) MSCI World ex USA (net).
(2) The current benchmark for Emerging Markets, Benchmark EM, is the Standard (large + mid) MSCI Emerging Markets Free (net).
(3) The Transition Aggregate International Equity contains International Equity securities that are being transitioned to a different manager.
(4) On 12/1/20 the International Equity Benchmark changed to the MSCI ACWI ex USA (net) from a blend of 75% MSCI World ex USA (net) and 25% MSCI Emerging Markets Free (net).
Note: All aggregates include the performance of terminated managers. For historical benchmark details please refer to the addendum of this report.
Ending Market Value Portfolio Weight 1 Qtr Fiscal YTD 1 Year 3 Year 5 Year 10 Year Since Inception Inception Date
TOTAL INTERNATIONALEQUITY (4)
14,078,161,450 100.0 16.9 24.8 11.3 5.2 8.8 5.4 6.7 10/1992
International Equity Benchmark 17.1 24.2 10.5 4.8 8.9 4.9 6.3 10/1992
Excess -0.1 0.6 0.8 0.4 -0.1 0.5 0.5
Minnesota State Board of InvestmentQuarter Ending December 31, 2020International Equity Managers
Page 30

2019 Calendar Return 2018 Calendar Return 2017 Calendar Return 2016 Calendar Return 2015 Calendar Return
Total International EquityDEVELOPED MARKETS (1) 23.3% -14.2% 24.9% 1.3% -0.3%
BENCHMARK DM 22.5 -14.1 24.2 2.7 -3.0
Excess 0.8 -0.1 0.7 -1.5 2.8
EMERGING MARKETS (2) 20.3 -15.4 37.7 7.5 -13.1
BENCHMARK EM 18.4 -14.6 37.3 11.2 -14.9
Excess 1.9 -0.8 0.4 -3.7 1.9
ACWI EX-US AGGREGATE
MSCI AC WORLD ex US (NET) -DAILY
Excess
TRANSITION AGGREGATEINTERNATIONAL EQUITY (3)
(1) The current benchmak for Developed Markets, Benchmark DM, is the Standard (large + mid) MSCI World ex USA (net).
(2) The current benchmark for Emerging Markets, Benchmark EM, is the Standard (large + mid) MSCI Emerging Markets Free (net).
(3) The Transition Aggregate International Equity contains International Equity securities that are being transitioned to a different manager.
(4) On 12/1/20 the International Equity Benchmark changed to the MSCI ACWI ex USA (net) from a blend of 75% MSCI World ex USA (net) and 25% MSCI Emerging Markets Free (net).
Note: All aggregates include the performance of terminated managers. For historical benchmark details please refer to the addendum of this report.
2019 Calendar Return 2018 Calendar Return 2017 Calendar Return 2016 Calendar Return 2015 Calendar Return
TOTAL INTERNATIONALEQUITY (4)
22.4% -14.5% 27.6% 2.6 -2.9
International Equity Benchmark 21.5% -14.2% 27.2% 4.5 -5.7
Excess 0.9% -0.3% 0.4% -1.8 2.8
Minnesota State Board of InvestmentQuarter Ending December 31, 2020International Equity Managers
Page 31

Ending Market Value Portfolio Weight Last Qtr Fiscal YTD 1 Year 3 Year 5 Year 10 Year Since Inception Inception Date
Active Developed MarketsACADIAN $352,402,638 2.5% 13.6% 22.2% 11.7% 4.8% 11.3% 8.3% 6.9% 07/2005
BENCHMARK DM 15.8 21.5 7.6 4.2 7.6 5.2 5.3 07/2005
Excess -2.3 0.6 4.2 0.6 3.6 3.1 1.6
COLUMBIA 399,526,775 2.8 15.6 25.5 15.0 8.0 9.6 7.5 3.9 03/2000
BENCHMARK DM 15.8 21.5 7.6 4.2 7.6 5.2 3.8 03/2000
Excess -0.2 4.0 7.4 3.8 2.0 2.3 0.1
FIDELITY 375,331,310 2.7 15.4 24.3 15.4 7.8 9.8 7.3 7.2 07/2005
BENCHMARK DM 15.8 21.5 7.6 4.2 7.6 5.2 5.3 07/2005
Excess -0.5 2.8 7.8 3.6 2.2 2.1 1.9
JP MORGAN 333,871,351 2.4 15.8 23.9 14.2 6.6 10.1 6.4 6.0 07/2005
BENCHMARK DM 15.8 21.5 7.6 4.2 7.6 5.2 5.3 07/2005
Excess -0.0 2.3 6.6 2.4 2.5 1.2 0.7
MARATHON 394,310,147 2.8 17.1 25.6 7.6 4.8 7.0 7.0 8.1 11/1993
BENCHMARK DM 15.8 21.5 7.6 4.2 7.6 5.2 5.3 11/1993
Excess 1.3 4.1 0.1 0.6 -0.7 1.9 2.8
MCKINLEY 275,400,354 2.0 12.6 23.6 16.4 7.1 7.9 6.4 5.6 07/2005
BENCHMARK DM 15.8 21.5 7.6 4.2 7.6 5.2 5.3 07/2005
Excess -3.2 2.0 8.8 2.9 0.2 1.2 0.4
Ending Market Value Portfolio Weight 1 Qtr Fiscal YTD 1 Year 3 Year 5 Year 10 Year Since Inception Inception Date
ACTIVE DEVELOPED MARKETSAGGREGATE
2,130,842,574 15.1 15.1 24.2 13.1 6.5 9.1 7.2
BENCHMARK DM 15.8 21.5 7.6 4.2 7.6 5.2
Excess -0.8 2.7 5.6 2.3 1.5 2.0
Minnesota State Board of InvestmentQuarter Ending December 31, 2020International Equity Managers
Page 32

2019 Calendar Return 2018 Calendar Return 2017 Calendar Return 2016 Calendar Return 2015 Calendar Return
Active Developed MarketsACADIAN 19.1% -13.5% 37.0% 8.1% 2.4%
BENCHMARK DM 22.5 -14.1 24.2 2.7 -3.0
Excess -3.4 0.6 12.8 5.4 5.4
COLUMBIA 28.9 -14.9 32.7 -5.6 6.4
BENCHMARK DM 22.5 -14.1 24.2 2.7 -3.0
Excess 6.4 -0.8 8.5 -8.3 9.4
FIDELITY 27.1 -14.6 25.9 1.2 0.1
BENCHMARK DM 22.5 -14.1 24.2 2.7 -3.0
Excess 4.6 -0.5 1.7 -1.5 3.2
JP MORGAN 28.5 -17.3 28.3 4.0 -4.7
BENCHMARK DM 22.5 -14.1 24.2 2.7 -3.0
Excess 6.0 -3.3 4.1 1.2 -1.6
MARATHON 23.5 -13.4 23.1 -1.1 6.7
BENCHMARK DM 22.5 -14.1 24.2 2.7 -3.0
Excess 1.0 0.7 -1.1 -3.8 9.7
MCKINLEY 25.6 -15.9 28.5 -7.5 3.1
BENCHMARK DM 22.5 -14.1 24.2 2.7 -3.0
Excess 3.1 -1.9 4.3 -10.2 6.2
2019 Calendar Return 2018 Calendar Return 2017 Calendar Return 2016 Calendar Return 2015 Calendar Return
ACTIVE DEVELOPED MARKETSAGGREGATE
25.0% -14.5% 28.4% -0.2 3.2
BENCHMARK DM 22.5% -14.1% 24.2% 2.7 -3.0
Excess 2.5% -0.4% 4.2% -3.0 6.2
Minnesota State Board of InvestmentQuarter Ending December 31, 2020International Equity Managers
Page 33

Ending Market Value Portfolio Weight Last Qtr Fiscal YTD 1 Year 3 Year 5 Year 10 Year Since Inception Inception Date
Semi-Passive DevelopedMarketsAQR $388,256,439 2.8% 14.9% 22.5% 6.5% 1.7% 5.8% 5.1% 5.3% 07/2005
BENCHMARK DM 15.8 21.5 7.6 4.2 7.6 5.2 5.3 07/2005
Excess -0.9 0.9 -1.1 -2.5 -1.8 -0.0 0.0
Ending Market Value Portfolio Weight 1 Qtr Fiscal YTD 1 Year 3 Year 5 Year 10 Year Since Inception Inception Date
SEMI-PASSIVE DEVELOPEDMARKETS AGGREGATE
388,256,439 2.8 14.9 22.5 6.5 1.5 5.2 4.6
BENCHMARK DM 15.8 21.5 7.6 4.2 7.6 5.2
Excess -0.9 0.9 -1.1 -2.7 -2.5 -0.6
Minnesota State Board of InvestmentQuarter Ending December 31, 2020International Equity Managers
Page 34

2019 Calendar Return 2018 Calendar Return 2017 Calendar Return 2016 Calendar Return 2015 Calendar Return
Semi-Passive DevelopedMarketsAQR 20.8% -18.2% 25.1% 0.8% 0.9%
BENCHMARK DM 22.5 -14.1 24.2 2.7 -3.0
Excess -1.7 -4.1 0.9 -2.0 3.9
2019 Calendar Return 2018 Calendar Return 2017 Calendar Return 2016 Calendar Return 2015 Calendar Return
SEMI-PASSIVE DEVELOPEDMARKETS AGGREGATE
20.8% -18.7% 23.3% -0.4 -0.3
BENCHMARK DM 22.5% -14.1% 24.2% 2.7 -3.0
Excess -1.7% -4.6% -0.9% -3.1 2.7
Minnesota State Board of InvestmentQuarter Ending December 31, 2020International Equity Managers
Page 35

Ending Market Value Portfolio Weight Last Qtr Fiscal YTD 1 Year 3 Year 5 Year 10 Year Since Inception Inception Date
Total Developed MarketsACTIVE DEVELOPED MARKETSAGGREGATE
$2,130,842,574 15.1% 15.1% 24.2% 13.1% 6.5% 9.1% 7.2%
BENCHMARK DM 15.8 21.5 7.6 4.2 7.6 5.2
Excess -0.8 2.7 5.6 2.3 1.5 2.0
SEMI-PASSIVE DEVELOPEDMARKETS AGGREGATE
388,256,439 2.8 14.9 22.5 6.5 1.5 5.2 4.6
BENCHMARK DM 15.8 21.5 7.6 4.2 7.6 5.2
Excess -0.9 0.9 -1.1 -2.7 -2.5 -0.6
Ending Market Value Portfolio Weight 1 Qtr Fiscal YTD 1 Year 3 Year 5 Year 10 Year Since Inception Inception Date
DEVELOPED MARKETS TOTAL 9,453,049,443 67.1 15.8 22.3 9.1 4.9 7.9 5.9
BENCHMARK DM 15.8 21.5 7.6 4.2 7.6 5.2
Excess -0.1 0.7 1.5 0.7 0.2 0.7
Ending Market Value Portfolio Weight 1 Qtr Fiscal YTD 1 Year 3 Year 5 Year 10 Year Since Inception Inception Date
SSgA DEVELOPED MARKETSPASSIVE
$6,933,950,430 49.3% 16.0% 21.8% 8.2% 4.6% 8.1% 5.6% 6.4% 10/1992
BENCHMARK DM 15.8% 21.5% 7.6% 4.2% 7.6% 5.2% 6.0% 10/1992
Excess 0.1% 0.2% 0.6% 0.4% 0.4% 0.4% 0.3%
DM PASSIVE EQUITY WITHCURRENCY MGMT
$6,916,160,224 49.1% 15.7% 21.5% 8.0% 4.6% 7.9% 5.5% 10/1992
BENCHMARK DM 15.8% 21.5% 7.6% 4.2% 7.6% 5.2% 10/1992
Excess -0.1% -0.0% 0.4% 0.3% 0.2% 0.3%
Minnesota State Board of InvestmentQuarter Ending December 31, 2020International Equity Managers
Page 36
RECORD CURRENCY -$17,790,207 -0.1% 10/2020

2019 Calendar Return 2018 Calendar Return 2017 Calendar Return 2016 Calendar Return 2015 Calendar Return
Total Developed MarketsACTIVE DEVELOPED MARKETSAGGREGATE
25.0% -14.5% 28.4% -0.2% 3.2%
BENCHMARK DM 22.5 -14.1 24.2 2.7 -3.0
Excess 2.5 -0.4 4.2 -3.0 6.2
SEMI-PASSIVE DEVELOPEDMARKETS AGGREGATE
20.8 -18.7 23.3 -0.4 -0.3
BENCHMARK DM 22.5 -14.1 24.2 2.7 -3.0
Excess -1.7 -4.6 -0.9 -3.1 2.7
2019 Calendar Return 2018 Calendar Return 2017 Calendar Return 2016 Calendar Return 2015 Calendar Return
DEVELOPED MARKETS TOTAL 23.3% -14.2% 24.9% 1.3 -0.3
BENCHMARK DM 22.5% -14.1% 24.2% 2.7 -3.0
Excess 0.8% -0.1% 0.7% -1.5 2.8
2019 Calendar Return 2018 Calendar Return 2017 Calendar Return 2016 Calendar Return 2015 Calendar Return
SSgA DEVELOPED MARKETSPASSIVE
23.0% -13.9% 24.7% 3.2 -2.6
BENCHMARK DM 22.5% -14.1% 24.2% 2.7 -3.0
Excess 0.5% 0.2% 0.5% 0.4 0.5
DM PASSIVE EQUITY WITHCURRENCY MGMT
23.0% -13.9% 23.8% 3.3 -2.6
BENCHMARK DM 22.5% -14.1% 24.2% 2.7 -3.0
Excess 0.5% 0.2% -0.4% 0.5 0.5
Minnesota State Board of InvestmentQuarter Ending December 31, 2020International Equity Managers
Page 37

Ending Market Value Portfolio Weight Last Qtr Fiscal YTD 1 Year 3 Year 5 Year 10 Year Since Inception Inception Date
Active Emerging MarketsEARNEST PARTNERS $202,228,059 1.4% 21.6% 30.1% 5.6% 3.7% 8.6% 04/2017
MSCI EMERGING MARKETS (1) 19.7 31.1 18.3 6.2 10.9 04/2017
Excess 1.9 -1.0 -12.7 -2.5 -2.3
MARTIN CURRIE 519,788,435 3.7 21.5 37.4 26.5 10.3 16.3 04/2017
BENCHMARK EM 19.7 31.1 18.3 6.2 10.9 04/2017
Excess 1.8 6.2 8.2 4.2 5.4
MACQUARIE 502,188,860 3.6 16.7 31.8 24.2 9.9 14.0 04/2017
BENCHMARK EM 19.7 31.1 18.3 6.2 10.9 04/2017
Excess -3.0 0.6 5.9 3.7 3.1
MORGAN STANLEY 614,403,486 4.4 18.2 31.2 15.7 5.1 11.2% 4.1% 9.8 01/2001
BENCHMARK EM 19.7 31.1 18.3 6.2 12.8 3.6 9.6 01/2001
Excess -1.5 0.1 -2.6 -1.1 -1.7 0.5 0.2
NEUBERGER BERMAN 426,939,659 3.0 17.4 26.5 14.2 4.2 10.0 04/2017
BENCHMARK EM 19.7 31.1 18.3 6.2 10.9 04/2017
Excess -2.3 -4.6 -4.1 -1.9 -0.9
PZENA 338,361,628 2.4 28.5 34.5 7.7 2.9 6.4 04/2017
BENCHMARK EM 19.7 31.1 18.3 6.2 10.9 04/2017
Excess 8.9 3.4 -10.6 -3.3 -4.5
ROCK CREEK 474,487,251 3.4 20.1 32.5 22.0 7.1 10.7 04/2017
BENCHMARK EM 19.7 31.1 18.3 6.2 10.9 04/2017
Excess 0.4 1.4 3.7 0.9 -0.2
Minnesota State Board of InvestmentQuarter Ending December 31, 2020International Equity Managers
(1) Earnest Partners transitioned its portfolio benchmark to the MSCI China A Index (Gross) by the end of December 2020. For aggregation purposes Earnest Partners is benchmarked against MSCI EmergingMarkets (net) and included in the Active Emerging Markets Aggregate until 12/31/2020.
Page 38

2019 Calendar Return 2018 Calendar Return 2017 Calendar Return 2016 Calendar Return 2015 Calendar Return
Active Emerging MarketsEARNEST PARTNERS 24.7% -15.4%
MSCI EMERGING MARKETS 18.4 -14.6
Excess 6.3 -0.8
MARTIN CURRIE 27.3 -16.6
BENCHMARK EM 18.4 -14.6
Excess 8.8 -2.0
MACQUARIE 23.2 -13.3
BENCHMARK EM 18.4 -14.6
Excess 4.7 1.3
MORGAN STANLEY 20.4 -16.7 37.9% 6.1% -9.4%
BENCHMARK EM 18.4 -14.6 37.3 11.2 -14.9
Excess 1.9 -2.2 0.6 -5.1 5.5
NEUBERGER BERMAN 19.7 -17.1
BENCHMARK EM 18.4 -14.6
Excess 1.3 -2.6
PZENA 13.4 -10.8
BENCHMARK EM 18.4 -14.6
Excess -5.1 3.8
ROCK CREEK 22.3 -17.6
BENCHMARK EM 18.4 -14.6
Excess 3.9 -3.1
Minnesota State Board of InvestmentQuarter Ending December 31, 2020International Equity Managers
Page 39

Ending Market Value Portfolio Weight Last Qtr Fiscal YTD 1 Year 3 Year 5 Year 10 Year Since Inception Inception Date
Total Emerging MarketsACTIVE EMERGING MARKETSAGGREGATE
$3,078,397,377 21.9% 20.5% 32.6% 17.3% 6.3% 11.7% 3.1%
BENCHMARK EM 19.7 31.1 18.3 6.2 12.8 3.6
Excess 0.8 1.4 -1.0 0.2 -1.1 -0.5
Ending Market Value Portfolio Weight 1 Qtr Fiscal YTD 1 Year 3 Year 5 Year 10 Year Since Inception Inception Date
SSGA EMERGING MARKETSPASSIVE
1,184,290,543 8.4 19.3 30.5 18.3 6.0 12.7 6.5 01/2012
BENCHMARK EM 19.7 31.1 18.3 6.2 12.8 6.4 01/2012
Excess -0.4 -0.6 0.0 -0.1 -0.1 0.0
Ending Market Value Portfolio Weight 1 Qtr Fiscal YTD 1 Year 3 Year 5 Year 10 Year Since Inception Inception Date
EMERGING MARKETS TOTAL 4,262,687,920 30.3 20.2 31.9 17.7 6.2 12.2 3.3
BENCHMARK EM 19.7 31.1 18.3 6.2 12.8 3.6
Excess 0.5 0.8 -0.6 0.1 -0.7 -0.3
Minnesota State Board of InvestmentQuarter Ending December 31, 2020International Equity Managers
Page 40

2019 Calendar Return 2018 Calendar Return 2017 Calendar Return 2016 Calendar Return 2015 Calendar Return
EMERGING MARKETS TOTAL 20.3% -15.4% 37.7% 7.5 -13.1
BENCHMARK EM 18.4% -14.6% 37.3% 11.2 -14.9
Excess 1.9% -0.8% 0.4% -3.7 1.9
2019 Calendar Return 2018 Calendar Return 2017 Calendar Return 2016 Calendar Return 2015 Calendar Return
Total Emerging MarketsACTIVE EMERGING MARKETSAGGREGATE
21.4% -15.6% 37.2% 5.3% -12.7%
BENCHMARK EM 18.4 -14.6 37.3 11.2 -14.9
Excess 3.0 -1.0 -0.1 -5.9 2.2
2019 Calendar Return 2018 Calendar Return 2017 Calendar Return 2016 Calendar Return 2015 Calendar Return
SSGA EMERGING MARKETSPASSIVE
18.1% -14.7% 37.4% 11.1 -14.6
BENCHMARK EM 18.4% -14.6% 37.3% 11.2 -14.9
Excess -0.3% -0.1% 0.1% -0.1 0.3
Minnesota State Board of InvestmentQuarter Ending December 31, 2020International Equity Managers
Page 41

Ending Market Value Portfolio Weight Last Qtr Fiscal YTD 1 Year 3 Year 5 Year 10 Year Since Inception Inception Date
Active ACWI ex-USEarnest Partners ACWI ex US $379,242,942 2.7%
MSCI AC WORLD ex US (NET) -DAILY
Excess
TOTAL ACWI EX-USAGGREGATE
379,242,942 2.7
MSCI AC WORLD ex US (NET) -DAILY
Excess
Minnesota State Board of InvestmentQuarter Ending December 31, 2020International Equity Managers
Note: Earnest Partners ACWI ex US was funded mid-December 2020 and will have its reporting period start on 1/1/21.
Page 42
Public Equity - GlobalDecember 31, 2020
Minnesota State Board of InvestmentQuarter Ending December 31, 2020
Page 43

Ending Market Value Portfolio Weight Last Qtr Fiscal YTD 1 Year 3 Year 5 Year 10 Year Since Inception Inception Date
Global Equity ManagersARIEL INVESTMENTS $344,354,910 32.7%
MSCI AC WORLD NET USDDAILY
Excess
BAILLIE GIFFORD 316,036,250 30.0
MSCI AC WORLD NET USDDAILY
Excess
MARTIN CURRIE INVESTMENTS- GLOBAL EQ
393,271,033 37.3
MSCI AC WORLD NET USDDAILY
Excess
GLOBAL EQUITY 1,053,662,193 100.0
MSCI AC WORLD NET USDDAILY
Excess
Minnesota State Board of InvestmentQuarter Ending December 31, 2020Global Equity Managers
Note: The Global Equity managers were funded mid-December 2020 and will have a reporting period start of 1/1/21.
Page 44

Fixed Income - Core/Core PlusDecember 31, 2020
Minnesota State Board of InvestmentQuarter Ending December 31, 2020
Page 45

Ending Market Value Portfolio Weight Last Qtr Fiscal YTD 1 Year 3 Year 5 Year 10 Year Since Inception Inception Date
Core/Core Plus BondsCORE (1) $1,727,491,482 39.0%
BBG BARC Agg (Dly)
Excess
CORE PLUS (1) 2,706,238,489 61.0
BBG BARC Agg (Dly)
Excess
TRANSITION AGGREGATECORE BONDS (2)
19,032 0.0
(1) Prior to 12/1/2020 the Core and Core Plus managers were categorized as Active or Semi-Passive. For historical performance of each manager, see the following pages in this report. For information on thehistorical performance of the previous groupings refer to the 9/30/2020 Comprehensive Performance Report.
(2) The Transition Aggregate Core Bonds includes core bonds securities that are being transition to a different manager.
(3) The current Core/Core Plus Benchmark is the Bloomberg Barclays U.S. Aggregate calculated daily: BBG BARC Agg (Dly). For historical benchmark details please refer to the addendum of this report.
Note: All aggregates include the performance of terminated managers. Inception refers to the date of retention by the SBI.
Ending Market Value Portfolio Weight 1 Qtr Fiscal YTD 1 Year 3 Year 5 Year 10 Year Since Inception Inception Date
TOTAL CORE/CORE PLUSBONDS (3)
4,433,749,003 100.0 1.9 3.2 9.7 6.4 5.4 4.6 7.6 07/1984
Fixed Income Benchmark 0.7 1.3 7.5 5.3 4.4 3.8 7.1 07/1984
Excess 1.2 1.9 2.2 1.0 0.9 0.7 0.4
Minnesota State Board of Investment Quarter Ending December 31, 2020 Core/Core Plus Bonds Managers
Page 46

2019 Calendar Return 2018 Calendar Return 2017 Calendar Return 2016 Calendar Return 2015 Calendar Return
TOTAL CORE/CORE PLUSBONDS (3)
9.7% -0.0% 4.2% 3.6 0.7
Fixed Income Benchmark 8.7% 0.0% 3.5% 2.6 0.5
Excess 1.0% -0.1% 0.7% 0.9 0.1
2019 Calendar Return 2018 Calendar Return 2017 Calendar Return 2016 Calendar Return 2015 Calendar Return
Core/Core Plus BondsCORE (1)
BBG BARC Agg (Dly)
Excess
CORE PLUS (1)
BBG BARC Agg (Dly)
Excess
TRANSITION AGGREGATECORE BONDS (2)
(1) Prior to 12/1/2020 the Core and Core Plus managers were categorized as Active or Semi-Passive. For historical performance of each manager, see the following pages in this report. For information on thehistorical performance of the previous groupings refer to the 9/30/2020 Comprehensive Performance Report.
(2) The Transition Aggregate Core Bonds includes core bonds securities that are being transition to a different manager.
(3) The current Core/Core Plus Benchmark is the Bloomberg Barclays U.S. Aggregate calculated daily: BBG BARC Agg (Dly). For historical benchmark details please refer to the addendum of this report.
Note: All aggregates include the performance of terminated managers. Inception refers to the date of retention by the SBI.
Minnesota State Board of Investment Quarter Ending December 31, 2020 Core/Core Plus Bonds Managers
Page 47

Ending Market Value Portfolio Weight Last Qtr Fiscal YTD 1 Year 3 Year 5 Year 10 Year Since Inception Inception Date
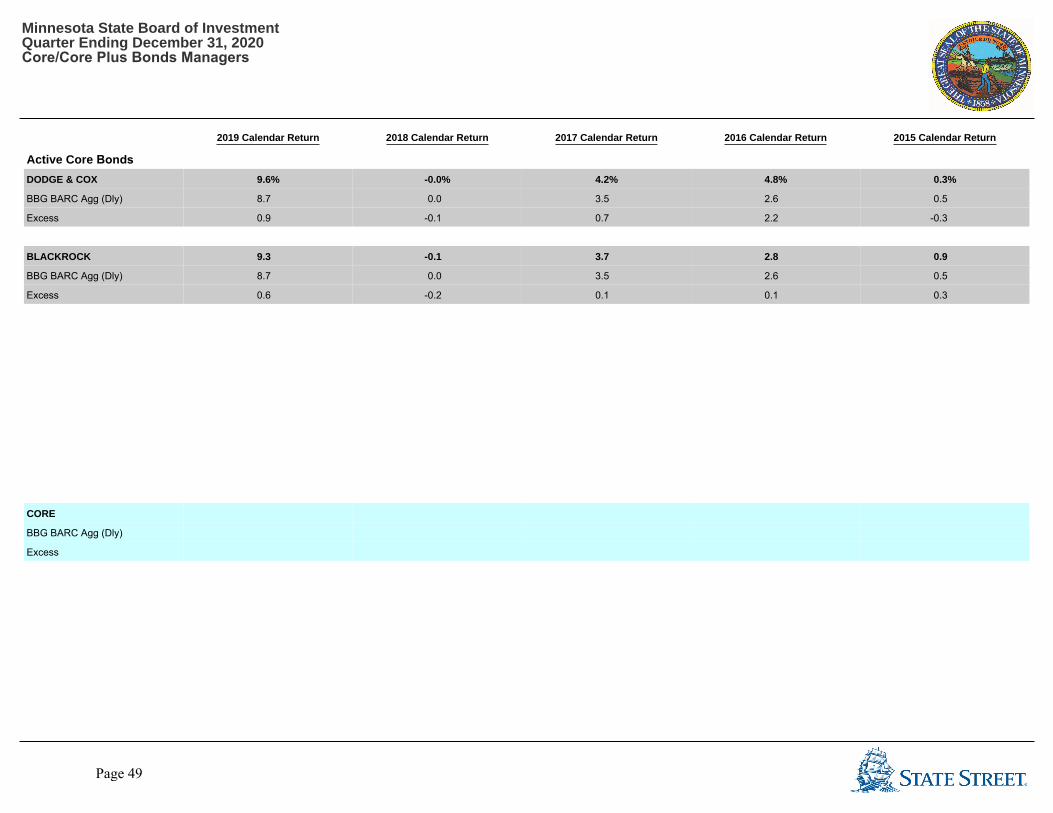
Active Core BondsDODGE & COX $1,072,119,823 24.2% 2.4% 3.7% 9.4% 6.2% 5.5% 4.8% 6.2% 02/2000
BBG BARC Agg (Dly) 0.7 1.3 7.5 5.3 4.4 3.8 5.2 02/2000
Excess 1.7 2.5 1.8 0.9 1.1 1.0 1.0
BLACKROCK 655,371,659 14.8 0.8 1.7 8.3 5.7 4.7 4.1 5.4 04/1996
BBG BARC Agg (Dly) 0.7 1.3 7.5 5.3 4.4 3.8 5.3 04/1996
Excess 0.1 0.4 0.8 0.4 0.3 0.3 0.1
Ending Market Value Portfolio Weight 1 Qtr Fiscal YTD 1 Year 3 Year 5 Year 10 Year Since Inception Inception Date
CORE 1,727,491,482 39.0
BBG BARC Agg (Dly)
Excess
Minnesota State Board of Investment Quarter Ending December 31, 2020 Core/Core Plus Bonds Managers
Page 48
2019 Calendar Return 2018 Calendar Return 2017 Calendar Return 2016 Calendar Return 2015 Calendar Return
Active Core BondsDODGE & COX 9.6% -0.0% 4.2% 4.8% 0.3%
BBG BARC Agg (Dly) 8.7 0.0 3.5 2.6 0.5
Excess 0.9 -0.1 0.7 2.2 -0.3
BLACKROCK 9.3 -0.1 3.7 2.8 0.9
BBG BARC Agg (Dly) 8.7 0.0 3.5 2.6 0.5
Excess 0.6 -0.2 0.1 0.1 0.3
2019 Calendar Return 2018 Calendar Return 2017 Calendar Return 2016 Calendar Return 2015 Calendar Return
CORE
BBG BARC Agg (Dly)
Excess
Minnesota State Board of Investment Quarter Ending December 31, 2020 Core/Core Plus Bonds Managers
Page 49

Ending Market Value Portfolio Weight Last Qtr Fiscal YTD 1 Year 3 Year 5 Year 10 Year Since Inception Inception Date
Core Plus Bonds
GOLDMAN SACHS $812,275,907 18.3% 1.3% 2.3% 9.0% 6.1% 5.0% 4.4% 5.7% 07/1993
BBG BARC Agg (Dly) 0.7 1.3 7.5 5.3 4.4 3.8 5.3 07/1993
Excess 0.6 1.0 1.5 0.8 0.6 0.5 0.4
NEUBERGER 869,632,516 19.6 2.2 2.8 9.9 6.2 5.0 4.2 6.5 07/1988
BBG BARC Agg (Dly) 0.7 1.3 7.5 5.3 4.4 3.8 6.2 07/1988
Excess 1.5 1.5 2.4 0.9 0.5 0.4 0.3
WESTERN 1,024,330,067 23.1 2.7 4.6 10.9 7.1 6.4 5.3 8.4 07/1984
BBG BARC Agg (Dly) 0.7 1.3 7.5 5.3 4.4 3.8 7.2 07/1984
Excess 2.0 3.3 3.4 1.8 1.9 1.4 1.2
Ending Market Value Portfolio Weight 1 Qtr Fiscal YTD 1 Year 3 Year 5 Year 10 Year Since Inception Inception Date
CORE PLUS 2,706,238,489 61.0
BBG BARC Agg (Dly)
Excess
Minnesota State Board of InvestmentQuarter Ending December 31, 2020Bonds Managers
Page 50

2019 Calendar Return 2018 Calendar Return 2017 Calendar Return 2016 Calendar Return 2015 Calendar Return
CORE PLUS
BBG BARC Agg (Dly)
Excess
2019 Calendar Return 2018 Calendar Return 2017 Calendar Return 2016 Calendar Return 2015 Calendar Return
Core Plus BondsGOLDMAN SACHS 9.6% -0.0% 3.9% 3.0% 0.8%
BBG BARC Agg (Dly) 8.7 0.0 3.5 2.6 0.5
Excess 0.9 -0.0 0.4 0.3 0.2
NEUBERGER 9.0 -0.1 3.6 2.7 0.7
BBG BARC Agg (Dly) 8.7 0.0 3.5 2.6 0.5
Excess 0.3 -0.1 0.0 0.1 0.2
WESTERN ASSETMANAGEMENT
11.1 -0.2 5.6 4.9 0.7
BBG BARC Agg (Dly) 8.7 0.0 3.5 2.6 0.5
Excess 2.4 -0.3 2.1 2.2 0.1
Minnesota State Board of InvestmentQuarter Ending December 31, 2020Bonds Managers
Page 51

This page intentionally left blank.
Page 52

Fixed Income - Return SeekingDecember 31, 2020
Minnesota State Board of InvestmentQuarter Ending December 31, 2020
Page 53

Ending Market Value Portfolio Weight Last Qtr Fiscal YTD 1 Year 3 Year 5 Year 10 Year Since Inception Inception Date
Return Seeking BondsManagersCOLUMBIA $925,827,845 26.1% 1.1% 12/2020
Credit Plus Benchmark 0.7 12/2020
Excess 0.3
PIMCO 810,810,706 22.9 0.8 12/2020
Credit Plus Benchmark 0.7 12/2020
Excess 0.1
CREDIT PLUS 1,736,638,550 48.9 1.0 12/2020
Credit Plus Benchmark 0.7 12/2020
Excess 0.2
BLACKROCK 504,519,551 14.2 0.7 12/2020
ICE BofA US 3-Month TreasuryBill
0.0 12/2020
Excess 0.7
OPPORTUNISTIC FIXEDINCOME
504,519,551 14.2 0.7 12/2020
ICE BofA US 3-Month TreasuryBill
12/2020
Excess
ASHMORE 251,702,992 7.1
JPM JEMB Sovereign-only 50-50
Excess
Minnesota State Board of InvestmentQuarter Ending December 31, 2020Return Seeking Bonds Managers
EMERGING MARKET DEBT
Emerging Market Debt Benchmark
Excess
251,702,992 7.1
0.0
0.7
Page 54

Ending Market Value Portfolio Weight Last Qtr Fiscal YTD 1 Year 3 Year 5 Year 10 Year Since Inception Inception Date
Return Seeking BondsManagersPAYDEN RYGEL $251,067,597 7.1%
Multi-Asset Credit Benchmark
Excess
PGIM 251,106,037 7.1
Multi-Asset Credit Benchmark
Excess
KKR 301,223,503 8.5
ICE BofA US Cash Pay HY Constrained
Excess
OAKTREE 251,717,122 7.1
ICE BofA US Cash Pay HY Constrained
Excess
RETURN SEEKING FIXEDINCOME
3,547,975,353 100.0 0.9 12/2020
Return Seeking BM 0.6 12/2020
Excess 0.3
Minnesota State Board of InvestmentQuarter Ending December 31, 2020Return Seeking Bonds Managers
Multi-Asset Credit
Multi-Asset Credit Benchmark
Excess
502,173,633 14.2
High Yield
ICE BofA US Cash Pay HY Constrained
Excess
552,940,625 15.6
Note: All Return Seeking Bonds Managers are included in the ending market value but only Columbia, Pimco and BlackRock are included in the return calculation. The other managers were funded mid-December 2020 and will have a reporting period start on 1/1/21.
Page 55

This page intentionally left blank.
Page 56

Fixed Income - TreasuriesDecember 31, 2020
Minnesota State Board of InvestmentQuarter Ending December 31, 2020
Page 57

Ending Market Value Portfolio Weight Last Qtr Fiscal YTD 1 Year 3 Year 5 Year 10 Year Since Inception Inception Date
Treasuries ManagersBLACKROCK $2,423,240,907 31.9% -1.8% -1.5% 12.5% 8.6% 02/2018
BBG BARC 5Y + Us Tsy Idx -1.9 -1.6 12.8 8.7 02/2018
Excess 0.0 0.1 -0.3 -0.2
GOLDMAN SACHS 2,580,200,662 34.0 -1.7 -1.3 12.7 8.7 02/2018
BBG BARC 5Y + Us Tsy Idx -1.9 -1.6 12.8 8.7 02/2018
Excess 0.2 0.4 -0.1 -0.0
NEUBERGER 2,592,186,589 34.1 -1.6 -1.1 12.8 8.6 02/2018
BBG BARC 5Y + Us Tsy Idx -1.9 -1.6 12.8 8.7 02/2018
Excess 0.2 0.5 -0.1 -0.1
TREASURIES TRANSITIONACCOUNT
0 0.0
Ending Market Value Portfolio Weight 1 Qtr Fiscal YTD 1 Year 3 Year 5 Year 10 Year Since Inception Inception Date
TOTAL TREASURIES 7,595,628,157 100.0 -1.7 -1.3 12.7 8.6% 02/2018
BBG BARC 5Y + Us Tsy Idx -1.9 -1.6 12.8 8.7% 02/2018
Excess 0.2 0.3 -0.2 -0.1%
Minnesota State Board of InvestmentQuarter Ending December 31, 2020Treasuries Managers
Page 58
2019 Calendar Return 2018 Calendar Return 2017 Calendar Return 2016 Calendar Return 2015 Calendar Return
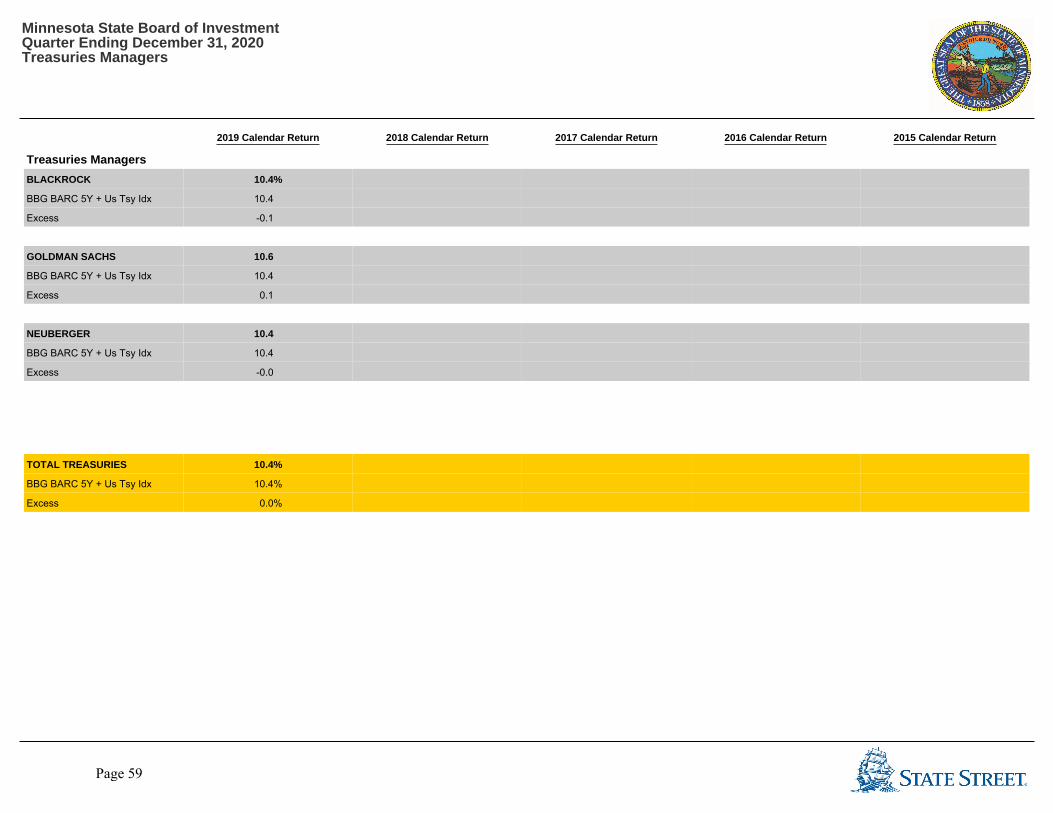
TOTAL TREASURIES 10.4%
BBG BARC 5Y + Us Tsy Idx 10.4%
Excess 0.0%
2019 Calendar Return 2018 Calendar Return 2017 Calendar Return 2016 Calendar Return 2015 Calendar Return
Treasuries ManagersBLACKROCK 10.4%
BBG BARC 5Y + Us Tsy Idx 10.4
Excess -0.1
GOLDMAN SACHS 10.6
BBG BARC 5Y + Us Tsy Idx 10.4
Excess 0.1
NEUBERGER 10.4
BBG BARC 5Y + Us Tsy Idx 10.4
Excess -0.0
Minnesota State Board of InvestmentQuarter Ending December 31, 2020Treasuries Managers
Page 59

This page intentionally left blank.
Page 60

Fixed Income - Laddered Bonds + CashDecember 31, 2020
Minnesota State Board of InvestmentQuarter Ending December 31, 2020
Page 61

Ending Market Value Portfolio Weight Last Qtr Fiscal YTD 1 Year 3 Year 5 Year 10 Year Since Inception Inception Date
Laddered Bond and CashManagersNeuberger Berman Ladder Bond $1,360,955,839 37.9% 0.1% 11/2020
ICE BofA US 3-Month TreasuryBill
0.0 11/2020
Excess 0.0
Goldman Sachs Ladder Bond 1,360,610,956 0.0 11/2020
ICE BofA US 3-Month TreasuryBill
0.0 11/2020
Excess 0.0
TEACHERS RETIREMENT CD REPO (1)
45,146,946 1.3 0.0
iMoneyNet Money Fund Average-All Taxable
0.0
Excess 0.0
Laddered Bond + Cash 3,595,337,857 100.0 0.1
ICE BofA US 3-Month TreasuryBill
0.0
Excess 0.1
Minnesota State Board of InvestmentQuarter Ending December 31, 2020Laddered Bond + Cash Managers
COMBINED PLAN CASH ACCOUNT (1)
828,624,116
iMoneyNet Money Fund Average-All Taxable
0.0
Excess 0.2
23.0 0.2%
37.8
(1) Prior to 10/1/2020 the returns for the cash accounts was not reported in this format.
10/2020
10/2020
10/2020
10/2020
11/2020
11/2020
Page 62
0.0
0.0
0.0
75.72,721,566,795Treasury Ladder Aggregate
ICE BofA US 3-Month TreasuryBill
Excess

Private Markets - UninvestedDecember 31, 2020
Minnesota State Board of InvestmentQuarter Ending December 31, 2020
Page 63

Ending Market Value Portfolio Weight Last Qtr Fiscal YTD 1 Year 3 Year 5 Year 10 Year Since Inception Inception Date
Uninvested PrivateMarkets ManagersNISA PRIVATE MKT UNINVOVERLAY
$2,156,999,215 29.0%
S&P 500 INDEX (DAILY)
Excess
BLACKROCK SP INDEX 5,293,158,075 71.0
S&P 500 INDEX (DAILY)
Excess
UNINVESTED PRIVATEPMARKETS
7,450,157,290 100.0
S&P 500 INDEX (DAILY)
Excess
Minnesota State Board of InvestmentQuarter Ending December 31, 2020Uninvested Private Markets Managers
Page 64

Private Markets - InvestedDecember 31, 2020
Minnesota State Board of InvestmentQuarter Ending December 31, 2020
Page 65
Private MarketsLast Qtr FYTD 1 Year 3 Year 5 Year 10 Year 20 Year 25 year 30 year
Private Markets - Invested 8.7% 15.3% 7.7% 9.9% 11.1% 11.5% 11.4% 13.4% 12.2%
Private Markets
The time-weighted rates of return for the Private Markets portfolio are shown here. Private Markets included Private Equity, Private Credit, Resources, and Real Estate. Some of theexisting investments are relatively immature and returns may not be indicative of future results.
Private Equity Investments
The objectives of the Private Equity portfolio, which may include leveraged buyouts, growth equity, venture capital and special situations, are to achieve attractive returns and to provideoverall portfolio diversification to the total plan.
Private Credit Investments
The objectives of the Private Credit portfolio, which may include mezzanine debt, direct lending, and other forms of non-investment grade fixed income instruments, are to achieve a hightotal return over a full market cycle and to provide some degree of downside protection and typically provide current income in the form of a coupon. In certain situations, investments inthe Private Credit portfolio also provide an equity component of return in the form of warrants or re-organized equity.
Resource Investments
The objectives of the Resources portfolio, which may include energy, infrastructure, and other hard assets, are to provide protection against the risks associated with inflation and toprovide overall portfolio diversification to the total plan.
Real Estate Investments
The objectives of the Real Estate portfolio, which may include core and non-core real estate investments, are to achieve attractive returns, preserve capital, provide protection against risksassociated with inflation, and provide overall portfolio diversification to the total plan.
The SBI also monitors Private Markets performance using money-weighted return metrics such as Internal Rate of Return and Multiple of Invested Capital. For money-weighted returnmetrics please refer to the Combined Funds Performance Report.
Last Qtr FYTD 1 Year 3 Year 5 Year 10 Year 20 Year 25 year 30 year
Private Equity 12.2% 21.0% 16.3% 15.7% 16.1% 15.1% 12.3% 15.5%
Private Credit 1.8 5.8 1.4 7.7 10.6 11.6 11.3
Resources 1.6 3.9 -16.3 -6.4 -3.0 1.4 11.6 12.6
Real Estate 3.8 6.4 4.4 8.4 8.5 11.1 8.4 9.6
Minnesota State Board of InvestmentQuarter Ending December 31, 2020Combined Funds
Combined Funds Asset Class Performance Summary
Private Markets - Uninvested
(S&P 500)
Page 66

Investments Commitments Contributions Distributions Remaining Commitment Market Value Investment
Multiple IRR VintageYear
Private Equity 16,970,973,939.34 11,438,172,333.68 10,374,067,579.99 6,556,319,326.72 7,689,249,774.39 1.58 12.72
Adams Street Partners, LLC 200,000,000.00 123,314,692.00 55,101,639.00 76,685,308.00 95,538,658.92 1.22 7.00Adams Street Global Secondary Fund 5 LP 100,000,000.00 77,114,692.00 48,900,493.00 22,885,308.00 45,033,450.50 1.22 5.13 2012Adams Street Global Secondary Fund 6 100,000,000.00 46,200,000.00 6,201,146.00 53,800,000.00 50,505,208.42 1.23 23.35 2017
Advent International Group 355,000,000.00 274,846,106.00 199,468,558.00 83,237,848.00 261,370,449.10 1.68 16.11Advent International GPE IX 115,000,000.00 42,262,150.00 0.00 72,737,850.00 50,822,348.48 1.20 26.36 2019Advent International GPE VI-A, L.P. 50,000,000.00 52,993,313.00 101,973,095.00 0.00 6,122,729.27 2.04 16.65 2008Advent International GPE VII, L.P. 90,000,000.00 84,690,641.00 97,495,463.00 5,400,000.00 58,053,696.07 1.84 14.64 2012Advent International GPE VIII-B 100,000,000.00 94,900,002.00 0.00 5,099,998.00 146,371,675.28 1.54 17.14 2016
Affinity Ventures 9,000,000.00 9,000,000.00 3,248,214.55 0.00 1,240,459.61 0.50 -12.61Affinity Ventures IV, L.P. 4,000,000.00 4,000,000.00 1,541,969.68 0.00 3,278.67 0.39 -41.00 2004Affinity Ventures V, L.P. 5,000,000.00 5,000,000.00 1,706,244.87 0.00 1,237,180.94 0.59 -8.98 2008
Apax Partners 500,000,000.00 383,094,267.88 322,479,436.59 172,311,750.02 329,873,490.12 1.70 17.73Apax IX USD L.P. 150,000,000.00 147,859,962.69 10,228,177.24 12,368,214.55 221,265,709.67 1.57 23.00 2016APAX VIII - USD 200,000,000.00 233,434,305.19 312,251,259.35 11,743,535.47 106,053,697.83 1.79 16.46 2013Apax X USD L.P. 150,000,000.00 1,800,000.00 0.00 148,200,000.00 2,554,082.62 1.42 41.89 2019
Arsenal Capital Partners 75,000,000.00 45,246,688.00 2,219,877.00 31,876,652.00 45,320,756.12 1.05 5.24Arsenal Capital Partners V, L.P. 75,000,000.00 45,246,688.00 2,219,877.00 31,876,652.00 45,320,756.12 1.05 5.24 2019
Asia Alternatives 299,000,000.00 55,633,461.00 2,837,699.00 244,350,891.00 54,264,090.01 1.03 2.47Asia Alternatives Capital Partners V 99,000,000.00 55,633,461.00 2,837,699.00 44,350,891.00 54,264,090.01 1.03 2.47 2017MN Asia Investors 200,000,000.00 0.00 0.00 200,000,000.00 0.00 0.00 2020
Banc Fund 276,801,386.55 264,844,295.64 209,219,835.10 11,957,090.91 142,581,382.47 1.33 7.36Banc Fund IX, L.P. 107,205,932.00 107,205,932.00 19,549,737.35 0.00 86,242,026.41 0.99 -0.33 2014Banc Fund VIII, L.P. 98,250,000.00 98,250,000.00 189,670,097.75 0.00 9,014,431.95 2.02 12.04 2008Banc Fund X, L.P. 71,345,454.55 59,388,363.64 0.00 11,957,090.91 47,324,924.11 0.80 -17.28 2018
BlackRock 250,000,000.00 106,555,839.96 2,660,744.66 143,444,160.04 122,154,016.59 1.17 11.00BlackRock Long Term Capital, SCSP 250,000,000.00 106,555,839.96 2,660,744.66 143,444,160.04 122,154,016.59 1.17 11.00 2019
Blackstone Group L.P. 840,000,000.00 477,742,607.55 568,152,647.94 430,738,923.08 208,942,127.00 1.63 15.39Blackstone Capital Partners IV, L.P. 70,000,000.00 84,459,883.57 200,025,997.73 1,832,302.08 1,542,414.10 2.39 37.02 2002Blackstone Capital Partners V L.P. 140,000,000.00 152,334,232.28 239,185,175.57 7,027,560.42 4,281,867.69 1.60 7.90 2006Blackstone Capital Partners VI, L.P. 100,000,000.00 106,152,089.86 113,824,807.01 11,175,309.23 58,814,291.16 1.63 11.81 2008Blackstone Capital Partners VII 130,000,000.00 134,796,401.84 15,116,667.63 10,703,751.35 144,303,554.05 1.18 9.81 2015Blackstone Capital Partners VIII LP 150,000,000.00 0.00 0.00 150,000,000.00 0.00 0.00 2019Blackstone Growth 250,000,000.00 0.00 0.00 250,000,000.00 0.00 0.00 2020
Blackstone Strategic Partners 815,500,000.00 570,526,171.79 644,840,541.91 309,362,654.43 181,295,360.23 1.45 10.21Strategic Partners III VC, L.P. 25,000,000.00 25,056,898.97 33,788,877.46 1,010,804.31 376,102.55 1.36 5.99 2004Strategic Partners III-B, L.P. 100,000,000.00 79,581,947.61 118,286,610.74 14,851,675.77 394,388.02 1.49 6.35 2004Strategic Partners IV VC, L.P. 40,500,000.00 42,113,513.60 60,558,526.94 2,309,316.11 3,011,181.07 1.51 9.05 2008Strategic Partners IV-B 100,000,000.00 99,291,020.64 147,370,440.18 17,529,308.03 6,896,983.18 1.55 12.12 2008Strategic Partners V, LP 100,000,000.00 86,835,512.53 124,947,624.04 35,262,293.30 14,262,821.38 1.60 18.51 2011Strategic Partners VI, L.P. 150,000,000.00 100,778,759.69 106,055,253.08 55,567,937.43 36,198,736.72 1.41 13.71 2014Strategic Partners VII, L.P. 150,000,000.00 102,822,746.65 48,958,209.47 62,072,495.77 80,343,332.11 1.26 11.04 2016Strategic Partners VIII 150,000,000.00 34,045,772.10 4,875,000.00 120,758,823.71 39,811,815.20 1.31 26.97 2018
Bridgepoint 177,498,634.41 69,134,009.80 13,311,036.26 108,364,624.61 70,751,147.68 1.22 25.75
Minnesota State Board of Investment - Alternative Investments - As of December 31, 2020
Page 67

Investments Commitments Contributions Distributions Remaining Commitment Market Value Investment
Multiple IRR VintageYear
Bridgepoint Europe VI L.P. 177,498,634.41 69,134,009.80 13,311,036.26 108,364,624.61 70,751,147.68 1.22 25.75 2018Brookfield Asset Management Inc. 350,000,000.00 194,810,049.11 133,817,792.76 175,591,517.91 201,311,213.93 1.72 44.92
Brookfield Capital Partners Fund IV 100,000,000.00 98,968,057.54 133,817,792.76 21,433,509.48 102,468,026.24 2.39 51.31 2015Brookfield Capital Partners V L.P. 250,000,000.00 95,841,991.57 0.00 154,158,008.43 98,843,187.69 1.03 3.54 2018
CVC Capital Partners 395,126,603.61 424,349,522.89 426,578,895.11 41,088,404.17 284,603,009.09 1.68 15.73CVC Capital Partners VI 261,062,820.02 270,536,477.61 134,136,811.22 39,340,882.47 277,286,681.77 1.52 13.95 2013CVC European Equity Partners V, L.P. 134,063,783.59 153,813,045.28 292,442,083.89 1,747,521.70 7,316,327.32 1.95 16.83 2008
Cardinal Partners 10,000,000.00 10,000,000.00 39,196,082.23 0.00 30,659.00 3.92 10.61DSV Partners IV 10,000,000.00 10,000,000.00 39,196,082.23 0.00 30,659.00 3.92 10.61 1985
Carlyle Group 150,000,000.00 73,607,469.00 4,013,081.00 80,405,612.00 65,538,291.92 0.94 -5.35Carlyle Partners VII, L.P. 150,000,000.00 73,607,469.00 4,013,081.00 80,405,612.00 65,538,291.92 0.94 -5.35 2017
Chicago Growth Partners 110,000,000.00 106,497,626.00 193,069,552.29 3,302,374.00 1,047,707.95 1.82 12.48Chicago Growth Partners II, L.P. 60,000,000.00 58,347,626.00 123,371,040.00 1,652,374.00 542,481.50 2.12 19.55 2008William Blair Capital Partners VII, L.P. 50,000,000.00 48,150,000.00 69,698,512.29 1,650,000.00 505,226.45 1.46 8.58 2001
Court Square 500,000,000.00 394,122,863.00 435,664,827.00 142,635,939.00 216,647,001.94 1.66 13.69Court Square Capital Partners II, L.P. 175,000,000.00 170,245,186.00 295,260,304.00 16,396,790.00 9,744,281.12 1.79 12.56 2006Court Square Capital Partners III, L.P. 175,000,000.00 184,101,141.00 136,401,588.00 12,081,239.00 163,093,838.88 1.63 16.95 2012Court Square Capital Partners IV, L.P. 150,000,000.00 39,776,536.00 4,002,935.00 114,157,910.00 43,808,881.94 1.20 22.27 2018
Crescendo 101,500,000.00 103,101,226.00 57,982,653.94 0.00 274,403.70 0.57 -4.61Crescendo Ventures IV 101,500,000.00 103,101,226.00 57,982,653.94 0.00 274,403.70 0.57 -4.61 2000
GTCR 210,000,000.00 209,762,417.00 365,405,587.30 15,514,972.00 113,363,465.55 2.28 24.96GTCR Fund X 100,000,000.00 104,934,096.00 202,619,633.30 6,751,396.00 6,163,671.52 1.99 21.11 2010GTCR XI 110,000,000.00 104,828,321.00 162,785,954.00 8,763,576.00 107,199,794.03 2.58 32.90 2013
Goldman, Sachs & Co. 549,800,000.00 396,047,630.81 383,894,381.02 184,956,023.37 189,353,126.70 1.45 13.56GS Capital Partners V, L.P. 100,000,000.00 74,319,006.00 191,435,136.00 1,041,099.00 1,097,949.00 2.59 18.25 2005GS Capital Partners VI, L.P. 100,000,000.00 110,258,192.00 134,253,920.00 2,551,356.00 9,701,265.75 1.31 7.09 2007GS China-US Cooperation Fund 99,800,000.00 15,144,445.00 0.00 84,830,000.00 11,154,730.83 0.74 -18.50 2018GS Vintage VII 100,000,000.00 79,866,512.81 27,865,036.02 48,118,662.37 72,541,149.94 1.26 12.34 2016West Street Capital Partners VII, L.P. 150,000,000.00 116,459,475.00 30,340,289.00 48,414,906.00 94,858,031.18 1.08 4.78 2016
Goldner Hawn Johnson & Morrison 77,755,137.50 28,476,830.35 12,806,955.48 49,450,274.41 37,919,378.61 1.78 14.44GHJM TrailHead Fund 20,000,000.00 16,070,803.36 12,806,955.48 3,935,812.65 25,464,111.58 2.38 15.15 2012Goldner Hawn Fund VII, L.P. 57,755,137.50 12,406,026.99 0.00 45,514,461.76 12,455,267.03 1.00 0.43 2018
Green Equity Investors 325,000,000.00 236,546,461.57 165,677,228.52 124,997,330.35 237,926,288.25 1.71 14.25Green Equity Investors VI, L.P. 200,000,000.00 220,093,989.57 165,677,228.52 16,449,802.35 221,600,072.52 1.76 14.26 2012Green Equity Investors VIII 125,000,000.00 16,452,472.00 0.00 108,547,528.00 16,326,215.73 0.99 -2.79 2020
HarbourVest* 21,683,349.30 20,931,185.31 21,298,740.75 838,305.24 8,152,838.46 1.41 11.51Dover Street VII Cayman Fund L.P. 2,198,112.00 2,073,906.00 1,662,612.00 132,416.00 202,972.85 0.90 -4.72 2014HarbourVest Intl PE Partners V-Cayman US 3,536,372.85 3,345,451.64 4,099,860.80 195,767.99 447,692.31 1.36 14.06 2014Harbourvest Intl PE Partners VI-Cayman 4,251,255.44 4,039,119.67 3,545,249.95 214,121.24 3,550,355.36 1.76 15.75 2014HarbourVest Partners VIII Cayman Buyout 4,506,711.00 4,387,189.00 5,055,020.00 156,000.00 924,562.25 1.36 12.87 2014HarbourVest Partners VIII-Cayman Venture 7,190,898.00 7,085,519.00 6,935,998.00 140,000.00 3,027,255.69 1.41 10.06 2014
Hellman & Friedman 400,000,000.00 300,965,118.00 438,758,078.35 99,518,164.00 117,974,414.51 1.85 14.68Hellman & Friedman Capital Partners VI, L.P. 175,000,000.00 171,037,755.00 315,233,005.35 5,084,864.00 3,067,573.73 1.86 12.91 2007Hellman & Friedman Capital Partners VII, L.P. 50,000,000.00 49,856,571.00 123,525,073.00 2,245,784.00 31,191,946.97 3.10 24.73 2009Hellman & Friedman Investors IX, L.P. 175,000,000.00 80,070,792.00 0.00 92,187,516.00 83,714,893.81 1.05 9.67 2018
IK Limited 516,750,102.77 354,856,585.80 317,599,131.81 169,498,502.39 223,581,633.73 1.53 13.37
Page 68

Investments Commitments Contributions Distributions Remaining Commitment Market Value Investment
Multiple IRR Vintage Year
IK Fund IX 164,956,434.88 4,917,603.41 0.00 160,038,455.05 2,316,342.00 0.47 -98.05 2019IK Fund VII 180,988,230.50 178,082,352.52 215,835,488.36 9,279,735.90 93,700,954.15 1.74 13.50 2013IK Fund VIII 170,805,437.39 171,856,629.87 101,763,643.45 180,311.44 127,564,337.58 1.33 13.58 2016
Kohlberg, Kravis, Roberts & Co. 900,000,000.00 634,038,843.00 783,693,890.00 307,845,122.00 294,996,360.03 1.70 12.98KKR 2006 Fund L.P. 200,000,000.00 218,952,993.00 341,385,674.00 3,300,979.00 43,620,489.53 1.76 9.01 2006KKR Americas Fund XII L.P. 150,000,000.00 96,440,792.00 4,217,501.00 60,699,138.00 127,706,549.11 1.37 18.94 2016KKR Asian Fund III 100,000,000.00 72,152,965.00 13,144,687.00 35,169,528.00 78,878,193.22 1.28 19.65 2017KKR Asian Fund IV 150,000,000.00 0.00 0.00 150,000,000.00 0.00 0.00 2020KKR Europe V 100,000,000.00 41,324,523.00 0.00 58,675,477.00 44,629,203.78 1.08 14.73 2018KKR Millennium Fund 200,000,000.00 205,167,570.00 424,946,028.00 0.00 161,924.39 2.07 16.37 2002
Lexington Partners 1,200,000,000.00 680,502,231.00 523,694,084.00 568,266,574.82 427,435,596.67 1.40 11.90Lexington Capital Partners IX, L.P. 150,000,000.00 37,724,234.00 7,877,184.00 117,713,253.00 40,238,404.42 1.28 79.24 2018Lexington Capital Partners VI-B, L.P. 100,000,000.00 98,374,022.00 140,507,375.01 1,634,703.00 5,329,391.71 1.48 7.88 2005Lexington Capital Partners VII, L.P. 200,000,000.00 172,466,709.00 237,182,550.99 38,059,995.00 37,026,651.45 1.59 14.15 2009Lexington Capital Partners VIII, L.P. 150,000,000.00 134,716,285.00 87,554,133.00 33,785,551.99 95,100,996.13 1.36 14.40 2014Lexington Co-Investment Partners IV 200,000,000.00 196,831,669.00 45,469,492.00 17,462,383.83 212,270,366.47 1.31 16.19 2017Lexington Co-Investment Partners V 300,000,000.00 0.00 0.00 300,000,000.00 0.00 0.00 2020Lexington Middle Market Investors IV 100,000,000.00 40,389,312.00 5,103,349.00 59,610,688.00 37,469,786.49 1.05 6.99 2016
Madison Dearborn Capital Partners LLC 200,000,000.00 104,244,870.00 12,709,639.00 108,428,022.00 115,705,644.42 1.23 10.01Madison Dearborn Capital Partners VII, L.P. 100,000,000.00 92,241,775.00 12,709,639.00 20,431,117.00 102,583,955.90 1.25 9.64 2015Madison Dearborn Capital Partners VIII-A, L.P 100,000,000.00 12,003,095.00 0.00 87,996,905.00 13,121,688.52 1.09 9.32 2019
Neuberger Berman LLC 625,000,000.00 277,426,781.79 168,899,617.94 480,152,166.48 190,512,821.52 1.31 23.41Dyal Capital Partners III 175,000,000.00 189,172,342.80 154,887,797.83 104,759,374.14 108,933,161.75 1.39 24.32 2015Dyal Capital Partners IV 250,000,000.00 77,254,438.99 14,011,820.11 186,392,792.34 70,579,659.77 1.09 16.06 2018Dyal Capital Partners V 200,000,000.00 11,000,000.00 0.00 189,000,000.00 11,000,000.00 1.00 2020
Nordic Capital 517,487,489.97 334,687,344.13 178,775,916.84 255,195,924.79 317,975,681.69 1.48 16.16Nordic Capital Fund VIII 178,614,166.48 209,887,520.06 174,001,905.16 41,122,425.37 143,917,382.67 1.51 13.16 2013Nordic Capital Fund X 165,179,244.60 0.00 0.00 165,179,244.60 0.00 0.00 2020Nordic Capital IX Beta, L.P. 173,694,078.89 124,799,824.07 4,774,011.68 48,894,254.82 174,058,299.02 1.43 47.96 2017
North Sky Capital* 2,454,339.00 1,998,089.00 2,260,406.13 456,250.00 476,649.74 1.37 12.32North Sky Capital LBO Fund III, LP 1,070,259.00 720,259.00 890,943.41 350,000.00 172,431.97 1.48 14.16 2014North Sky Capital Venture Fund III, LP 1,384,080.00 1,277,830.00 1,369,462.72 106,250.00 304,217.77 1.31 11.10 2014
Oak Hill Capital Management, Inc. 250,000,000.00 156,831,197.95 104,755,534.23 114,965,237.55 100,311,584.10 1.31 21.85Oak Hill Capital Partners IV Onshore LP 150,000,000.00 145,591,858.70 104,755,534.23 26,204,576.80 93,584,434.94 1.36 23.68 2016Oak Hill Capital Partners V 100,000,000.00 11,239,339.25 0.00 88,760,660.75 6,727,149.16 0.60 -40.15 2018
Paine & Partners, LLC 225,000,000.00 87,876,776.00 35,529,483.00 138,747,516.97 69,667,966.98 1.20 7.43Paine Schwartz Food Chain Fund IV 75,000,000.00 63,736,766.00 34,978,344.00 12,336,387.97 48,628,874.98 1.31 8.83 2014Paine Schwartz Food Chain Fund V, L.P. 150,000,000.00 24,140,010.00 551,139.00 126,411,129.00 21,039,092.00 0.89 -17.08 2018
Permal PE* 5,337,098.00 4,386,677.43 3,831,251.28 1,090,000.00 818,416.83 1.06 2.30Glouston Private Equity Opportunities IV 5,337,098.00 4,386,677.43 3,831,251.28 1,090,000.00 818,416.83 1.06 2.30 2014
Permira 467,570,937.23 357,481,668.21 266,860,124.68 148,373,152.44 465,605,373.87 2.05 23.49Permira V, L.P. 179,113,420.33 181,290,272.30 238,732,308.98 19,807,035.80 236,418,986.70 2.62 23.51 2013Permira VI, L.P. 139,536,556.17 122,910,380.82 28,127,815.70 32,926,171.00 169,003,933.92 1.60 23.19 2016Permira VII L.P.1 148,920,960.73 53,281,015.09 0.00 95,639,945.64 60,182,453.25 1.13 23.84 2019
Public Pension Capital Management 175,000,000.00 87,768,185.84 78,311,483.10 100,062,710.24 80,767,806.67 1.81 23.25Public Pension Capital, LLC 175,000,000.00 87,768,185.84 78,311,483.10 100,062,710.24 80,767,806.67 1.81 23.25 2014
Page 69

Investments Commitments Contributions Distributions Remaining Commitment Market Value Investment
Multiple IRR Vintage Year
Silver Lake Partners 435,000,000.00 406,867,451.93 457,880,840.15 37,610,175.11 338,696,780.01 1.96 15.57Silver Lake Partners II, L.P. 100,000,000.00 90,200,746.70 171,694,975.15 11,771,953.34 85,376.00 1.90 11.02 2004Silver Lake Partners III, L.P. 100,000,000.00 93,699,368.23 187,575,747.00 9,422,179.77 23,375,328.15 2.25 18.46 2007Silver Lake Partners IV 100,000,000.00 113,099,700.00 97,461,894.00 4,168,036.00 147,635,795.87 2.17 25.37 2012Silver Lake Partners V, L.P. 135,000,000.00 109,867,637.00 1,148,224.00 12,248,006.00 167,600,279.99 1.54 32.39 2017
Split Rock 110,000,000.00 107,055,906.00 121,560,810.00 2,944,094.00 24,808,996.02 1.37 4.67Split Rock Partners II, LP 60,000,000.00 59,165,000.00 62,766,618.00 835,000.00 20,395,327.36 1.41 6.47 2008Split Rock Partners LP 50,000,000.00 47,890,906.00 58,794,192.00 2,109,094.00 4,413,668.66 1.32 3.38 2005
Summit Partners 350,000,000.00 300,551,297.27 244,620,901.27 127,793,880.00 273,742,933.65 1.72 27.36Summit Partners Growth Equity Fund IX 100,000,000.00 114,794,107.00 38,572,398.00 23,778,291.00 139,055,704.12 1.55 28.84 2015Summit Partners Growth Equity Fund VIII 100,000,000.00 116,727,192.27 206,048,503.27 23,045,587.00 60,375,539.29 2.28 26.86 2011Summit Partners Growth Equity Fund X-A 150,000,000.00 69,029,998.00 0.00 80,970,002.00 74,311,690.24 1.08 41.85 2019
TPG Capital 250,000,000.00 119,326,788.00 53,528,411.20 139,963,287.00 103,297,876.05 1.31 12.24TPG Partners VII, L.P. 100,000,000.00 96,934,941.00 51,829,854.20 10,656,577.00 88,586,498.15 1.45 14.48 2015TPG Partners VIII 150,000,000.00 22,391,847.00 1,698,557.00 129,306,710.00 14,711,377.90 0.73 -37.75 2018
Thoma Bravo LLC 425,000,000.00 249,556,852.00 204,013,131.80 240,449,292.00 242,878,472.99 1.79 24.40Thoma Bravo Fund XII, L.P. 75,000,000.00 77,206,077.00 19,709,712.00 17,574,870.00 107,609,789.32 1.65 17.88 2016Thoma Bravo Fund XIII, L.P. 150,000,000.00 122,350,775.00 77,245,480.00 72,874,422.00 134,815,358.76 1.73 62.48 2018Thoma Bravo Fund XIV 150,000,000.00 0.00 0.00 150,000,000.00 0.00 0.00 2020Thoma Cressey Fund VII, L.P. 50,000,000.00 50,000,000.00 107,057,939.80 0.00 453,324.91 2.15 23.58 2000
Thomas H. Lee Partners 250,000,000.00 173,278,191.00 111,229,162.00 96,232,087.00 195,050,316.22 1.77 32.31Thomas H. Lee Equity Fund VII, LP. 100,000,000.00 98,994,098.00 100,139,732.00 11,168,059.00 101,583,244.59 2.04 29.95 2015Thomas H. Lee Equity Fund VIII, L.P. 150,000,000.00 74,284,093.00 11,089,430.00 85,064,028.00 93,467,071.63 1.41 52.75 2018
Thomas, McNerney & Partners 80,000,000.00 78,125,000.00 122,735,180.44 1,875,000.00 6,615,941.82 1.66 8.46Thomas, McNerney & Partners I, L.P. 30,000,000.00 30,000,000.00 15,087,143.17 0.00 2,740,257.19 0.59 -7.93 2002Thomas, McNerney & Partners II, L.P. 50,000,000.00 48,125,000.00 107,648,037.27 1,875,000.00 3,875,684.63 2.32 16.55 2006
Vestar Capital Partners 380,000,000.00 277,322,318.73 350,993,601.52 111,711,788.47 93,588,184.55 1.60 11.30Vestar Capital Partners IV, L.P. 55,000,000.00 55,652,023.63 102,293,320.28 57,313.00 372,620.04 1.84 14.63 1999Vestar Capital Partners V, L.P. 75,000,000.00 76,772,265.14 98,507,989.57 0.00 3,058,646.69 1.32 3.96 2005Vestar Capital Partners VI, LP 100,000,000.00 106,516,978.20 150,071,483.32 35,527.23 46,378,590.24 1.84 24.45 2011Vestar Capital Partners VII, L.P. 150,000,000.00 38,381,051.76 120,808.35 111,618,948.24 43,778,327.58 1.14 7.86 2017
Vista Equity Partners 200,000,000.00 69,166,924.00 0.00 132,045,979.00 67,074,152.34 0.97 -3.03Vista Equity Partners 200,000,000.00 69,166,924.00 0.00 132,045,979.00 67,074,152.34 0.97 -3.03 2020
Warburg Pincus 1,216,000,000.00 1,017,485,506.90 1,068,937,606.95 204,998,500.00 537,907,734.47 1.58 11.25Warburg Pincus China-Southeast Asia II 50,000,000.00 8,700,000.00 960,000.00 41,300,000.00 7,982,083.98 1.03 5.32 2019Warburg Pincus China, L.P. 45,000,000.00 44,460,000.00 9,340,200.00 2,475,000.00 57,965,063.44 1.51 19.16 2016Warburg Pincus Financial Sector 90,000,000.00 71,860,808.22 4,590,000.00 22,455,000.00 79,121,019.73 1.16 11.49 2017Warburg Pincus Global Growth, L.P. 250,000,000.00 112,522,089.05 0.00 137,000,000.00 112,108,317.00 1.00 -0.58 2018Warburg Pincus Private Equity IX, L.P. 100,000,000.00 100,000,000.00 169,104,300.71 0.00 3,286,437.00 1.72 9.63 2005Warburg Pincus Private Equity VIII, LP 100,000,000.00 100,368,657.25 229,106,755.46 0.00 11,011.21 2.28 14.74 2002Warburg Pincus Private Equity X, LP 150,000,000.00 150,000,000.00 249,536,237.55 0.00 15,059,378.66 1.76 9.35 2007Warburg Pincus Private Equity XI, LP 200,000,000.00 200,342,452.38 216,017,747.60 0.00 110,495,533.24 1.63 12.15 2012Warburg Pincus Private Equity XII, LP 131,000,000.00 129,231,500.00 26,740,113.00 1,768,500.00 151,485,163.98 1.38 12.61 2015Warburg, Pincus Equity Partners, L.P. 100,000,000.00 100,000,000.00 163,542,252.63 0.00 393,726.23 1.64 10.03 1998
Wellspring Capital Partners 125,000,000.00 60,275,817.00 0.00 64,724,183.00 61,517,559.11 1.02 1.64Wellspring Capital Partners VI, L.P. 125,000,000.00 60,275,817.00 0.00 64,724,183.00 61,517,559.11 1.02 1.64 2016
Page 70

Investments Commitments Contributions Distributions Remaining Commitment Market Value Investment
Multiple IRR Vintage Year
Welsh, Carson, Anderson & Stowe 500,000,000.00 299,894,250.00 253,233,983.36 200,105,750.00 244,279,719.87 1.66 16.42Welsh, Carson, Anderson & Stowe XI, L.P. 100,000,000.00 100,000,000.00 130,320,188.36 0.00 31,624,304.77 1.62 11.46 2008Welsh, Carson, Anderson & Stowe XII, L.P. 150,000,000.00 141,784,300.00 122,913,795.00 8,215,700.00 153,150,361.42 1.95 26.84 2014Welsh, Carson, Anderson & Stowe XIII, L.P. 250,000,000.00 58,109,950.00 0.00 191,890,050.00 59,505,053.68 1.02 5.19 2018
Whitehorse Capital 200,000,000.00 113,658,439.72 27,232,844.51 107,522,648.41 100,718,579.74 1.13 22.76Whitehorse Liquidity Partners III 100,000,000.00 77,838,323.17 21,701,195.03 37,834,838.35 66,423,701.48 1.13 16.97 2019Whitehorse Liquidity Partners IV 100,000,000.00 35,820,116.55 5,531,649.48 69,687,810.06 34,294,878.26 1.11 17.86 2020
Wind Point Partners 100,000,000.00 20,269,197.00 0.00 79,735,406.00 17,826,378.31 0.88 -17.31Wind Point Partners IX 100,000,000.00 20,269,197.00 0.00 79,735,406.00 17,826,378.31 0.88 -17.31 2019
Windjammer Capital Investors 266,708,861.00 184,082,605.32 179,476,459.02 84,897,258.51 105,916,875.53 1.55 10.23Windjammer Mezzanine & Equity Fund II 66,708,861.00 55,215,683.94 84,876,799.79 1,013,935.66 63,278.13 1.54 8.94 2000Windjammer Senior Equity Fund IV, L.P. 100,000,000.00 94,740,728.38 93,392,762.23 16,802,618.85 75,005,320.15 1.78 13.41 2012Windjammer Senior Equity Fund V, L.P. 100,000,000.00 34,126,193.00 1,206,897.00 67,080,704.00 30,848,277.25 0.94 -5.92 2017
Private Credit 3,005,177,583.79 2,020,355,246.50 1,750,884,138.88 1,146,447,121.46 855,568,719.63 1.29 9.50
Audax Group 300,000,000.00 170,374,110.25 151,517,331.19 142,300,020.48 60,475,772.30 1.24 9.78Audax Mezzanine Fund III, L.P. 100,000,000.00 100,311,771.85 117,649,068.38 1,326,350.82 15,347,260.91 1.33 9.88 2010Audax Mezzanine Fund IV-A, L.P. 100,000,000.00 70,062,338.40 33,868,262.81 40,973,669.66 45,128,511.39 1.13 9.33 2015Audax Mezzanine Fund V 100,000,000.00 0.00 0.00 100,000,000.00 0.00 0.00 2020
BlackRock 97,500,000.00 69,802,405.46 6,057,159.59 27,697,594.54 68,507,989.65 1.07 4.87BlackRock Middle Market Senior Fund 97,500,000.00 69,802,405.46 6,057,159.59 27,697,594.54 68,507,989.65 1.07 4.87 2018
Energy Capital Partners 100,000,000.00 11,315,653.00 2,020,283.00 90,704,630.00 8,548,335.09 0.93 -9.67Energy Capital Credit Solutions II-A 100,000,000.00 11,315,653.00 2,020,283.00 90,704,630.00 8,548,335.09 0.93 -9.67 2018
Gold Hill 65,852,583.79 65,852,583.79 112,080,755.77 0.00 4,655,640.15 1.77 11.86Gold Hill 2008 25,852,583.79 25,852,583.79 46,819,153.54 0.00 4,507,169.87 1.99 14.69 2008Gold Hill Venture Lending 40,000,000.00 40,000,000.00 65,261,602.23 0.00 148,470.28 1.64 10.68 2004
Goldman, Sachs & Co. 250,000,000.00 261,164,272.00 315,121,215.00 47,422,591.00 1,960,682.00 1.21 6.80GS Mezzanine Partners 2006 Institutional 100,000,000.00 113,454,150.00 134,861,849.00 9,858,563.00 794,228.00 1.20 5.00 2006GS Mezzanine Partners V, L.P. 150,000,000.00 147,710,122.00 180,259,366.00 37,564,028.00 1,166,454.00 1.23 9.08 2007
HPS Investment Partners 100,000,000.00 41,423,491.44 7,817,048.59 65,512,508.89 36,981,902.37 1.08 13.54HPS Mezzanine Partners 2019, L.P. 100,000,000.00 41,423,491.44 7,817,048.59 65,512,508.89 36,981,902.37 1.08 13.54 2019
Kohlberg, Kravis, Roberts & Co. 274,000,000.00 209,191,479.00 127,426,500.00 109,388,464.00 111,247,678.80 1.14 8.00KKR Lending Partner II L.P. 75,000,000.00 86,566,321.00 79,747,153.00 8,802,924.00 12,308,964.97 1.06 3.26 2015KKR Lending Partners III L.P. 199,000,000.00 122,625,158.00 47,679,347.00 100,585,540.00 98,938,713.83 1.20 13.08 2017
LBC Credit Partners 200,000,000.00 103,100,360.13 45,417,945.72 120,774,378.02 74,470,563.50 1.16 9.08LBC Credit Partners IV, L.P. 100,000,000.00 89,658,387.41 44,901,945.98 34,274,378.02 60,183,419.00 1.17 8.57 2016LBC Credit Partners V, L.P. 100,000,000.00 13,441,972.72 515,999.74 86,500,000.00 14,287,144.50 1.10 27.31 2019
Marathon 100,000,000.00 46,022,007.74 723,102.09 55,000,000.00 51,088,500.00 1.13 12.38Marathon Secured Private Strategies Fund II 100,000,000.00 46,022,007.74 723,102.09 55,000,000.00 51,088,500.00 1.13 12.38 2019
Merit Capital Partners 312,825,000.00 226,693,050.34 241,440,771.71 86,065,149.99 114,162,618.27 1.57 11.08Merit Mezzanine Fund IV, L.P. 75,000,000.00 70,178,571.42 139,120,463.35 4,821,428.58 696,972.30 1.99 11.58 2004Merit Mezzanine Fund V, LP 75,000,000.00 71,044,897.97 78,439,711.39 3,955,102.03 31,476,085.63 1.55 9.65 2009Merit Mezzanine Fund VI 100,000,000.00 85,469,580.95 23,880,596.97 14,463,619.38 81,989,560.34 1.24 11.97 2016Merit Mezzanine Fund VII 62,825,000.00 0.00 0.00 62,825,000.00 0.00 0.00 2020
Oaktree Capital Management, LLC 200,000,000.00 39,712,500.00 1,142,539.00 160,287,500.00 40,971,699.65 1.06 14.39
Page 71

Investments Commitments Contributions Distributions Remaining Commitment Market Value Investment
Multiple IRR Vintage Year
Oaktree Real Estate Debt III 200,000,000.00 39,712,500.00 1,142,539.00 160,287,500.00 40,971,699.65 1.06 14.39 2020Portfolio Advisors LLC 100,000,000.00 80,867,108.33 96,478,979.85 936,315.05 379,664.54 1.20 7.49
IP III Mezzanine Partners, L.P. 100,000,000.00 80,867,108.33 96,478,979.85 936,315.05 379,664.54 1.20 7.49 2006Prudential Global Investment Mgmt 550,000,000.00 435,648,493.31 422,189,408.46 156,129,198.02 179,522,975.72 1.38 10.23
PGIM Capital Partners VI, L.P. 100,000,000.00 0.00 0.00 100,000,000.00 0.00 0.00 2020Prudential Capital Partners II, L.P. 100,000,000.00 97,418,748.23 136,427,860.16 11,049,051.89 3,899,222.62 1.44 8.63 2005Prudential Capital Partners III, L.P. 100,000,000.00 102,368,765.60 173,303,122.49 13,873,783.24 2,645,385.41 1.72 14.10 2009Prudential Capital Partners IV 100,000,000.00 111,117,725.36 89,745,681.86 2,184,792.33 52,163,751.43 1.28 8.17 2012Prudential Capital Partners V, L.P. 150,000,000.00 124,743,254.12 22,712,743.95 29,021,570.56 120,814,616.26 1.15 7.73 2016
Summit Partners 95,000,000.00 100,002,496.70 132,650,821.69 22,100,132.00 7,991,656.53 1.41 9.33Summit Subordinated Debt Fund III, L.P. 45,000,000.00 44,088,493.92 60,443,092.91 2,250,000.00 3,856,385.70 1.46 8.87 2004Summit Subordinated Debt Fund IV, L.P. 50,000,000.00 55,914,002.78 72,207,728.78 19,850,132.00 4,135,270.83 1.37 10.06 2008
TCW 260,000,000.00 159,185,235.01 88,800,277.22 62,128,639.47 94,603,041.06 1.15 7.36TCW Direct Lending LLC 100,000,000.00 83,599,651.81 72,246,878.20 25,329,408.97 26,744,107.11 1.18 6.62 2014TCW Direct Lending VII 100,000,000.00 69,585,583.20 16,553,399.02 36,799,230.50 61,857,967.95 1.13 9.81 2018TCW TALF Opportunities Fund 60,000,000.00 6,000,000.00 0.00 0.00 6,000,966.00 1.00 0.02 2020
Real Assets 4,147,571,518.00 3,670,517,014.06 2,115,115,666.84 735,390,723.32 1,734,154,284.46 1.05 1.48
BlackRock 198,500,000.00 102,565,717.96 20,469,747.94 102,897,426.00 87,567,768.70 1.05 2.70BlackRock Global Renewable Power Fund II 98,500,000.00 89,988,765.96 20,429,936.64 15,474,378.00 75,874,624.27 1.07 3.14 2017BlackRock Global Renewable Power Infrastructure III 100,000,000.00 12,576,952.00 39,811.30 87,423,048.00 11,693,144.43 0.93 -12.10 2019
EIG Global Energy Partners 450,000,000.00 460,714,195.64 332,226,266.19 82,090,869.35 149,831,853.47 1.05 1.29EIG Energy Fund XIV 100,000,000.00 113,459,470.15 95,309,310.22 2,761,129.24 4,563,817.05 0.88 -4.77 2007EIG Energy Fund XV 150,000,000.00 159,823,963.65 139,398,551.97 22,871,322.62 28,150,870.31 1.05 1.23 2010EIG Energy Fund XVI 200,000,000.00 187,430,761.84 97,518,404.00 56,458,417.49 117,117,166.11 1.15 4.31 2013
Encap Energy 400,000,000.00 416,304,206.40 298,485,824.11 18,727,082.97 112,048,575.10 0.99 -0.65EnCap Energy Capital Fund VII, L.P. 100,000,000.00 105,388,243.96 135,600,208.68 0.00 2,420,369.73 1.31 14.15 2007EnCap Energy Capital Fund VIII, L.P. 100,000,000.00 103,335,766.37 54,781,242.63 470,043.98 19,404,304.67 0.72 -9.82 2010EnCap Energy Capital Fund X, L.P. 100,000,000.00 94,984,030.73 21,939,160.31 13,246,667.66 63,985,475.52 0.90 -3.66 2015Encap Energy Fund IX 100,000,000.00 112,596,165.34 86,165,212.49 5,010,371.33 26,238,425.18 1.00 -0.07 2012
Energy & Minerals Group 680,000,000.00 659,593,985.00 359,375,714.00 58,169,661.00 438,170,111.34 1.21 5.55NGP Midstream & Resources, L.P. 100,000,000.00 103,565,615.00 179,560,149.00 17,857.00 4,744,870.21 1.78 13.31 2007The Energy & Minerals Group Fund II, L.P. 100,000,000.00 106,674,084.00 104,295,500.00 170,365.00 89,492,447.83 1.82 12.80 2011The Energy & Minerals Group Fund III, L.P. 200,000,000.00 201,327,783.00 22,410,545.00 1,284,543.00 95,069,897.12 0.58 -10.31 2014The Energy & Minerals Group Fund IV, LP 150,000,000.00 154,434,353.00 51,835,123.00 18,487,666.00 142,029,331.51 1.26 8.00 2015The Energy & Minerals Group Fund V 112,500,000.00 79,270,469.00 1,115,700.00 34,782,014.00 89,806,309.23 1.15 11.20 2019The Energy & Minerals Group Fund V Accordion, LP 17,500,000.00 14,321,681.00 158,697.00 3,427,216.00 17,027,255.44 1.20 15.33 2019
Energy Capital Partners 450,000,000.00 369,377,250.00 267,672,773.00 166,017,458.00 202,470,361.29 1.27 8.55Energy Capital Partners II-A 100,000,000.00 85,722,480.00 112,434,332.00 29,749,110.00 4,676,149.98 1.37 8.94 2010Energy Capital Partners III, L.P. 200,000,000.00 229,544,583.00 137,856,688.00 28,474,141.00 149,547,041.44 1.25 7.99 2013Energy Capital Partners IV-A, LP 150,000,000.00 54,110,187.00 17,381,753.00 107,794,207.00 48,247,169.87 1.21 10.69 2017
Enervest Management Partners 100,000,000.00 97,898,144.00 41,386,634.00 10,195,554.00 53,238,442.27 0.97 -1.06EnerVest Energy Institutional Fund XIV-A, L.P. 100,000,000.00 97,898,144.00 41,386,634.00 10,195,554.00 53,238,442.27 0.97 -1.06 2015
First Reserve 500,000,000.00 530,978,253.00 253,080,853.10 14,687,234.00 132,873,283.07 0.73 -9.18First Reserve Fund XI, L.P. 150,000,000.00 150,292,121.00 98,378,656.10 0.00 150,375.15 0.66 -9.45 2006
Page 72

Investments Commitments Contributions Distributions Remaining Commitment Market Value Investment
Multiple IRR Vintage Year
First Reserve Fund XII, L.P. 150,000,000.00 165,617,044.00 83,516,783.00 0.00 10,502,046.79 0.57 -13.35 2008First Reserve Fund XIII, L.P. 200,000,000.00 215,069,088.00 71,185,414.00 14,687,234.00 122,220,861.13 0.90 -5.48 2013
Kohlberg, Kravis, Roberts & Co. 149,850,000.00 74,017,840.00 4,870,953.00 83,465,676.00 71,301,735.44 1.03 2.81KKR Global Infrastructure Investors III 149,850,000.00 74,017,840.00 4,870,953.00 83,465,676.00 71,301,735.44 1.03 2.81 2018
Merit Energy Partners 519,721,518.00 368,950,674.00 105,118,787.00 110,293,705.00 265,935,257.73 1.01 0.12Merit Energy Partners F-II, L.P. 100,000,000.00 59,522,861.00 31,422,724.00 0.00 5,483,414.18 0.62 -7.78 2006Merit Energy Partners H 100,000,000.00 100,000,000.00 29,668,582.00 0.00 46,464,842.71 0.76 -4.87 2011Merit Energy Partners I, L.P. 169,721,518.00 169,721,518.00 43,839,059.00 0.00 163,211,908.47 1.22 5.61 2014Merit Energy Partners K, L.P. 150,000,000.00 39,706,295.00 188,422.00 110,293,705.00 50,775,092.37 1.28 29.89 2019
NGP 599,500,000.00 555,763,743.06 411,303,114.50 75,346,057.00 198,454,891.18 1.10 3.90Natural Gas Partners IX, LP 150,000,000.00 173,921,032.06 245,366,338.51 605,481.00 2,641,745.53 1.43 11.97 2007NGP Natural Resources X, L.P. 150,000,000.00 147,769,572.00 117,841,415.00 2,230,428.00 23,556,356.69 0.96 -1.34 2011NGP Natural Resources XI, L.P. 150,000,000.00 149,772,839.00 47,839,666.00 7,650,923.00 97,035,244.53 0.97 -1.17 2014NGP Natural Resources XII, L.P. 149,500,000.00 84,300,300.00 255,695.00 64,859,225.00 75,221,544.43 0.90 -6.00 2017
Sheridan 100,000,000.00 34,353,005.00 21,125,000.00 13,500,000.00 22,262,004.87 1.26 7.84Sheridan Production Partners III-B, L.P. 100,000,000.00 34,353,005.00 21,125,000.00 13,500,000.00 22,262,004.87 1.26 7.84 2014
Real Estate 2,948,147,868.10 1,944,397,248.97 1,409,215,449.21 1,091,249,780.75 1,132,858,689.33 1.31 8.80
Angelo, Gordon & Co. 550,000,000.00 309,178,121.00 61,290,815.00 242,846,250.00 311,912,349.54 1.21 9.63AG Asia Realty Fund III, L.P. 50,000,000.00 47,587,261.00 37,750,000.00 6,196,250.00 27,394,865.27 1.37 14.00 2016AG Asia Realty Fund IV, L.P. 100,000,000.00 35,446,684.00 0.00 63,000,000.00 40,037,589.00 1.13 10.83 2018AG Europe Realty Fund II, L.P. 75,000,000.00 69,004,017.00 28,384.00 5,250,000.00 79,250,996.25 1.15 8.56 2018AG Europe Realty Fund III 75,000,000.00 10,273,727.00 0.00 64,500,000.00 10,091,161.50 0.98 -1.75 2020AG Realty Fund IX 100,000,000.00 92,141,126.00 23,500,000.00 11,650,000.00 96,097,256.02 1.30 8.54 2014AG Realty Fund X, L.P. 150,000,000.00 54,725,306.00 12,431.00 92,250,000.00 59,040,481.50 1.08 8.58 2018
Blackstone 824,500,000.00 630,935,942.55 692,940,157.87 298,457,032.50 291,541,313.58 1.56 12.15Blackstone Real Estate Partners Asia II 74,500,000.00 37,016,379.92 2,396,798.80 41,884,834.65 34,904,668.49 1.01 0.63 2017Blackstone Real Estate Partners IX, L.P. 300,000,000.00 103,846,766.25 14,257,501.42 209,839,518.10 98,923,900.42 1.09 11.42 2018Blackstone Real Estate Partners V 100,000,000.00 104,213,007.00 203,205,561.41 4,174,052.00 2,786,722.90 1.98 10.73 2006Blackstone Real Estate Partners VI, L.P. 100,000,000.00 109,477,567.00 215,885,212.79 4,907,906.00 4,371,983.53 2.01 13.10 2007Blackstone Real Estate Partners VII, LP 100,000,000.00 111,234,027.89 145,263,185.02 11,217,447.36 39,498,167.50 1.66 14.59 2011Blackstone Real Estate VIII.TE.1 L.P. 150,000,000.00 165,148,194.49 111,931,898.43 26,433,274.39 111,055,870.74 1.35 12.66 2015
Blackstone Strategic Partners 75,000,000.00 77,524,676.84 65,033,699.64 1,030,039.36 2,015,450.49 0.86 -2.14Strategic Partners III RE, L.P. 25,000,000.00 25,987,863.91 15,252,522.71 9,006.00 97,393.33 0.59 -6.46 2005Strategic Partners IV RE, L.P. 50,000,000.00 51,536,812.93 49,781,176.93 1,021,033.36 1,918,057.16 1.00 0.05 2008
Carlyle Group 150,000,000.00 64,827,430.00 18,054,472.00 103,315,341.00 51,954,065.80 1.08 7.80Carlyle Realty Partners VIII, L.P. 150,000,000.00 64,827,430.00 18,054,472.00 103,315,341.00 51,954,065.80 1.08 7.80 2017
Colony Capital LLC 100,000,000.00 99,660,860.00 173,802,105.00 0.00 2,363,100.00 1.77 14.49Colony Investors III 100,000,000.00 99,660,860.00 173,802,105.00 0.00 2,363,100.00 1.77 14.49 1997
Landmark Partners 149,500,000.00 71,519,488.13 26,465,744.86 83,806,772.87 53,340,342.73 1.12 9.63Landmark Real Estate Partners VIII, L.P. 149,500,000.00 71,519,488.13 26,465,744.86 83,806,772.87 53,340,342.73 1.12 9.63 2016
Lubert Adler 74,147,868.10 63,877,819.78 16,445,337.96 11,122,180.21 60,496,282.96 1.20 9.74Lubert-Adler Real Estate Fund VII-B, L.P. 74,147,868.10 63,877,819.78 16,445,337.96 11,122,180.21 60,496,282.96 1.20 9.74 2017
Oaktree Capital Management, LLC 100,000,000.00 9,500,000.00 9,500,000.00 100,000,000.00 8,324,253.00 1.88 150.68Oaktree Real Estate Opportunities Fund VIII 100,000,000.00 9,500,000.00 9,500,000.00 100,000,000.00 8,324,253.00 1.88 150.68 2020
Page 73

Investments Commitments Contributions Distributions Remaining Commitment Market Value Investment
Multiple IRR Vintage Year
Rockpoint 200,000,000.00 111,678,417.00 36,095,669.00 103,415,380.00 84,395,090.68 1.08 3.58Rockpoint Real Estate Fund V, L.P. 100,000,000.00 96,378,261.00 36,084,442.00 18,715,536.00 69,526,001.28 1.10 3.88 2014Rockpoint Real Estate Fund VI, L.P. 100,000,000.00 15,300,156.00 11,227.00 84,699,844.00 14,869,089.40 0.97 -2.71 2019
Rockwood 200,000,000.00 111,937,331.08 22,706,089.62 89,727,064.71 96,841,948.93 1.07 3.53Rockwood Capital RE Partners X, L.P. 100,000,000.00 85,209,227.82 22,706,089.62 16,475,301.06 71,428,904.29 1.10 4.17 2015Rockwood Capital RE Partners XI 100,000,000.00 26,728,103.26 0.00 73,251,763.65 25,413,044.64 0.95 -33.62 2019
Silverpeak Real Estate Partners 225,000,000.00 143,757,162.59 105,887,112.47 7,529,720.10 8,647,850.44 0.80 -3.62Silverpeak Legacy Pension Partners II, L.P. 75,000,000.00 73,035,349.59 91,687,518.60 7,529,720.10 545,307.87 1.26 4.15 2005Silverpeak Legacy Pension Partners III, L.P. 150,000,000.00 70,721,813.00 14,199,593.87 0.00 8,102,542.57 0.32 -11.95 2008
TA Associates Realty 300,000,000.00 250,000,000.00 180,994,245.79 50,000,000.00 161,026,641.18 1.37 11.11Realty Associates Fund X 100,000,000.00 100,000,000.00 150,369,809.73 0.00 10,506,343.11 1.61 12.65 2012Realty Associates Fund XI 100,000,000.00 100,000,000.00 29,781,015.06 0.00 100,540,748.07 1.30 8.57 2015Realty Associates Fund XII 100,000,000.00 50,000,000.00 843,421.00 50,000,000.00 49,979,550.00 1.02 3.91 2018
Distressed/Opportunistic 3,639,714,067.00 2,508,246,132.81 2,225,979,061.23 1,190,921,913.67 1,204,677,303.02 1.37 9.42
Avenue Capital Partners 200,000,000.00 200,977,328.00 31,589,518.00 0.00 158,159,785.83 0.94 -1.56Avenue Energy Opportunities Fund II 100,000,000.00 100,000,000.00 417,420.00 0.00 90,654,900.00 0.91 -3.55 2017Avenue Energy Opportunities Fund, L.P. 100,000,000.00 100,977,328.00 31,172,098.00 0.00 67,504,885.83 0.98 -0.48 2014
BlackRock* 1,774,870.00 1,774,870.00 1,737,311.95 0.00 232,166.94 1.11 5.83BlackRock Tempus Fund 1,774,870.00 1,774,870.00 1,737,311.95 0.00 232,166.94 1.11 5.83 2015
Canyon Partners 125,000,000.00 58,750,000.00 8,750,000.00 75,000,000.00 58,750,000.00 1.15 15.41Canyon Distressed Opportunity Fund III 125,000,000.00 58,750,000.00 8,750,000.00 75,000,000.00 58,750,000.00 1.15 15.41 2020
CarVal Investors 900,000,000.00 730,703,333.00 852,547,275.09 169,500,000.00 235,887,847.41 1.49 10.58CarVal Credit Value Fund I 100,000,000.00 95,000,000.00 212,205,835.74 5,000,000.00 1,634,057.53 2.25 18.72 2010CVI Credit Value Fund A II 150,000,000.00 142,500,000.00 199,242,173.52 7,500,000.00 1,274,714.96 1.41 8.08 2012CVI Credit Value Fund A III 150,000,000.00 142,500,000.00 120,541,318.35 7,500,000.00 61,885,363.42 1.28 8.00 2015CVI Credit Value Fund IV 150,000,000.00 145,703,333.00 59.76 4,500,000.00 155,861,055.00 1.07 4.23 2017CVI Credit Value Fund V 150,000,000.00 15,000,000.00 0.00 135,000,000.00 15,000,000.00 1.00 0.00 2020CVI Global Value Fund, L.P. 200,000,000.00 190,000,000.00 320,557,887.72 10,000,000.00 232,656.50 1.69 9.53 2007
Carlyle Group 100,000,000.00 65,659,957.93 28,156,617.93 62,444,725.60 35,787,703.85 0.97 -2.26Carlyle Strategic Partners IV, L.P. 100,000,000.00 65,659,957.93 28,156,617.93 62,444,725.60 35,787,703.85 0.97 -2.26 2016
MHR Institutional Partners 75,000,000.00 55,684,392.00 7,941,856.00 27,198,884.00 60,427,254.98 1.23 8.02MHR Institutional Partners IV LP 75,000,000.00 55,684,392.00 7,941,856.00 27,198,884.00 60,427,254.98 1.23 8.02 2014
Marathon 200,000,000.00 10,000,000.00 3,613,524.73 193,485,193.23 8,557,570.04 1.22 24.81Marathon Distressed Credit Fund 200,000,000.00 10,000,000.00 3,613,524.73 193,485,193.23 8,557,570.04 1.22 24.81 2020
Merced Capital 278,737,500.00 285,449,091.35 233,759,646.00 2,673,787.00 92,838,000.94 1.14 3.28Merced Partners III 100,000,000.00 103,878,467.92 129,676,445.00 0.00 9,811,056.43 1.34 6.11 2010Merced Partners IV 125,000,000.00 124,968,390.43 98,722,539.00 0.00 39,823,570.98 1.11 2.39 2013Merced Partners V 53,737,500.00 56,602,233.00 5,360,662.00 2,673,787.00 43,203,373.53 0.86 -4.71 2017
Oaktree Capital Management, LLC 650,000,000.00 240,214,689.00 36,605,837.85 431,889,598.00 237,717,608.62 1.14 7.01Oaktree Opportunities Fund X, L.P. 50,000,000.00 46,500,021.00 13,969,659.74 8,500,000.00 42,768,737.70 1.22 7.06 2015Oaktree Opportunities Fund Xb, L.P. 100,000,000.00 55,000,000.00 0.00 45,000,000.00 58,396,140.00 1.06 5.62 2015Oaktree Opportunities Fund XI 300,000,000.00 15,000,000.00 0.00 285,000,000.00 15,000,000.00 1.00 2020Oaktree Special Situations Fund II, L.P. 100,000,000.00 26,731,187.00 5,000,000.00 78,148,304.00 26,144,614.64 1.17 38.84 2018Oaktree Special Situations Fund, L.P. 100,000,000.00 96,983,481.00 17,636,178.11 15,241,294.00 95,408,116.28 1.17 6.17 2014
Page 74

Investments Commitments Contributions Distributions Remaining Commitment Market Value Investment
Multiple IRR Vintage Year
PIMCO BRAVO* 9,201,697.00 8,654,932.53 8,289,636.15 7,200,650.84 1,438,074.38 1.12 3.93PIMCO BRAVO Fund Onshore Feeder I 3,958,027.00 3,958,027.00 3,989,987.10 2,359,424.78 33,382.59 1.02 1.62 2014PIMCO Bravo Fund OnShore Feeder II 5,243,670.00 4,696,905.53 4,299,649.05 4,841,226.06 1,404,691.79 1.21 4.36 2014
TSSP 200,000,000.00 82,212,539.00 13,001,647.00 130,779,075.00 78,484,553.97 1.11 10.75TSSP Adjacent Opportunities GenPar, L.P 100,000,000.00 26,080,450.00 1,410,173.00 75,329,519.00 26,455,735.69 1.07 15.53 2018TSSP Adjacent Opportunities Partners (B) 50,000,000.00 36,488,479.00 8,946,867.00 22,458,388.00 33,130,163.50 1.15 10.29 2018TSSP Opportunities Partners IV (A), L.P. 50,000,000.00 19,643,610.00 2,644,607.00 32,991,168.00 18,898,654.78 1.10 9.40 2018
Varde Fund 600,000,000.00 525,000,000.00 633,688,381.00 75,000,000.00 207,598,998.62 1.60 10.32Varde Fund IX, L.P. 100,000,000.00 100,000,000.00 216,097,236.00 0.00 338,297.74 2.16 15.02 2008Varde Fund X, LP 150,000,000.00 150,000,000.00 250,804,375.00 0.00 19,601,407.84 1.80 10.60 2010Varde Fund XI, LP 200,000,000.00 200,000,000.00 166,766,732.00 0.00 102,614,993.04 1.35 5.30 2013Varde Fund XIII, L.P. 150,000,000.00 75,000,000.00 20,038.00 75,000,000.00 85,044,300.00 1.13 15.09 2018
Wayzata Investment Partners 300,000,000.00 243,165,000.00 366,297,809.53 15,750,000.00 28,797,737.44 1.62 14.44Wayzata Opportunities Fund II, LLC 150,000,000.00 174,750,000.00 327,229,039.53 750,000.00 2,888,567.00 1.89 16.48 2007Wayzata Opportunities Fund III 150,000,000.00 68,415,000.00 39,068,770.00 15,000,000.00 25,909,170.44 0.95 -1.37 2012
Total 30,711,584,976.22 21,581,687,976.02 17,875,261,896.15 10,720,328,865.91 12,616,508,770.83 1.41 10.50
Difference** 120,573,797.34Private Markets Total with Difference 12,737,082,568.17
Private Markets Portfolio Status ManagersPRIVATE EQUITY 51PRIVATE CREDIT 15
REAL ASSETS 11
REAL ESTATE 12
DISTRESSED/ OPPORTUNISTIC 13Total 102
Notes None of the data presented herein has been reviewed or approved by either the general partner or investment manager. The performance and valuation data presented herein is not a guarantee or prediction of future results. Ultimately, the actual performance and value of any investment is not known until final liquidation. Because there is no industry-standardized method for valuation or reporting comparisons of performance and valuation data among different investments is difficult.
Data presented in this report is made public pursuant to Minn. Stat. Chs. 13 and 13D, and Minn. Stat. § 11A.24, subd. 6(c). Additional information on private markets investments may be classified as non-public and not subject to disclosure.
*Partnership interests transferred to the MSBI during 1Q2015. All data presented as of the transfer date.** Difference is from an in-kind stock distribution liquidating account, cash transactions posted to next day and distributions received in foreign currency during the month
32266
Funds1433132
28
Page 75

This page intentionally left blank.
Page 76

Participant Directed Investment ProgramDecember 31, 2020
Minnesota State Board of InvestmentQuarter Ending December 31, 2020Participant Directed Investment Program
Quarterly Report
Page 77

Participant Directed Investment Program
The Participant Directed Investment Program (PDIP) provides investment vehicles for a variety of retirement or other tax-advantaged savings plans. The objective of thePlan is to be competitive in the marketplace by providing quality investment options with low fees to its participants. Investment goals among the PDIP’s manyparticipants are varied.
• The Supplemental Investment Fund (SIF) is an investment platform that provides participants with the option to invest in many of the same pools as the CombinedFund in addition to a Stable Value Fund and a Money Market Fund. The Volunteer Firefighter Account is an option in the SIF for local firefighter entities that jointhe Statewide Voluntary Firefighter Plan administered by PERA. The investment vehicles are structured much like a family of mutual funds where participatingentities buy or sell units in each fund. Participants may allocate their investments among one or more funds that are appropriate for their needs and are withinstatutory requirements and rules established by the participating organizations.
• The Mutual Fund Line-up is an investment platform that offers participants three sets of investment options. The first is a set of actively and passively managedmutual funds, a Stable Value Fund and a Money Market Fund. The second is a set of target date funds called Minnesota Target Retirement Funds. The third is aself-directed brokerage account window which offers thousands of mutual funds. The SBI has no direct management responsibilities for funds within the self-directed brokerage account window. Participants may allocate their investments among one or more accounts that are appropriate for their needs within the statutoryrequirements and rules established by the participating organizations.
• The SBI is responsible for the investment options provided in the two State Sponsored Savings Plans established under provisions of the Internal Revenue Code 529,the Minnesota College Savings Plan and Minnesota Achieving a Better Life Experience Plan (ABLE). The Minnesota College Savings Plan is an educationalsavings plan designed to help families save for qualified nationwide college costs. The SBI is responsible for the investments and the Minnesota Office of HigherEducation (OHE) is responsible for the overall administration of the Plan. The SBI and OHE have contracted jointly with TIAA-CREF Tuition Financing, Inc. toprovide administrative, marketing, communication, recordkeeping and investment management services. The ABLE Plan is a savings plan designed to helpindividuals save for qualified disability expenses without losing eligibility for certain assistance programs. The plan is administered by the Department of HumanServices (DHS). The SBI and DHS have jointly contracted with Ascensus to provide recordkeeping, administrative, and investment management services for theplan.
The investment returns shown in this report are calculated using a time-weighted rate of return formula. These returns are net of investment management fees andtransaction costs. They do not, however, reflect administrative expenses that may be deducted by the retirement systems or other agencies to defray administrative costs.
Minnesota State Board of InvestmentQuarter Ending December 31, 2020
Quarterly Report
Page 78

The Minnesota Supplemental Investment Fund (SIF) is a multi-purpose investment platform that offers a range of investment options to state and local public employees.This investment platform provides some or all of the investment options to the Public Employees Retirement Association (PERA) Defined Contribution Plan, localpension plans and the Statewide Volunteer Firefighter plan.
A wide diversity of investment goals exists among the Fund's participants. In order to meet those needs, the Fund has been structured much like a "family of mutualfunds." Participants may allocate their investments among one or more accounts that are appropriate for their needs, within the statutory requirements and rulesestablished by the participating organizations. Participation in the Fund is accomplished through the purchase or sale of shares in each account. All returns are net ofinvestment management fees.
Investment Option Descriptions
• Balanced Fund - a balanced portfolio utilizing both common stocks and bonds
• U.S. Stock Actively Managed Fund - an actively managed, U.S. common stock portfolio.
• U.S. Stock Index Fund - a passively managed, common stock portfolio designed to broadly track the performance of the U.S. stock market.
• Broad International Stock Fund - a portfolio of non-U.S. stocks that incorporates both active and passive management.
• Bond Fund - an actively managed, bond portfolio.
• Money Market Fund - a portfolio utilizing short-term, liquid debt securities.
• Stable Value Fund - a portfolio of stable value instruments, including security backed contracts and insurance company and bank investment contracts.
• Volunteer Firefighter Account - a balanced portfolio only used by the Statewide Volunteer Firefighter Plan.
Ending Market Value Last Qtr 1 Year 3 Year 5 Year 10 Year Option Since
BALANCED FUND $106,140,025 9.5% 17.3% 11.5% 11.5% 10.2% 01/1980
U.S. ACTIVELY MANAGED FUND 85,588,200 16.0 27.6 17.0 16.8 14.5 07/1986
U.S. STOCK INDEX FUND 453,307,129 14.8 21.2 14.6 15.5 13.8 07/1986
BROAD INTERNATIONAL STOCK FUND 139,624,904 16.9 11.3 5.2 8.8 5.4 09/1994
BOND FUND 113,711,846 1.9 9.7 6.4 5.4 4.6 07/1986
MONEY MARKET FUND 586,268,005 0.0 0.7 1.7 1.4 0.8 07/1986
STABLE VALUE FUND 1,707,086,592 0.6 2.5 2.5 2.4 2.4 11/1994
VOLUNTEER FIREFIGHTER ACCOUNT 138,585,275 8.4 14.7 9.3 9.6 8.0 01/2010
Note:
The Market Values for the Money Market Fund, the Stable Value Fund, and the Total Supplemental Investment Fund also include assets held through other plans.
Minnesota State Board of InvestmentQuarter Ending December 31, 2020Participant Directed Investment Program
Supplemental Investment Fund Summary
Page 79

Balanced Fund
The primary investment objective of the Balanced Fund is to gain exposure to publicly traded U.S. equities, bond and cash in a diversified investment portfolio. The Fundseeks to maximize long-term real rates of return, while limiting short-run portfolio return volatility. The Balanced Fund is invested in a balanced portfolio of commonstocks and bonds. Common stocks provide the potential for significant capital appreciation, while bonds act as a deflation hedge and provide portfolio diversification. Thebenchmark is a blend of 60% Russell 3000/35% Barclays Aggregate Bond Index/5% T-Bills Composite.
Ending Market Value Last Qtr 1 Year 3 Year 5 Year 10 Year
U.S. ACTIVELY MANAGEDFUND
85,588,200 16.0 27.6 17.0 16.8 14.5
Russell 3000 14.7 20.9 14.5 15.4 13.8
Excess 1.4 6.7 2.5 1.3 0.7
U.S. Actively Managed Fund
The U.S. Stock Actively Managed Fund's investment objective is to generate above-average returns from capital appreciation on common stocks. The U.S. Stock ActivelyManaged Fund is invested primarily in the common stocks of U.S. companies. The managers in the account also hold varying levels of cash.
Ending Market Value Last Qtr 1 Year 3 Year 5 Year 10 Year
BALANCED FUND $106,140,025 9.5% 17.3% 11.5% 11.5% 10.2%
SIF BALANCED FUNDBENCHMARK
9.0 15.9 11.1 11.1 9.8
Excess 0.5 1.4 0.5 0.4 0.3
Minnesota State Board of InvestmentQuarter Ending December 31, 2020Participant Directed Investment Program
Supplemental Investment Fund Performance
Page 80

Ending Market Value Last Qtr 1 Year 3 Year 5 Year 10 Year
U.S. STOCK INDEX FUND $453,307,129 14.8% 21.2% 14.6% 15.5% 13.8%
Russell 3000 14.7 20.9 14.5 15.4 13.8
Excess 0.1 0.3 0.1 0.1 0.0
Broad International Stock Fund
The investment objective of the Broad International Stock Fund is to earn a high rate of return by investing in the stock of companies outside the U.S. Portions of the Fundare passively managed and semi-passively managed. These portions of the Fund are designed to track and modestly outperform, respectively, the return of developedmarkets included in the MSCI World ex USA Index. A portion of the Fund is "actively managed" by several international managers and emerging markets specialists whobuy and sell stocks in an attempt to maximize market value. The International Equity Benchmark is currently the MSCI ACWI ex USA (net).
U.S. Stock Index Fund
The investment objective of the U.S. Stock Index Fund is to generate returns that track those of the U.S. stock market as a whole. The Fund is designed to track theperformance of the Russell 3000 Index, a broad-based equity market indicator. The Fund is invested 100% in common stock.
Ending Market Value Last Qtr 1 Year 3 Year 5 Year 10 Year
BROAD INTERNATIONALSTOCK FUND
139,624,904 16.9 11.3 5.2 8.8 5.4
International Equity Benchmark 17.1 10.5 4.8 8.9 4.9
Excess -0.1 0.8 0.4 -0.1 0.5
Minnesota State Board of InvestmentQuarter Ending December 31, 2020Participant Directed Investment Program
Supplemental Investment Fund Performance
Page 81

Money Market Fund
The investment objective of the Money Market Fund is to protect principal by investing in short-term, liquid U.S. Government securities. The Fund is invested entirely inhigh-quality, short-term U.S. Treasury and Agency securities. The average maturity of the portfolios is less than 90 days. Please note that the Market Value for the MoneyMarket Fund reflects assets held through the Deferred Compensation Plan as well.
Ending Market Value Last Qtr 1 Year 3 Year 5 Year 10 Year
BOND FUND $113,711,846 1.9% 9.7% 6.4% 5.4% 4.6%
BBG BARC US Agg 0.7 7.5 5.3 4.4 3.8
Excess 1.2 2.2 1.0 0.9 0.7
Ending Market Value Last Qtr 1 Year 3 Year 5 Year 10 Year
MONEY MARKET FUND 586,268,005 0.0 0.7 1.7 1.4 0.8
ICE BofA US 3-Month TreasuryBill
0.0 0.7 1.6 1.2 0.6
Excess 0.0 0.0 0.1 0.2 0.1
Bond Fund
The investment objective of the Bond Fund is to exceed the return of the broad domestic bond market by investing in fixed income securities. The Bond Fund investsprimarily in high-quality, government and corporate bonds that have intermediate to long-term maturities, usually 3 to 20 years. The Bond Fund benchmark is theBloomberg Barclays U.S. Aggregate.
Minnesota State Board of InvestmentQuarter Ending December 31, 2020Participant Directed Investment Program
Supplemental Investment Fund Performance
Page 82

Volunteer Firefighter Account
The Volunteer Firefighter Account is different than other SIF program options. It is available only to the local entities that participate in the Statewide VolunteerFirefighter Plan (administered by PERA) and have all of their assets invested in the Volunteer Firefighter Account. There are other volunteer firefighter plans that are noteligible to be consolidated that may invest their assets through other SIF program options. The investment objective of the Volunteer Firefighter Account is to maximizelong-term returns while limiting short-term portfolio return volatility. The account is invested in a balanced portfolio of domestic equity, international equity, fixedincome and cash. The benchmark for this account is 35% Russell 3000, 15% MSCI ACWI ex USA (net), 45% Bloomberg Barclays U.S. Aggregate, 5% 3 Month T-Bills.
Ending Market Value Last Qtr 1 Year 3 Year 5 Year 10 Year
STABLE VALUE FUND $1,707,086,592 0.6% 2.5% 2.5% 2.4% 2.4%
Fixed Interest Blended Benchmark 0.2 0.9 2.1 1.9 1.5
Excess 0.4 1.6 0.4 0.4 0.8
Ending Market Value Last Qtr 1 Year 3 Year 5 Year 10 Year
VOLUNTEER FIREFIGHTER ACCOUNT 138,585,275 8.4 14.7 9.3 9.6 8.0
SIF Volunteer Firefighter Account BM 7.9 13.1 8.7 9.1 7.5
Excess 0.5 1.6 0.6 0.5 0.4
Stable Value Fund
The investment objectives of the Stable Value Fund are to protect investors from loss of their original investment and to provide competitive interest rates using somewhatlonger-term investments than typically found in a money market fund. The Fund is invested in a well-diversified portfolio of high-quality fixed income securities withstrong credit ratings. The Fund also invests in contracts issued by highly rated insurance companies and banks which are structured to provide principal protection for theFund's diversified bond portfolios, regardless of daily market changes. The Stable Value Fund Benchmark is the 3-year Constant Maturity Treasury Bill +45 basis points.Please note that the Market Value for the Stable Value Fund reflects assets held through the Deferred Compensation Plan as well.
Minnesota State Board of InvestmentQuarter Ending December 31, 2020Participant Directed Investment Program
Supplemental Investment Fund Performance
Page 83

The mutual fund investment line-up provides investment options to the Minnesota Deferred Compensation Plan (MNDCP), Unclassified Retirement Plan, Health CareSavings Plan, and the Hennepin Country Retirement Plan. The MNDCP is a tax-sheltered retirement savings plan that is supplemental to public employees primaryretirement plan. (In most cases, the primary plan is a defined benefit plan administered by TRA, PERA, or MSRS.) Participants can choose from active and passivelymanaged stock and bond funds, a Stable Value Fund, a Money Market Fund, a set of 10 target date retirement fund options, and a brokerage window where participantscan choose from hundreds of mutual funds.
Ending Market Value Last Qtr 1 Year 3 Year 5 Year 10 Year Option Since
VANGUARD TOTAL STOCK MARKET INSTITUTIONAL INDEX PLUS $604,899,234 14.7% 21.2% 07/2019
VANGUARD INSTITUTIONAL INDEX PLUS 1,591,129,964 12.2 18.4 14.2% 15.2% 13.9% 07/1999
VANGUARD DIVIDEND GROWTH 819,625,682 8.9 12.0 13.7 10/2016
VANGUARD MID CAP INDEX 661,880,286 18.0 18.3 12.1 13.3 12.4 01/2004
T. ROWE PRICE SMALL-CAP STOCK 951,083,527 24.8 25.0 17.5 17.4 14.4 04/2000
FIDELITY DIVERSIFIED INTERNATIONAL 367,451,483 11.8 19.8 9.6 10.2 7.6 07/1999
VANGUARD TOTAL INTERNATIONAL STOCK INDEX 341,559,151 16.9 11.3 5.0 9.1 07/2011
VANGUARD BALANCED INDEX 1,413,712,845 9.0 16.4 11.3 11.3 10.0 12/2003
DODGE & COX INCOME 329,651,740 2.5 9.5 6.2 5.7 4.6 07/1999
VANGUARD TOTAL BOND MARKET INDEX 417,067,732 0.7 7.7 5.4 4.5 3.8 12/2003
2025 FUND 210,841,744 7.6 11.1 7.4 8.6 07/2011
2030 FUND 162,847,496 9.6 15.1 9.1 10.3 07/2011
2035 FUND 129,436,328 11.1 17.5 10.1 11.3 07/2011
2040 FUND 103,651,537 12.2 18.4 10.5 11.8 07/2011
2045 FUND 93,204,211 13.3 19.0 10.7 12.2 07/2011
2050 FUND 70,438,993 14.3 19.5 10.9 12.6 07/2011
2055 FUND 46,004,739 14.9 19.9 11.1 12.7 07/2011
2060 FUND 38,097,616 14.9 19.9 11.0 12.7 07/2011
2065 FUND 1,807,656 14.9 04/2020
INCOME FUND 240,206,616 6.0 9.7 6.5 6.7 07/2011
TD Ameritrade SDB 87,931,809 08/2017
TD Ameritrade SDB Roth 2,028,308 08/2017
Minnesota State Board of InvestmentQuarter Ending December 31, 2020Participant Directed Investment Program
Mutual Funds
Page 84

LARGE CAP EQUITY
Vanguard Total Stock Market Institutional Index Plus (passive)
A passive domestic stock portfolio of large and small companies that tracks theCRSP US Total Market Index.
Vanguard Index Institutional Plus (passive)
A passive domestic stock portfolio that tracks the S&P 500.
Vanguard Dividend Growth (active) (1)
A fund of large cap stocks which is expected to outperform the Nasdaq USDividend Achievers Select Index, over time.
MID CAP EQUITY
Vanguard Mid Cap Index (passive) (2)
A fund that passively invests in companies with medium market capitalizationsthat tracks the CRSP US Mid-Cap Index.
SMALL CAP EQUITY
T Rowe Price Small Cap (active)
A fund that invests primarily in companies with small market capitalizations andis expected to outperform the Russell 2000 Index.
INTERNATIONAL EQUITY
Fidelity Diversified International (active)
A fund that invests primarily in stocks of companies located outside of theUnited States and is expected to outperform the MSCI index of Europe,Australasia and the Far East (EAFE), over time.
Vanguard Total International Stock Index (passive) (3)
A fund that seeks to track the investment performance of the FTSE Global AllCap ex US Index, an index designed to measure equity market performance indeveloped and emerging markets, excluding the United States.
Ending Market Value Last Qtr 1 Year 3 Year 5 Year Option Since
Large Cap US EquityVANGUARD TOTAL STOCKMARKET INSTITUTIONALINDEX PLUS
$604,899,234 14.7% 21.2% 07/2019
CRSP US Total Market Index 14.7 21.0 07/2019
Excess -0.0 0.2
VANGUARD INSTITUTIONALINDEX PLUS
1,591,129,964 12.2 18.4 14.2% 15.2% 07/1999
S&P 500 12.1 18.4 14.2 15.2 07/1999
Excess 0.0 0.0 -0.0 -0.0
VANGUARD DIVIDENDGROWTH
819,625,682 8.9 12.0 13.7 10/2016
NASDAQ US Dividend AchieversSelect
10.3 15.6 13.7 10/2016
Excess -1.4 -3.6 -0.0
Mid Cap US EquityVANGUARD MID CAP INDEX 661,880,286 18.0 18.3 12.1 13.3 01/2004
CRSP US Mid Cap Index 18.0 18.2 12.1 13.3 01/2004
Excess -0.0 0.0 0.0 -0.0
Small Cap US EquityT. ROWE PRICE SMALL-CAPSTOCK
951,083,527 24.8 25.0 17.5 17.4 04/2000
Russell 2000 31.4 20.0 10.2 13.3 04/2000
Excess -6.6 5.0 7.3 4.1
International EquityFIDELITY DIVERSIFIEDINTERNATIONAL
367,451,483 11.8 19.8 9.6 10.2 07/1999
MSCI EAFE FREE (NET) 16.0 7.8 4.3 7.4 07/1999
Excess -4.2 12.0 5.4 2.7
VANGUARD TOTALINTERNATIONAL STOCK INDEX
341,559,151 16.9 11.3 5.0 9.1 07/2011
FTSE Global All Cap ex US IndexNet
17.2 11.1 4.8 8.9 07/2011
Excess -0.3 0.2 0.2 0.2
Minnesota State Board of InvestmentQuarter Ending December 31, 2020Participant Directed Investment Program
Mutual Funds
Page 85

Ending Market Value Last Qtr 1 Year 3 Year 5 Year Option Since
Balanced FundsVANGUARD BALANCED INDEX $1,413,712,845 9.0% 16.4% 11.3% 11.3% 12/2003
Vanguard Balanced FundBenchmark
Excess
Fixed IncomeDODGE & COX INCOME 329,651,740 2.5 9.5 6.2 5.7 07/1999
BBG BARC Agg Bd 0.7 7.5 5.3 4.4 07/1999
Excess 1.8 1.9 0.8 1.3
VANGUARD TOTAL BONDMARKET INDEX
417,067,732 0.7 7.7 5.4 4.5 12/2003
BBG BARC Agg Bd 0.7 7.5 5.3 4.4 12/2003
Excess 0.0 0.2 0.0 0.0
MONEY MARKET FUND 586,268,005 0.0 0.7 1.7 1.4 07/1986
ICE BofA US 3-Month TreasuryBill
0.0 0.7 1.6 1.2 07/1986
Excess 0.0 0.0 0.1 0.2
Stable ValueSTABLE VALUE FUND 1,707,086,592 0.6 2.5 2.5 2.4 11/1994
Fixed Interest Blended Benchmark 0.2 0.9 2.1 1.9 11/1994
Excess 0.4 1.6 0.4 0.4
(1) Vanguard Dividend Growth replaced the Janus Twenty Fund in the third quarter of 2016.
(2) Prior to 02/01/2013 the benchmark was the MSCI US Mid-Cap 450 Index
(3) Prior to 06/01/2013 the benchmark was MSCI ACWI ex USA IMI.
(4) Prior to 01/01/2013 the benchmark was 60% MSCI US Broad Market Index and 40% Bloomberg Barclays U.S. Aggregate.
(5) Money Market and Stable Value are Supplemental Investment Fund options which are also offered to eligible plans that invest through other plans.
BALANCED
Vanguard Balanced Index (passive) (4)
A fund that passively invests in a mix of domestic stocks and bonds. The fund isexpected to track a weighted benchmark of 60% CRSP US Total MarketIndex/40% BB Barclays U.S. Aggregate.
FIXED INCOME
Dodge & Cox Income Fund (active)
A fund that invests primarily in investment grade securities in the U.S. bondmarket which is expected to outperform the BB Barclays U.S. Aggregate, overtime.
Vanguard Total Bond Market Index (passive)
A fund that passively invests in a broad, market weighted bond index that isexpected to track the BB Barclays U.S. Aggregate.
Money Market Fund (5)
A fund that invests in short-term debt instruments which is expected tooutperform the return on 90-Day U.S. Treasury Bills.
STABLE VALUE
Stable Value Fund (5)
A portfolio composed of stable value instruments which are primarilyinvestment contracts and security backed contracts. The fund is expected tooutperform the return of the 3 year Constant Maturity Treasury +45 basis points,over time.
Minnesota State Board of InvestmentQuarter Ending December 31, 2020Participant Directed Investment Program
Mutual Funds
Page 86
9.0 17.3 11.6 11.5 12/2003
0.0 -0.9 -0.3 -0.2

Target Date Retirement FundsEnding Market Value Last Qtr 1 Year 3 Year 5 Year Option Since
SSgA
2025 FUND $210,841,744 7.6% 11.1% 7.4% 8.6% 07/2011
2025 FUND BENCHMARK 7.7 11.1 7.4 8.5 07/2011
Excess -0.0 0.1 0.0 0.0
2030 FUND 162,847,496 9.6 15.1 9.1 10.3 07/2011
2030 FUND BENCHMARK 9.7 15.0 9.1 10.3 07/2011
Excess -0.1 0.1 0.0 0.0
2035 FUND 129,436,328 11.1 17.5 10.1 11.3 07/2011
2035 FUND BENCHMARK 11.2 17.5 10.1 11.3 07/2011
Excess -0.1 0.1 0.0 0.0
2040 FUND 103,651,537 12.2 18.4 10.5 11.8 07/2011
2040 FUND BENCHMARK 12.3 18.4 10.5 11.8 07/2011
Excess -0.1 0.1 0.0 0.0
2045 FUND 93,204,211 13.3 19.0 10.7 12.2 07/2011
2045 FUND BENCHMARK 13.4 18.9 10.7 12.2 07/2011
Excess -0.1 0.0 -0.0 0.0
MN TARGET RETIREMENT ACCOUNTS
Target retirement funds offer a mix of investments that are adjusted over time to reduce risk and become more conservative as the target retirement date approaches. Aparticipant only needs to make one investment decison by investing their assets in the fund that is closest to their anticipated retirement date.
Note: Each SSgA Fund benchmark is the aggregate of the returns of the Fund's underlying index funds weighted by the Fund's asset allocation
Target Date Retirement FundsEnding Market Value Last Qtr 1 Year 3 Year 5 Year Option Since
2050 FUND $70,438,993 14.3% 19.5% 10.9% 12.6% 07/2011
2050 FUND BENCHMARK 14.4 19.5 10.9 12.6 07/2011
Excess -0.1 0.0 -0.0 0.0
2055 FUND 46,004,739 14.9 19.9 11.1 12.7 07/2011
2055 FUND BENCHMARK 15.0 19.9 11.1 12.7 07/2011
Excess -0.1 -0.1 -0.0 0.0
2060 FUND 38,097,616 14.9 19.9 11.0 12.7 07/2011
2060 FUND BENCHMARK 15.0 19.9 11.1 12.7 07/2011
Excess -0.1 -0.1 -0.0 0.0
2065 FUND 1,807,656 14.9 04/2020
2065 FUND BENCHMARK 15.0 04/2020
Excess -0.1
INCOME FUND 240,206,616 6.0 9.7 6.5 6.7 07/2011
INCOME FUND BENCHMARK 6.0 9.6 6.5 6.7 07/2011
Excess -0.0 0.1 0.0 0.0
Minnesota State Board of InvestmentQuarter Ending December 31, 2020Participant Directed Investment Program
Mutual Funds
Page 87

The Minnesota College Savings Plan is an education savings plan designed to help families set aside funds for future college costs. The SBI is responsible for theinvestments and the Minnesota Office of Higher Education (OHE) is responsible for the overall administration of the Plan.
The SBI and OHE contract jointly with TIAA to provide administrative, marketing, communication, recordkeeping and investment management services. Please see thenext page for the performance as reported by TIAA.
ENROLLMENT-BASED MANAGED ALLOCATIONS
The Enrollment Year Investment Option is a set of single fund options representing the date your future student needs their college savings. The asset allocation adjustsautomatically to a more conservative investment objective and level of risk as the enrollement year approaches. The managed allocation changed from Age-Based toEnrollment-Based on October 28, 2019.
RISK BASED ALLOCATIONS
The Risk Based Allocation Option offers three separate allocation investment options - Aggressive, Moderate and Conservative, each of which has a fixed risk level thatdoes not change as the Beneficiary ages.
ASSET CLASS BASED ALLOCATIONS
U.S. LARGE CAP EQUITY INDEX - A passive domestic stock portfolio that tracks the S&P 500.
INTERNATIONAL EQUITY INDEX - A fund that passively invests in a mix of developed and emerging market equities. The fund is expected to track a weightedbenchmark of 80% MSCI ACWI World ex USA and 20% MSCI Emerging Markets Free Index.
U.S. AND INTERNATIONAL EQUITY INDEX - A fund that invests in a mix of equities, both U.S. and international, across all capitalization ranges and real estate-related securities. The fund is expected to track a weighted benchmark of 60% Russell 3000, 24% International, 6% Emerging Markets, and 10% Real Estate SecuritiesFund.
PRINCIPAL PLUS INTEREST OPTION - A passive fund where contributions are invested in a Funding Agreement issued by TIAA-CREF Life. The fundingagreement provides for a return of principal plus a guaranteed rate of interest which is made by the insurance company to the policyholder, not the account owners. Theaccount is expected to outperform the return of the 3-month T-Bill.
EQUITY AND INTEREST ACCUMULATION - A fund that passively invests half of the portfolio in U.S. equities across all capitalization ranges and the other half inthe same Funding Agreement issued by TIAA-CREF Life as described above. The fund is expected to track a weighted benchmark of 50% Russell 3000 and 50% 3-month T-Bill.
100% FIXED INCOME - A fund that passively invests in fixed income holdings that tracks the Bloomberg Barclays U.S. Aggregate and two active funds that invest ininflation-linked bonds and high yield securities. The fund is expected to track a weighted benchmark of 70% BB Barclays Aggregate, 20% inflation-linked bond, and 10%high yield.
MONEY MARKET - An active fund that invests in high-quality, short-term money market instruments of both domestic and foreign issuers that tracks the iMoneyNetAverage All Taxable benchmark.
Minnesota State Board of InvestmentQuarter Ending December 31, 2020Participant Directed Investment Program
MN College Savings Plan Options
Page 88

MINNESOTA COLLEGE SAVINGS PLANPerformance Statistics for the Period Ending: December 31, 2020
Fund Name Ending Market 3 Months 1 Year 3 Years 5 Years 10 Years Since Inception Inception Date2036/2037 Enrollment Option $28,322,395 11.58% 14.03% 16.25% 10/28/20192036-2037 Custom Benchmark 12.11% 13.12% 15.46%
2034/2035 Enrollment Option $32,941,668 11.04% 13.37% 15.60% 10/28/20192034-2035 Custom Benchmark 11.66% 12.62% 14.94%
2032/2033 Enrollment Option $39,246,810 10.55% 13.30% 15.35% 10/28/20192032-2033 Custom Benchmark 11.11% 12.45% 14.60%
2030/2031 Enrollment Option $50,789,116 9.83% 12.46% 14.44% 10/28/20192030-2031 Custom Benchmark 10.30% 11.63% 13.70%
2028/2029 Enrollment Option $68,469,917 8.45% 11.16% 12.96% 10/28/20192028-2029 Custom Benchmark 8.95% 10.21% 12.15%
2026/2027 Enrollment Option $98,109,125 7.04% 10.36% 11.71% 10/28/20192026-2027 Custom Benchmark 7.46% 9.44% 10.96%
2024/2025 Enrollment Option $140,658,923 5.64% 9.24% 10.30% 10/28/20192024-2025 Custom Benchmark 5.99% 8.20% 9.43%
2022/2023 Enrollment Option $173,446,950 4.00% 6.85% 7.72% 10/28/20192022-2023 Custom Benchmark 4.18% 5.71% 6.82%
2020/2021 Enrollment Option $192,000,924 2.87% 6.11% 4.70% 10/28/20192020-2021 Custom Benchmark 2.96% 5.05% 3.67%
In School Option $186,107,047 2.66% 6.52% 6.64% 10/28/2019In School Custom Benchmark 2.66% 4.91% 5.31%
Annualized
Page 89

MINNESOTA COLLEGE SAVINGS PLANPerformance Statistics for the Period Ending: December 31, 2020
Fund Name Ending Market 3 Months 1 Year 3 Years 5 Years 10 Years Since Inception Inception DateU.S. and International Equity Option $302,062,128 14.43% 14.65% 10.68% 12.43% 10.82% 7.73% 10/ 1/2001BB: U.S. and International Equity Option 15.02% 13.94% 10.31% 12.26% 10.86% 8.46%
Moderate Allocation Option $86,748,938 9.14% 12.61% 8.78% 9.49% 8.00% 6.17% 8/ 2/2007BB: Moderate Allocation Option 9.54% 11.97% 8.66% 9.45% 8.24% 6.71%
100% Fixed-Income Option $23,784,858 1.15% 6.96% 4.93% 4.35% 3.35% 3.93% 8/16/2007BB: 100% Fixed-Income Option 1.39% 7.24% 5.25% 4.68% 3.84% 4.54%
International Equity Index Option $6,821,443 16.07% 9.48% 4.59% 8.43% 5.75% 6/18/2013BB: International Equity Index Option 16.84% 10.00% 4.74% 8.58% 6.01%
Money Market Option $15,806,606 0.00% 0.37% 1.34% 0.94% 0.46% 0.55% 11/ 1/2007BB: Money Market Option 0.00% 0.28% 1.16% 0.80% 0.41% 0.49%
Principal Plus Interest Option $136,330,985 0.38% 1.85% 1.89% 1.72% 1.65% 2.45% 10/10/2001Citigroup 3-Month U.S. Treasury Bill 0.02% 0.58% 1.56% 1.16% 0.60% 1.31%
Aggressive Allocation Option $49,364,884 11.68% 13.60% 9.69% 11.01% 8.88% 8/12/2014BB: Aggressive Allocation Option 12.28% 13.08% 9.55% 10.89% 8.75%
Conservative Allocation Option $15,683,606 4.85% 8.53% 6.11% 6.27% 4.97% 8/18/2014BB: Conservative Allocation Option 5.11% 8.17% 6.16% 6.24% 5.01%
Equity and Interest Accumulation Option $5,856,160 7.25% 11.57% 8.20% 8.50% 7.16% 8/18/2014BB: Equity and Interest Accumulation Option 7.31% 11.28% 8.37% 8.43% 7.13%
U.S. Large Cap Equity Option $62,092,248 12.07% 18.20% 13.97% 15.00% 13.00% 8/12/2014BB: U.S. Large Cap Equity Option 12.15% 18.40% 14.18% 15.22% 13.10%
Matching Grant $2,126,317 0.38% 1.85% 1.89% 1.72% 1.65% 2.45% 3/22/2002Citigroup 3-Month U.S. Treasury Bill 0.02% 0.58% 1.56% 1.16% 0.60% 1.31%
Annualized
Page 90

Total Market Value: 16,577,035$
Fund Name Market Value % of Plan 1 Month 3 Months YTD 1 Year 3 Year 5 Year 10 Year InceptionInception Date
Aggressive Option 1,371,111$ 8.27% 4.61 15.32 15.57 15.57 10.05 11.73 12/15/16ABLE Aggressive Custom Benchmark 4.75 15.83 16.56 16.56 10.59 12.40Variance (0.14) (0.51) (0.99) (0.99) (0.54) (0.67)
Moderately Aggressive Option 1,609,898$ 9.71% 3.95 12.88 14.51 14.51 9.27 10.53 12/15/16ABLE Moderately Aggressive Custom Benchmark 4.09 13.35 15.65 15.65 9.92 11.24Variance (0.14) (0.47) (1.14) (1.14) (0.65) (0.71)
Growth Option 2,176,814$ 13.13% 3.25 10.43 13.05 13.05 8.40 9.23 12/15/16ABLE Growth Custom Benchmark 3.42 10.86 14.36 14.36 9.09 9.97Variance (0.17) (0.43) (1.31) (1.31) (0.69) (0.74)
Moderate Option 1,877,117$ 11.32% 2.56 8.02 11.56 11.56 7.42 7.92 12/15/16ABLE Moderate Custom Benchmark 2.72 8.38 12.72 12.72 8.11 8.60Variance (0.16) (0.36) (1.16) (1.16) (0.69) (0.68)
Moderately Conservative Option 1,872,930$ 11.30% 1.78 5.43 8.43 8.43 5.69 5.90 12/15/16ABLE Moderately Conservative Custom Benchmark 1.89 5.67 9.36 9.36 6.28 6.47Variance (0.11) (0.24) (0.93) (0.93) (0.59) (0.57)
Conservative Option 2,910,989$ 17.56% 0.71 1.98 4.13 4.13 3.26 3.16 12/15/16ABLE Conservative Custom Benchmark 0.72 2.04 4.38 4.38 3.59 3.47Variance (0.01) (0.06) (0.25) (0.25) (0.33) (0.31)
Checking Option 4,758,176$ 28.70% 03/30/17
MINNESOTA ACHIEVE A BETTER LIFE EXPERIENCE
The SBI and DHS have jointly contracted with Ascensus to provide recordkeeping, administrative, and investment management services for the plan.
RISK BASED ALLOCATIONS
Performance as of 12/31/20
The Minnesota Achieve a Better Life Experience Plan (ABLE) is a savings plan designed to help individuals save for qualified disability expenses without losing eligibility for certain assistance programs. The plan is administered by the Department of Human Services (DHS).
The plan offers seven different allocation investment options: Aggressive, Moderately Aggressive, Growth, Moderate, Moderately Conservative, Conservative, and Checking. Each allocation is based on a fixed risk level.
Page 91

This page intentionally left blank.
Page 92

Non-RetirementDecember 31, 2020
Minnesota State Board of InvestmentQuarter Ending December 31, 2020
Quarterly Report
Page 93

Non-Retirement Funds
The SBI manages funds for trusts and programs created by the Minnesota State Constitution and Legislature.
• The Permanent School Fund is a trust established for the benefit of Minnesota public schools.
• The Environmental Trust Fund is a trust established for the protection and enhancement of Minnesota’s environment. It is funded with a portion of the proceeds fromthe state’s lottery.
• The Minnesota Workers Compensation Assigned Risk Plan provides worker compensation insurance for companies unable to obtain coverage through privatecarriers.
• The Closed Landfill Investment Fund is a trust created by the Legislature to invest money to pay for the long-term costs of maintaining the integrity of landfills inMinnesota once they are closed.
• Other Post-Employment Benefits Accounts (OPEB) are the assets set aside by local units of government for the payment of retiree benefits trusteed by the PublicEmployees Retirement Association.
• Miscellanous Trust Accounts are other small funds managed by the SBI for a variety of purposes.
All equity, fixed income, and cash assets for these accounts are managed externally by investment management firms retained by the SBI.
Minnesota State Board of InvestmentQuarter Ending December 31, 2020
Quarterly Report
Page 94

Ending Market Value Last Qtr 1 Year 3 Year 5 Year 10 Year
Assigned Risk Account $298,572,286 2.4% 9.5% 6.7% 5.7% 5.0%
EQUITIES 61,851,175 12.1 18.4 14.2 15.0 13.2
FIXED INCOME 236,721,111 -0.1 6.0 4.2 3.0 2.6
ASSIGNED RISK - COMPOSITE INDEX 2.2 8.8 6.4 5.5 4.8
Excess 0.2 0.7 0.3 0.2 0.2
S&P 500 12.1 18.4 14.2 15.2 13.9
BBG BARC US Gov: Int -0.2 5.7 4.1 2.9 2.5
Assigned Risk Plan
The Assigned Risk plan has two investment objectives: to minimize the mismatchbetween assets and liabilities and to provide sufficient liquidity for the payment ofongoing claims and operating expenses.
The Assigned Risk Plan is invested in a portfolio of common stocks and bonds
The equity segment is passively managed to track the performance of the S&P 500.
The fixed income benchmark is the Bloomberg Barclays Intermediate GovernmentIndex. The total fund benchmark is a combination of the fixed income and equitybenchmarks, weighted according to the total fund asset allocation targets of 80%equities and 20% fixed income. The actual asset mix will fluctuate and is shown inthe graph below.
Assigned Risk Account ASSIGNED RISK - COMPOSITE INDEX
3 Month 1 Year 3 Year 5 Year 10 Year
0.0
1.5
3.0
4.5
6.0
7.5
9.0
10.5
Assigned Risk Account ASSIGNED RISK - COMPOSITE INDEX
3 Month 1 Year 3 Year 5 Year 10 Year
0.0
1.5
3.0
4.5
6.0
7.5
9.0
10.5
FIXED INCOME
79.3%
EQUITIES 20.7%
FIXED INCOME
79.3%
EQUITIES 20.7%
Note: Since 12/1/2017 the Assigned Risk equity segment has been managed by Mellon. From 1/17/2017-11/30/2017 it was managed internally by SBI staff. Prior to 1/17/2017 the equity segment wasmanaged by SSgA (formerly GE Investment Mgmt.). RBC manages the fixed income segment of the Fund.
Minnesota State Board of InvestmentQuarter Ending December 31, 2020Non-Retirement Funds
Non-Retirement
Page 95

Ending Market Value Last Qtr 1 Year 3 Year 5 Year 10 Year
PERMANENT SCHOOL FUND $1,813,672,883 7.0% 13.5% 10.2% 10.2% 9.2%
CASH EQUIVALENTS 33,344,719 0.0 0.6 1.6 1.2 0.7
EQUITIES 988,146,512 12.1 18.4 14.2 15.2 13.9
FIXED INCOME 792,181,652 1.5 8.2 5.9 5.0 4.3
PERMANENT SCHOOL - COMP INDEX 6.4 13.5 10.1 10.0 9.0
Excess 0.6 -0.0 0.1 0.2 0.2
S&P 500 12.1 18.4 14.2 15.2 13.9
BBG BARC US Agg 0.7 7.5 5.3 4.4 3.8
Permanent School Fund
The investment objective of the Permanent School Fund is to produce a growinglevel of spendable income, within the constraints of maintaining adequate portfolioquality and liquidity. The income from the portfolio is transferred to the schoolendowment fund and distributed to Minnesota's public schools.
The Permanent School Fund is invested in a balanced portfolio of common stocksand bonds. Common stocks provide the potential for significant capitalappreciation, while bonds provide portfolio diversification and a more stable streamof current income.
The stock segment is passively managed to track the performance of the S&P 500.The bond segment is actively managed to add incremental value through sector,security and yield curve decisions. The fixed income benchmark is the BloombergBarclays U.S. Aggregate. The total fund benchmark is a combination of the fixedincome and equity benchmarks, weighted according to the total fund assetallocation targets of 2% cash, 50% equity, and 48% fixed income. The actual assetmix will fluctuate and is shown in the graph below.
PERMANENT SCHOOL FUND PERMANENT SCHOOL - COMP INDEX
3 Month 1 Year 3 Year 5 Year 10 Year
0.0
2.0
4.0
6.0
8.0
10.0
12.0
14.0
PERMANENT SCHOOL FUND PERMANENT SCHOOL - COMP INDEX
3 Month 1 Year 3 Year 5 Year 10 Year
0.0
2.0
4.0
6.0
8.0
10.0
12.0
14.0
Note: Since 12/1/2017 the equity segment has been managed by Mellon and the fixed income segment by Prudential. Prior to 12/1/2017 both segments were managed internally by SBI staff. Prior to 7/1/97 theFund allocation was 100% fixed income.
FIXED INCOME
43.7%
CASH EQUIVALENTS 1.8%
EQUITIES 54.5%
FIXED INCOME
43.7%
CASH EQUIVALENTS 1.8%
EQUITIES 54.5%
Minnesota State Board of InvestmentQuarter Ending December 31, 2020Non-Retirement Funds
Non-Retirement
Page 96

Ending Market Value Last Qtr 1 Year 3 Year 5 Year 10 Year
SBI ENVIRONMENTAL TRUST $1,490,135,199 8.9% 16.1% 12.0% 12.3% 11.1%
CASH EQUIVALENTS 27,673,511 0.0 0.6 1.6 1.2 0.7
EQUITIES 1,074,906,737 12.1 18.4 14.2 15.2 13.9
FIXED INCOME 387,554,951 1.5 8.2 5.9 5.0 4.3
Environmental Trust Benchmark 8.7 15.6 11.8 12.1 10.9
Excess 0.2 0.5 0.2 0.2 0.2
S&P 500 12.1 18.4 14.2 15.2 13.9
BBG BARC US Agg 0.7 7.5 5.3 4.4 3.8
Environmental Trust Fund
The objective of the Environmental Trust Fund is to increase the market value ofthe Fund over time in order to increase the annual amount made available forspending within the constraints of maintaining adequate portfolio quality andliquidity.
The Environmental Trust Fund is invested in a balanced portfolio of commonstocks and bonds. Common stocks provide the potential for significant capitalappreciation, while bonds act as a deflation hedge and provide portfoliodiversification.
The bond segment is actively managed to add incremental value through sector,security and yield curve decisions. The stock segment is passively managed totrack the performance of the S&P 500. The fixed income benchmark is theBloomberg Barclays U.S. Aggregate. The total fund benchmark is a combination ofthe fixed income and equity benchmarks, weighted according to the total fund assetallocation targets of 2% cash, 70% equities, and 28% fixed income. The actual assetmix will fluctuate and is shown in the graph below.
SBI ENVIRONMENTAL TRUST Environmental Trust Benchmark
3 Month 1 Year 3 Year 5 Year 10 Year
0.0
2.5
5.0
7.5
10.0
12.5
15.0
17.5
SBI ENVIRONMENTAL TRUST Environmental Trust Benchmark
3 Month 1 Year 3 Year 5 Year 10 Year
0.0
2.5
5.0
7.5
10.0
12.5
15.0
17.5
Note: Since 12/1/2017 the equity segment has been managed by Mellon and the fixed income segment by Prudential. Prior to 12/1/2017 both segments were managed internally by SBI staff. From 7/1/94 to7/1/99, the Fund's target allocation and benchmark was 50% fixed income and 50% stock. Prior to 7/1/94 the Fund was invested entirely in short-term instruments as part of the Invested Treasurer's Cash pool.
FIXED INCOME
26.0%
CASH EQUIVALENTS 1.9%
EQUITIES 72.1%
FIXED INCOME
26.0%
CASH EQUIVALENTS 1.9%
EQUITIES 72.1%
Minnesota State Board of InvestmentQuarter Ending December 31, 2020Non-Retirement Funds
Non-Retirement
Page 97
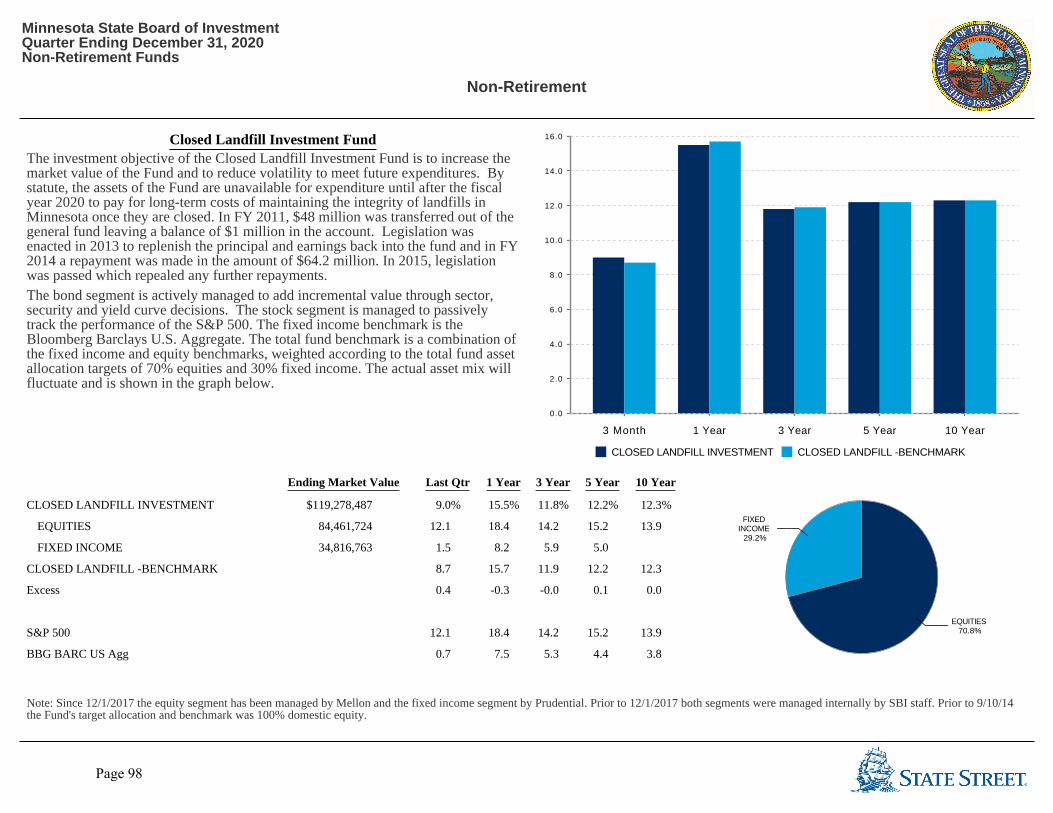
Ending Market Value Last Qtr 1 Year 3 Year 5 Year 10 Year
CLOSED LANDFILL INVESTMENT $119,278,487 9.0% 15.5% 11.8% 12.2% 12.3%
EQUITIES 84,461,724 12.1 18.4 14.2 15.2 13.9
FIXED INCOME 34,816,763 1.5 8.2 5.9 5.0
CLOSED LANDFILL -BENCHMARK 8.7 15.7 11.9 12.2 12.3
Excess 0.4 -0.3 -0.0 0.1 0.0
S&P 500 12.1 18.4 14.2 15.2 13.9
BBG BARC US Agg 0.7 7.5 5.3 4.4 3.8
FIXED INCOME
29.2%
EQUITIES 70.8%
FIXED INCOME
29.2%
EQUITIES 70.8%
Note: Since 12/1/2017 the equity segment has been managed by Mellon and the fixed income segment by Prudential. Prior to 12/1/2017 both segments were managed internally by SBI staff. Prior to 9/10/14the Fund's target allocation and benchmark was 100% domestic equity.
Closed Landfill Investment Fund
The investment objective of the Closed Landfill Investment Fund is to increase themarket value of the Fund and to reduce volatility to meet future expenditures. Bystatute, the assets of the Fund are unavailable for expenditure until after the fiscalyear 2020 to pay for long-term costs of maintaining the integrity of landfills inMinnesota once they are closed. In FY 2011, $48 million was transferred out of thegeneral fund leaving a balance of $1 million in the account. Legislation wasenacted in 2013 to replenish the principal and earnings back into the fund and in FY2014 a repayment was made in the amount of $64.2 million. In 2015, legislationwas passed which repealed any further repayments.
The bond segment is actively managed to add incremental value through sector,security and yield curve decisions. The stock segment is managed to passivelytrack the performance of the S&P 500. The fixed income benchmark is theBloomberg Barclays U.S. Aggregate. The total fund benchmark is a combination ofthe fixed income and equity benchmarks, weighted according to the total fund assetallocation targets of 70% equities and 30% fixed income. The actual asset mix willfluctuate and is shown in the graph below.
CLOSED LANDFILL INVESTMENT CLOSED LANDFILL -BENCHMARK
3 Month 1 Year 3 Year 5 Year 10 Year
0.0
2.0
4.0
6.0
8.0
10.0
12.0
14.0
16.0
CLOSED LANDFILL INVESTMENT CLOSED LANDFILL -BENCHMARK
3 Month 1 Year 3 Year 5 Year 10 Year
0.0
2.0
4.0
6.0
8.0
10.0
12.0
14.0
16.0
Minnesota State Board of InvestmentQuarter Ending December 31, 2020Non-Retirement Funds
Non-Retirement
Page 98

Ending Market Value Last Qtr Fiscal YTD 1 Year 3 Year 5 Year 10 Year Since Inception Inception Date
NON RETIREMENT EQUITYINDEX - MELLON
3,035,226,124 12.1 22.2 18.4 14.2 15.2 13.9 10.2 07/1993
S&P 500 INDEX (DAILY) 12.1 22.2 18.4 14.2 15.2 13.9 10.2 07/1993
Excess -0.0 -0.0 0.0 0.0 -0.0 -0.0 0.1
NON RETIREMENT FIXEDINCOME - PRUDENTIAL
1,407,566,508 1.5 2.8 8.2 5.9 5.0 4.3 6.1 07/1994
BBG BARC Agg (Dly) 0.7 1.3 7.5 5.3 4.4 3.8 5.6 07/1994
Excess 0.8 1.5 0.7 0.5 0.5 0.4 0.5
RBC 236,721,010 -0.1 0.2 6.0 4.2 3.0 2.6 4.9 07/1991
RBC Custom Benchmark 07/1991
Excess
MET COUNCIL OPEB BONDPOOL
56,018,378 0.0 0.2 3.0
NON RETIREMENT CASH 167,762,833 0.0 0.1 0.5 1.6 1.2 0.7 2.6
iMoneyNet Money Fund Average-All Taxable
0.0 0.0 0.3 1.2 0.9 0.4
Excess 0.0 0.1 0.2 0.4 0.4 0.3
Note:
RBC is the manager for the fixed income portion of the assigned risk account. RBC changed its name from Voyageur Asset Management on 1/1/2010. The currentbenchmark is the Bloomberg Barclays Intermediate Government Index. Prior to 7/1/11 the Voyageur Custom Index was 10% 90 day T-Bill, 25% Merrill 1-3 Government,15% Merrill 3-5 Government, 25% Merrill 5-10 Government, 25% Merrill Mortgage Master.
Prior to 12/1/17 the Non Retirement Equity Index and Non Retirement Fixed Income accounts were managed internally by SBI staff.
In addition to the Non-Retirement Funds listed on the previous pages, the Non Retirement Equity Index and the Non Retirement Fixed Income accounts also include theassets of various smaller Miscellaneous Trust Accounts and Other Post Employment Benefits.
Minnesota State Board of InvestmentQuarter Ending December 31, 2020Non-Retirement Managers
Page 99

This page intentionally left blank.
Page 100

State CashDecember 31, 2020
Minnesota State Board of InvestmentQuarter Ending December 31, 2020
Quarterly Report
Page 101

Ending Market Value Last Qtr 1 Year 3 Year 5 Year 10 Year
Treasurer's Cash 13,581,583,120 0.1 1.0 1.9 1.5 1.0
iMoneyNet Money Fund Average-All Taxable 0.0 0.3 1.2 0.9 0.4
Invested Treasurer's Cash
The Invested Treasurer's Cash Pool (ITC) represents the balances in more than 400 separate accounts that flow through the Minnesota State Treasury. These accounts varygreatly in size. The ITC contains the cash balances of certain State agencies and non-dedicated cash in the State Treasury.
The investment objectives of the ITC, in order of priority, are as follows:
• Safety of Principal. To preserve capital.
• Liquidity. To meet cash needs without the forced sale of securities at a loss.
• Competitive Rate of Return. To provide a level of current income consistent with the goal of preserving capital.
The SBI seeks to provide safety of principal by investing all cash accounts in high quality, liquid, short term investments. These include U.S. Treasury and Agencyissues, repurchase agreements, bankers acceptances, commercial paper, and certificates of deposit.
Beginning in January 2003, the Treasurer's Cash Pool is measured against the iMoneyNet, All Taxable Money Fund Report Average.
Other State Cash Accounts
Due to differing investment objectives, strategies, and time horizons, some State agencies' accounts are invested seperately. These agencies direct the investments orprovide the SBI with investment guidelines and the SBI executes on their behalf. Consequently, returns are shown for informational purposes only and there are nobenchmarks for these accounts.
Ending Market Value Last Qtr 1 Year 3 Year 5 Year 10 Year
Debt Service 70,445,999 0.8 4.8 3.8 3.2
Public Facilities Authority 3,393,922 0.2 0.9 1.6 1.9
Minnesota State Board of InvestmentQuarter Ending December 31, 2020State Cash
State Cash Accounts
Page 102

Benchmark Definitions
Active Domestic Equity Benchmark:
A weighted composite each of the individual active domestic equity managers’ benchmarks. Effective 3/1/2017 the calculation uses the average weight of the managerrelative to the total group of active managers during the month. Prior to 3/1/2017 the beginning of the month weight relative to the total group was used.
Benchmark DM:
Since 6/1/08 the developed markets managers' benchmark, "Benchmark DM," is the Standard (large + mid) MSCI World ex USA (net). From 10/1/07 through 5/31/08 thebenchmark was the Provisional Standard MSCI World ex USA (net). From 10/1/03 to 9/30/07 the benchmark was the MSCI World ex USA (net). Prior to that date, it wasthe MSCI EAFE Free (net), including from 10/1/01 to 5/31/02 when it was the Provisional MSCI EAFE Free (net).
Benchmark EM:
Since 6/1/08 the emerging markets managers' benchmark, "Benchmark EM,"is the Standard (large + mid) MSCI Emerging Markets Free (net). From 10/1/07 through5/31/08 the benchmark was the Provisional Standard MSCI Emerging Markets Free (net). From 1/1/01 to 9/30/07 the benchmark was the MSCI Emerging Markets Free(net), including from 10/1/01 to 5/31/02 when it was the Provisional MSCI Emerging Markets Free (net). Prior to 1/1/01, it was the MSCI Emerging Markets Free (gross).
Combined Funds Composite Index:
The Composite Index performance is calculated by multiplying the beginning of month Composite weights by the monthly returns of the asset class benchmarks. Assetclass weights for Private Markets - Invested and Private Markets - Uninvested are reset at the start of each month. From 1/1/2018-2/28/2019 the Transitional Policy Targetwas used to reflect the addition of Treasuries to the Fixed Income portfolio. From 7/1/2016-12/31/2016 the composite weights were set to match actual allocation as theportfolio was brought into line with the new Strategic Asset Allocation Policy Target. 7/1/2016 to 12/1/2020 the uninvested portion of Private Markets allocated to PublicEquity. Prior to 7/1/2016 the uninvested portion of the Private Markets was invested in Fixed Income and the Composite Index was adjusted accordingly. When theStrategic Asset Allocation Policy Target changes, so does the Composite Index.
Core Bonds Benchmark:
In 2016, the Barclays Agg was rebranded Bloomberg Barclays Agg to reflect an ownership change. Prior to 9/18/2008 this index was called the Lehman BrothersAggregate Bond Index. From 7/1/84-6/30/94 the asset class benchmark was the Salomon Brothers Broad Investment Grade Index. The SBI name for this benchmarkchanged from Fixed Income to Core Bonds on March 31, 2020.
Domestic Equity Benchmark:
Since 12/1/2020 the benchmark is the Russell 3000. From 1/1/2019-11/30/2020 the benchmark was 90% Russell 1000 and 10% Russell 2000. From 10/1/2003 to12/31/2018 it was the Russell 3000. From 7/1/1999 to 9/30/2003, it was the Wilshire 5000 Investable Index. From 11/1/1993 to 6/30/1999, the target was the Wilshire5000 as reported with no adjustments. Prior to 11/1/1993, the Wilshire 5000 was adjusted to reflect SBI mandated restrictions, which included liquor and tobacco,American Home Products and South Africa.
Minnesota State Board of InvestmentQuarter Ending December 31, 2020
Addendum
Page 103

Fixed Interest Blended Benchmark: Since 6/1/2002, equals 3 Year Constant Maturity Treasury Yield + 45 bps. Prior to this change it was the 3 Year Constant MaturityTreasury Yield + 30 bps.
International Equity Benchmark:
Since 12/1/2020 equals the MSCI ACWI ex-US9Net). From 1/1/2018 to 1/1/2019 it was 75% MSCI World ex USA Index (net) and 25% MSCI Emerging Markets Index(net). From 6/1/08 to 12/31/2018 the International Equity asset class target was the Standard (large + mid) MSCI ACWI ex U.S. (net). From 10/1/07 through 5/31/08 thebenchmark was the Provisional Standard MSCI ACWI ex U.S. (net). From 10/1/03 to 9/30/07 the target was MSCI ACWI ex U.S. (net). From 1/1/01 to 9/30/03, thetarget was MSCI EAFE Free (net) plus Emerging Markets Free (net), and from 7/1/99 to 12/31/00 the target was MSCI EAFE Free (net) plus Emerging Markets Free(gross). From 7/1/99 to 9/30/03, the weighting of each index fluctuated with market capitalization. From 10/1/01 to 5/31/02 all international benchmarks being reportedwere the MSCI Provisional indices. From 12/31/96 to 6/30/99 the benchmark was fixed at 87% EAFE Free (net)/13% Emerging Markets Free (gross). On 5/1/96, theportfolio began transitioning from 100% EAFE Free (net) to the 12/31/96 fixed weights. Prior to 5/1/96 it was 100% the EAFE Free (net).
Passive Domestic Equity Benchmark:
A weighted average of the Russell 1000 and Russell 3000 effective 10/1/2016. From 10/1/2003 to 10/1/2016 it was equal to the Russell 3000. From 7/1/2000 to9/30/2003, it was the Wilshire 5000 Investable Index. From 11/1/1993 to 6/30/2000, the target was the Wilshire 5000 as reported with no adjustments. Prior to 11/1/1993,the Wilshire 5000 was adjusted to reflect SBI mandated restrictions, which included liquor and tobacco, American Home Products and South Africa.
Passive Manager Benchmark:
Russell 3000 effective 10/1/2003. From 7/1/2000 to 9/30/2003, it was the Wilshire 5000 Investable Index. From 11/1/1993 to 6/30/2000, the target was the Wilshire 5000as reported with no adjustments. Prior to 11/1/1993, the Wilshire 5000 was adjusted to reflect SBI mandated restrictions, which included liquor and tobacco, AmericanHome Products and South Africa.
Public Equity Benchmark:
Since 12/1/2020 it is 67% Russell 3000 and 33% MSCI ACWI ex-US(net). From 1/1/2019 to 12/1/2020 it was 60.3% Russell 1000, 6.7% Russell 2000, 24.75% MSCIWorld Ex US (net), and 8.25% MSCI EM (net). From 7/1/2017 thru 12/31/2018 it was 67% Russell 3000 and 33% MSCI ACWI ex USA. Prior to 6/30/16 the returns ofDomestic and International Equity were not reported as a total Public Equity return. From 6/30/16-6/30/17 the Public Equity benchmark adjusted by 2% each quarter from75% Russell 3000 and 25% MSCI ACWI ex USA until it reached 67% and 33%.
Semi-Passive Domestic Equity Benchmark: Russell 1000 index effective 1/1/2004. Prior to 1/1/2004 it was the Completeness Fund benchmark.
Total Fixed Income Benchmark:
Since 7/1/2020 the Total Fixed Income benchmark is 40% Bloomberg Barclays U.S. Aggregate Index/ 40% Bloomberg Barclays Treasury 5+ Years Index/ 20% ICEBofA US 3-Month Treasury Bill. From 4/1/2019-6/30/2020 it was 50% Bloomberg Barclays Agg and 50% Bloomberg Barclays Treasury 5+ Years Index. From 2/1/2018-3/31/19 the weighting of this benchmark reflected the relative weights of the Core Bonds and Treasuries allocations in the Combined Funds Composite.
Minnesota State Board of InvestmentQuarter Ending December 31, 2020
Addendum
Page 104