Embed Size (px)
Citation preview
Comprehensive Plan
URBAN VILLAGE INDICATORS MONITORING REPORT
2018
HIGHLIGHTS Full report will soon be available on OPCD’s website
The Comprehensive Plan Urban Village Monitoring Report is prepared on a periodic basis by the City of Seattle Office
of Planning and Community Development (OPCD). OPCD prepared the 2018 report with information and assistance
from the Mayor’s Office, City Council Central Legislative Staff, Office of Housing (OH), Seattle Department of
Construction and Inspections (SDCI), Seattle Department of Transportation (SDOT), Seattle IT, Seattle Parks and
Recreation (SPR) Seattle Planning Commission, and the Puget Sound Regional Council (PSRC).
Contacts:
Diana Canzoneri, City Demographer, OPCD, [email protected],
Michael Hubner, Comprehensive Planning Manager, OPCD, [email protected]
Jason W. Kelly, Communications Director, OPCD, [email protected]
Highlights from the 2018 Urban Village Indicators Monitoring Report | p. 1
Introduction
This is the first in a series of periodic monitoring reports that will track growth and gauge progress in
implementing the 20-year Seattle 2035 Comprehensive Plan.
SEATTLE’S COMPREHENSIVE PLAN AND THE IMPORTANCE OF
MONITORING
Seattle’s Comprehensive Plan provides the overall vision and policy
framework that informs our work to enhance the livability of the city as
we welcome new residents and jobs.
The City recently adopted a major update of the Plan: “Seattle 2035
Comprehensive Plan: Managing Growth to Become an Equitable and
Sustainable City.” The foundation of the Plan continues to be the Urban
Village Strategy. This strategy is designed to guide growth to the denser areas
in the city that are best able to thrive on that growth while enabling the City to
efficiently expand access to public services important for livability.
OUR APPROACH TO MONITORING
The introduction to the Seattle 2035 Comprehensive Plan outlines the
City’s commitment and approach to monitoring:
Defining and Measuring Success
There will always be ways the City can improve to meet changing needs and to address ongoing
concerns. Because of the changing nature of our region and our city, the success of this Plan is not
measured by an ideal end state. Instead, success is measured by whether we are moving in the
directions the Plan lays out.
The Plan covers many topics in several chapters, and monitoring progress on every one of those topics
would be a time-consuming and demanding task. To simplify the monitoring process, the City has
identified several indicators that will provide insights about progress on key issues addressed by the
Plan. The City will collect baseline data and track these indicators over time. Indicators will be tracked for
the city as a whole and for each urban village, as feasible, to help assess progress in implementing the
Growth Strategy. The City will report regularly on changes in these indicators to help the public and
elected officials judge the effectiveness of the Plan and the City’s actions to implement it.
The report is divided into three sections, each with indicators on multiple topics. These topics were
identified for tracking in the guidance provided in the Comprehensive Plan introduction:
Growth: housing growth, and employment growth
Affordability: the affordability of market-rate housing, and the supply of housing dedicated to serving
low-income households
Livability: access to transit, presence of sidewalks, and access to parks and open space
Each of the indicators provides meaningful information on how the city is growing and progressing relative to the
Plan’s goals and policies. Each of these indicators also has limitations and tells only a partial story.
We’ll be updating several of the indicators, including housing and employment growth, on an annual basis. We
will be reporting less frequently on other indicators, such as the presence of sidewalks and access to parks and
open space, for which large changes are not expected on an annual basis. We will produce another full report
monitoring report in 2021 to inform the next major update of the Comprehensive Plan, which is scheduled
for 2023. In other years, updates on the indicators will be reported online in a streamlined format.
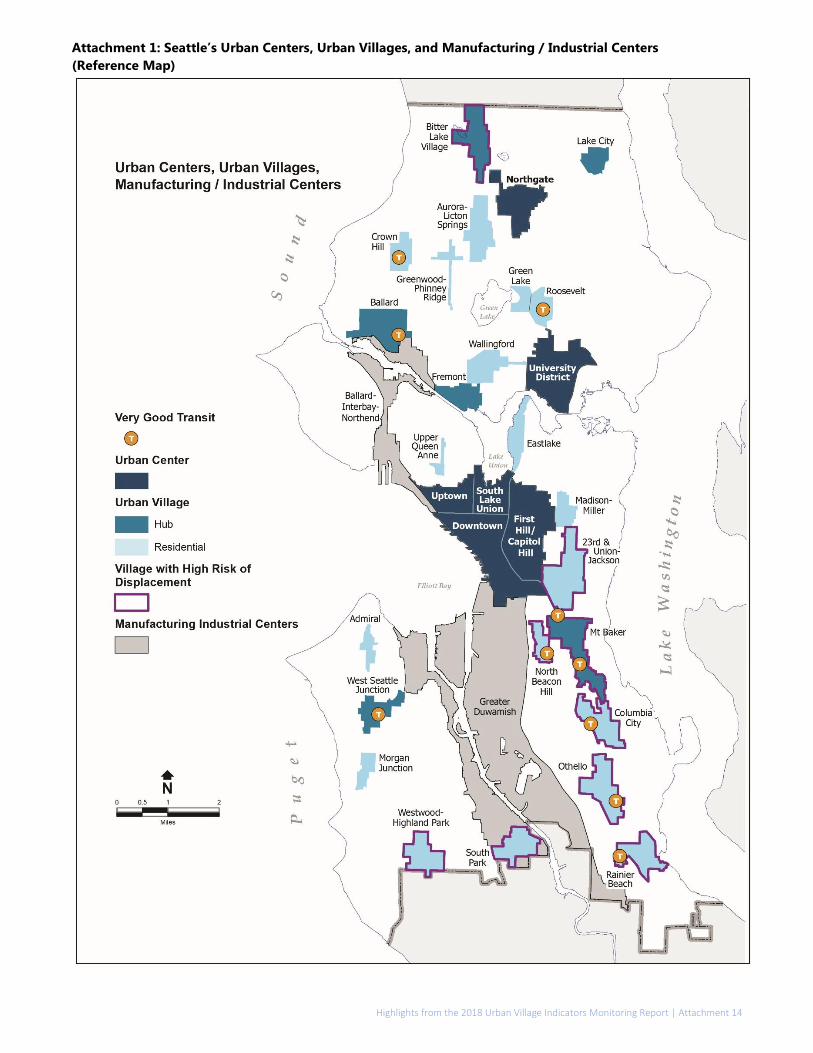
See Attachment 1 for a reference map showing the location and boundaries of Seattle’s urban centers and
villages.
Highlights from the 2018 Urban Village Indicators Monitoring Report | p. 2
The indicators we’re monitoring:
SECTION 1: HOUSING AND EMPLOYMENT GROWTH
HOUSING GROWTH
The housing growth indicators we are tracking compare the housing growth that has occurred since the
beginning of the current twenty-year planning period with the amount and distribution of housing
growth estimated in the Comprehensive Plan.
EMPLOYMENT GROWTH
The employment growth indicators compare the job growth that has occurred during the current
planning period with the amount and distribution of job growth anticipated in the Plan.
SECTION 2: AFFORDABILITY
AFFORDABILITY OF MARKET-RATE RENTAL HOUSING
Here we’re examining the rents (including the cost of basic utilities) that households pay for market-rate
rental units. To assess affordability of market-rate housing, we look at the average, median (50th
percentile), and 25th percentile rents for these units and identify the income levels households would
need to afford these rents.
INCOME-RESTRICTED AFFORDABLE HOUSING
Here we’re tracking the supply of income-restricted affordable housing units. These are housing units
dedicated to households who are eligible based on their income. Housing costs in these units are capped
to limit the amount that these low-income (or in some programs, moderate-income) households pay.
SECTION 3: LIVABILITY
ACCESS TO FREQUENT TRANSIT SERVICE
We’re examining access to frequent transit by looking at the percentage of housing units in Seattle that
are within a half-mile walk of frequent transit service.
PRESENCE OF SIDEWALKS
We’re measuring the completeness of sidewalks within the Priority Investment Network identified in the
City’s Pedestrian Master Plan.
ACCESS TO PARKS AND OPEN SPACE
To measure access to parks and open space, we are piggybacking on the walkability analysis that Seattle
Parks and Recreation performed for the City’s 2017 Parks and Open Space Plan. That analysis measures
the percentage of housing that is within a short walk of a City park or recreational facility such as a
community center.
Highlights from the 2018 Urban Village Indicators Monitoring Report | p. 3
Housing and Employment Growth
Seattle 2035, the City’s 20-year Comprehensive Plan anticipates the city to grow by at least 70,000 housing
units and 115,000 jobs between 2015 and 2035. Under the state Growth Management Act, cities must identify
long-range growth estimates to ensure that they are planning for zoning and infrastructure sufficient to serve at
least that amount of growth.
To encourage better access to services, transit, and employment over the next 20 years, Seattle’s Growth Strategy
directs 84 percent of housing growth to urban centers and urban villages; the Plan supports the livability of
centers and villages by focusing capital investments in these neighborhoods. Concentrating residential and
employment growth in urban centers and urban villages provides walkable access to many neighborhood services,
enhances the ability of transit to serve commuters efficiently, and reduces greenhouse gas emissions to help meet
carbon emissions goals. The strategy also supports neighborhood commercial districts and existing industry
clusters.
The City’s Growth and Equity Analysis identifies places where there is a high risk that current residents could be
displaced from their homes due to development pressures. To reduce those pressures, the Plan assigned a lower
expected housing growth rate to urban villages with high displacement risk.
HOUSING GROWTH
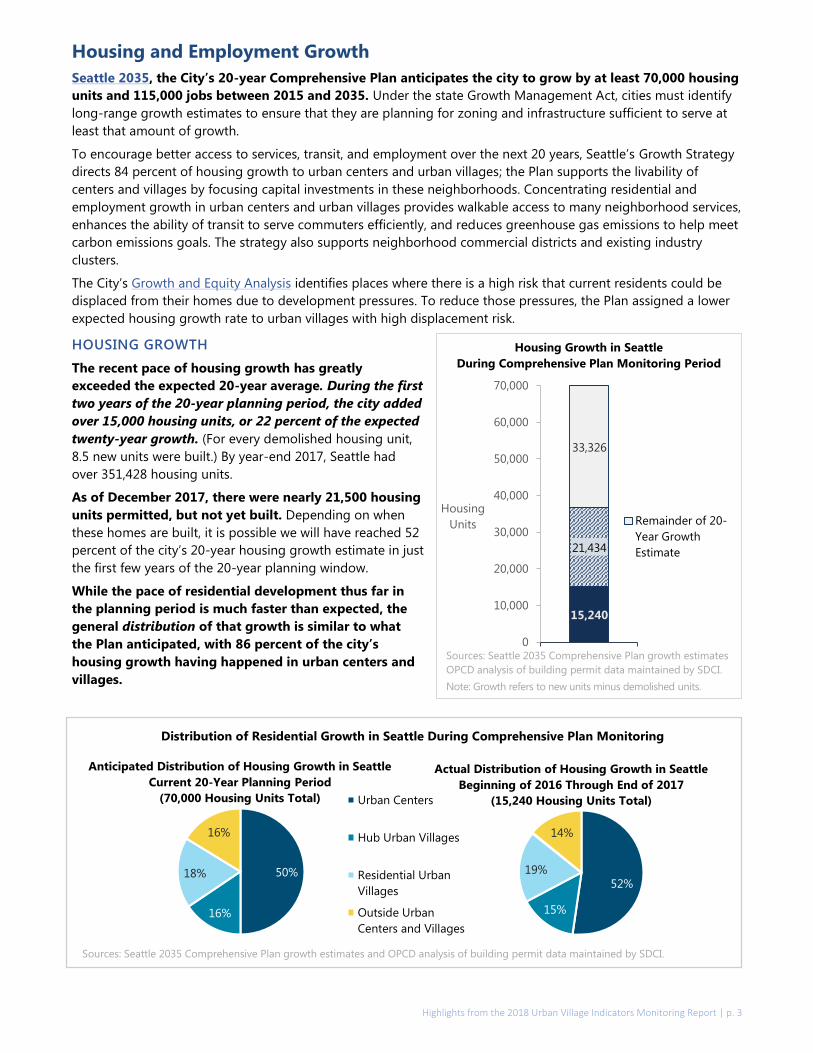
The recent pace of housing growth has greatly
exceeded the expected 20-year average. During the first
two years of the 20-year planning period, the city added
over 15,000 housing units, or 22 percent of the expected
twenty-year growth. (For every demolished housing unit,
8.5 new units were built.) By year-end 2017, Seattle had
over 351,428 housing units.
As of December 2017, there were nearly 21,500 housing
units permitted, but not yet built. Depending on when
these homes are built, it is possible we will have reached 52
percent of the city’s 20-year housing growth estimate in just
the first few years of the 20-year planning window.
While the pace of residential development thus far in
the planning period is much faster than expected, the
general distribution of that growth is similar to what
the Plan anticipated, with 86 percent of the city’s
housing growth having happened in urban centers and
villages.
15,240
21,434
33,326
0
10,000
20,000
30,000
40,000
50,000
60,000
70,000
Housing
Units Remainder of 20-
Year Growth
Estimate
Sources: Seattle 2035 Comprehensive Plan growth estimates
OPCD analysis of building permit data maintained by SDCI.
Note: Growth refers to new units minus demolished units.
Housing Growth in Seattle
During Comprehensive Plan Monitoring Period
Distribution of Residential Growth in Seattle During Comprehensive Plan Monitoring
Period
52%
15%
19%
14%
Actual Distribution of Housing Growth in Seattle
Beginning of 2016 Through End of 2017
(15,240 Housing Units Total)
50%
16%
18%
16%
Anticipated Distribution of Housing Growth in Seattle
Current 20-Year Planning Period
(70,000 Housing Units Total) Urban Centers
Hub Urban Villages
Residential Urban
Villages
Outside Urban
Centers and Villages
Sources: Seattle 2035 Comprehensive Plan growth estimates and OPCD analysis of building permit data maintained by SDCI.
Highlights from the 2018 Urban Village Indicators Monitoring Report | p. 4
Most, although not all, of Seattle’s urban centers grew at a rapid pace. Between January 2016 and
December 2017, Downtown’s housing stock grew by roughly 3,000 units or 12 percent. The neighboring
South Lake Union urban center added more than 2,000 housing units—expanding its housing supply by 46
percent. In contrast, housing growth in the Northgate urban center was practically nil.
Housing growth rates in urban villages also varied considerably, with the fastest growth generally
occurring in residential urban villages with very good transit service. Of these villages, Roosevelt added
housing at the fastest clip (21 percent in two years).
Of the urban villages with high displacement risk, some—Columbia City, North Beacon Hill, and 23rd &
Union Jackson—added housing at very rapid rates, while others— Bitter Lake Village, Rainier Beach,
South Park, and Westwood-Highland Park—added very little housing. Some of the other urban villages in
the city also experienced low growth rates.
Perspective on the variation of housing growth over time
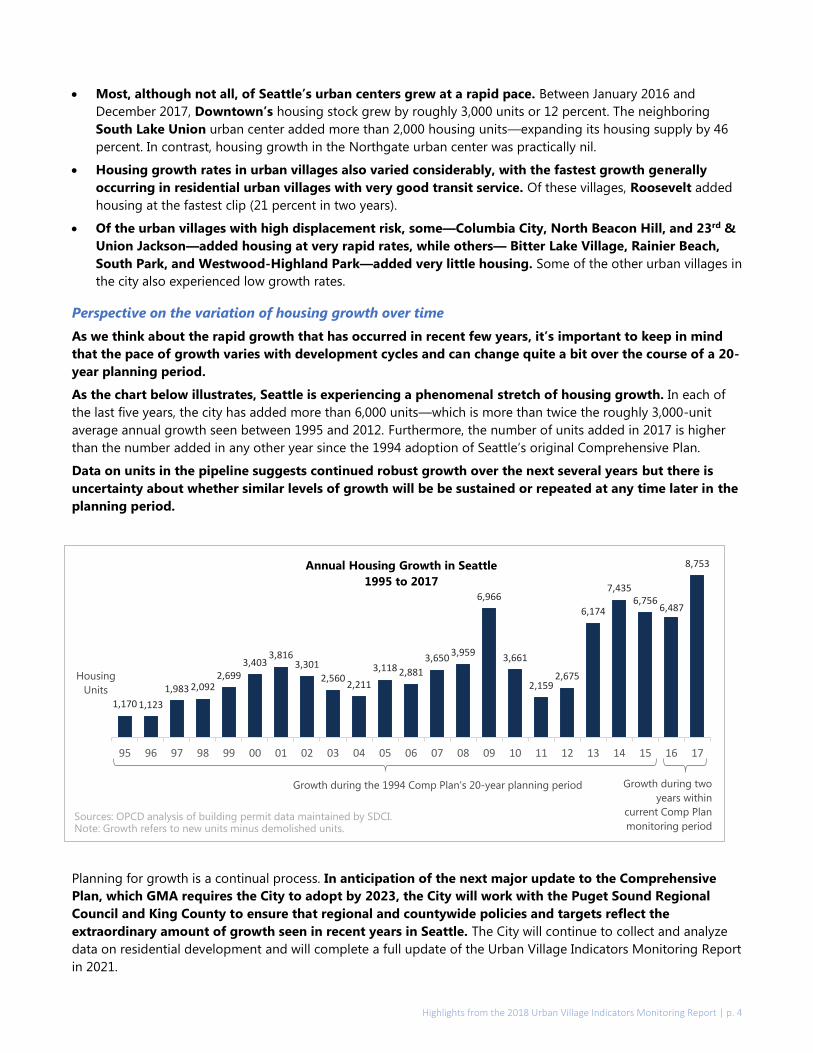
As we think about the rapid growth that has occurred in recent few years, it’s important to keep in mind
that the pace of growth varies with development cycles and can change quite a bit over the course of a 20-
year planning period.
As the chart below illustrates, Seattle is experiencing a phenomenal stretch of housing growth. In each of
the last five years, the city has added more than 6,000 units—which is more than twice the roughly 3,000-unit
average annual growth seen between 1995 and 2012. Furthermore, the number of units added in 2017 is higher
than the number added in any other year since the 1994 adoption of Seattle’s original Comprehensive Plan.
Data on units in the pipeline suggests continued robust growth over the next several years but there is
uncertainty about whether similar levels of growth will be be sustained or repeated at any time later in the
planning period.
Planning for growth is a continual process. In anticipation of the next major update to the Comprehensive
Plan, which GMA requires the City to adopt by 2023, the City will work with the Puget Sound Regional
Council and King County to ensure that regional and countywide policies and targets reflect the
extraordinary amount of growth seen in recent years in Seattle. The City will continue to collect and analyze
data on residential development and will complete a full update of the Urban Village Indicators Monitoring Report
in 2021.
1,170 1,123
1,983 2,0922,699
3,4033,816
3,301
2,5602,211
3,118 2,881
3,6503,959
6,966
3,661
2,1592,675
6,174
7,4356,756
6,487
8,753
95 96 97 98 99 00 01 02 03 04 05 06 07 08 09 10 11 12 13 14 15 16 17
Housing
Units
Annual Housing Growth in Seattle
1995 to 2017
Sources: OPCD analysis of building permit data maintained by SDCI.Note: Growth refers to new units minus demolished units.
Growth during the 1994 Comp Plan's 20-year planning period Growth during two
years within
current Comp Plan
monitoring period
Tim Durkan Photography
Highlights from the 2018 Urban Village Indicators Monitoring Report | p. 5
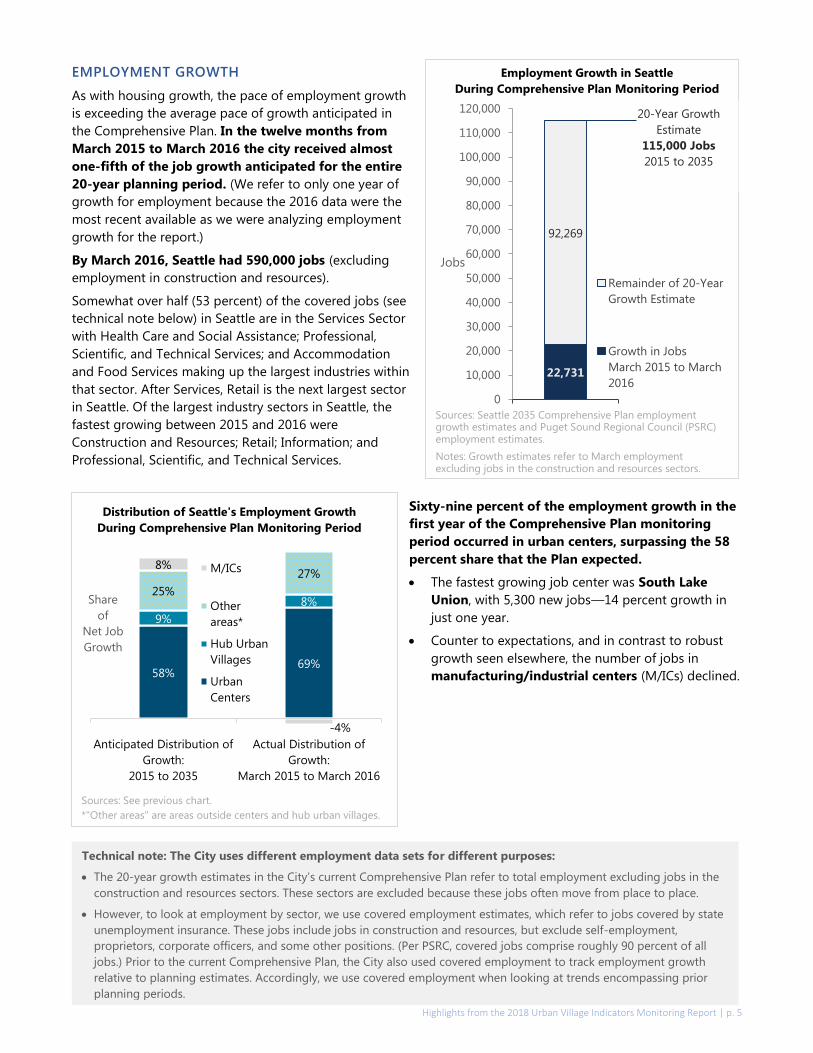
EMPLOYMENT GROWTH
As with housing growth, the pace of employment growth
is exceeding the average pace of growth anticipated in
the Comprehensive Plan. In the twelve months from
March 2015 to March 2016 the city received almost
one-fifth of the job growth anticipated for the entire
20-year planning period. (We refer to only one year of
growth for employment because the 2016 data were the
most recent available as we were analyzing employment
growth for the report.)
By March 2016, Seattle had 590,000 jobs (excluding
employment in construction and resources).
Somewhat over half (53 percent) of the covered jobs (see
technical note below) in Seattle are in the Services Sector
with Health Care and Social Assistance; Professional,
Scientific, and Technical Services; and Accommodation
and Food Services making up the largest industries within
that sector. After Services, Retail is the next largest sector
in Seattle. Of the largest industry sectors in Seattle, the
fastest growing between 2015 and 2016 were
Construction and Resources; Retail; Information; and
Professional, Scientific, and Technical Services.
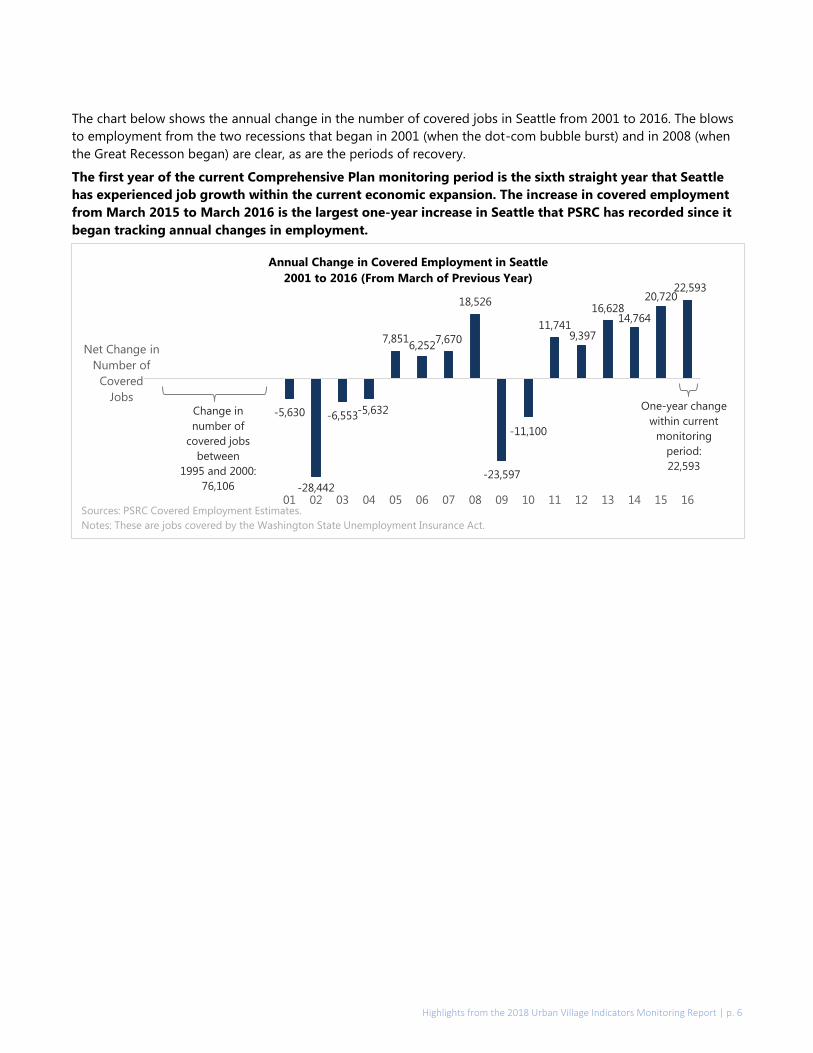
Sixty-nine percent of the employment growth in the
first year of the Comprehensive Plan monitoring
period occurred in urban centers, surpassing the 58
percent share that the Plan expected.
The fastest growing job center was South Lake
Union, with 5,300 new jobs—14 percent growth in
just one year.
Counter to expectations, and in contrast to robust
growth seen elsewhere, the number of jobs in
manufacturing/industrial centers (M/ICs) declined.
22,731
92,269
0
10,000
20,000
30,000
40,000
50,000
60,000
70,000
80,000
90,000
100,000
110,000
120,000
Jobs
Remainder of 20-Year
Growth Estimate
Growth in Jobs
March 2015 to March
2016
Sources: Seattle 2035 Comprehensive Plan employment growth estimates and Puget Sound Regional Council (PSRC) employment estimates.
Notes: Growth estimates refer to March employment excluding jobs in the construction and resources sectors.
20-Year Growth
Estimate
115,000 Jobs
2015 to 2035
Employment Growth in Seattle
During Comprehensive Plan Monitoring Period
58%69%
9%
8%25%
27%8%
-4%
Anticipated Distribution of
Growth:
2015 to 2035
Actual Distribution of
Growth:
March 2015 to March 2016
Share
of
Net Job
Growth
M/ICs
Other
areas*
Hub Urban
Villages
Urban
Centers
Sources: See previous chart.
*"Other areas" are areas outside centers and hub urban villages.
Distribution of Seattle's Employment Growth
During Comprehensive Plan Monitoring Period
Technical note: The City uses different employment data sets for different purposes:
The 20-year growth estimates in the City’s current Comprehensive Plan refer to total employment excluding jobs in the
construction and resources sectors. These sectors are excluded because these jobs often move from place to place.
However, to look at employment by sector, we use covered employment estimates, which refer to jobs covered by state
unemployment insurance. These jobs include jobs in construction and resources, but exclude self-employment,
proprietors, corporate officers, and some other positions. (Per PSRC, covered jobs comprise roughly 90 percent of all
jobs.) Prior to the current Comprehensive Plan, the City also used covered employment to track employment growth
relative to planning estimates. Accordingly, we use covered employment when looking at trends encompassing prior
planning periods.
Highlights from the 2018 Urban Village Indicators Monitoring Report | p. 6
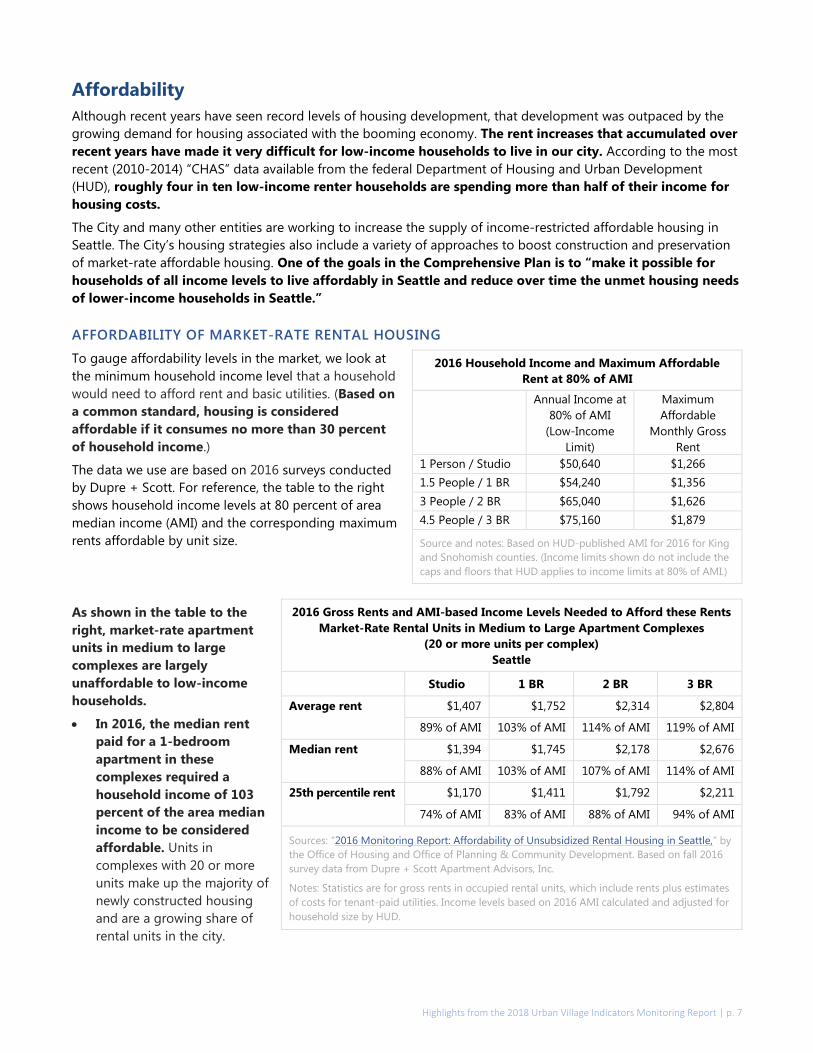
The chart below shows the annual change in the number of covered jobs in Seattle from 2001 to 2016. The blows
to employment from the two recessions that began in 2001 (when the dot-com bubble burst) and in 2008 (when
the Great Recesson began) are clear, as are the periods of recovery.
The first year of the current Comprehensive Plan monitoring period is the sixth straight year that Seattle
has experienced job growth within the current economic expansion. The increase in covered employment
from March 2015 to March 2016 is the largest one-year increase in Seattle that PSRC has recorded since it
began tracking annual changes in employment.
-5,630
-28,442
-6,553-5,632
7,8516,252
7,670
18,526
-23,597
-11,100
11,7419,397
16,62814,764
20,72022,593
01 02 03 04 05 06 07 08 09 10 11 12 13 14 15 16
Net Change in
Number of
Covered
Jobs
Annual Change in Covered Employment in Seattle
2001 to 2016 (From March of Previous Year)
One-year change
within current
monitoring
period:
22,593
Change in
number of
covered jobs
between
1995 and 2000:
76,106
Sources: PSRC Covered Employment Estimates.
Notes: These are jobs covered by the Washington State Unemployment Insurance Act.
Highlights from the 2018 Urban Village Indicators Monitoring Report | p. 7
Affordability
Although recent years have seen record levels of housing development, that development was outpaced by the
growing demand for housing associated with the booming economy. The rent increases that accumulated over
recent years have made it very difficult for low-income households to live in our city. According to the most
recent (2010-2014) “CHAS” data available from the federal Department of Housing and Urban Development
(HUD), roughly four in ten low-income renter households are spending more than half of their income for
housing costs.
The City and many other entities are working to increase the supply of income-restricted affordable housing in
Seattle. The City’s housing strategies also include a variety of approaches to boost construction and preservation
of market-rate affordable housing. One of the goals in the Comprehensive Plan is to “make it possible for
households of all income levels to live affordably in Seattle and reduce over time the unmet housing needs
of lower-income households in Seattle.”
AFFORDABILITY OF MARKET-RATE RENTAL HOUSING
To gauge affordability levels in the market, we look at
the minimum household income level that a household
would need to afford rent and basic utilities. (Based on
a common standard, housing is considered
affordable if it consumes no more than 30 percent
of household income.)
The data we use are based on 2016 surveys conducted
by Dupre + Scott. For reference, the table to the right
shows household income levels at 80 percent of area
median income (AMI) and the corresponding maximum
rents affordable by unit size.
As shown in the table to the
right, market-rate apartment
units in medium to large
complexes are largely
unaffordable to low-income
households.
In 2016, the median rent
paid for a 1-bedroom
apartment in these
complexes required a
household income of 103
percent of the area median
income to be considered
affordable. Units in
complexes with 20 or more
units make up the majority of
newly constructed housing
and are a growing share of
rental units in the city.
2016 Household Income and Maximum Affordable
Rent at 80% of AMI
Annual Income at
80% of AMI
(Low-Income
Limit)
Maximum
Affordable
Monthly Gross
Rent
1 Person / Studio $50,640 $1,266
1.5 People / 1 BR $54,240 $1,356
3 People / 2 BR $65,040 $1,626
4.5 People / 3 BR $75,160 $1,879
Source and notes: Based on HUD-published AMI for 2016 for King
and Snohomish counties. (Income limits shown do not include the
caps and floors that HUD applies to income limits at 80% of AMI.)
2016 Gross Rents and AMI-based Income Levels Needed to Afford these Rents
Market-Rate Rental Units in Medium to Large Apartment Complexes
(20 or more units per complex)
Seattle
Studio 1 BR 2 BR 3 BR
Average rent $1,407 $1,752 $2,314 $2,804
89% of AMI 103% of AMI 114% of AMI 119% of AMI
Median rent
$1,394 $1,745 $2,178 $2,676
88% of AMI 103% of AMI 107% of AMI 114% of AMI
25th percentile rent $1,170 $1,411 $1,792 $2,211
74% of AMI 83% of AMI 88% of AMI 94% of AMI
Sources: “2016 Monitoring Report: Affordability of Unsubsidized Rental Housing in Seattle,” by
the Office of Housing and Office of Planning & Community Development. Based on fall 2016
survey data from Dupre + Scott Apartment Advisors, Inc.
Notes: Statistics are for gross rents in occupied rental units, which include rents plus estimates
of costs for tenant-paid utilities. Income levels based on 2016 AMI calculated and adjusted for
household size by HUD.
Highlights from the 2018 Urban Village Indicators Monitoring Report | p. 8
Rents for market-rate units in smaller multifamily properties tend to be lower than rents in medium to
large complexes (in part because the smaller properties are less likely to have been constructed very
recently). For example, a one-bedroom apartment in a small complex is affordable to a household with an
income of 76 percent of area median income. Still, most units in small multifamily rental properties are
unaffordable with an income of 60 percent of AMI.
Rental units with two or more bedrooms are a small and diminishing share of the rental housing supply
and are less likely than studio and one-bedroom units to be affordable at low-income levels.
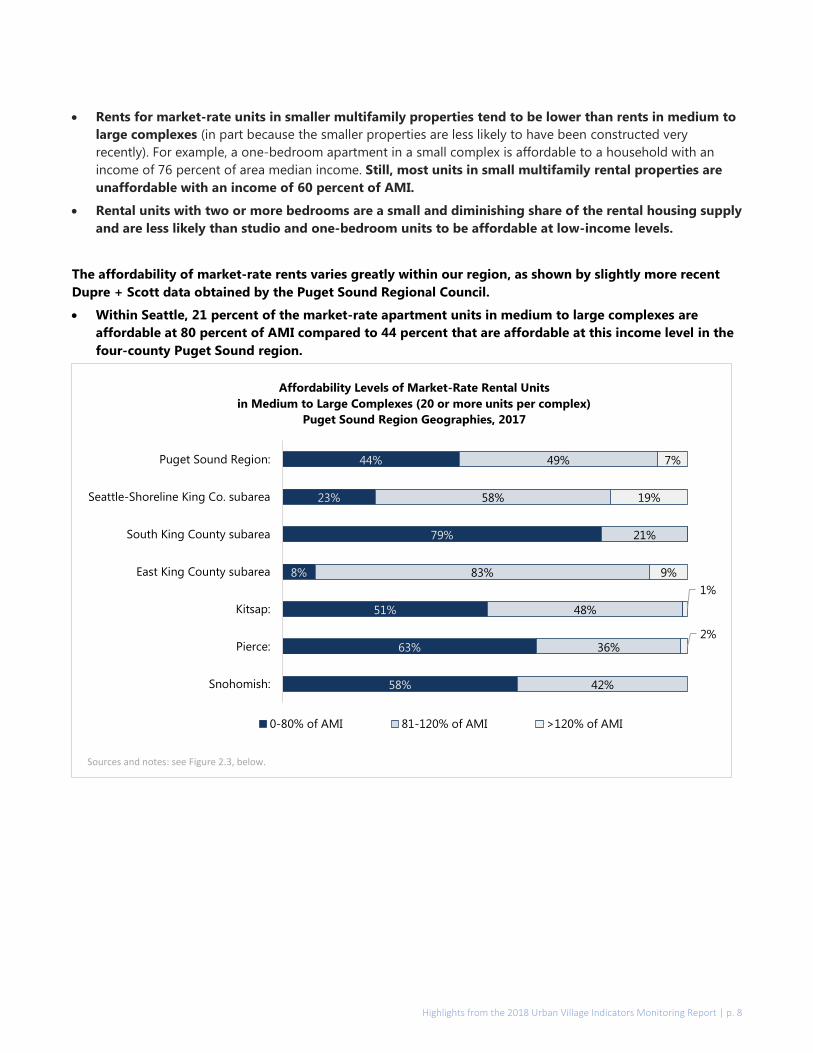
The affordability of market-rate rents varies greatly within our region, as shown by slightly more recent
Dupre + Scott data obtained by the Puget Sound Regional Council.
Within Seattle, 21 percent of the market-rate apartment units in medium to large complexes are
affordable at 80 percent of AMI compared to 44 percent that are affordable at this income level in the
four-county Puget Sound region.
44%
23%
79%
8%
51%
63%
58%
49%
58%
21%
83%
48%
36%
42%
7%
19%
9%
1%
2%
Puget Sound Region:
Seattle-Shoreline King Co. subarea
South King County subarea
East King County subarea
Kitsap:
Pierce:
Snohomish:
Affordability Levels of Market-Rate Rental Units
in Medium to Large Complexes (20 or more units per complex)
Puget Sound Region Geographies, 2017
0-80% of AMI 81-120% of AMI >120% of AMI
Sources and notes: see Figure 2.3, below.
Highlights from the 2018 Urban Village Indicators Monitoring Report | p. 9
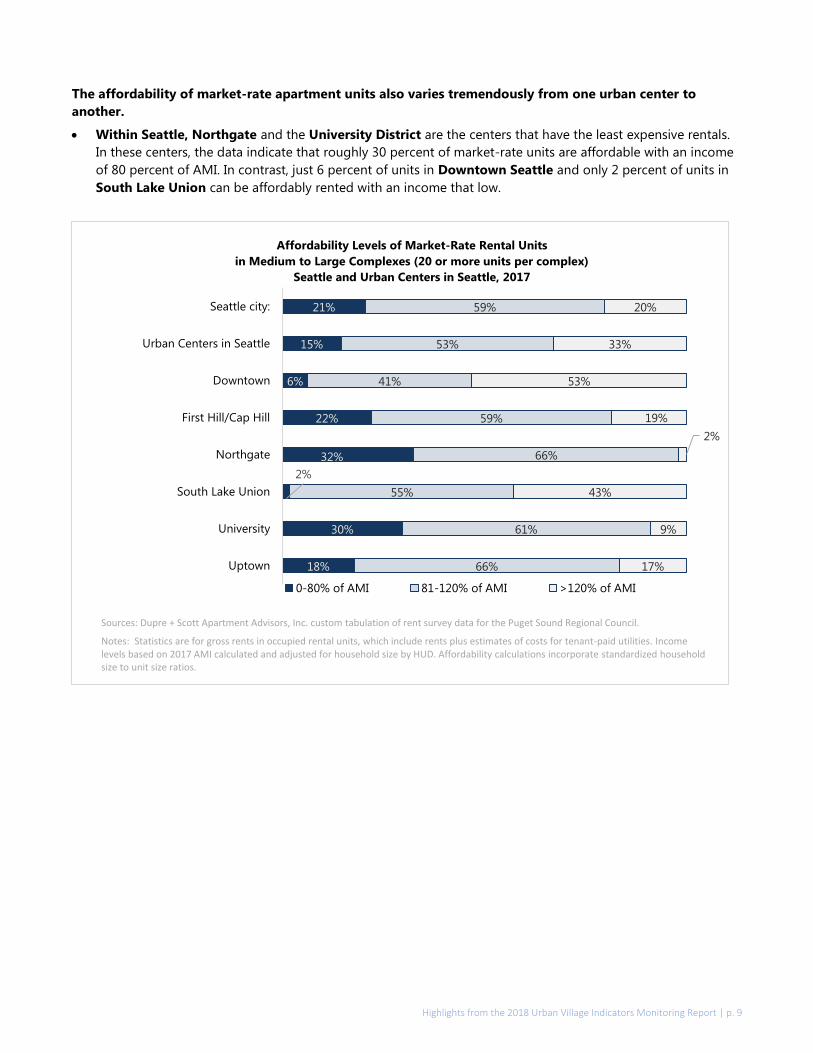
The affordability of market-rate apartment units also varies tremendously from one urban center to
another.
Within Seattle, Northgate and the University District are the centers that have the least expensive rentals.
In these centers, the data indicate that roughly 30 percent of market-rate units are affordable with an income
of 80 percent of AMI. In contrast, just 6 percent of units in Downtown Seattle and only 2 percent of units in
South Lake Union can be affordably rented with an income that low.
21%
15%
6%
22%
32%
2%
30%
18%
59%
53%
41%
59%
66%
55%
61%
66%
20%
33%
53%
19%
2%
43%
9%
17%
Seattle city:
Urban Centers in Seattle
Downtown
First Hill/Cap Hill
Northgate
South Lake Union
University
Uptown
Affordability Levels of Market-Rate Rental Units
in Medium to Large Complexes (20 or more units per complex)
Seattle and Urban Centers in Seattle, 2017
0-80% of AMI 81-120% of AMI >120% of AMI
Sources: Dupre + Scott Apartment Advisors, Inc. custom tabulation of rent survey data for the Puget Sound Regional Council.
Notes: Statistics are for gross rents in occupied rental units, which include rents plus estimates of costs for tenant-paid utilities. Income levels based on 2017 AMI calculated and adjusted for household size by HUD. Affordability calculations incorporate standardized household size to unit size ratios.
Highlights from the 2018 Urban Village Indicators Monitoring Report | p. 10
SUPPLY OF INCOME-RESTRICTED AFFORDABLE HOUSING
The housing market in Seattle supplies very limited quantities of housing affordable to low-income households,
and a substantial fraction of that housing is occupied by higher income households. Having a sufficient supply of
income-restricted affordable housing for low-income families and individuals is therefore essential to advancing
goals in the Comprehensive Plan for affordability and inclusivity.
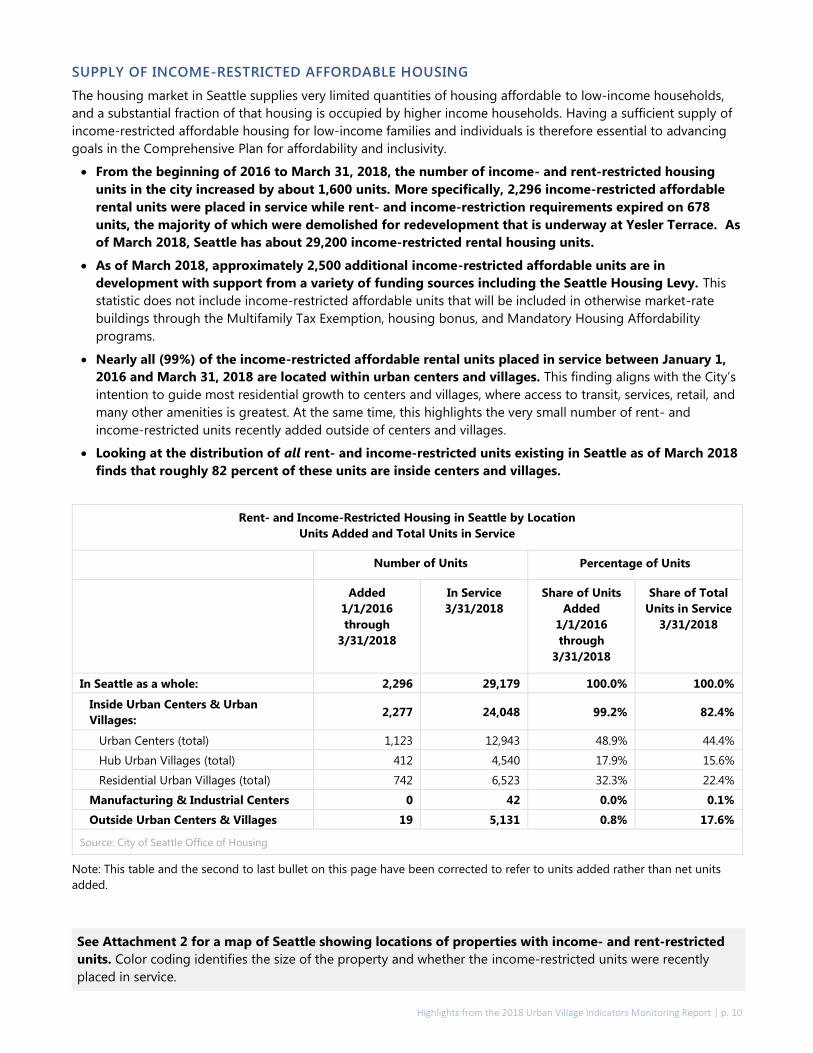
From the beginning of 2016 to March 31, 2018, the number of income- and rent-restricted housing
units in the city increased by about 1,600 units. More specifically, 2,296 income-restricted affordable
rental units were placed in service while rent- and income-restriction requirements expired on 678
units, the majority of which were demolished for redevelopment that is underway at Yesler Terrace. As
of March 2018, Seattle has about 29,200 income-restricted rental housing units.
As of March 2018, approximately 2,500 additional income-restricted affordable units are in
development with support from a variety of funding sources including the Seattle Housing Levy. This
statistic does not include income-restricted affordable units that will be included in otherwise market-rate
buildings through the Multifamily Tax Exemption, housing bonus, and Mandatory Housing Affordability
programs.
Nearly all (99%) of the income-restricted affordable rental units placed in service between January 1,
2016 and March 31, 2018 are located within urban centers and villages. This finding aligns with the City’s
intention to guide most residential growth to centers and villages, where access to transit, services, retail, and
many other amenities is greatest. At the same time, this highlights the very small number of rent- and
income-restricted units recently added outside of centers and villages.
Looking at the distribution of all rent- and income-restricted units existing in Seattle as of March 2018
finds that roughly 82 percent of these units are inside centers and villages.
Rent- and Income-Restricted Housing in Seattle by Location
Units Added and Total Units in Service
Number of Units Percentage of Units
Added
1/1/2016
through
3/31/2018
In Service
3/31/2018
Share of Units
Added
1/1/2016
through
3/31/2018
Share of Total
Units in Service
3/31/2018
In Seattle as a whole: 2,296 29,179 100.0% 100.0%
Inside Urban Centers & Urban
Villages: 2,277 24,048 99.2% 82.4%
Urban Centers (total) 1,123 12,943 48.9% 44.4%
Hub Urban Villages (total) 412 4,540 17.9% 15.6%
Residential Urban Villages (total) 742 6,523 32.3% 22.4%
Manufacturing & Industrial Centers 0 42 0.0% 0.1%
Outside Urban Centers & Villages 19 5,131 0.8% 17.6%
Source: City of Seattle Office of Housing
Note: This table and the second to last bullet on this page have been corrected to refer to units added rather than net units
added.
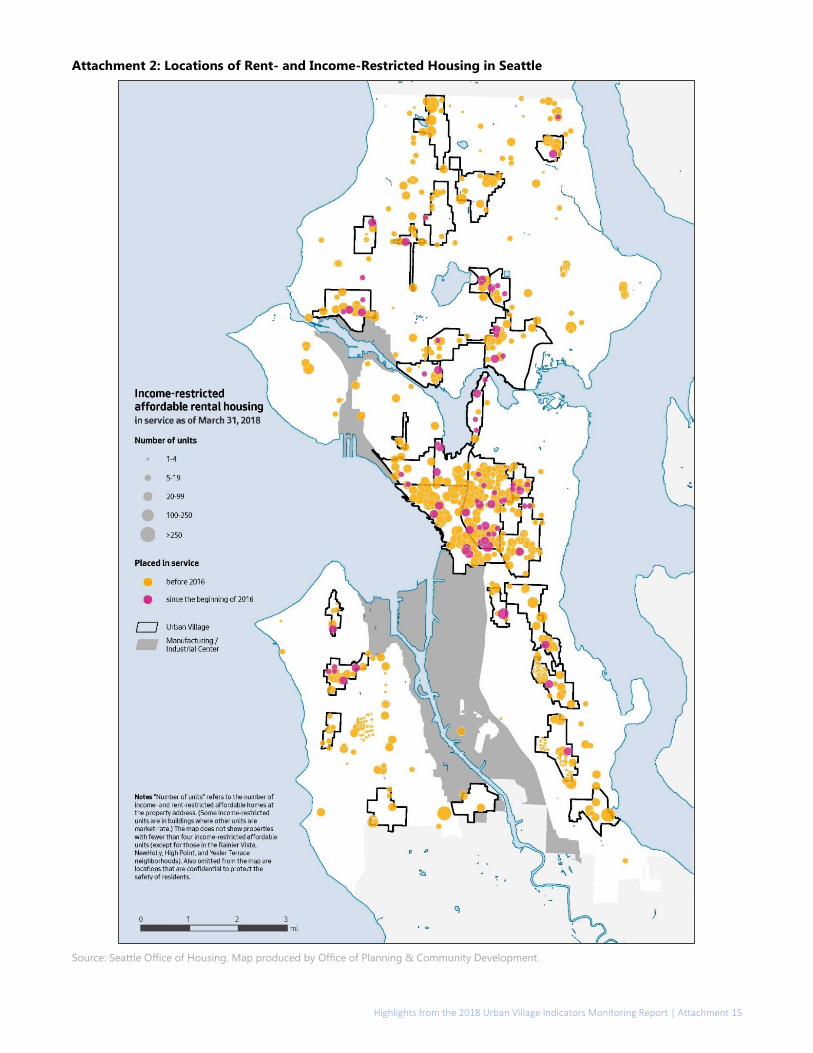
See Attachment 2 for a map of Seattle showing locations of properties with income- and rent-restricted
units. Color coding identifies the size of the property and whether the income-restricted units were recently
placed in service.
Highlights from the 2018 Urban Village Indicators Monitoring Report | p. 11
Livability
ACCESS TO FREQUENT TRANSIT SERVICE
For the city’s transit-oriented development strategy to be effective, residents must have good access to frequent
transit.
The Seattle Department of Transportation’s (SDOT) Transit Master Plan (TMP) uses an envisioned Frequent Transit
Network to guide transit service priorities over time in a manner consistent with the Comprehensive Plan. The
Frequent Transit Network includes transit corridors that provide high-quality service to urban centers and villages.
As part of implementing the Levy to Move Seattle (approved by voters in 2015), the City is funding improvements
to ensure that by the year 2025 at least 72 percent of Seattle households are within a ten-minute walk of a
frequent transit route running every 10 minutes or better. This is one of the specific metrics by which SDOT tracks
success on goals identified in the Levy to Move Seattle. The City is also aiming to increase the share of households
with access within a 10-minute walk to transit running every 15 minutes or better.
Service investments in Metro Transit and
expansion of the Sound Transit light rail
system are helping improve access.
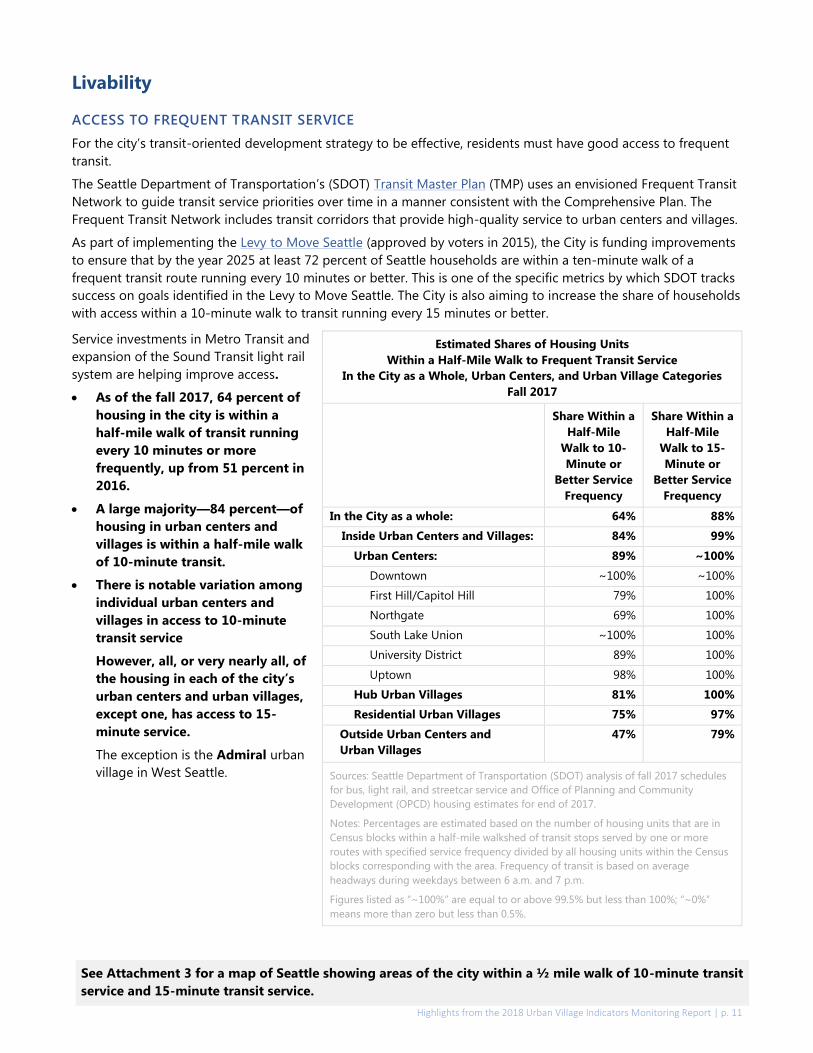
As of the fall 2017, 64 percent of
housing in the city is within a
half-mile walk of transit running
every 10 minutes or more
frequently, up from 51 percent in
2016.
A large majority—84 percent—of
housing in urban centers and
villages is within a half-mile walk
of 10-minute transit.
There is notable variation among
individual urban centers and
villages in access to 10-minute
transit service
However, all, or very nearly all, of
the housing in each of the city’s
urban centers and urban villages,
except one, has access to 15-
minute service.
The exception is the Admiral urban
village in West Seattle.
Estimated Shares of Housing Units
Within a Half-Mile Walk to Frequent Transit Service
In the City as a Whole, Urban Centers, and Urban Village Categories
Fall 2017
Share Within a
Half-Mile
Walk to 10-
Minute or
Better Service
Frequency
Share Within a
Half-Mile
Walk to 15-
Minute or
Better Service
Frequency
In the City as a whole: 64% 88%
Inside Urban Centers and Villages: 84% 99%
Urban Centers: 89% ~100%
Downtown ~100% ~100%
First Hill/Capitol Hill 79% 100%
Northgate 69% 100%
South Lake Union ~100% 100%
University District 89% 100%
Uptown 98% 100%
Hub Urban Villages 81% 100%
Residential Urban Villages 75% 97%
Outside Urban Centers and
Urban Villages
47% 79%
Sources: Seattle Department of Transportation (SDOT) analysis of fall 2017 schedules
for bus, light rail, and streetcar service and Office of Planning and Community
Development (OPCD) housing estimates for end of 2017.
Notes: Percentages are estimated based on the number of housing units that are in
Census blocks within a half-mile walkshed of transit stops served by one or more
routes with specified service frequency divided by all housing units within the Census
blocks corresponding with the area. Frequency of transit is based on average
headways during weekdays between 6 a.m. and 7 p.m.
Figures listed as “~100%” are equal to or above 99.5% but less than 100%; “~0%”
means more than zero but less than 0.5%.
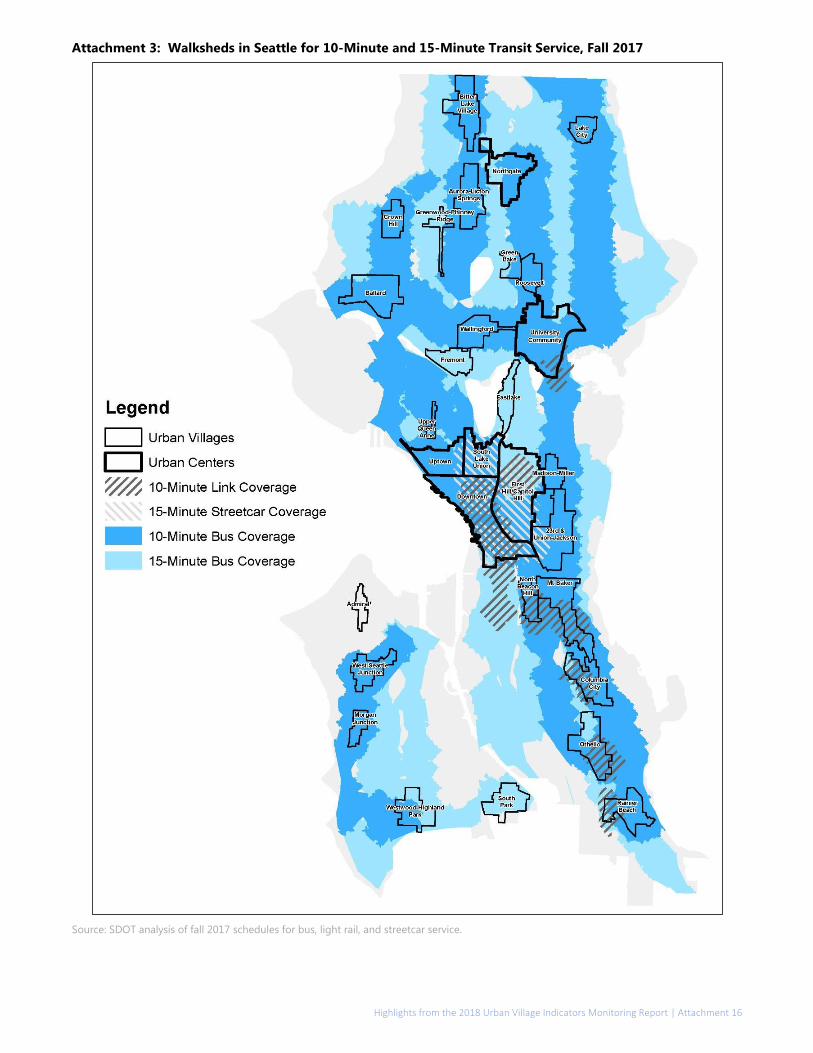
See Attachment 3 for a map of Seattle showing areas of the city within a ½ mile walk of 10-minute transit
service and 15-minute transit service.
Highlights from the 2018 Urban Village Indicators Monitoring Report | p. 12
PRESENCE OF SIDEWALKS
One reason Seattle’s Urban Village Strategy focuses growth in urban centers and villages is to make it convenient
for more people to walk to neighborhood destinations and transit. Pedestrian activity, in turn, fosters the vibrancy
of centers and villages.
The Comprehensive Plan includes many policies aimed at improving walkability. Sidewalks are a basic ingredient
for making neighborhoods walkable.
The Pedestrian Master Plan (PMP) produced by SDOT provides the blueprint for investing in pedestrian
improvements. The Priority Investment Network (PIN) in the PMP delineates where the City focuses investments to
enhance walking conditions. The PIN emphasizes key walking routes to stops in the Frequent Transit Network and
to public schools. The PIN contains slightly more than half of the total blockfaces in the city, about 80 percent of
the blockfaces in urban centers and villages. Sidewalk completeness within the PIN is one of the six performance
measures that the City uses to track progress in implementing the PMP, with a target of completing 100 percent
of arterial sidewalks in the PIN by 2035.
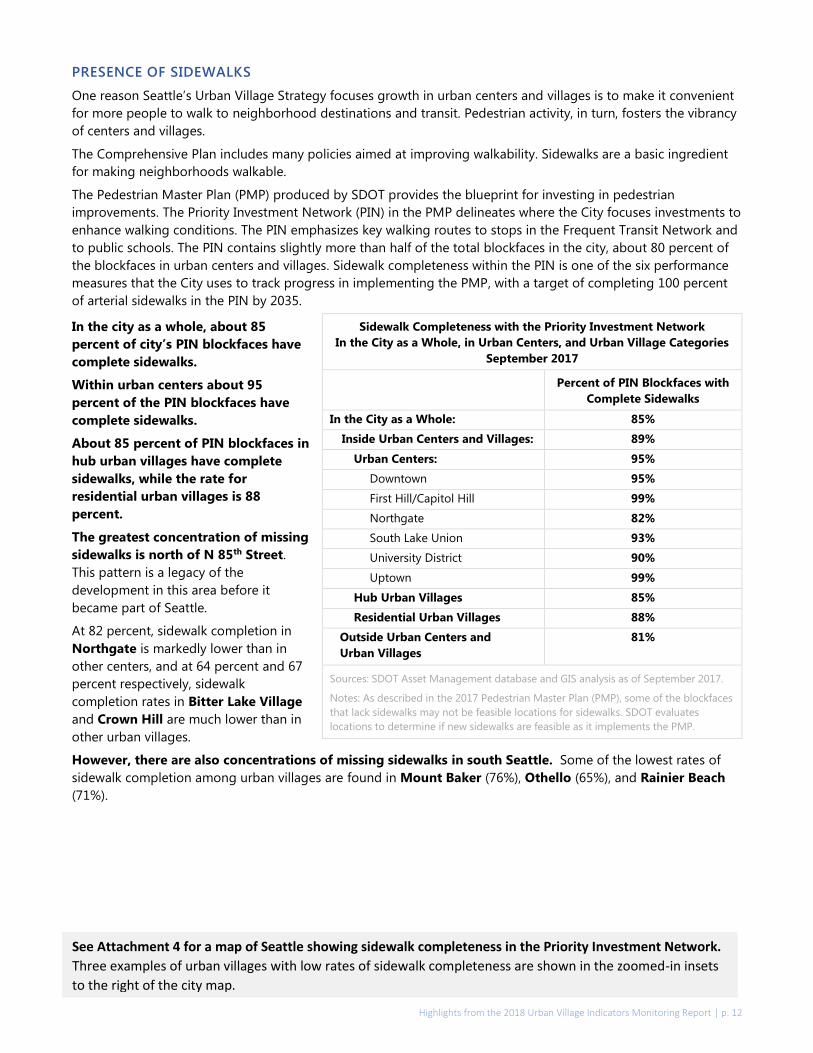
In the city as a whole, about 85
percent of city’s PIN blockfaces have
complete sidewalks.
Within urban centers about 95
percent of the PIN blockfaces have
complete sidewalks.
About 85 percent of PIN blockfaces in
hub urban villages have complete
sidewalks, while the rate for
residential urban villages is 88
percent.
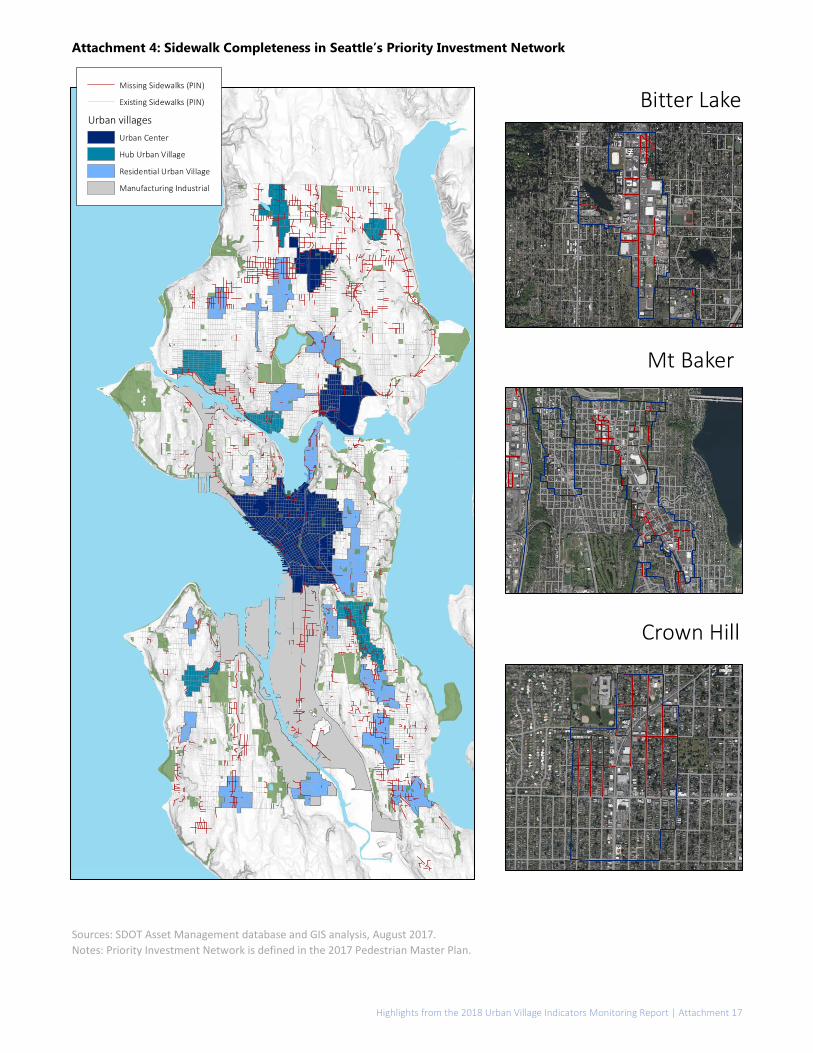
The greatest concentration of missing
sidewalks is north of N 85th Street.
This pattern is a legacy of the
development in this area before it
became part of Seattle.
At 82 percent, sidewalk completion in
Northgate is markedly lower than in
other centers, and at 64 percent and 67
percent respectively, sidewalk
completion rates in Bitter Lake Village
and Crown Hill are much lower than in
other urban villages.
However, there are also concentrations of missing sidewalks in south Seattle. Some of the lowest rates of
sidewalk completion among urban villages are found in Mount Baker (76%), Othello (65%), and Rainier Beach
(71%).
Sidewalk Completeness with the Priority Investment Network
In the City as a Whole, in Urban Centers, and Urban Village Categories
September 2017
Percent of PIN Blockfaces with
Complete Sidewalks
In the City as a Whole: 85%
Inside Urban Centers and Villages: 89%
Urban Centers: 95%
Downtown 95%
First Hill/Capitol Hill 99%
Northgate 82%
South Lake Union 93%
University District 90%
Uptown 99%
Hub Urban Villages 85%
Residential Urban Villages 88%
Outside Urban Centers and
Urban Villages
81%
Sources: SDOT Asset Management database and GIS analysis as of September 2017.
Notes: As described in the 2017 Pedestrian Master Plan (PMP), some of the blockfaces
that lack sidewalks may not be feasible locations for sidewalks. SDOT evaluates
locations to determine if new sidewalks are feasible as it implements the PMP.
See Attachment 4 for a map of Seattle showing sidewalk completeness in the Priority Investment Network.
Three examples of urban villages with low rates of sidewalk completeness are shown in the zoomed-in insets
to the right of the city map.
Highlights from the 2018 Urban Village Indicators Monitoring Report | p. 13
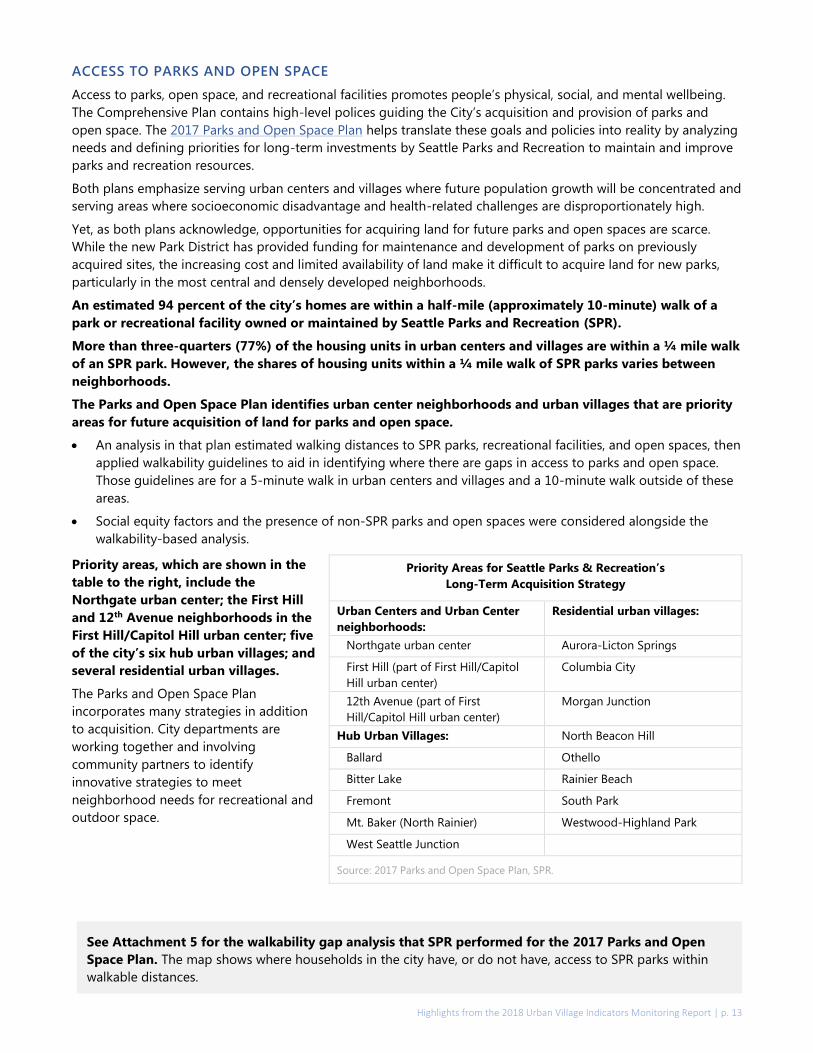
ACCESS TO PARKS AND OPEN SPACE
Access to parks, open space, and recreational facilities promotes people’s physical, social, and mental wellbeing.
The Comprehensive Plan contains high-level polices guiding the City’s acquisition and provision of parks and
open space. The 2017 Parks and Open Space Plan helps translate these goals and policies into reality by analyzing
needs and defining priorities for long-term investments by Seattle Parks and Recreation to maintain and improve
parks and recreation resources.
Both plans emphasize serving urban centers and villages where future population growth will be concentrated and
serving areas where socioeconomic disadvantage and health-related challenges are disproportionately high.
Yet, as both plans acknowledge, opportunities for acquiring land for future parks and open spaces are scarce.
While the new Park District has provided funding for maintenance and development of parks on previously
acquired sites, the increasing cost and limited availability of land make it difficult to acquire land for new parks,
particularly in the most central and densely developed neighborhoods.
An estimated 94 percent of the city’s homes are within a half-mile (approximately 10-minute) walk of a
park or recreational facility owned or maintained by Seattle Parks and Recreation (SPR).
More than three-quarters (77%) of the housing units in urban centers and villages are within a ¼ mile walk
of an SPR park. However, the shares of housing units within a ¼ mile walk of SPR parks varies between
neighborhoods.
The Parks and Open Space Plan identifies urban center neighborhoods and urban villages that are priority
areas for future acquisition of land for parks and open space.
An analysis in that plan estimated walking distances to SPR parks, recreational facilities, and open spaces, then
applied walkability guidelines to aid in identifying where there are gaps in access to parks and open space.
Those guidelines are for a 5-minute walk in urban centers and villages and a 10-minute walk outside of these
areas.
Social equity factors and the presence of non-SPR parks and open spaces were considered alongside the
walkability-based analysis.
Priority areas, which are shown in the
table to the right, include the
Northgate urban center; the First Hill
and 12th Avenue neighborhoods in the
First Hill/Capitol Hill urban center; five
of the city’s six hub urban villages; and
several residential urban villages.
The Parks and Open Space Plan
incorporates many strategies in addition
to acquisition. City departments are
working together and involving
community partners to identify
innovative strategies to meet
neighborhood needs for recreational and
outdoor space.
Priority Areas for Seattle Parks & Recreation’s
Long-Term Acquisition Strategy
Urban Centers and Urban Center
neighborhoods:
Residential urban villages:
Northgate urban center Aurora-Licton Springs
First Hill (part of First Hill/Capitol
Hill urban center)
Columbia City
12th Avenue (part of First
Hill/Capitol Hill urban center)
Morgan Junction
Hub Urban Villages: North Beacon Hill
Ballard Othello
Bitter Lake Rainier Beach
Fremont South Park
Mt. Baker (North Rainier) Westwood-Highland Park
West Seattle Junction
Source: 2017 Parks and Open Space Plan, SPR.
TIA International Photography
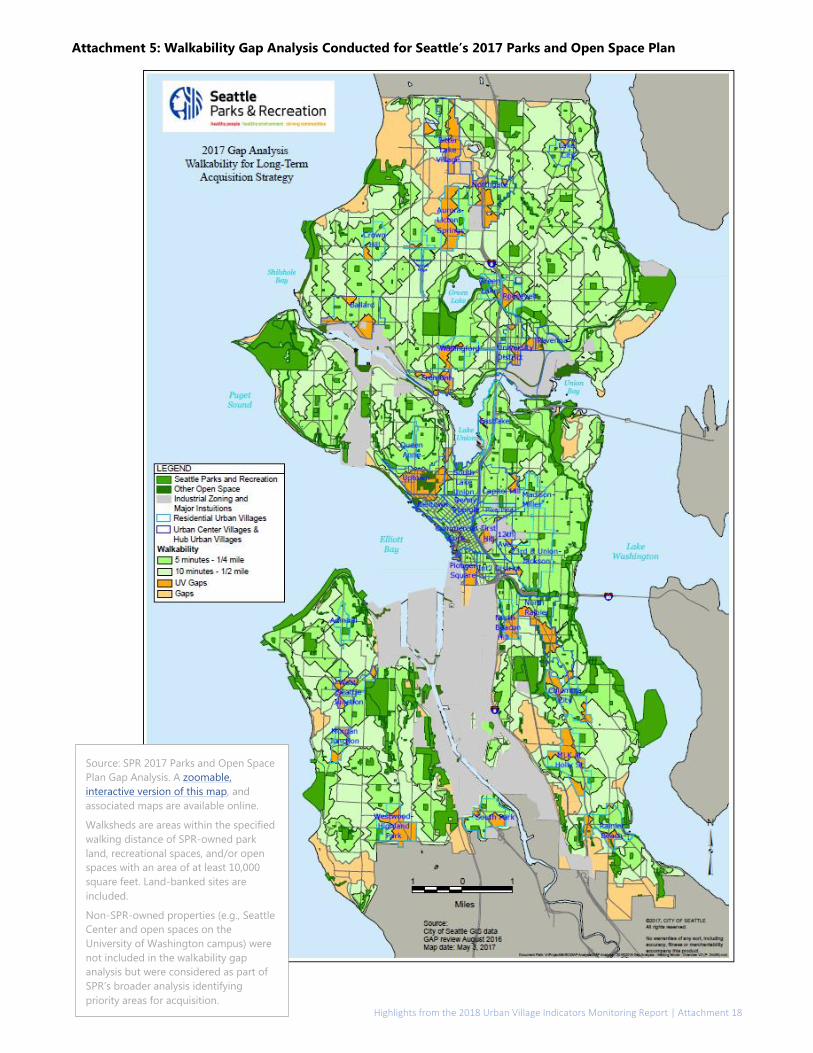
See Attachment 5 for the walkability gap analysis that SPR performed for the 2017 Parks and Open
Space Plan. The map shows where households in the city have, or do not have, access to SPR parks within
walkable distances.
Highlights from the 2018 Urban Village Indicators Monitoring Report | Attachment 14
Attachment 1: Seattle’s Urban Centers, Urban Villages, and Manufacturing / Industrial Centers
(Reference Map)
Highlights from the 2018 Urban Village Indicators Monitoring Report | Attachment 15
Attachment 2: Locations of Rent- and Income-Restricted Housing in Seattle
Source: Seattle Office of Housing. Map produced by Office of Planning & Community Development.
Highlights from the 2018 Urban Village Indicators Monitoring Report | Attachment 16
Attachment 3: Walksheds in Seattle for 10-Minute and 15-Minute Transit Service, Fall 2017
Source: SDOT analysis of fall 2017 schedules for bus, light rail, and streetcar service.
Highlights from the 2018 Urban Village Indicators Monitoring Report | Attachment 17
Attachment 4: Sidewalk Completeness in Seattle’s Priority Investment Network
Sources: SDOT Asset Management database and GIS analysis, August 2017. Notes: Priority Investment Network is defined in the 2017 Pedestrian Master Plan.
Highlights from the 2018 Urban Village Indicators Monitoring Report | Attachment 18
Attachment 5: Walkability Gap Analysis Conducted for Seattle’s 2017 Parks and Open Space Plan
Source: SPR 2017 Parks and Open Space
Plan Gap Analysis. A zoomable,
interactive version of this map, and
associated maps are available online.
Walksheds are areas within the specified
walking distance of SPR-owned park
land, recreational spaces, and/or open
spaces with an area of at least 10,000
square feet. Land-banked sites are
included.
Non-SPR-owned properties (e.g., Seattle
Center and open spaces on the
University of Washington campus) were
not included in the walkability gap
analysis but were considered as part of
SPR’s broader analysis identifying
priority areas for acquisition.