Embed Size (px)
Citation preview

PROCEEDINGS, Thirty-Ninth Workshop on Geothermal Reservoir Engineering
Stanford University, Stanford, California, February 24-26, 2014
SGP-TR-202
1
Comprehensive Studies on Hole Cleaning and ECD Management in Long Extended-Reach
Geothermal Well Drilling
Shigemi Naganawa and Takashi Okabe
Frontier Research Center for Energy and Resources, The University of Tokyo, 7-3-1 Hongo, Bunkyo-ku, Tokyo 113-8656 Japan;
Geothermal Energy Research & Development Co., Ltd., 1-22-4 Shinkawa, Chuo-ku, Tokyo 104-0033 Japan
e-mail: [email protected]; [email protected]
Keywords: extended-reach drilling, hole cleaning, equivalent circulating density
ABSTRACT
Effective hole cleaning and maintenance of an appropriate equivalent circulating density (ECD) is much more difficult to
implement in long extended-reach geothermal wells than in oil and gas wells. We conducted a number of cuttings transport
experiments, using a large-scale flow-loop apparatus and field measurements of annular pressure, using PWD (pressure while
drilling) in a geothermal directional well recently drilled in Japan. Numerical simulation for the targeted long extended-reach
geothermal well with a total depth 3,000 m, horizontal departure of 2,500 m, and maximum hole inclination angle of 70° was
performed using a transient hydraulics simulator we developed and modified in this study on the basis of these experiments and
field data. In addition, the optimum hydraulics conditions for effective hole cleaning and appropriate ECD management in long
extended-reach geothermal drilling are discussed in this study.
1. INTRODUCTION
Geothermal development has been restricted in Japan for many years because approximately 80% of the vast amounts of
geothermal resources are located in natural parks. Therefore, a research and development project on geothermal well drilling is
under way in Japan that aims to develop an environmentally friendly, low-cost, extended-reach drilling technology enabling access
to geothermal resources from outside these natural parks (Okabe et al., 2013).
A key issue in extended-reach drilling is hydraulics design. In geothermal wells with subnormal pressure and lost circulation zones
in particular, low-density, low-viscosity drilling fluid or water in some cases is generally used, which is ineffective for acceptable
hole cleaning. Although the largest possible flow rate is needed for sufficient hole cleaning with low-density, low-viscosity drilling
fluid, and for avoiding an increase of equivalent circulating density (ECD) because of cuttings deposition on the low side of
borehole in inclined sections, the excess flow rate can unexpectedly increase ECD, which may cause lost circulation and borehole
instability problems. Thus, implementation of an effective hole cleaning method and maintenance of an appropriate ECD are much
more difficult to achieve in geothermal wells than in oil and gas wells.
In this study, we conducted a number of cuttings transport experiments, using a large-scale flow-loop apparatus and field
measurements of annular pressure using the pressure while drilling (PWD) method in a recently drilled geothermal directional well
in Japan. Numerical simulation for the targeted long extended-reach geothermal well with a total depth of 3,000 m, horizontal
departure of 2,500 m, and maximum hole inclination angle of 70° degrees was performed using a transient two-layer model
hydraulics simulator that we developed and modified on the basis of these experiments and field data. In addition, the optimum
hydraulics conditions for effective hole cleaning and appropriate ECD management are discussed, and recommendations are
presented for preventing drilling problems such as poor hole cleaning, high torque and drag, stuck pipes, borehole instability, and
lost circulation.
2. MODIFICATION OF SIMULATION MODEL PARAMETER USING EXPERIMENTAL AND FIELD DATA
2.1 Description of Simulator
The transient cuttings transport simulator we used in this study was developed through a collaborative research project between the
University of Tokyo and Japan Oil, Gas and Metals National Corporation (JOGMEC). The simulator predicts the transient
behaviors of annular pressure, cuttings bed height, suspended cuttings concentration, and phase velocities along the entire trajectory
of the well. The original basic modeling parameters, including the process of covering underbalanced operation with aerated mud,
was presented in our previous study (Doan et al., 2003), and improvements in its ability to simulate the cuttings transport behavior
of extended-reach wells with a complex well trajectory were discussed in another of our studies (Naganawa and Nomura, 2006).
The mathematical model of the simulator is described as the two-layer model, which handles transient 1D solid–liquid two-phase
flow in the well annulus, as shown in Figure 1. The basic equation includes mass and momentum conservations for each phase in
the upper fluid layer and lower cuttings deposit layer. To close the basic equations mathematically, constitutive equations were
derived that consider the cuttings deposition and re-entrainment relationships between the layers. The model parameters in the
constitutive equations, such as friction factors, cuttings deposition, and re-entrainment rates, were evaluated and determined by
matching the calculated cuttings concentration data with the data obtained from experiments described in the following section.

Naganawa and Okabe
2
Figure 1: Concept of two-layer model for 1D solid–liquid two-phase flow in annulus.
2.2 Experiments
The experimental apparatus used for simulated model verification was a large-scale flow-loop apparatus referred to as the Cuttings
Transport Flow-Loop System (CTFLS). A flow diagram and photograph of the apparatus are shown in Figure 2. The CTFLS has a
9-m long test section simulating a borehole annulus that consists of a 5-in inner diameter outer pipe for the borehole casing and
2.063-in outer diameter inner pipe for the drill pipe. The inclination angle of the test section can be arbitrarily set between vertical
(0°) and horizontal (90°) in 15° increments. The inner pipe can be set either concentric or eccentric to the outer pipe. To enable
visual observation of the flow behavior in the annulus, the middle section of the 7-m long outer pipe is composed of transparent
acrylic resin.
Figure 2: Cuttings Transport Flow-Loop System (CTFLS) experimental apparatus.
This apparatus is a once-through type of flow loop, meaning that drilling conditions with arbitrary penetration rates can be
reproduced by controlling the feed rate of cuttings into the test section. Cuttings are fed and mixed into the fluid flow line at the
inlet (bottomhole side) of the test section by operating a screw feeder at a given rate. Cuttings discharged from the outlet (surface
side) of the test section are separated from the drilling fluid at the shaker screen and are conveyed to the reservoir hopper by a
bucket conveyer. Weights of the cuttings feed hopper and reservoir hopper are continuously measured by the respective load cells;
these data are used to calculate the weight of the cuttings in the test section annulus. The drilling fluid is diverted to the return tank
and subsequently pumped again into the flow loop. Data from sensors, such as hopper weight, differential pressure, and temperature,
are digitized and stored in a computer, which can be simultaneously monitored online.
The experimental conditions are summarized in Table 1. In the experiment, fluid flow rates were changed in five equal steps from
70 m3/h to 30 m3/h. The cumulative weight of fed and returned cuttings and frictional pressure loss in the annulus were
continuously recorded as time series data. From this data, the cuttings volume concentration in the annulus and frictional pressure
loss for each fluid flow rate under steady state condition were obtained. The procedure to obtain this steady state data is described
in our previous study (Naganawa, 2013).
Table 1: Experimental Conditions.
Hole I.D. 5″
Drill Pipe O.D. 2.063″
DP Eccentricity 0.8
Hole Inclination 0, 30, 45, 60, 75°
Drilling Fluid Water PV = 1, YP = 0, Initial Gel = 0
Mud 2 (water + 5% bentonite + 0.1% PHPA) PV = 20, YP = 14, Initial Gel = 3
Fluid Density 1.0 SG (Water), 1.03 SG (Mud 2)
Fluid Temperature 30°C
Fluid Flow Rate 30–70 m3/h (0.79–1.85 m/s) in 10 m3/h steps
Cuttings Diameter 3.2 mm (≈1/8″)

Naganawa and Okabe
3
Cuttings Density 2.4 SG
Penetration Rate 10 m/h (0.13 m3/h)
2.3 Annular Pressure Data from Geothermal Exploration Well
Annular pressure data was obtained from a geothermal exploration well (Well B) recently drilled in Japan using the PWD method.
As shown in Figure 3, the profile of the well included a total depth (TD) of 2,300 m, total vertical depth (TVD) of 1,859 m, and
horizontal departure of 1,259 m. The test section in which PWD data was obtained for this study was a 12–1/4-in hole section of
1,322 m to 1,457 m measured depth (MD) with a maximum hole inclination angle of approximately 40°. The mud logging and
PWD data obtained are also shown in Figure 3.
(a) Well profile (b) Mud logging/PWD data
Figure 3: Profile of Well B and obtained mud logging/pressure while drilling (PWD) data.
Unlike the conditions in typical geothermal fields, the formations in which Well B was drilled have relatively high formation
pressure, and in some cases abnormal pressure; therefore, the mud weight was maintained at approximately 1.5 SG. The mud
rheology was controlled at plastic viscosity (PV) = 19 cp and yield point (YP) = 28 lbf/100ft2. The operating conditions were
selected to maintain a mud flow rate of 605 gpm and an average rate of penetration of 3.17 m/h. During the drilling process in this
test section, the rotating mode for a steerable motor was generally used.
2.4 Modification of Friction Factors in the Simulation Model
The results of the preliminary simulation study for the Well B 12–1/4-in hole section by using original simulator we developed are
shown in Figure 4. As shown in the figure, that cuttings deposit bed was formed along the tangential section. However, although
the measured ECD, using PWD ranged from 1.55 to 1.6 SG, as shown in Figure 3, the maximum simulated ECD was 1.525 SG.
Thus, we attempted to modify the friction factors defined in the simulator model as constitutive equations to match the measured
and simulated ECDs.
(a) Cuttings bed height (b) Equivalent circulating density (ECD) distribution
Figure 4: Results of preliminary simulation study for Well B using original simulator.

Naganawa and Okabe
4
We determined that two types of parameters should be modified. The first includes pipe wall friction factors f1 and f2. The original
equation of the friction factor was taken from Doron et al. (1987), which is defined as
2.021/046.0
/16
,
Re
Re
ff . (1)
To compensate the underestimation of ECD for Well B as previously mentioned, we modified the friction factors to be larger than
those in the original model:
12.0
86.0
21
/046.0
/16,
Re
Reff . (2)
The second parameter to be modified is the friction factor between the upper suspended fluid layer and lower cuttings deposit bed
layer, f12. Doron et al. (1987) used the following definition proposed by Televantos et al. (1979), which is half the friction factor for
a rough pipe wall surface developed by Colebrook (1939):
1212212 2
51.2
7.3ln86.0
2
1
fReD
d
f
p. (3)
The original version of our simulator used the same definition. In the present study, however, we attempted to adopt the original
Colebrook equation, defined as follows, to produce a closer match in the cuttings concentration in the annulus:
1212212
51.2
7.3ln86.0
1
fReD
d
f
p. (4)
These two friction factor modifications can be graphically demonstrated, as shown in Figure 5.
(a) Pipe wall friction factors f1, f2 (b) Friction factor between layers f12
Figure 5: Modification of friction factor equations.
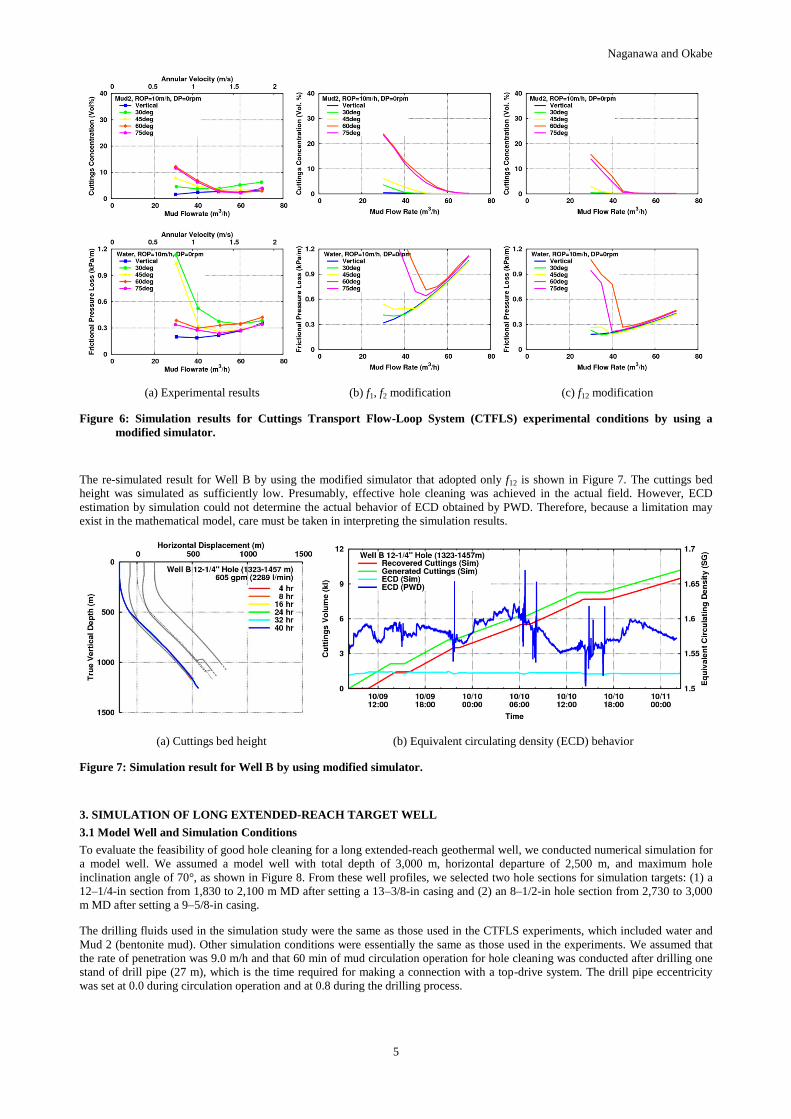
A comparison of steady-state hydraulic behaviors between CTFLS experiments and the simulations is shown in Figure 6.
Modification of pipe wall friction factors (center column shown as (b) in the figure) resulted in an overestimation of cuttings
concentration in the annulus and frictional pressure loss, compared with the experimental results. Conversely, modification of
friction factor between the two layers (right column shown as (c) in the figure) resulted in significantly closer match to the
experimental results except for some discrepancy in frictional pressure loss at the lower flow rate region. Although the significant
increase in frictional pressure loss for medium-range hole inclination angles of 30° to 45° was observed in the experiments,
frictional pressure loss increased to a large extent for hole inclination angles higher than 60° in the simulation. The experimental
results may be related to a disturbed dune formed for medium-range hole inclination angles, as reported in our previous study
(Naganawa and Okabe, 2013). However, because the simulation used the two-layer model, it could not fully depict such a disturbed
dune for such hole inclination angles.
Naganawa and Okabe
5
(a) Experimental results (b) f1, f2 modification (c) f12 modification
Figure 6: Simulation results for Cuttings Transport Flow-Loop System (CTFLS) experimental conditions by using a
modified simulator.
The re-simulated result for Well B by using the modified simulator that adopted only f12 is shown in Figure 7. The cuttings bed
height was simulated as sufficiently low. Presumably, effective hole cleaning was achieved in the actual field. However, ECD
estimation by simulation could not determine the actual behavior of ECD obtained by PWD. Therefore, because a limitation may
exist in the mathematical model, care must be taken in interpreting the simulation results.
(a) Cuttings bed height (b) Equivalent circulating density (ECD) behavior
Figure 7: Simulation result for Well B by using modified simulator.
3. SIMULATION OF LONG EXTENDED-REACH TARGET WELL
3.1 Model Well and Simulation Conditions
To evaluate the feasibility of good hole cleaning for a long extended-reach geothermal well, we conducted numerical simulation for
a model well. We assumed a model well with total depth of 3,000 m, horizontal departure of 2,500 m, and maximum hole
inclination angle of 70°, as shown in Figure 8. From these well profiles, we selected two hole sections for simulation targets: (1) a
12–1/4-in section from 1,830 to 2,100 m MD after setting a 13–3/8-in casing and (2) an 8–1/2-in hole section from 2,730 to 3,000
m MD after setting a 9–5/8-in casing.
The drilling fluids used in the simulation study were the same as those used in the CTFLS experiments, which included water and
Mud 2 (bentonite mud). Other simulation conditions were essentially the same as those used in the experiments. We assumed that
the rate of penetration was 9.0 m/h and that 60 min of mud circulation operation for hole cleaning was conducted after drilling one
stand of drill pipe (27 m), which is the time required for making a connection with a top-drive system. The drill pipe eccentricity
was set at 0.0 during circulation operation and at 0.8 during the drilling process.

Naganawa and Okabe
6
Figure 8: Well trajectory and casing program for Plan 1 model well.
3.2 Simulation Results and Discussion
The simulation results for the 12–1/4-in hole section are shown in Figure 9. Because of the mud pump capacity, a larger hole
diameter generally relates to a smaller available maximum annular velocity. Here, we assume that two sets of 800 hp, 8–1/2-in
stroke triplex mud pump systems (e.g., NOV 8-P-80 mud pump), typical for a 3,000-m-class land rig, is used. If we use the smallest
(6–1/4-in) liners, this mud pump has a maximum circulation rate of 1,082 gpm, and the corresponding annular velocity is
approximately 1.08 m/s.
(a) Water
(b) Mud 2 (bentonite mud)
Figure 9: Simulation results for Plan 1 model well 12–1/4-in hole section.
According to the CTFLS experiments demonstrated in the previous study (Naganawa and Okabe, 2013), the desirable annular
velocity is approximately 1.4 m/s; therefore, a maximum circulation rate of 1,082 gpm is insufficient for completely avoiding
cuttings bed formation. However, relatively good hole cleaning that allows some extent of cuttings deposition can be achieved, and
ECD can be maintained at a relatively low rate even with such cuttings deposition for Water and Mud 2 cases.
Simulation results for the 8–1/2-in hole section with a mud flow rate of 380 gpm, which corresponds to 1.0 m/s annular velocity,
are shown in Figure 10. The results show that effective hole cleaning can be achieved at this flow rate. However, ECD was greater
than that of the 12–1/4-in hole section, particularly in Mud 2 case. To suppress ECD increase and avoid lost circulation and

Naganawa and Okabe
7
borehole instability problems, a lower viscosity fluid and slightly higher flow rate are preferable, and a decrease in cuttings bed
height is required. However, care should be taken because an excessive flow rate causes an unexpected ECD increase.
(a) Water
(b) Mud 2 (bentonite mud)
Figure 10: Simulation results for Plan 1 model well 8-1/2-in hole section.
The simulated cuttings bed heights in this study are lower than those presented in our previous study (Naganawa and Okabe, 2013)
because of the modification of the friction factors in the simulator model. Additional experimental and field data are required for
further modification of the model.
4. CONCLUSION AND RECOMMENDATIONS
Determined on the basis of this study, the recommendations for drilling fluids and hydraulics in drilling long, extended-reach
geothermal wells are summarized in the following points:
● From the simulation study, a mud flow rate corresponding to 1.0 m/s annular velocity can achieve effective hole cleaning for
a long extended-reach geothermal well with a 2,500-m horizontal departure, using low-density, low-viscosity drilling fluids.
● ECD is likely to increase in the drilling of small-diameter long tangential hole sections; drilling with water is a good option
for suppressing frictional pressure loss in the annulus.
● Because PWD measurement is not always available, the results of prior hydraulics research must be considered in the
planning phase; however, a hydraulics simulator that can predict ECD behavior with high accuracy has not been developed
thus far.
ACKNOWLEDGEMENTS
This study was conducted as part of a collaborative research project between the Geothermal Energy Research and Development
Co., Ltd.; Teiseki Drilling Co., Ltd.; SK Engineering Co., Ltd.; and The University of Tokyo. This project was funded by the
Ministry of the Environment, Japan, as a Low Carbon Technology Research and Development Program. The authors thank Japan
Oil, Gas and Metals National Corporation (JOGMEC) for its support in the experimental study, and the operating company for their
provision of field data.
REFERENCES
Colebrook, C.F.: Turbulent Flow in Pipes, with Particular Reference to the Transition Region between Smooth and Rough Pipe
Laws, Journal of the ICE, 11, (1939), 133–156.
Doan, Q.T., Oguztoreli, M., Masuda, Y., Yonezawa, T., Kobayashi, A., Naganawa, S., and Kamp, A.: Modeling of Transient
Cuttings Transport in Underbalanced Drilling (UBD), SPE Journal, 8, (2003), 160–170.

Naganawa and Okabe
8
Doron, P., Granica, D., and Barnea, D.: Slurry Flow in Horizontal Pipes—Experimental and Modeling, International Journal of
Multiphase Flow, 13, (1987), 535–547.
Naganawa, S.: Experimental Study of Effective Cuttings Transport in Drilling Highly Inclined Geothermal Wells, Journal of the
Japanese Association for Petroleum Technology, 78, (2013), 257–264.
Naganawa, S., and Nomura, T.: Simulating Transient Behavior of Cuttings Transport over Whole Trajectory of Extended Reach
Well, Proceedings, IADC/SPE Asia Pacific Drilling Technology Conference and Exhibition, Paper SPE 103923, Bangkok,
Thailand (2006).
Naganawa, S., and Okabe, T.: Experimental and Simulation Studies on Optimum Hydraulics Conditions in Long Extended-Reach
Geothermal Well Drilling, Proceedings, 35th New Zealand Geothermal Workshop, Rotorua, New Zealand (2013).
Okabe, T., Nakashima, S., Ujyo, S., Saito, M., Shimada, K., Sato, Y., and Naganawa, S.: Control System for Drilling Geothermal
Wells at High Angles of Deviation in National Parks, Proceedings, 35th New Zealand Geothermal Workshop, Rotorua, New
Zealand (2013).
Televantos, Y., Shook, C.A., Carleton, A., and Streat, M.: Flow of Slurries of Coarse Particles at High Solids Concentrations,
Canadian Journal of Chemical Engineering, 57, (1979), 255–262.