Embed Size (px)
Citation preview
CHAPTER IV
Freight Distribution
Introduction
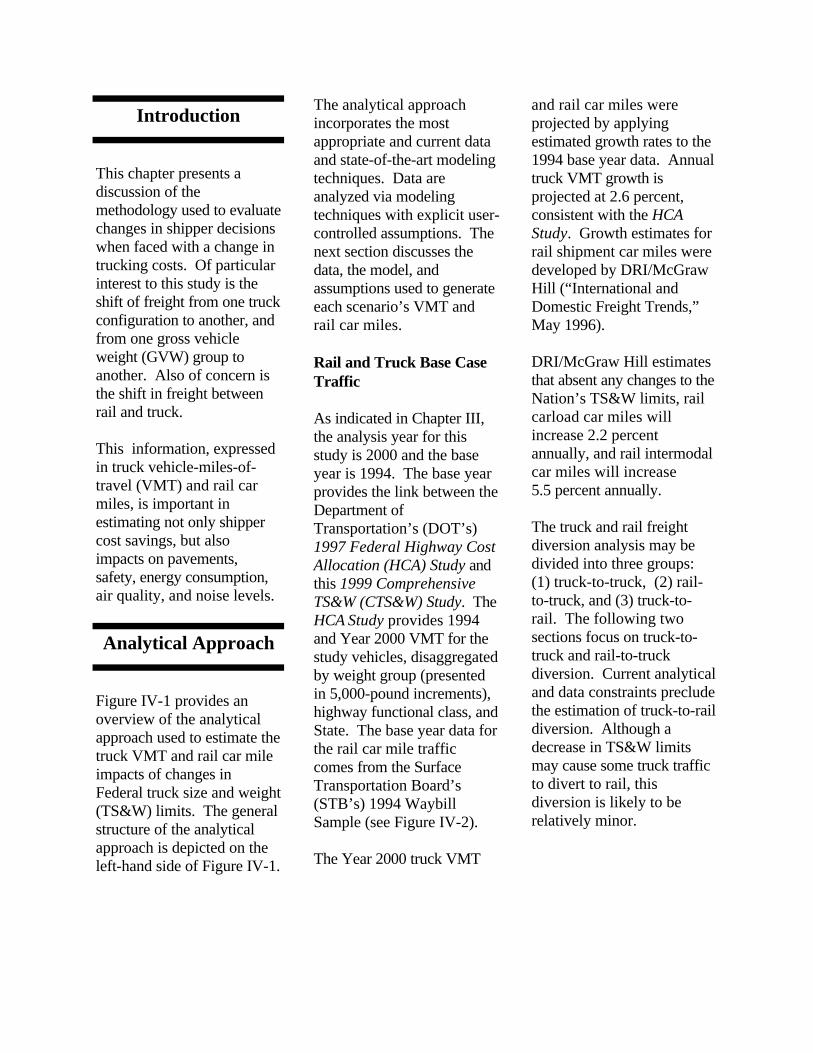
This chapter presents adiscussion of themethodology used to evaluatechanges in shipper decisionswhen faced with a change intrucking costs. Of particularinterest to this study is theshift of freight from one truckconfiguration to another, andfrom one gross vehicleweight (GVW) group toanother. Also of concern isthe shift in freight betweenrail and truck.
This information, expressedin truck vehicle-miles-of-travel (VMT) and rail carmiles, is important inestimating not only shippercost savings, but alsoimpacts on pavements,safety, energy consumption,air quality, and noise levels.
Analytical Approach
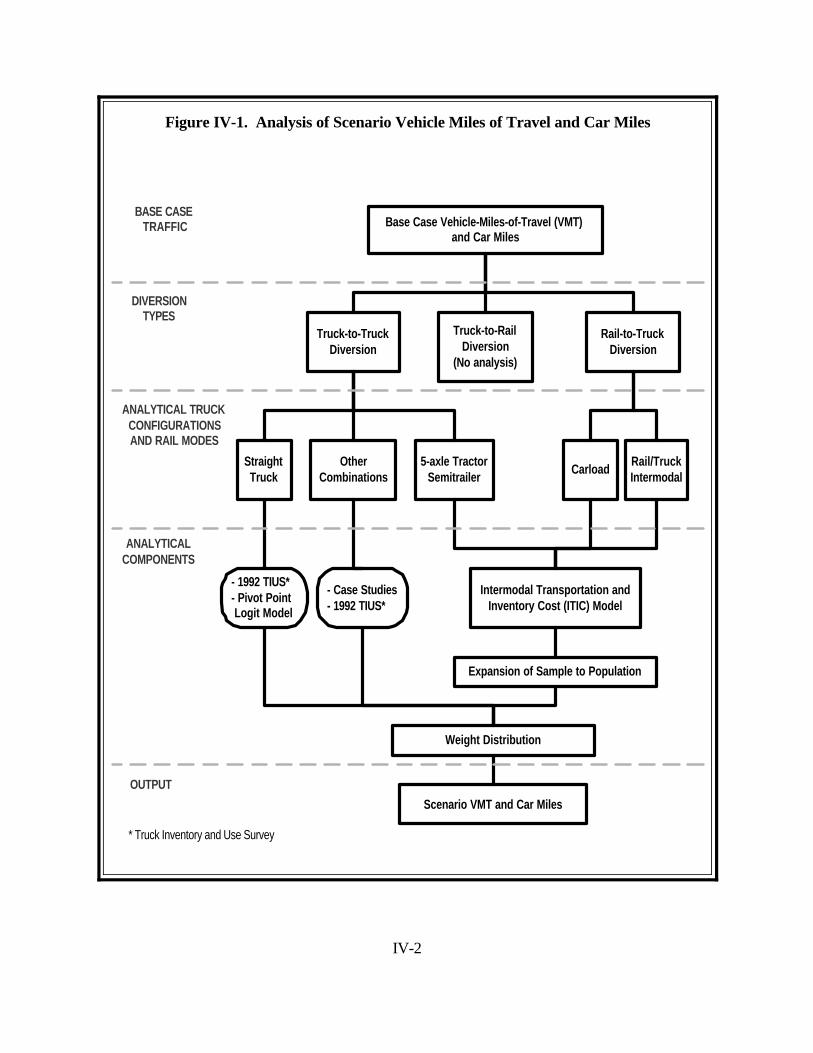
Figure IV-1 provides anoverview of the analyticalapproach used to estimate thetruck VMT and rail car mileimpacts of changes inFederal truck size and weight(TS&W) limits. The generalstructure of the analyticalapproach is depicted on theleft-hand side of Figure IV-1.
The analytical approachincorporates the mostappropriate and current dataand state-of-the-art modelingtechniques. Data areanalyzed via modelingtechniques with explicit user-controlled assumptions. Thenext section discusses thedata, the model, andassumptions used to generateeach scenario’s VMT andrail car miles.
Rail and Truck Base CaseTraffic
As indicated in Chapter III,the analysis year for thisstudy is 2000 and the baseyear is 1994. The base yearprovides the link between theDepartment ofTransportation’s (DOT’s)1997 Federal Highway CostAllocation (HCA) Study andthis 1999 ComprehensiveTS&W (CTS&W) Study. TheHCA Study provides 1994and Year 2000 VMT for thestudy vehicles, disaggregatedby weight group (presentedin 5,000-pound increments),highway functional class, andState. The base year data forthe rail car mile trafficcomes from the SurfaceTransportation Board’s(STB’s) 1994 WaybillSample (see Figure IV-2).
The Year 2000 truck VMT
and rail car miles wereprojected by applyingestimated growth rates to the1994 base year data. Annualtruck VMT growth isprojected at 2.6 percent,consistent with the HCAStudy. Growth estimates forrail shipment car miles weredeveloped by DRI/McGrawHill (“International andDomestic Freight Trends,”May 1996).
DRI/McGraw Hill estimatesthat absent any changes to theNation’s TS&W limits, railcarload car miles willincrease 2.2 percentannually, and rail intermodalcar miles will increase5.5 percent annually.
The truck and rail freightdiversion analysis may bedivided into three groups: (1) truck-to-truck, (2) rail-to-truck, and (3) truck-to-rail. The following twosections focus on truck-to-truck and rail-to-truckdiversion. Current analyticaland data constraints precludethe estimation of truck-to-raildiversion. Although adecrease in TS&W limitsmay cause some truck trafficto divert to rail, thisdiversion is likely to berelatively minor.
IV-2
- 1992 TIUS* - Pivot Point Logit Model
Base Case Vehicle-Miles-of-Travel (VMT)and Car Miles
Truck-to-TruckDiversion
Truck-to-RailDiversion
(No analysis)
Rail-to-TruckDiversion
Rail/TruckIntermodal
CarloadStraightTruck
OtherCombinations
5-axle TractorSemitrailer
Intermodal Transportation andInventory Cost (ITIC) Model
- Case Studies - 1992 TIUS*
Scenario VMT and Car Miles
DIVERSIONTYPES
ANALYTICAL TRUCKCONFIGURATIONSAND RAIL MODES
ANALYTICALCOMPONENTS
OUTPUT
BASE CASETRAFFIC
Expansion of Sample to Population
Weight Distribution
* Truck Inventory and Use Survey
Figure IV-1. Analysis of Scenario Vehicle Miles of Travel and Car Miles

IV-3
The Waybill is the railroad’s bill of lading and contains a great deal of detailed information. The sample includes 2.5 percent of all railroads’ Waybill records. The SurfaceTransportation Board’s complete Waybill database contains 192 data items for each record. The data items used in this study include:
C location codes for the origin and destination of each shipment, C commodity shipped, C rail equipment used, C shipment weight,C shipment revenue, C originating, terminating and intermediate railroads, andC junction points between railroads.
Figure IV-2. The Surface Transportation Board’s Waybill Sample
Diversion
Truck-to-TruckDiversion
Diversion of freight from onetruck configuration to anotheraccounts for a substantialshare of the total change intruck VMT associated withTS&W policy options. Theanalysis of truck-to-truckdiversion is divided intosingle-unit trucks (SUTs),five-axle tractor semitrailersand other combination trucks. These subdivisions are basedon the availability of data.
Single-unit and othercombination truck analysesrely on aggregate weightdistribution and operationalcharacteristics data. Analysis of the five-axle
tractor semitrailer utilizes ashipment-by-shipment dataset which includes weightdistributions and operationalcharacteristics.
Single Unit Trucks
Three- and four-axle SUTstend to operate at, near orabove the current Federalweight limits. These trucksgenerally transport freight inshort-haul operations of 200miles or less. Often SUTs aredesigned to perform aspecific task. Commonexamples of SUTs are dumptrucks, garbage haulers, andtransit mixers.
The diversion analysis forSUTs depends on weightdistributions from the HCAStudy and relative changes inpayload ton-mile costs for
the impacted traffic. Theanalysis is discussed furtherin the Analytical ModelsSection.
Five-Axle TractorSemitrailer
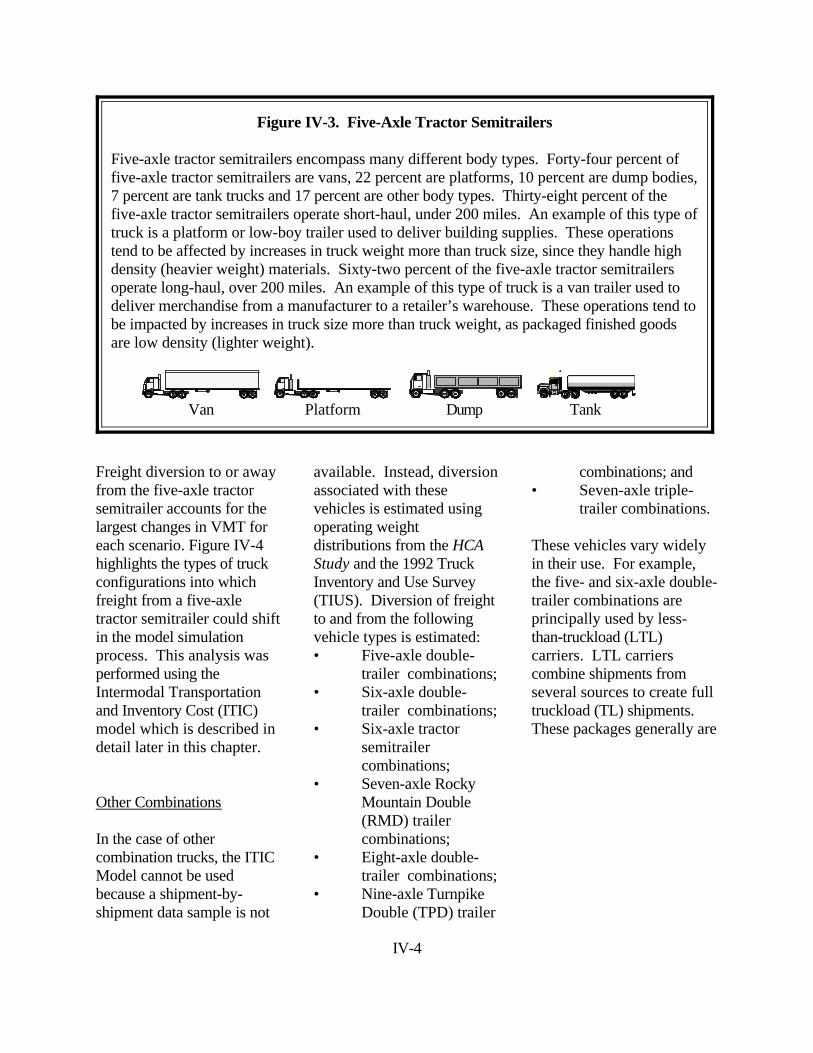
The five-axle tractorsemitrailer is the mostcommon combinationvehicle, comprising thelargest and fastest growingsegment of combinationtrucks. These vehiclesaccount for 78 percent of thecombination truck fleet andare growing at a rate of 3.8 percent per year. Asoutlined in Figure IV-3, thefive-axle tractor semitrailerencompasses a large varietyof operations and body types.
IV-4
Five-axle tractor semitrailers encompass many different body types. Forty-four percent offive-axle tractor semitrailers are vans, 22 percent are platforms, 10 percent are dump bodies,7 percent are tank trucks and 17 percent are other body types. Thirty-eight percent of thefive-axle tractor semitrailers operate short-haul, under 200 miles. An example of this type oftruck is a platform or low-boy trailer used to deliver building supplies. These operationstend to be affected by increases in truck weight more than truck size, since they handle highdensity (heavier weight) materials. Sixty-two percent of the five-axle tractor semitrailersoperate long-haul, over 200 miles. An example of this type of truck is a van trailer used todeliver merchandise from a manufacturer to a retailer’s warehouse. These operations tend tobe impacted by increases in truck size more than truck weight, as packaged finished goodsare low density (lighter weight).
Van Platform Dump Tank
Figure IV-3. Five-Axle Tractor Semitrailers
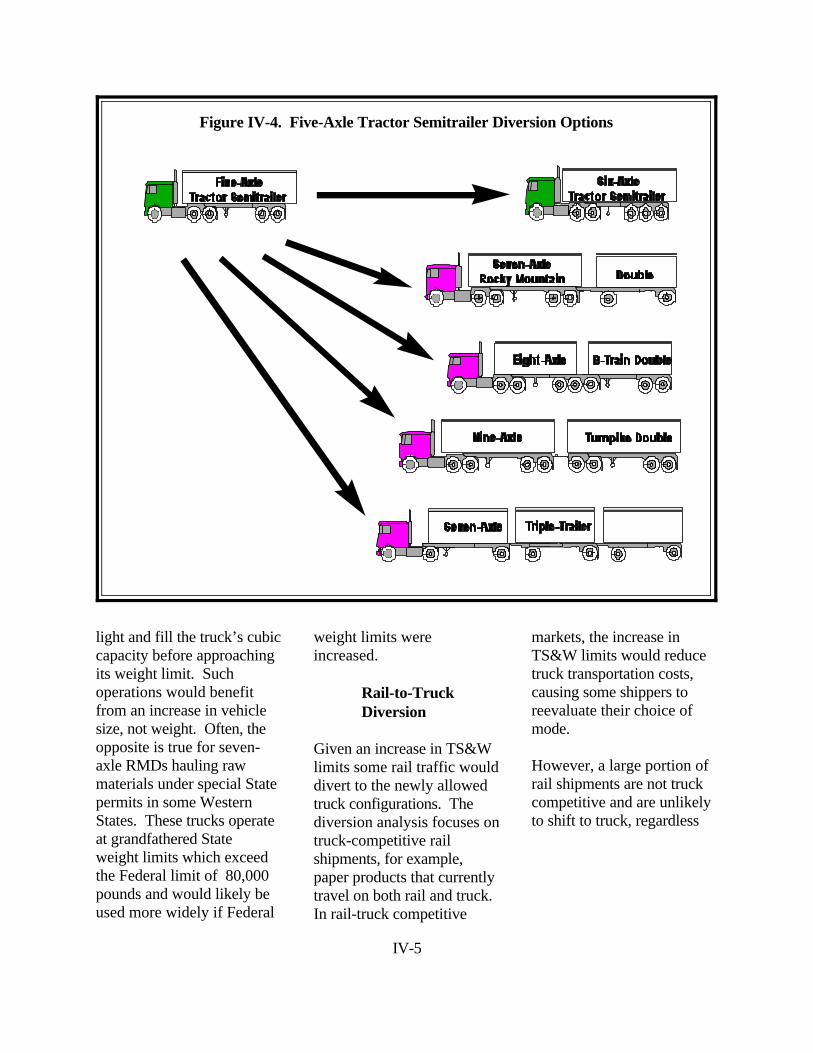
Freight diversion to or awayfrom the five-axle tractorsemitrailer accounts for thelargest changes in VMT foreach scenario. Figure IV-4highlights the types of truckconfigurations into whichfreight from a five-axletractor semitrailer could shiftin the model simulationprocess. This analysis wasperformed using theIntermodal Transportationand Inventory Cost (ITIC)model which is described indetail later in this chapter.
Other Combinations
In the case of othercombination trucks, the ITICModel cannot be usedbecause a shipment-by-shipment data sample is not
available. Instead, diversionassociated with thesevehicles is estimated usingoperating weightdistributions from the HCAStudy and the 1992 Truck Inventory and Use Survey(TIUS). Diversion of freightto and from the followingvehicle types is estimated:• Five-axle double-
trailer combinations;• Six-axle double-
trailer combinations;• Six-axle tractor
semitrailercombinations;
• Seven-axle RockyMountain Double(RMD) trailercombinations;
• Eight-axle double-trailer combinations;
• Nine-axle Turnpike Double (TPD) trailer
combinations; and• Seven-axle triple-
trailer combinations.
These vehicles vary widelyin their use. For example,the five- and six-axle double-trailer combinations areprincipally used by less-than-truckload (LTL)carriers. LTL carrierscombine shipments fromseveral sources to create fulltruckload (TL) shipments. These packages generally are
IV-5
Figure IV-4. Five-Axle Tractor Semitrailer Diversion Options
light and fill the truck’s cubiccapacity before approachingits weight limit. Suchoperations would benefitfrom an increase in vehiclesize, not weight. Often, theopposite is true for seven-axle RMDs hauling rawmaterials under special Statepermits in some WesternStates. These trucks operateat grandfathered State weight limits which exceedthe Federal limit of 80,000pounds and would likely beused more widely if Federal
weight limits wereincreased.
Rail-to-TruckDiversion
Given an increase in TS&Wlimits some rail traffic woulddivert to the newly allowedtruck configurations. Thediversion analysis focuses ontruck-competitive railshipments, for example,paper products that currentlytravel on both rail and truck. In rail-truck competitive
markets, the increase inTS&W limits would reducetruck transportation costs,causing some shippers toreevaluate their choice ofmode.
However, a large portion ofrail shipments are not truckcompetitive and are unlikelyto shift to truck, regardless
IV-6
Figure IV-5. Rail Intermodal Equipment
Trailer-on-Flat-Car
Container-on-Flat-Car
Double Stack on
Well Car *Drawings not to scale.
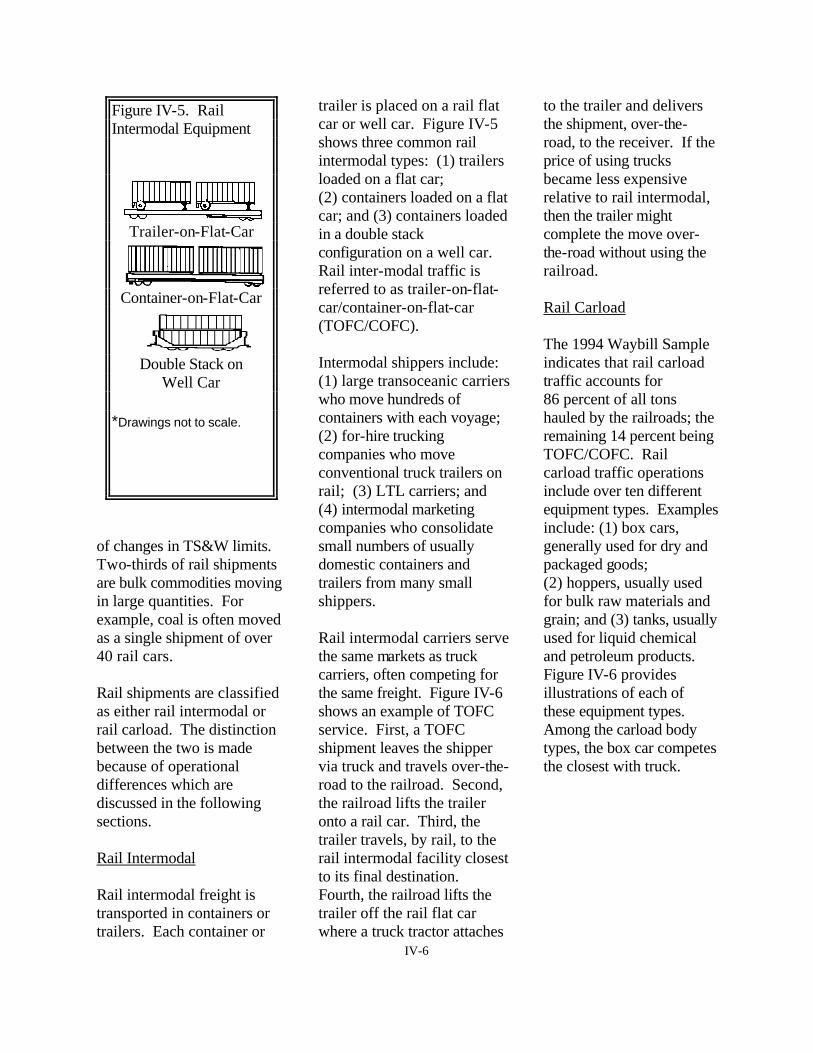
of changes in TS&W limits. Two-thirds of rail shipments are bulk commodities moving in large quantities. For example, coal is often moved as a single shipment of over 40 rail cars. Rail shipments are classified as either rail intermodal or rail carload. The distinction between the two is made because of operational differences which are discussed in the following sections. Rail Intermodal Rail intermodal freight is transported in containers or trailers. Each container or
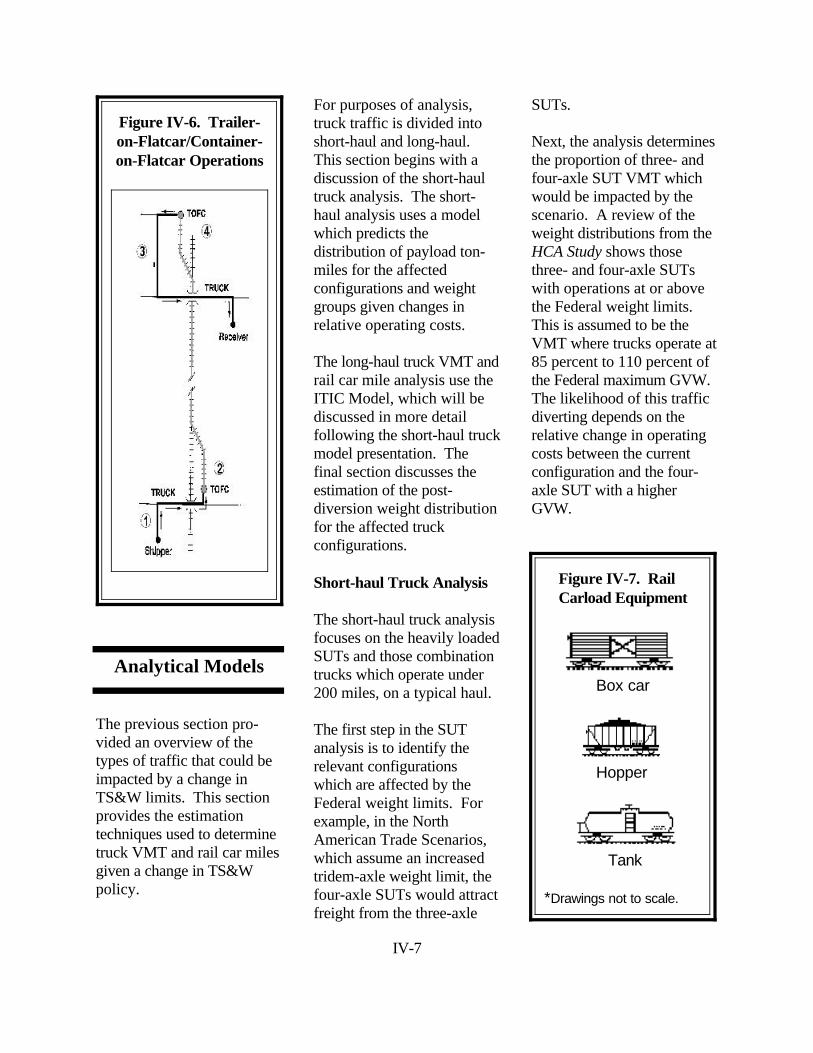
trailer is placed on a rail flat car or well car. Figure IV-5 shows three common rail intermodal types: (1) trailers loaded on a flat car; (2) containers loaded on a flat car; and (3) containers loaded in a double stack configuration on a well car. Rail inter-modal traffic is referred to as trailer-on-flat-car/container-on-flat-car (TOFC/COFC). Intermodal shippers include: (1) large transoceanic carriers who move hundreds of containers with each voyage; (2) for-hire trucking companies who move conventional truck trailers on rail; (3) LTL carriers; and (4) intermodal marketing companies who consolidate small numbers of usually domestic containers and trailers from many small shippers. Rail intermodal carriers serve the same markets as truck carriers, often competing for the same freight. Figure IV-6 shows an example of TOFC service. First, a TOFC shipment leaves the shipper via truck and travels over-the-road to the railroad. Second, the railroad lifts the trailer onto a rail car. Third, the trailer travels, by rail, to the rail intermodal facility closest to its final destination. Fourth, the railroad lifts the trailer off the rail flat car where a truck tractor attaches
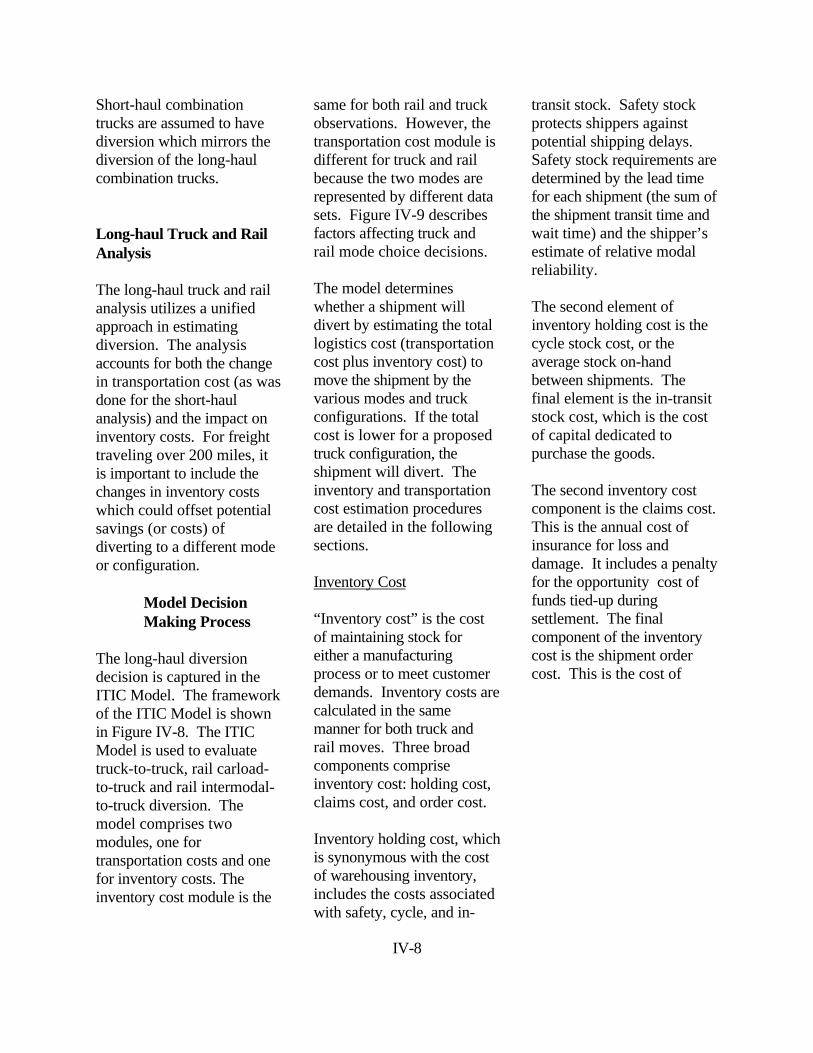
to the trailer and delivers the shipment, over-the-road, to the receiver. If the price of using trucks became less expensive relative to rail intermodal, then the trailer might complete the move over-the-road without using the railroad. Rail Carload The 1994 Waybill Sample indicates that rail carload traffic accounts for 86 percent of all tons hauled by the railroads; the remaining 14 percent being TOFC/COFC. Rail carload traffic operations include over ten different equipment types. Examples include: (1) box cars, generally used for dry and packaged goods; (2) hoppers, usually used for bulk raw materials and grain; and (3) tanks, usually used for liquid chemical and petroleum products. Figure IV-6 provides illustrations of each of these equipment types. Among the carload body types, the box car competes the closest with truck.
IV-7
Figure IV-6. Trailer-on-Flatcar/Container-on-Flatcar Operations
Box car
Hopper
Tank
*Drawings not to scale.
Figure IV-7. RailCarload Equipment
Analytical Models
The previous section pro-vided an overview of thetypes of traffic that could beimpacted by a change inTS&W limits. This sectionprovides the estimationtechniques used to determinetruck VMT and rail car milesgiven a change in TS&Wpolicy.
For purposes of analysis,truck traffic is divided intoshort-haul and long-haul. This section begins with adiscussion of the short-haultruck analysis. The short-haul analysis uses a modelwhich predicts thedistribution of payload ton-miles for the affectedconfigurations and weightgroups given changes inrelative operating costs.
The long-haul truck VMT andrail car mile analysis use theITIC Model, which will bediscussed in more detailfollowing the short-haul truckmodel presentation. Thefinal section discusses theestimation of the post-diversion weight distributionfor the affected truckconfigurations.
Short-haul Truck Analysis
The short-haul truck analysisfocuses on the heavily loadedSUTs and those combinationtrucks which operate under200 miles, on a typical haul.
The first step in the SUTanalysis is to identify therelevant configurationswhich are affected by theFederal weight limits. Forexample, in the NorthAmerican Trade Scenarios,which assume an increasedtridem-axle weight limit, thefour-axle SUTs would attractfreight from the three-axle
SUTs.
Next, the analysis determinesthe proportion of three- andfour-axle SUT VMT whichwould be impacted by thescenario. A review of theweight distributions from theHCA Study shows thosethree- and four-axle SUTswith operations at or abovethe Federal weight limits. This is assumed to be theVMT where trucks operate at85 percent to 110 percent ofthe Federal maximum GVW. The likelihood of this trafficdiverting depends on therelative change in operatingcosts between the currentconfiguration and the four-axle SUT with a higherGVW.
IV-8
Short-haul combinationtrucks are assumed to havediversion which mirrors thediversion of the long-haulcombination trucks.
Long-haul Truck and RailAnalysis
The long-haul truck and railanalysis utilizes a unifiedapproach in estimatingdiversion. The analysisaccounts for both the changein transportation cost (as wasdone for the short-haulanalysis) and the impact oninventory costs. For freighttraveling over 200 miles, itis important to include thechanges in inventory costswhich could offset potentialsavings (or costs) ofdiverting to a different modeor configuration.
Model DecisionMaking Process
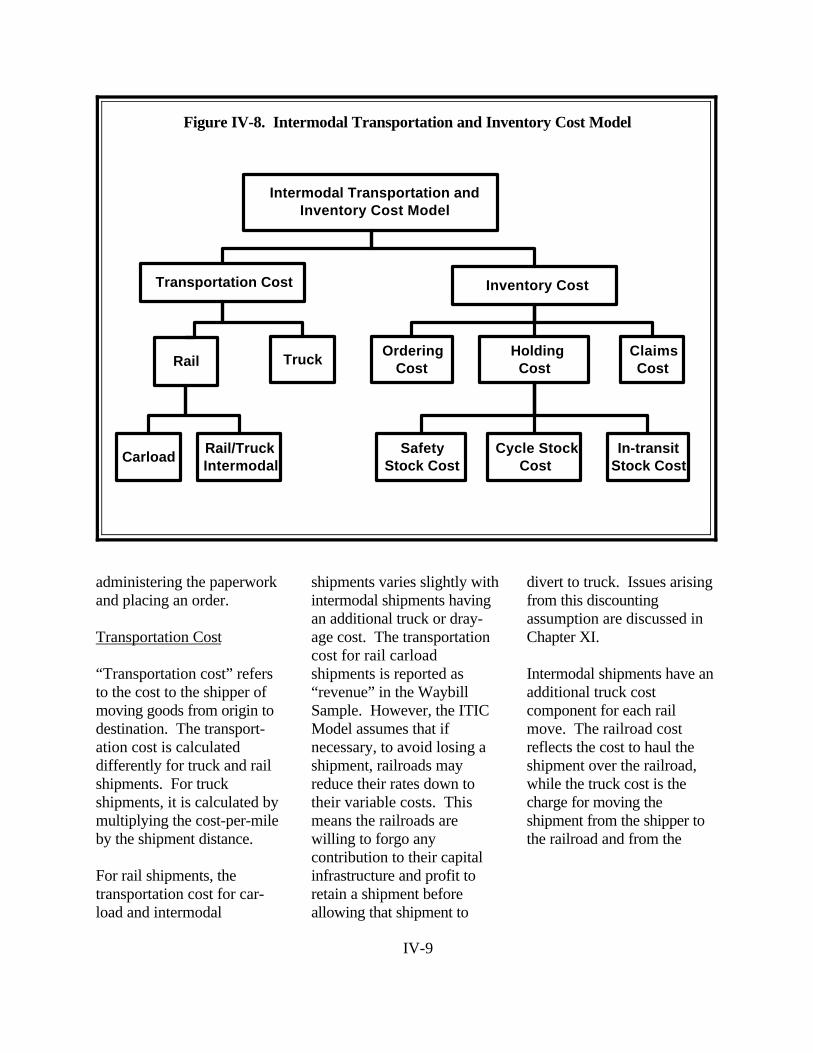
The long-haul diversiondecision is captured in theITIC Model. The frameworkof the ITIC Model is shownin Figure IV-8. The ITICModel is used to evaluatetruck-to-truck, rail carload-to-truck and rail intermodal-to-truck diversion. Themodel comprises twomodules, one fortransportation costs and onefor inventory costs. Theinventory cost module is the
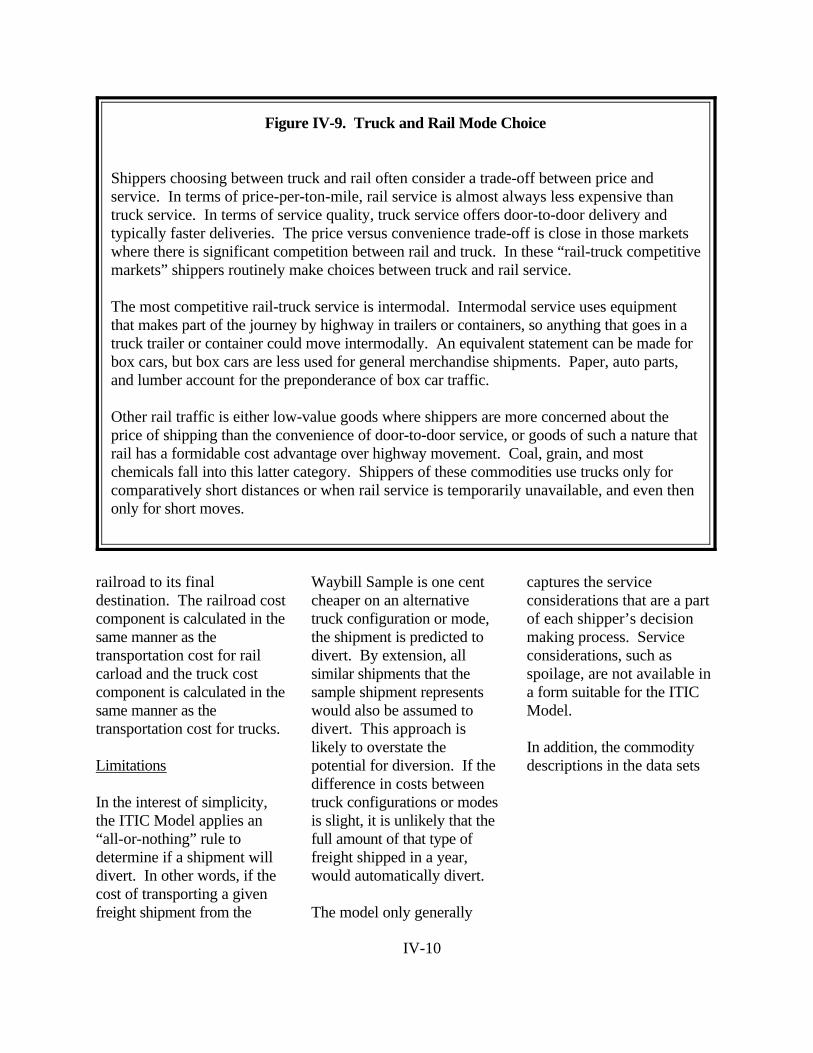
same for both rail and truckobservations. However, thetransportation cost module isdifferent for truck and railbecause the two modes arerepresented by different datasets. Figure IV-9 describesfactors affecting truck andrail mode choice decisions.
The model determineswhether a shipment willdivert by estimating the totallogistics cost (transportationcost plus inventory cost) tomove the shipment by thevarious modes and truckconfigurations. If the totalcost is lower for a proposedtruck configuration, theshipment will divert. Theinventory and transportationcost estimation proceduresare detailed in the followingsections.
Inventory Cost
“Inventory cost” is the costof maintaining stock foreither a manufacturingprocess or to meet customerdemands. Inventory costs arecalculated in the samemanner for both truck andrail moves. Three broadcomponents compriseinventory cost: holding cost,claims cost, and order cost.
Inventory holding cost, whichis synonymous with the costof warehousing inventory,includes the costs associatedwith safety, cycle, and in-
transit stock. Safety stockprotects shippers againstpotential shipping delays. Safety stock requirements aredetermined by the lead timefor each shipment (the sum ofthe shipment transit time andwait time) and the shipper’sestimate of relative modalreliability.
The second element ofinventory holding cost is thecycle stock cost, or theaverage stock on-handbetween shipments. Thefinal element is the in-transitstock cost, which is the costof capital dedicated topurchase the goods.
The second inventory costcomponent is the claims cost. This is the annual cost ofinsurance for loss anddamage. It includes a penaltyfor the opportunity cost offunds tied-up duringsettlement. The finalcomponent of the inventorycost is the shipment ordercost. This is the cost of
IV-9
Intermodal Transportation andInventory Cost Model
Transportation Cost Inventory Cost
SafetyStock Cost
OrderingCost
ClaimsCost
TruckRail Holding
Cost
Cycle StockCost
In-transitStock Cost
CarloadRail/TruckIntermodal
Figure IV-8. Intermodal Transportation and Inventory Cost Model
administering the paperworkand placing an order.
Transportation Cost
“Transportation cost” refersto the cost to the shipper ofmoving goods from origin todestination. The transport-ation cost is calculateddifferently for truck and railshipments. For truckshipments, it is calculated bymultiplying the cost-per-mileby the shipment distance.
For rail shipments, thetransportation cost for car-load and intermodal
shipments varies slightly withintermodal shipments havingan additional truck or dray-age cost. The transportationcost for rail carloadshipments is reported as“revenue” in the WaybillSample. However, the ITICModel assumes that ifnecessary, to avoid losing ashipment, railroads mayreduce their rates down totheir variable costs. Thismeans the railroads arewilling to forgo anycontribution to their capitalinfrastructure and profit toretain a shipment beforeallowing that shipment to
divert to truck. Issues arisingfrom this discountingassumption are discussed inChapter XI.
Intermodal shipments have anadditional truck costcomponent for each railmove. The railroad costreflects the cost to haul the shipment over the railroad,while the truck cost is thecharge for moving theshipment from the shipper tothe railroad and from the
IV-10
Shippers choosing between truck and rail often consider a trade-off between price andservice. In terms of price-per-ton-mile, rail service is almost always less expensive thantruck service. In terms of service quality, truck service offers door-to-door delivery andtypically faster deliveries. The price versus convenience trade-off is close in those marketswhere there is significant competition between rail and truck. In these “rail-truck competitivemarkets” shippers routinely make choices between truck and rail service.
The most competitive rail-truck service is intermodal. Intermodal service uses equipmentthat makes part of the journey by highway in trailers or containers, so anything that goes in atruck trailer or container could move intermodally. An equivalent statement can be made forbox cars, but box cars are less used for general merchandise shipments. Paper, auto parts,and lumber account for the preponderance of box car traffic.
Other rail traffic is either low-value goods where shippers are more concerned about theprice of shipping than the convenience of door-to-door service, or goods of such a nature thatrail has a formidable cost advantage over highway movement. Coal, grain, and mostchemicals fall into this latter category. Shippers of these commodities use trucks only forcomparatively short distances or when rail service is temporarily unavailable, and even thenonly for short moves.
Figure IV-9. Truck and Rail Mode Choice
railroad to its finaldestination. The railroad costcomponent is calculated in thesame manner as thetransportation cost for railcarload and the truck costcomponent is calculated in thesame manner as thetransportation cost for trucks.
Limitations
In the interest of simplicity,the ITIC Model applies an“all-or-nothing” rule todetermine if a shipment willdivert. In other words, if thecost of transporting a givenfreight shipment from the
Waybill Sample is one centcheaper on an alternativetruck configuration or mode,the shipment is predicted todivert. By extension, allsimilar shipments that thesample shipment representswould also be assumed todivert. This approach islikely to overstate thepotential for diversion. If thedifference in costs betweentruck configurations or modesis slight, it is unlikely that thefull amount of that type offreight shipped in a year,would automatically divert.
The model only generally
captures the serviceconsiderations that are a partof each shipper’s decisionmaking process. Serviceconsiderations, such asspoilage, are not available ina form suitable for the ITICModel.
In addition, the commoditydescriptions in the data sets
IV-11
Development of the Intermodal Transportation andInventory Cost (ITIC) Model involved several stages ofsensitivity testing and expert reviews. An expert groupwas established to evaluate, in detail, the diversionapproach and results. This group, comprised of experts intruck and rail operations, inventory and diversionmodeling, reviewed both interim and final products.
The group examined the model structure, underlyingtheory and the reasonableness of the analytical output. The product of this review process was a detailedunderstanding of the determinants that influence modeselection in the ITIC Model.
In addition, the review process highlighted limitations ofthe model and areas requiring further development.
Figure IV-10. Intermodal Transportation and InventoryCost Model Development
may be too generic todetermine the service level tobe assigned. For example, ifa shipment consisted of “foodand kindred products,” it isimpossible to tell whether thisis fresh or canned peaches. Therefore, in the case of freshpeaches, the model wouldassume incorrectly that theshipment is not perishable. Perishable goods would haveshort delivery deadlines,which could decrease thediversion of a shipment froma semi-trailer to a longdouble-trailer combination(RMD or TPD) or a triple-trailer combination. This isbecause more time would berequired for a shipper to
coordinate the movement oftrailers with different servicerequirements.
The analysis year of the studyis 2000. The potentialdiversion of traffic betweentruck classes and betweentruck and rail is estimatedassuming that shippers andcarriers could immediatelychange their operations to takeadvantage of differences inrelative transportation costsamong modes. In practice itwould take many years for allcarriers to adapt their fleets totake best advantage of revisedTS&W limits. Likewise, it isassumed that the highwayinfrastructure needed to
accommodate truckconfigurations that mayoperate under revised TS&Wregulations is immediatelyavailable. Again, in practice,it would take many yearsbefore all bridge andgeometric designimprovements were made. Thus the study assumes thatconditions approaching along-run equilibrium areachieved instantly. Similarassumptions have been madein previous TS&W studies bythe Department and others.
Input Data
Truck
This section discusses thetruck data set required for theITIC Model. Because asingle data set which capturesall the relevant variables isnot available, differentsources are used to captureover-the-road shipments,transportation cost, line-haulmiles, repositioning miles andcommodity attributes. Thesample of over-the-roadshipments is based on the1993-1994 Association of
IV-12
Because a sample of shipments by five- and six-axle double-trailer combinations does not exist, the diversion analysisrelied upon the 1992 Truck Inventory and Use Survey, aswell as industry observation. The survey shows that 70 percent of the short double-trailer combinations are usedin less-than-truckload (LTL) operations. The diversionanalysis assumes that to increase the efficiency of the fleet,current LTL double-trailer operations would divert to triple-trailer operations. An additional assumption is made that theother 30 percent of short double-trailer combinations haveoperations similar to LTL carriers and would alsoexperience cost savings from adding an additional trailer.
Figure IV- 11. Diversion of Freight Transported in ShortDouble-Trailer Combinations
American Railroads’ NorthAmerican TransportationSurvey (NATS). The surveycollected 24,639 responses. Because each respondent wasasked about their current andprevious shipment, the samplecontained data on 49,278shipments. For this analysis,short-haul shipments of lessthan 200 miles were deletedleaving a data set of 47,135shipments. Also excludedwere shipments by autoracktrucks, since the study’sscenarios do not specificallyanalyze those vehicles.
The NATS data provideshipment information fororigin and destination pairs,truck body type andcommodity hauled. Formodeling purposes, it isassumed that there are twobody types, van and tank,although body type is moredetailed in the survey.
The NATS data do notinclude truck configurationinformation, such as thenumber of axles, trailers ortrailer length. The data do notdistinguish between a five-axle tractor semitrailer, ashort double, or an LCV. According to the 1992 TIUSreport, 80 percent of all trucksoperating over 200 miles arefive-axle tractor semitrailers. Therefore, it is assumed thatall the shipments representedin NATS are traveling in five-axle tractor semitrailers. This
assumption does not affect theoverall distribution of VMTamong vehicle classesbecause base case traffic byconfigurations other than thefive-axle tractor semitrailer is analyzed separately.
There were three adjustmentsto the NATS data. The datawere adjusted for trip lengthto avoid the bias associatedwith sampling mostly longtrips in the survey. Thesecond adjustment was forpartial loads. The NATS didnot include a question onwhether the trailer was fullyloaded. Responses toprevious roadside surveyswere used to estimate partialloads. The final adjustmentwas to expand the sample oftruck moves to the total truckVMT. The diversion results
were expanded to the HCAStudy total VMT byconfiguration, State andhighway functional class.
Four variables were added tothe shipment records in theNATS data set:(1) transportation cost;(2) line-haul miles;(3) repositioning miles; and(4) commodity information. The truck transportation cost-per-mile is based on a
IV-13
A Base Case Scenario, which assumes current Federal truck size and weight (TS&W) rules,was analyzed using the Intermodal Transportation and Inventory Cost (ITIC) Model. Theresults were evaluated to see how accurately the model determined the truck configurationand mode choice of shipments under current Federal TS&W limits. Since shipper decisionmaking results are known for the Base Case Scenario, this provides a good test case by whichto verify the model results.
The carload and truck input data sets were separately analyzed with the ITIC Model. In thebase case, if the model selected a mode different from the mode reported in the data set, theshipment was called a “misassigned” record. For example, if a carload rail observation“diverted” to a five-axle tractor semitrailer then that record was said to have “misassigned”since the model did not predict that rail carload was the preferred mode.
In the truck analysis, the misassigned records were less than one percent of the input records. This means that in virtually all cases, the ITIC Model correctly predicted the truckconfiguration consistent with the input data set.
In the rail carload analysis, 6,563 records were misassigned in the base case; that is themodel incorrectly predicted that the shipment would travel by truck. This was equal to 2.53percent of the carload shipment records in the sample set. This level of error is good for acomplex model such as ITIC.
Most, 56 percent, of the misassigned carload records involved transportation equipment. Infact, almost one-half of the total transportation equipment records in the carload sample weremisassigned. Apparently, the model does not capture, or is not sufficiently sensitive to, all ofthe relevant mode choice considerations characterizing the transportation equipment market. The next most common misassigned commodity was pulp and paper, accounting for 12percent of the misassigned records.
The misassigned records could result from model error or the absence of a critical variable. However, it is also possible that these misassigned shipments are very truck/rail competitive;and therefore highly susceptible to diverting. Deleting the records may result inunderestimating diversion. The same conclusion holds if the shipments represent shippererror, i.e., if the shipper lacked complete information about all the relevant costs, and electedto ship by rail even though trucks would have been more advantageous.
In this analysis the misassigned records have been removed from the vehicle-miles-of-travelestimates. This could potentially lead to an understatement of rail diversion.
Figure IV-12. ITIC Model Calibration
IV-14
report by Jack FaucettAssociates (August, 1991),“The Effect of Size andWeight Limits on TruckCosts.” The reportsummarizes cost-per-mileinformation by body type,truck configuration andpayload. The modelingapproach assumes motorcarrier rates may be closelyapproximated by a per-milerate.
Line-haul and repositioningmiles are also added to theNATS shipment data. Theline-haul miles werecomputed for each truckconfiguration using thenetworks presented inChapter II and the origin anddestination cities included inNATS. An estimate ofrepositioning miles wasadded to the line-hauldistance to reflect thedistance a truck would likelytravel before obtaining areturn shipment.
The final additional datavariables provide commodityattribute information onprice-per-pound, annual userate, and shipping density fora commodity. Estimates ofthe commodity price-per-pound were obtained fromthe Bureau of Census’ 1993Commodity Flow Survey(CFS) Report.
Rail
The primary source ofrailroad data is the STB’s1994 Waybill Sample. Records for the followingwere excluded:(1) shipments under 200miles, since short rail movesare not competitive withtruck; (2) coal shipmentstraveling more than 500miles, since this heavy bulkfreight is not directlycompetitive with trucks;(3) autorack shipments, sinceautoracks are not explicitlyanalyzed in the illustrativescenarios; and(4) movements of locomotiveand empty rail equipment.
The ITIC Model uses thefollowing Waybill Samplevariables: origin anddestination pairs, commodityshipped, annual tons shipped,number of railroads,equipment type, sample-to-population expansion factorsand the variable cost for therail shipments.
Of the variables justdescribed, the most importantfor estimating freightdiversion is the railroad’svariable cost. It is moreimportant than rail revenuesince the ITIC Modelassumes that each shipmentby rail can be discounteddown to the railroad’svariable cost before thefreight would divert to truck. However, rail revenue isimportant to the rail viability
analysis in Chapter XI, “RailImpacts.”
The variable cost for railshipments is estimated by theSTB via an accountingprocedure that uses railroad-by-railroad data to computevariable cost for sixteenequipment types.
An expert review of theWaybill and the ITICModel’s analysis of theWaybill records revealedthat the variable cost fieldcould not be used in the ITICModel for intermodalshipments.
The variable cost forintermodal shipments wasestimated using an accountingprocedure similar to theSTB’s method. The costswere expanded from anestimation of selectedintermodal city pairs whichrepresented a cross-sectionof annual tons-per-year andmileage groups. The costingmethod was adjusted fortrain length, rail yard dwelltime, and number ofcontainers or trailers-per-railcar, among other factorsspecific to each city pair.
Four variables were added
IV-15
0%
2%
4%
6%
8%
10%
12%
14%
16%
5 10 15 20 25 30 35 40 45 50 55 60 65 70 75 80 85 90 95 100 105 110
Weight Group (Thousands of Pounds)
Per
cen
t V
ehic
le-M
iles-
of-T
rave
l BASE Four-axle SUT
SCENARIO Four-axle SUT
Figure IV-13. Weight Distribution Example - Base Case and Uniformity Scenario forFour-Axle Single Unit Truck
to the Waybill records:(1) commodity information;(2) truck repositioning miles;(3) truck line-haul; and(4) pick-up and delivery costfor intermodal shipments. The commodity attributeinformation is price-per-pound and shipping densityfor each commodity. Estimates of the commodityprice-per-pound wereobtained from the Bureau ofCensus’ 1993 CFS Report.
For each rail shipment, thedistance to move theshipment by the various truckconfigurations was added tothe rail database. Thisprovided a means ofcomparing the rail line-hauldistances with the truck line-haul distances. The truckline-haul miles werecomputed in the same mannerdescribed under the truck
data section.
The pick-up and deliverycost for intermodal shipmentsis the cost of getting thecontainer or trailer to andfrom the railroad network. The distance that theintermodal shipment travelsby truck was estimated usingthe population density foreach Business EconomicArea as designated by theCensus Bureau.
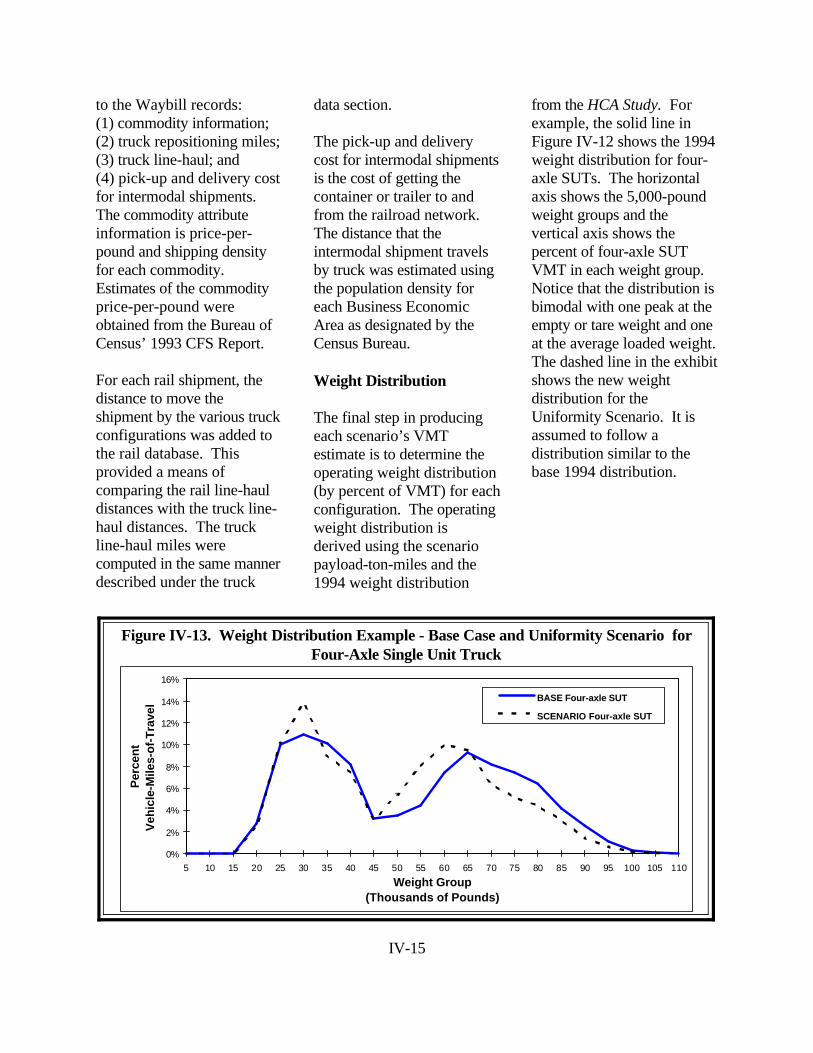
Weight Distribution
The final step in producingeach scenario’s VMTestimate is to determine theoperating weight distribution(by percent of VMT) for eachconfiguration. The operatingweight distribution isderived using the scenariopayload-ton-miles and the1994 weight distribution
from the HCA Study. Forexample, the solid line inFigure IV-12 shows the 1994weight distribution for four-axle SUTs. The horizontalaxis shows the 5,000-poundweight groups and thevertical axis shows thepercent of four-axle SUTVMT in each weight group. Notice that the distribution isbimodal with one peak at theempty or tare weight and oneat the average loaded weight. The dashed line in the exhibitshows the new weightdistribution for theUniformity Scenario. It isassumed to follow adistribution similar to thebase 1994 distribution.
IV-16
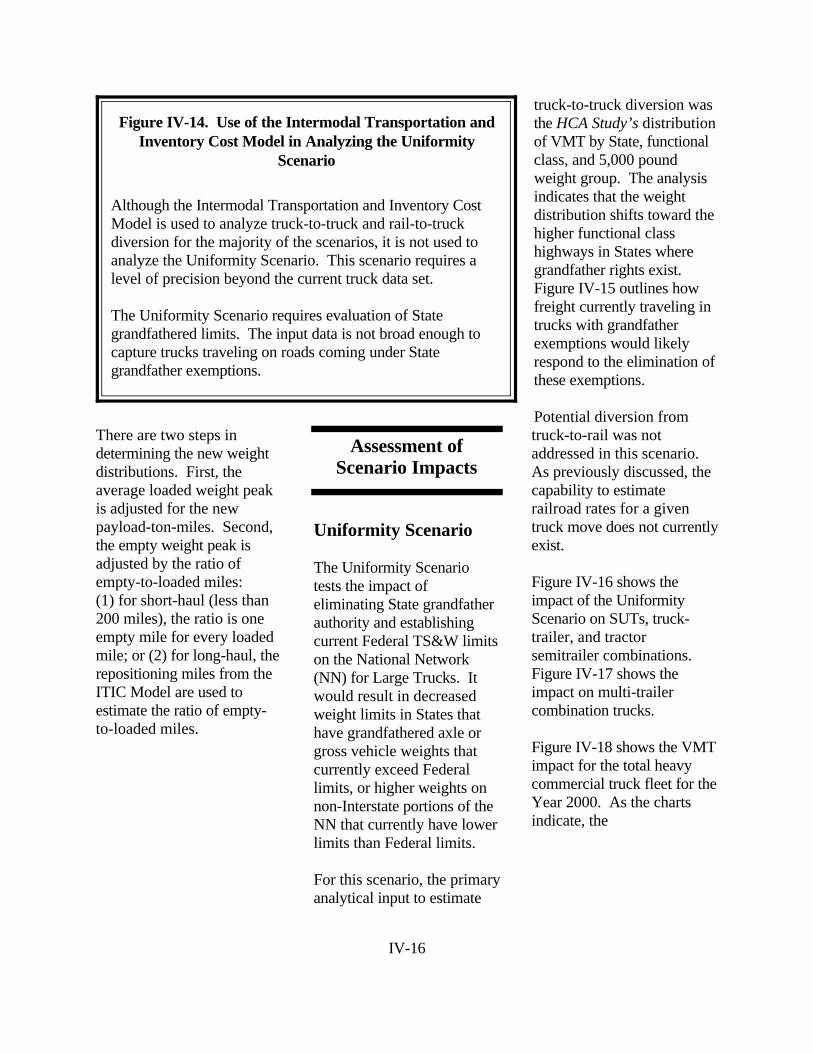
Although the Intermodal Transportation and Inventory CostModel is used to analyze truck-to-truck and rail-to-truckdiversion for the majority of the scenarios, it is not used toanalyze the Uniformity Scenario. This scenario requires alevel of precision beyond the current truck data set.
The Uniformity Scenario requires evaluation of Stategrandfathered limits. The input data is not broad enough tocapture trucks traveling on roads coming under Stategrandfather exemptions.
Figure IV-14. Use of the Intermodal Transportation andInventory Cost Model in Analyzing the Uniformity
Scenario
There are two steps indetermining the new weightdistributions. First, theaverage loaded weight peakis adjusted for the newpayload-ton-miles. Second,the empty weight peak isadjusted by the ratio ofempty-to-loaded miles:(1) for short-haul (less than200 miles), the ratio is oneempty mile for every loadedmile; or (2) for long-haul, therepositioning miles from theITIC Model are used toestimate the ratio of empty-to-loaded miles.
Assessment ofScenario Impacts
Uniformity Scenario
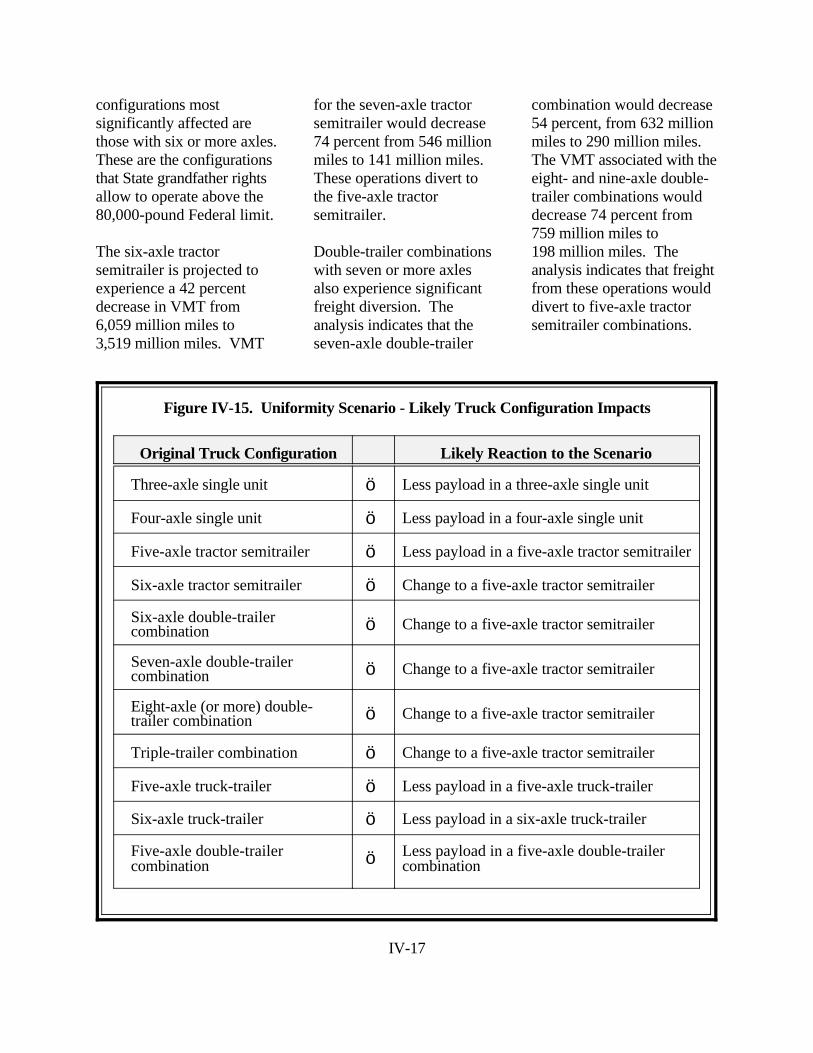
The Uniformity Scenariotests the impact ofeliminating State grandfatherauthority and establishingcurrent Federal TS&W limitson the National Network(NN) for Large Trucks. Itwould result in decreasedweight limits in States thathave grandfathered axle orgross vehicle weights thatcurrently exceed Federallimits, or higher weights onnon-Interstate portions of theNN that currently have lowerlimits than Federal limits.
For this scenario, the primaryanalytical input to estimate
truck-to-truck diversion wasthe HCA Study’s distributionof VMT by State, functionalclass, and 5,000 poundweight group. The analysisindicates that the weightdistribution shifts toward thehigher functional classhighways in States wheregrandfather rights exist. Figure IV-15 outlines howfreight currently traveling intrucks with grandfatherexemptions would likelyrespond to the elimination ofthese exemptions.
Potential diversion fromtruck-to-rail was notaddressed in this scenario. As previously discussed, thecapability to estimaterailroad rates for a giventruck move does not currentlyexist.
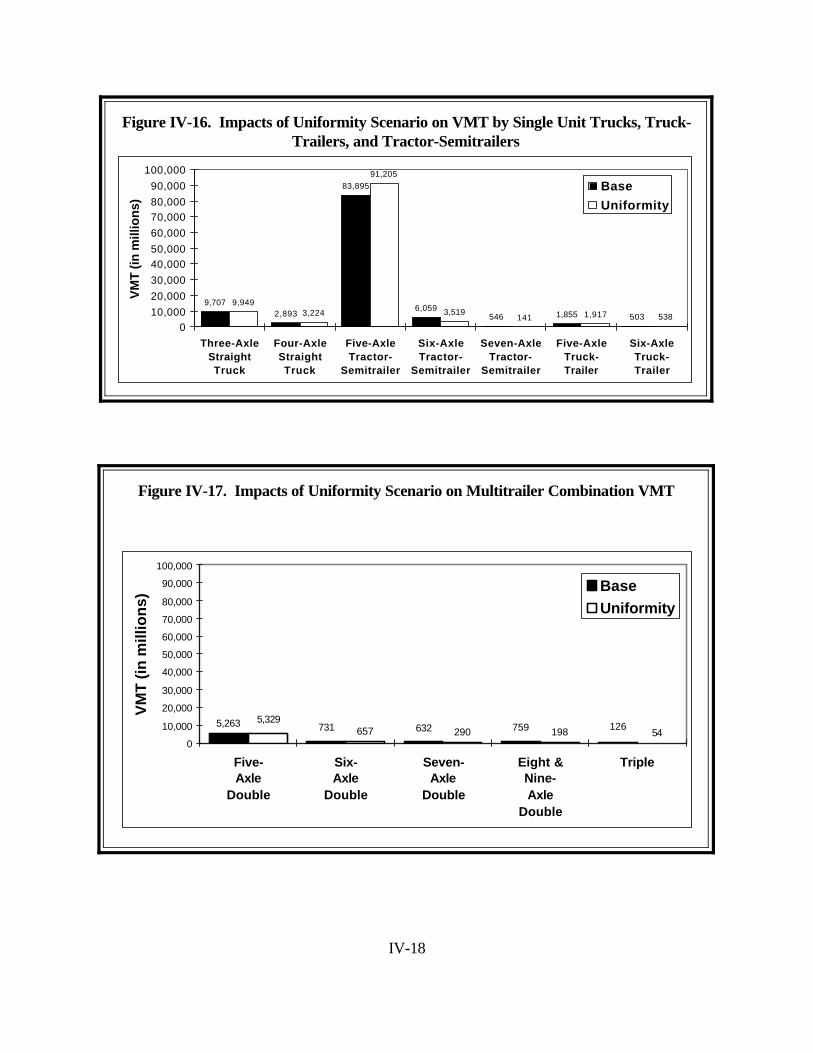
Figure IV-16 shows theimpact of the UniformityScenario on SUTs, truck-trailer, and tractorsemitrailer combinations. Figure IV-17 shows theimpact on multi-trailercombination trucks.
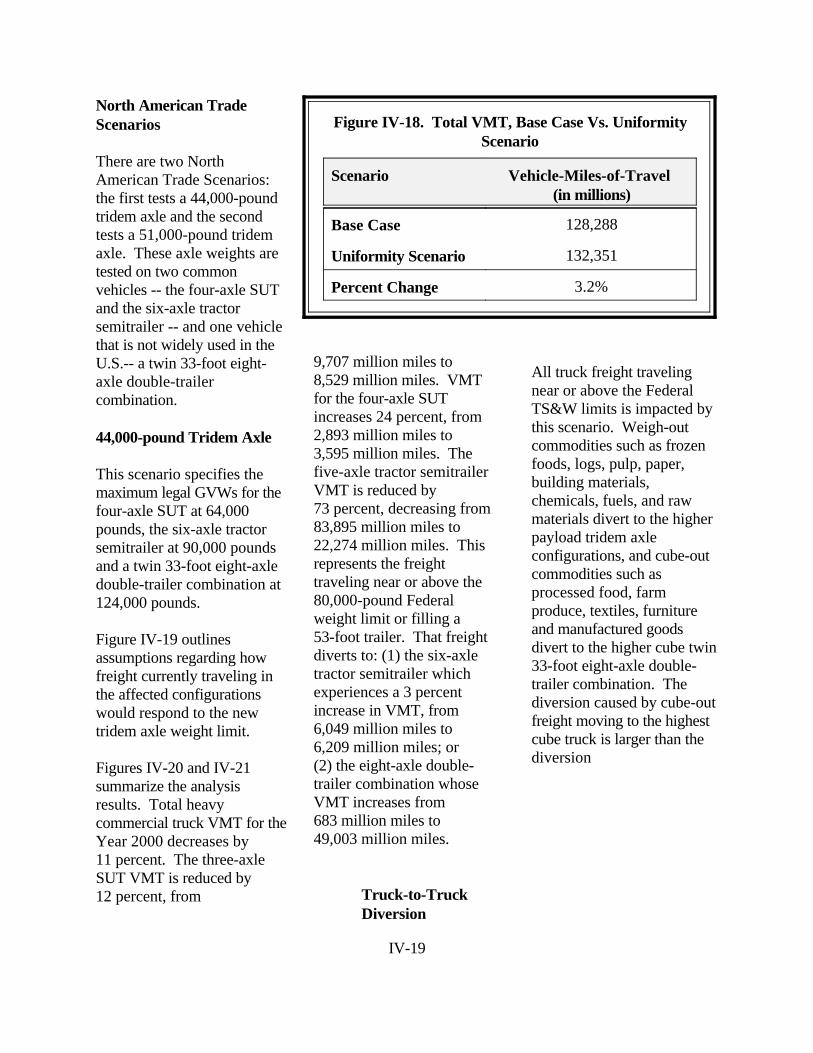
Figure IV-18 shows the VMTimpact for the total heavycommercial truck fleet for theYear 2000. As the chartsindicate, the
IV-17
Original Truck Configuration Likely Reaction to the Scenario
Three-axle single unit ö Less payload in a three-axle single unit
Four-axle single unit ö Less payload in a four-axle single unit
Five-axle tractor semitrailer ö Less payload in a five-axle tractor semitrailer
Six-axle tractor semitrailer ö Change to a five-axle tractor semitrailer
Six-axle double-trailercombination ö Change to a five-axle tractor semitrailer
Seven-axle double-trailercombination ö Change to a five-axle tractor semitrailer
Eight-axle (or more) double-trailer combination ö Change to a five-axle tractor semitrailer
Triple-trailer combination ö Change to a five-axle tractor semitrailer
Five-axle truck-trailer ö Less payload in a five-axle truck-trailer
Six-axle truck-trailer ö Less payload in a six-axle truck-trailer
Five-axle double-trailercombination ö Less payload in a five-axle double-trailer
combination
Figure IV-15. Uniformity Scenario - Likely Truck Configuration Impacts
configurations mostsignificantly affected arethose with six or more axles. These are the configurationsthat State grandfather rightsallow to operate above the80,000-pound Federal limit.
The six-axle tractorsemitrailer is projected toexperience a 42 percentdecrease in VMT from6,059 million miles to3,519 million miles. VMT
for the seven-axle tractorsemitrailer would decrease74 percent from 546 millionmiles to 141 million miles. These operations divert tothe five-axle tractorsemitrailer.
Double-trailer combinationswith seven or more axlesalso experience significantfreight diversion. Theanalysis indicates that theseven-axle double-trailer
combination would decrease54 percent, from 632 millionmiles to 290 million miles. The VMT associated with theeight- and nine-axle double-trailer combinations woulddecrease 74 percent from759 million miles to198 million miles. Theanalysis indicates that freightfrom these operations woulddivert to five-axle tractorsemitrailer combinations.
IV-18
9,7072,893
83,895
6,059546 1,855 503
9,9493,224
91,205
3,519141 1,917 538
010,00020,00030,00040,00050,00060,00070,00080,00090,000
100,000
Three-AxleStraightTruck
Four-AxleStraightTruck
Five-AxleTractor-
Semitrailer
Six-AxleTractor-
Semitrailer
Seven-AxleTractor-
Semitrailer
Five-AxleTruck-Trailer
Six-AxleTruck-Trailer
VM
T (i
n m
illio
ns)
Base
Uniformity
Figure IV-16. Impacts of Uniformity Scenario on VMT by Single Unit Trucks, Truck-Trailers, and Tractor-Semitrailers
5,263657 290 198 54
1267596327315,329
0
10,000
20,000
30,000
40,000
50,000
60,000
70,000
80,000
90,000
100,000
Five-Axle
Double
Six-Axle
Double
Seven-Axle
Double
Eight &Nine-Axle
Double
Triple
VM
T (i
n m
illio
ns)
BaseUniformity
Figure IV-17. Impacts of Uniformity Scenario on Multitrailer Combination VMT
IV-19
Scenario Vehicle-Miles-of-Travel (in millions)
Base Case 128,288
Uniformity Scenario 132,351
Percent Change 3.2%
Figure IV-18. Total VMT, Base Case Vs. UniformityScenario
North American TradeScenarios
There are two NorthAmerican Trade Scenarios:the first tests a 44,000-poundtridem axle and the secondtests a 51,000-pound tridemaxle. These axle weights aretested on two commonvehicles -- the four-axle SUTand the six-axle tractorsemitrailer -- and one vehiclethat is not widely used in theU.S.-- a twin 33-foot eight-axle double-trailercombination.
44,000-pound Tridem Axle
This scenario specifies themaximum legal GVWs for thefour-axle SUT at 64,000pounds, the six-axle tractorsemitrailer at 90,000 poundsand a twin 33-foot eight-axledouble-trailer combination at124,000 pounds.
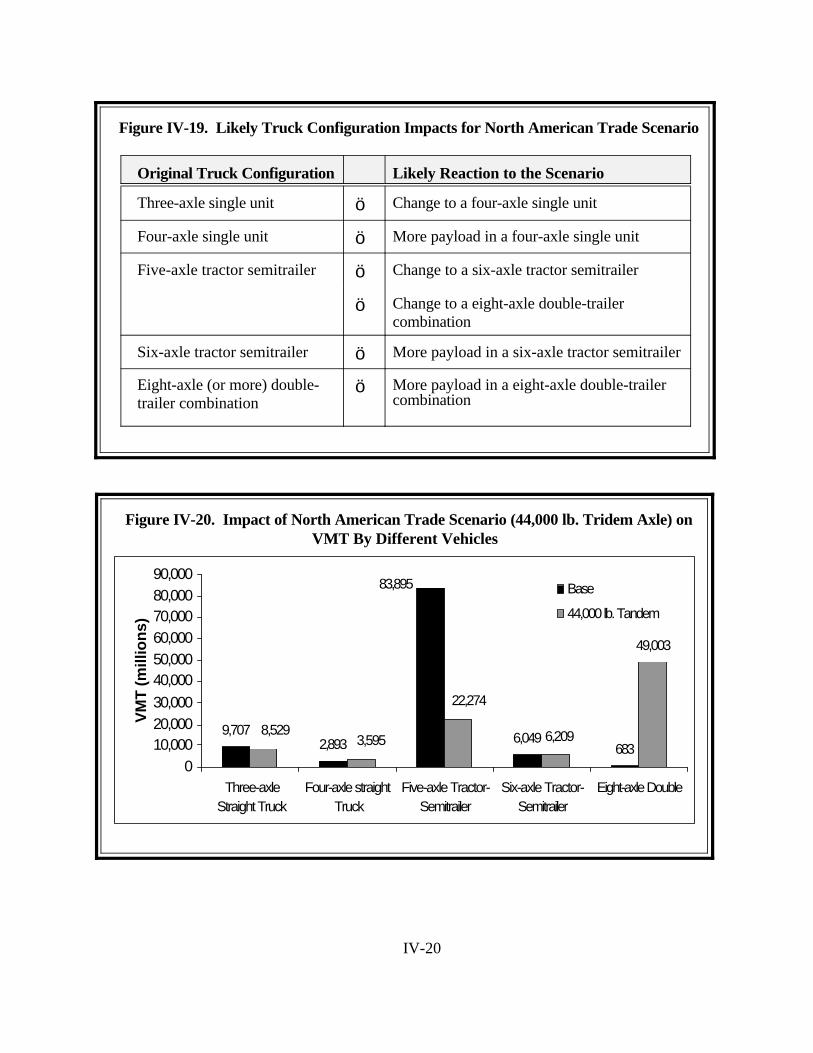
Figure IV-19 outlinesassumptions regarding howfreight currently traveling inthe affected configurationswould respond to the newtridem axle weight limit.
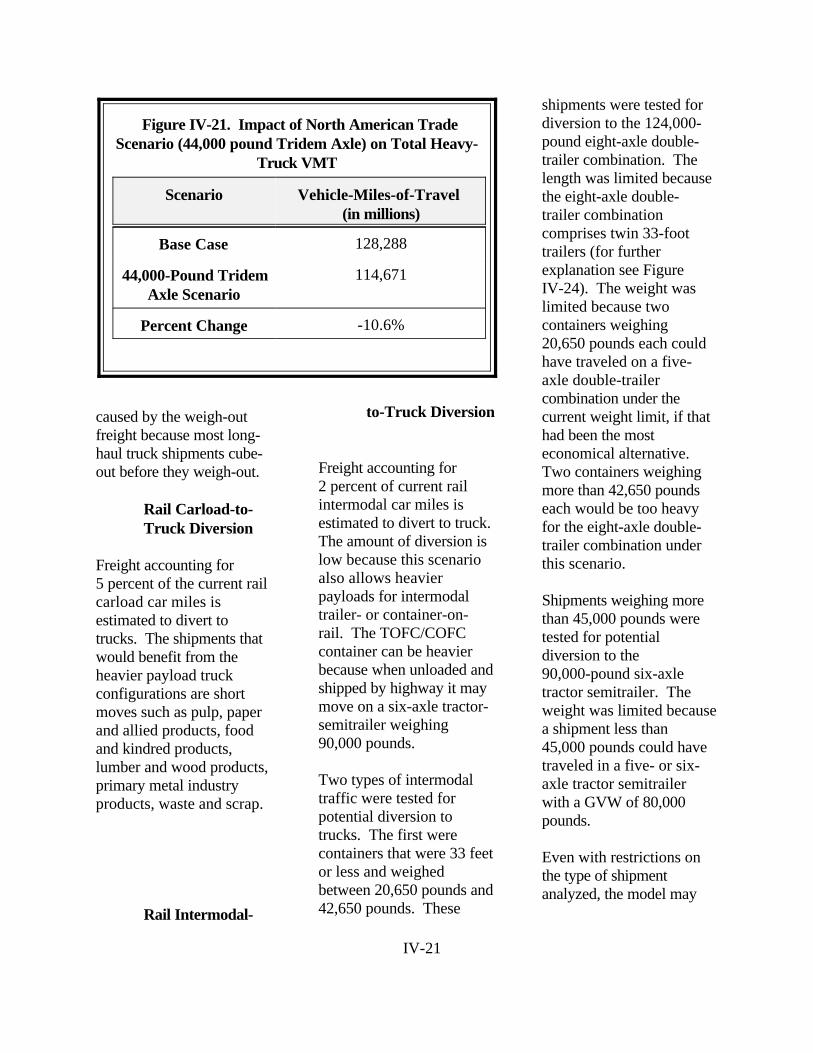
Figures IV-20 and IV-21summarize the analysisresults. Total heavycommercial truck VMT for theYear 2000 decreases by11 percent. The three-axleSUT VMT is reduced by12 percent, from
9,707 million miles to8,529 million miles. VMTfor the four-axle SUTincreases 24 percent, from2,893 million miles to3,595 million miles. Thefive-axle tractor semitrailerVMT is reduced by73 percent, decreasing from83,895 million miles to22,274 million miles. Thisrepresents the freighttraveling near or above the80,000-pound Federalweight limit or filling a53-foot trailer. That freightdiverts to: (1) the six-axletractor semitrailer whichexperiences a 3 percentincrease in VMT, from6,049 million miles to6,209 million miles; or (2) the eight-axle double-trailer combination whoseVMT increases from683 million miles to49,003 million miles.
Truck-to-TruckDiversion
All truck freight travelingnear or above the FederalTS&W limits is impacted bythis scenario. Weigh-outcommodities such as frozenfoods, logs, pulp, paper,building materials,chemicals, fuels, and rawmaterials divert to the higherpayload tridem axleconfigurations, and cube-outcommodities such asprocessed food, farmproduce, textiles, furnitureand manufactured goodsdivert to the higher cube twin33-foot eight-axle double-trailer combination. Thediversion caused by cube-outfreight moving to the highestcube truck is larger than thediversion
IV-20
Original Truck Configuration Likely Reaction to the Scenario
Three-axle single unit ö Change to a four-axle single unit
Four-axle single unit ö More payload in a four-axle single unit
Five-axle tractor semitrailer ö Change to a six-axle tractor semitrailer
ö Change to a eight-axle double-trailercombination
Six-axle tractor semitrailer ö More payload in a six-axle tractor semitrailer
Eight-axle (or more) double-trailer combination
ö More payload in a eight-axle double-trailercombination
Figure IV-19. Likely Truck Configuration Impacts for North American Trade Scenario
9,7072,893 683
49,003
83,895
6,0498,5293,595
22,274
6,209
010,00020,00030,00040,00050,00060,00070,00080,00090,000
Three-axleStraight Truck
Four-axle straightTruck
Five-axle Tractor-Semitrailer
Six-axle Tractor-Semitrailer
Eight-axle Double
VM
T (m
illio
ns)
Base
44,000 lb. Tandem
Figure IV-20. Impact of North American Trade Scenario (44,000 lb. Tridem Axle) onVMT By Different Vehicles
IV-21
Scenario Vehicle-Miles-of-Travel (in millions)
Base Case 128,288
44,000-Pound TridemAxle Scenario
114,671
Percent Change -10.6%
Figure IV-21. Impact of North American TradeScenario (44,000 pound Tridem Axle) on Total Heavy-
Truck VMT
caused by the weigh-outfreight because most long-haul truck shipments cube-out before they weigh-out.
Rail Carload-to-Truck Diversion
Freight accounting for5 percent of the current railcarload car miles isestimated to divert totrucks. The shipments thatwould benefit from theheavier payload truckconfigurations are shortmoves such as pulp, paperand allied products, foodand kindred products,lumber and wood products,primary metal industryproducts, waste and scrap.
Rail Intermodal-
to-Truck Diversion
Freight accounting for2 percent of current railintermodal car miles isestimated to divert to truck. The amount of diversion islow because this scenarioalso allows heavierpayloads for intermodaltrailer- or container-on-rail. The TOFC/COFCcontainer can be heavierbecause when unloaded andshipped by highway it maymove on a six-axle tractor-semitrailer weighing90,000 pounds.
Two types of intermodaltraffic were tested forpotential diversion totrucks. The first werecontainers that were 33 feetor less and weighedbetween 20,650 pounds and42,650 pounds. These
shipments were tested fordiversion to the 124,000-pound eight-axle double-trailer combination. Thelength was limited becausethe eight-axle double-trailer combinationcomprises twin 33-foottrailers (for furtherexplanation see FigureIV-24). The weight waslimited because twocontainers weighing20,650 pounds each couldhave traveled on a five-axle double-trailercombination under thecurrent weight limit, if thathad been the mosteconomical alternative. Two containers weighingmore than 42,650 poundseach would be too heavyfor the eight-axle double-trailer combination underthis scenario.
Shipments weighing morethan 45,000 pounds weretested for potentialdiversion to the90,000-pound six-axletractor semitrailer. Theweight was limited becausea shipment less than45,000 pounds could havetraveled in a five- or six-axle tractor semitrailerwith a GVW of 80,000pounds.
Even with restrictions onthe type of shipmentanalyzed, the model may
IV-22
Scenario Vehicle-Miles-of-Travel (in millions)
Base Case 128,288
51,000-Pound TridemAxle Scenario
114,632
Percent Change -10.6%
Figure IV-23. VMT for Base Case and North AmericanTrade Scenario (51,000 pound Tridem Axle)
9,707
83,895
683
46,619
2,8936,049
6,246
24,997
8,131 3,578
0
10,000
20,000
30,000
40,000
50,000
60,000
70,000
80,000
90,000
100,000
Three-AxleStraightTruck
Four-AxleStraightTruck
Five-AxleTractor-
Semitrailer
Six-AxleTractor-
Semitrailer
Eight-AxleDouble
VM
T (in
mill
ions
)
BASE51,000 lb - TRIDEM
Figure IV-22. Impacts of North American Trade Scenario(51,000 pound Tridem Axle) On VMT by Different Vehicles
over estimate diversion ofcontainers. Many of thesecontainers are moved inbulk by large shippingcompanies. The added costof tracking individualcontainers moving ontrucks would outweigh anysmall savings. TheWaybill data set does notspecify these groupedcontainer moves.
51,000-pound TridemAxle
This scenario specifies themaximum legal GVWs forthe four-axle SUT at71,000 pounds, the six-axletractor semitrailer at97,000 pounds and a twin33-foot eight-axle double-trailer combination at131,000 pounds.
The same types of shiftsamong truck configurationsshown in Figure IV-19 forthe 44,000-pound tridemaxle scenario would alsoapply to the 51,000 poundscenario.
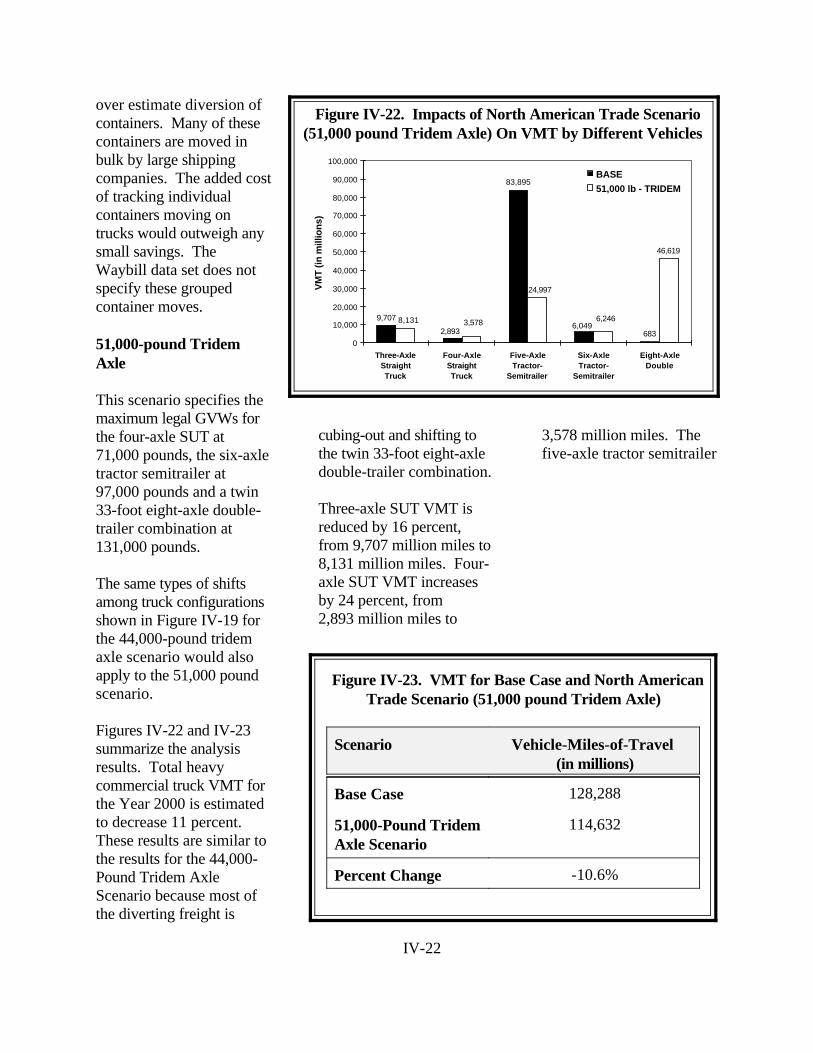
Figures IV-22 and IV-23summarize the analysisresults. Total heavycommercial truck VMT forthe Year 2000 is estimatedto decrease 11 percent. These results are similar tothe results for the 44,000-Pound Tridem AxleScenario because most ofthe diverting freight is
cubing-out and shifting tothe twin 33-foot eight-axledouble-trailer combination.
Three-axle SUT VMT isreduced by 16 percent,from 9,707 million miles to8,131 million miles. Four-axle SUT VMT increasesby 24 percent, from2,893 million miles to
3,578 million miles. Thefive-axle tractor semitrailer
IV-23
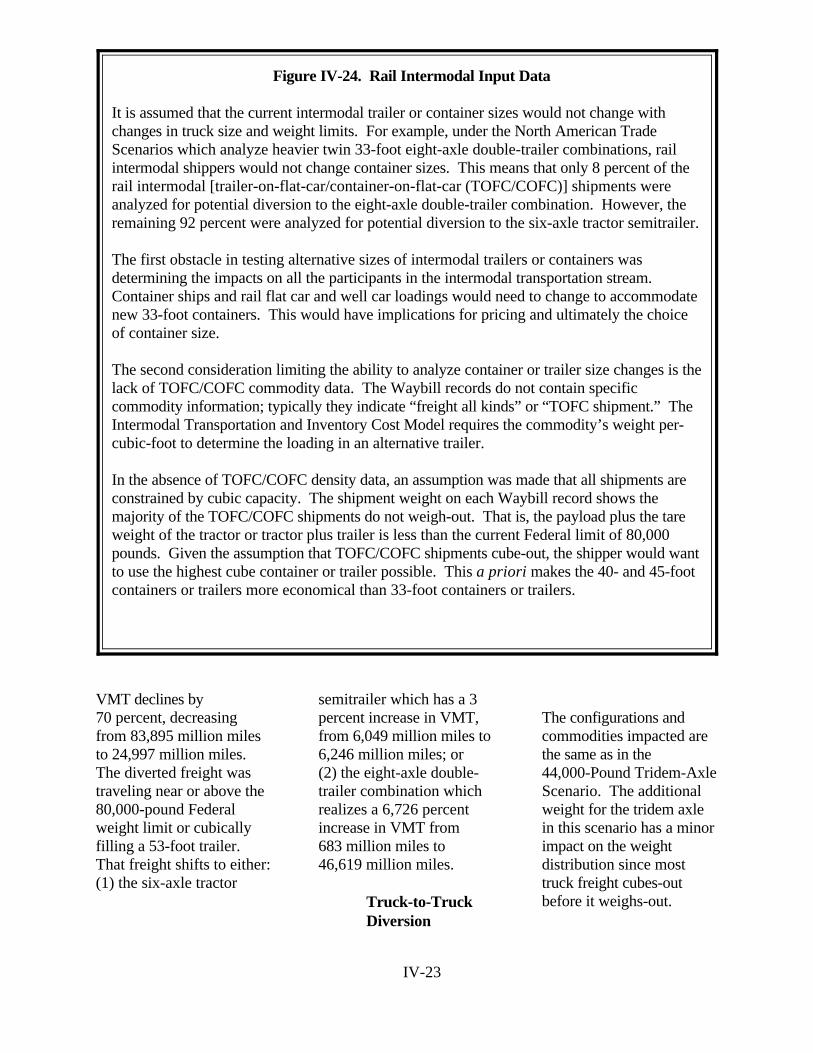
It is assumed that the current intermodal trailer or container sizes would not change withchanges in truck size and weight limits. For example, under the North American TradeScenarios which analyze heavier twin 33-foot eight-axle double-trailer combinations, railintermodal shippers would not change container sizes. This means that only 8 percent of therail intermodal [trailer-on-flat-car/container-on-flat-car (TOFC/COFC)] shipments wereanalyzed for potential diversion to the eight-axle double-trailer combination. However, theremaining 92 percent were analyzed for potential diversion to the six-axle tractor semitrailer.
The first obstacle in testing alternative sizes of intermodal trailers or containers wasdetermining the impacts on all the participants in the intermodal transportation stream. Container ships and rail flat car and well car loadings would need to change to accommodatenew 33-foot containers. This would have implications for pricing and ultimately the choiceof container size.
The second consideration limiting the ability to analyze container or trailer size changes is thelack of TOFC/COFC commodity data. The Waybill records do not contain specificcommodity information; typically they indicate “freight all kinds” or “TOFC shipment.” TheIntermodal Transportation and Inventory Cost Model requires the commodity’s weight per-cubic-foot to determine the loading in an alternative trailer.
In the absence of TOFC/COFC density data, an assumption was made that all shipments areconstrained by cubic capacity. The shipment weight on each Waybill record shows themajority of the TOFC/COFC shipments do not weigh-out. That is, the payload plus the tareweight of the tractor or tractor plus trailer is less than the current Federal limit of 80,000pounds. Given the assumption that TOFC/COFC shipments cube-out, the shipper would wantto use the highest cube container or trailer possible. This a priori makes the 40- and 45-footcontainers or trailers more economical than 33-foot containers or trailers.
Figure IV-24. Rail Intermodal Input Data
VMT declines by70 percent, decreasingfrom 83,895 million milesto 24,997 million miles.The diverted freight wastraveling near or above the80,000-pound Federalweight limit or cubicallyfilling a 53-foot trailer.That freight shifts to either:(1) the six-axle tractor
semitrailer which has a 3percent increase in VMT,from 6,049 million miles to6,246 million miles; or(2) the eight-axle double-trailer combination whichrealizes a 6,726 percentincrease in VMT from683 million miles to46,619 million miles.
Truck-to-TruckDiversion
The configurations andcommodities impacted arethe same as in the44,000-Pound Tridem-AxleScenario. The additionalweight for the tridem axlein this scenario has a minorimpact on the weightdistribution since mosttruck freight cubes-outbefore it weighs-out.
IV-24
Rail Carload-to-Truck Diversion
Freight accounting for7 percent of the current railcarload car miles diverts totrucks. The shipmentswhich would benefit fromthe truck configurationchanges are shorter movesof such commodities aspulp, paper and alliedproducts, food and kindredproducts, lumber and woodproducts, primary metalindustry products, andwaste and scrap.
Rail Intermodal-to-TruckDiversion
Under this scenario, freightaccounting for 3 percent ofcurrent rail intermodal carmiles diverts to truck. Theamount of diversion islimited because thisscenario also allows aheavier intermodal traileror container.
Two types of intermodaltraffic were tested forpotential diversion to truck. The first were containersthat were 33 feet or lessand weighed between20,650 pounds and 46,150pounds. These shipmentswere tested for diversion tothe eight-axle double-trailer combination at131,000 pounds. Thelength was limited becausethe eight-axle double-trailer combination iscomprised of twin 33-foot
trailers (for furtherexplanation see Figure IV-24). The weight waslimited because twocontainers weighing20,650 pounds each couldhave traveled on a five-axle double-trailercombination under thecurrent weight limit, if thathad been the mosteconomic alternative. Twocontainers weighing morethan 46,150 pounds eachwould be too heavy for theeight-axle double-trailercombination under thisscenario. The second typeof shipment examinedincluded those weighingmore than 45,000 pounds.This traffic was tested forpotential diversion to thesix-axle tractor semitrailerat 97,000 pounds. Theweight was limited becauseshipments less than45,000 pounds could havetraveled in a five- or six-axle tractor semitrailer at80,000 pounds.
Even with the restrictionson the type of shipmentanalyzed, the model mayoverestimate diversion ofcontainers. Many of thesecontainers move in bulk bylarge shipping companies. The added cost of trackingindividual containersmoving on trucks wouldoutweigh any smallsavings. The Waybill dataset does not specify thesegrouped container moves.
Longer Combination
Vehicles NationwideScenario
This scenario has a largeimpact on truck travelbecause the proposedconfigurations are bothlarger and heavier thantrucks in common usetoday. Also,interconnected, nationwideroad networks are assumedto be available for thescenario vehicles.
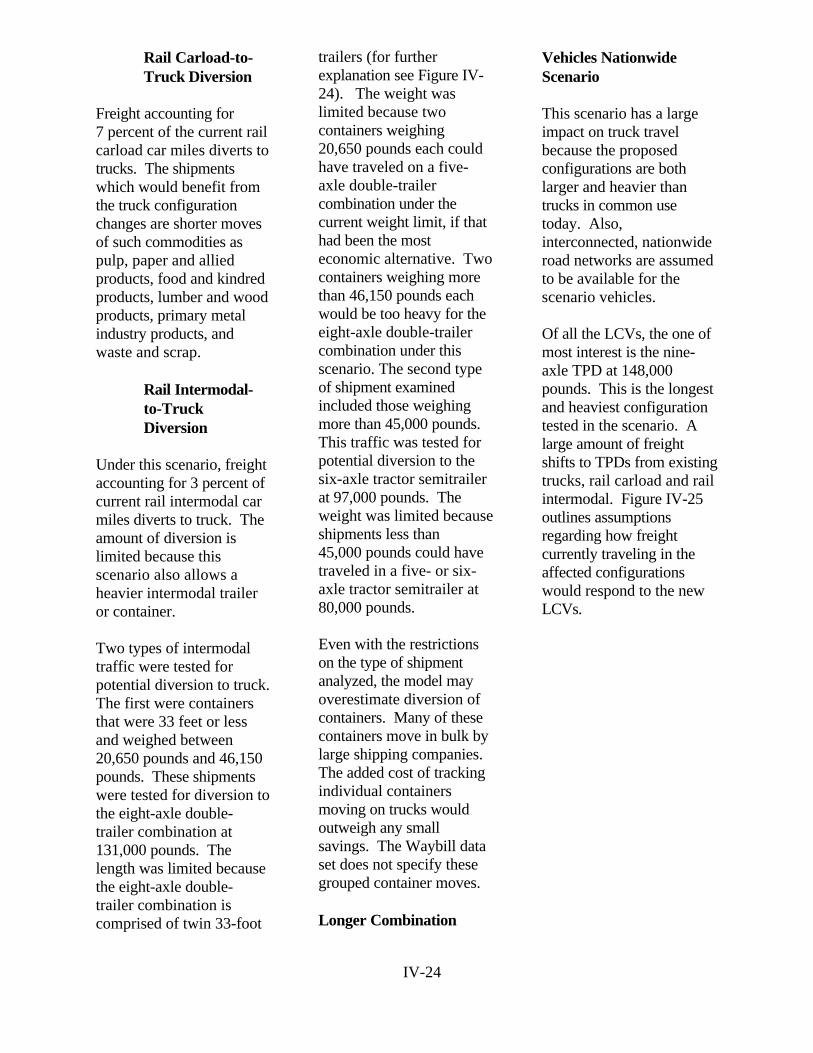
Of all the LCVs, the one ofmost interest is the nine-axle TPD at 148,000pounds. This is the longestand heaviest configurationtested in the scenario. Alarge amount of freightshifts to TPDs from existingtrucks, rail carload and railintermodal. Figure IV-25outlines assumptionsregarding how freightcurrently traveling in theaffected configurationswould respond to the newLCVs.
IV-25
Original Truck Configuration Likely Reaction to the Scenario
Five-axle tractor semitrailer ö
ö
ö
ö
Change to a seven-axle Rocky MountainDouble (RMD)
Change to a eight-axle double-trailercombination
Change to a nine-axle Turnpike Double(TPD)
Change to a triple-trailer combination
Five-axle double-trailercombination
ö Change to a triple-trailer combination
Six-axle double-trailercombination
ö Change to a triple-trailer combination
Seven-axle double-trailercombination
ö More payload in a seven-axle RMD
Eight-axle double-trailercombination
ö More payload in an eight-axle double-trailercombination
Nine-axle TPD ö More payload in a nine-axle TPD
Triple-trailer combination ö More payload in a triple-trailer combination
Figure IV-25. Likely Truck Configuration Impacts of the LCV Nationwide Scenario
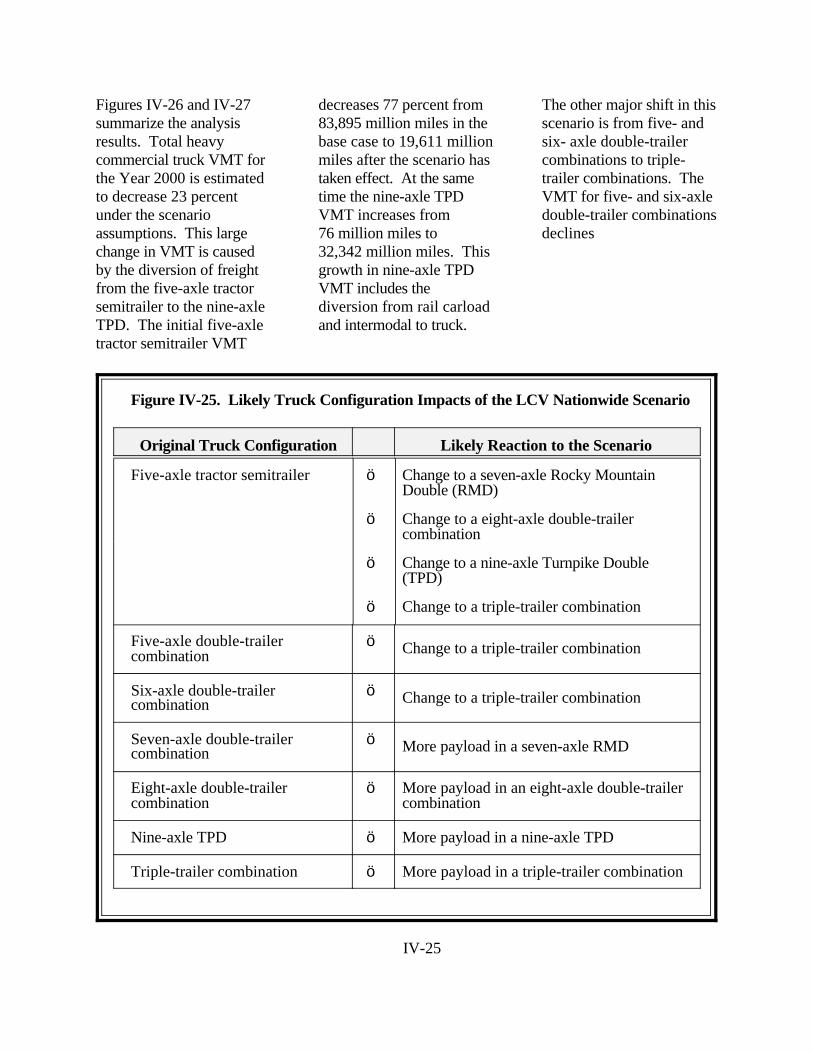
Figures IV-26 and IV-27summarize the analysisresults. Total heavycommercial truck VMT forthe Year 2000 is estimatedto decrease 23 percentunder the scenarioassumptions. This largechange in VMT is caused by the diversion of freightfrom the five-axle tractorsemitrailer to the nine-axleTPD. The initial five-axletractor semitrailer VMT
decreases 77 percent from 83,895 million miles in thebase case to 19,611 millionmiles after the scenario hastaken effect. At the sametime the nine-axle TPDVMT increases from76 million miles to32,342 million miles. Thisgrowth in nine-axle TPDVMT includes thediversion from rail carloadand intermodal to truck.
The other major shift in thisscenario is from five- andsix- axle double-trailer combinations to triple-trailer combinations. TheVMT for five- and six-axledouble-trailer combinationsdeclines
IV-26
83,895
5,26376 126942 133 567 2,079
5,992
683632731
32,342
19,611
0
10,000
20,000
30,000
40,000
50,000
60,000
70,000
80,000
90,000
100,000
Five-AxleTractor-
Semitrailer
Five-AxleDouble
Six-AxleDouble
Seven-AxleDouble
Eight-AxleDouble
Nine-AxleDouble
Triple
VM
T (in
mill
ions
)
BASELCV
Figure IV-26. Impacts of LCV Nationwide Scenario on VMT by Different Vehicles
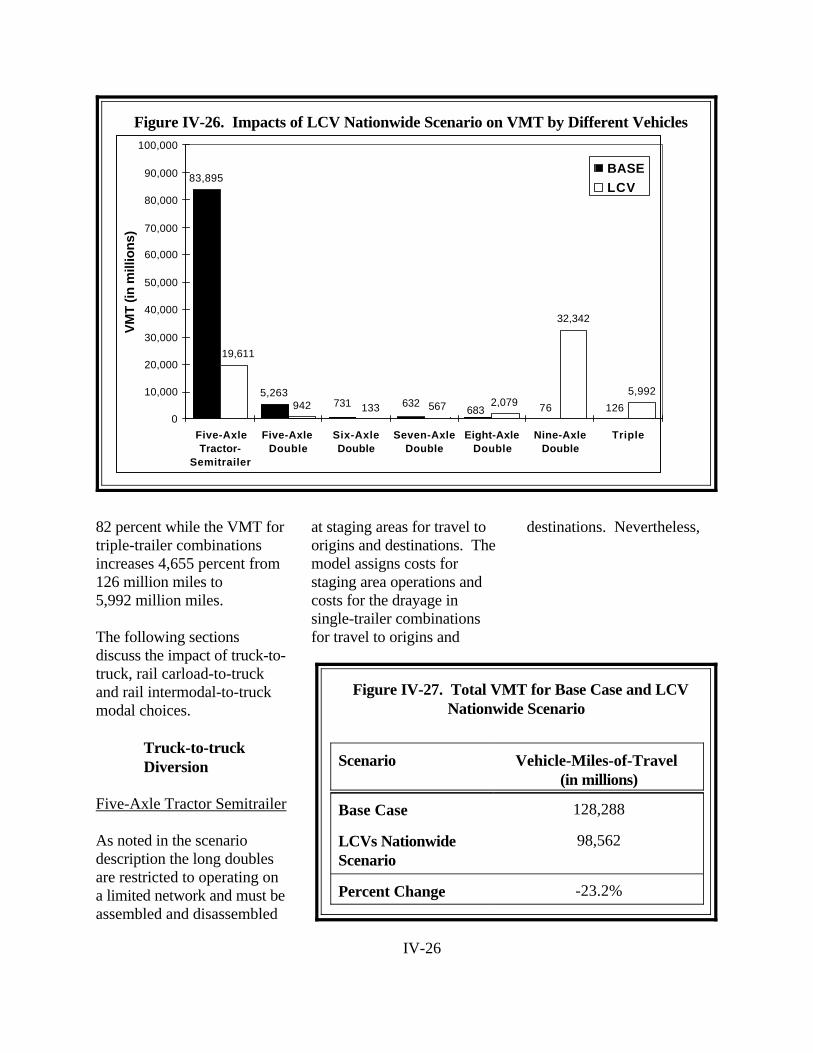
Scenario Vehicle-Miles-of-Travel (in millions)
Base Case 128,288
LCVs NationwideScenario
98,562
Percent Change -23.2%
Figure IV-27. Total VMT for Base Case and LCVNationwide Scenario
82 percent while the VMT fortriple-trailer combinationsincreases 4,655 percent from126 million miles to5,992 million miles.
The following sectionsdiscuss the impact of truck-to-truck, rail carload-to-truckand rail intermodal-to-truckmodal choices.
Truck-to-truckDiversion
Five-Axle Tractor Semitrailer
As noted in the scenariodescription the long doublesare restricted to operating ona limited network and must beassembled and disassembled
at staging areas for travel toorigins and destinations. Themodel assigns costs forstaging area operations andcosts for the drayage insingle-trailer combinationsfor travel to origins and
destinations. Nevertheless,
IV-27
a significant share of freightcurrently using a five-axletractor semitrailer ispredicted to divert to the nine-axle TPD under assumptionsin the scenario. Introducingthe nine-axle TPD isequivalent to reducing by halfthe number of tractors anddrivers needed to pull thesame number of 53-foottrailers. This translates intoan almost two-for-one savingsover the transportation cost ofa five-axle tractor semitrailer.
The analysis results show thatvirtually all freight currentlyusing fully loaded five-axletractor semitrailers wouldshift to the nine-axle TPD. Partial loads act as aconstraint on diversion. It isassumed that 15 percent of thecurrent five-axle tractorsemitrailers are partiallyloaded and would not divertto the nine-axle TPD. Asindicated earlier, the15 percent is based on a trendanalysis from previous trucksurveys.
If the allowable weights forthe TPD were lower or thenetwork upon which they canoperate were less extensive, asmaller share of shipmentsfrom five-axle tractor-semitrailers could be
expected to divert to the TPD. Also, additional research isrequired to assess whether thelogistics costs assumed in themodel for using TPDs reflectall shipper and carrierconsiderations.
Five-Axle and Six-AxleDouble-Trailer Combinations
These trucks are usedprimarily for moving LTLshipments. LTL shipments areconsolidated from smallshipments and usually havemultiple origins anddestinations. The LTLcarriers use a hub-and-spokesystem and short 28-footdoubles to combine shipmentsfor the long-haul portion ofthe trip and then use the single28-foot van or a specializedtwo-axle van for delivery.
These carriers would shifttheir long-haul traffic totriple-trailer combinations, inplace of current double-trailercombinations. The analysisassumes that all but15 percent of the VMT forfive- and six-axle double-trailer combinations wouldshift to triple-trailercombinations. The remaining15 percent is assumed to bepartial loads which wouldstill travel as double-trailer
and not triple-trailercombinations. As for theTPDs, if the assumed grossvehicle weights were loweror the network/accessprovisions less liberal, lessdiversion to triples would beexpected.
Seven-Axle Rocky MountainDouble
The results of the analysisindicate that little freightwould divert from the five-axle tractor semitrailer to theseven-axle RMD. Mostfreight diverts to the nine-axleTPD which can hold bothmore volume and weight. Theanalysis assumes that there isa shift to heavier payloadsamong the current fleet ofseven-axle RMDs.
Rail Carload-to-Truck Diversion
Freight accounting for9 percent of rail carload carmiles is estimated to divert totrucks, based on the scenarioassumptions. The shipmentswhich divert to the heavypayload truck configurationsare shorter moves of suchcommodities as pulp, paperand
IV-28
allied products, food andkindred products, lumberand wood products,primary metal industryproducts, waste and scrap. Even though the analysis ofthis scenario indicatessignificant increases fortruck weights, there is stilllimited diversion ofcarload traffic to trucks.
Rail Intermodal-to-TruckDiversion
Freight accounting for31 percent of current railintermodal car miles isestimated to divert to truckunder the LCVsNationwide Scenario. Only long-haul traffic overhigh density corridorswould continue to operateon rail. For example, highvolume lanes such as LosAngeles to Chicago wouldcontinue to operate butlower volume lanes such asAtlanta to New Yorkwould not operate. This isbecause the railroad’svariable cost-per-trailer orcontainer is much lower onthe high volume lanes.
The analysis of freightdiversion from railintermodal to truck wasaccomplished in two steps. The first group ofintermodal traffic tested fordiversion included
containers of 33 feet orless. Similar to the NorthAmerican Trade Scenarios,these were tested forpotential diversion to theeight-axle double-trailercombination assuming nochange in the freight loadedinto a container or trailer. The current payload mustbe more than that whichwould currently fit on afive-axle double-trailercombination, two 20,650-pound containers, but lessthan two containers each at42,650 pounds which ismore than the hypothesizedeight-axle double-trailercombination could carry.
All the remaining railintermodal Waybillobservations were testedfor diversion to the nine-axle TPD. Much of thecurrent rail intermodal costadvantage vanished whencompared to the TPD. As
was the case whencomparing the TPD to thefive-axle tractorsemitrailer, the two-to-onetransportation costadvantage of hauling twotrailers with one tractorcauses significant freightdiversion.
H.R. 551 Scenario
This scenario tests theimpact of limiting anyfurther increases in thenumber of trailers over 53
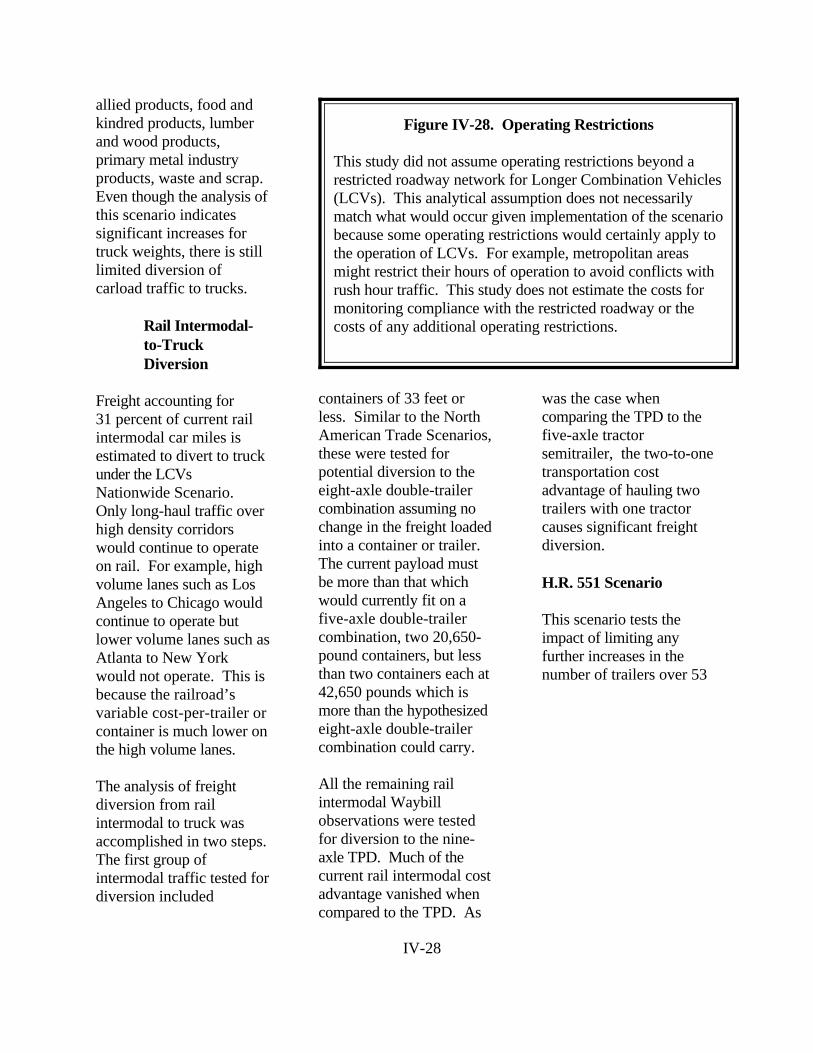
This study did not assume operating restrictions beyond arestricted roadway network for Longer Combination Vehicles(LCVs). This analytical assumption does not necessarilymatch what would occur given implementation of the scenariobecause some operating restrictions would certainly apply tothe operation of LCVs. For example, metropolitan areasmight restrict their hours of operation to avoid conflicts withrush hour traffic. This study does not estimate the costs formonitoring compliance with the restricted roadway or thecosts of any additional operating restrictions.
Figure IV-28. Operating Restrictions
IV-29
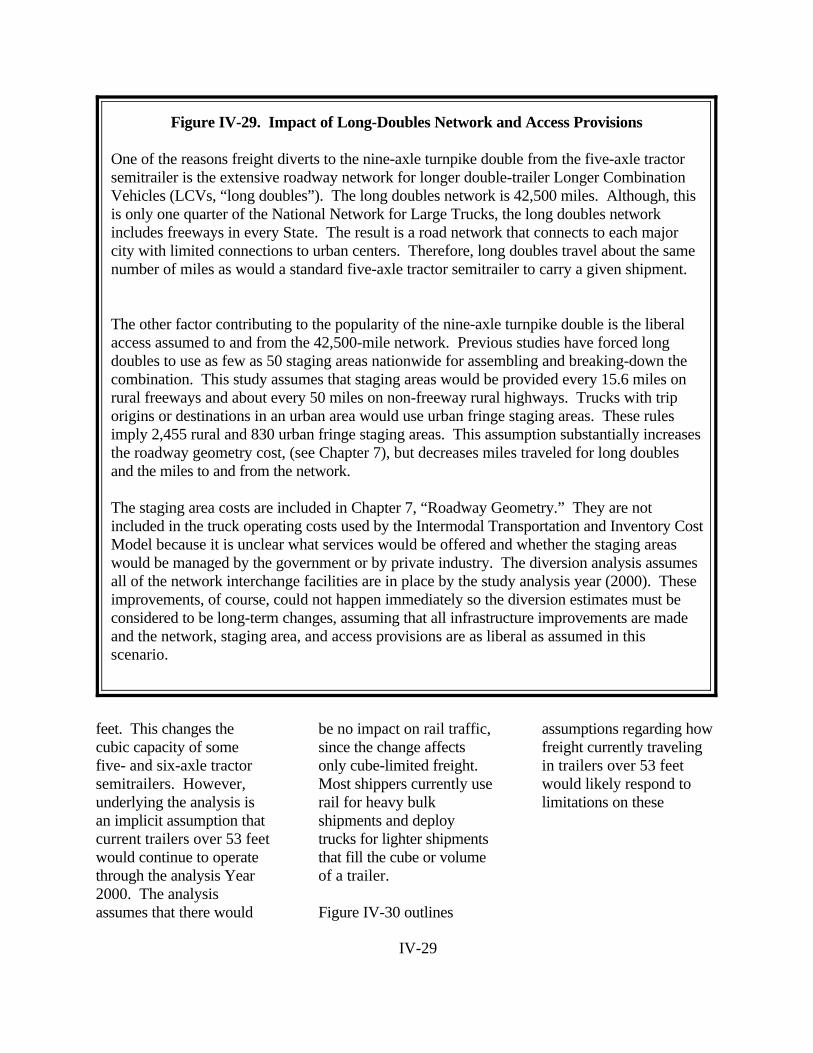
One of the reasons freight diverts to the nine-axle turnpike double from the five-axle tractorsemitrailer is the extensive roadway network for longer double-trailer Longer CombinationVehicles (LCVs, “long doubles”). The long doubles network is 42,500 miles. Although, thisis only one quarter of the National Network for Large Trucks, the long doubles networkincludes freeways in every State. The result is a road network that connects to each majorcity with limited connections to urban centers. Therefore, long doubles travel about the samenumber of miles as would a standard five-axle tractor semitrailer to carry a given shipment.
The other factor contributing to the popularity of the nine-axle turnpike double is the liberalaccess assumed to and from the 42,500-mile network. Previous studies have forced longdoubles to use as few as 50 staging areas nationwide for assembling and breaking-down thecombination. This study assumes that staging areas would be provided every 15.6 miles onrural freeways and about every 50 miles on non-freeway rural highways. Trucks with triporigins or destinations in an urban area would use urban fringe staging areas. These rulesimply 2,455 rural and 830 urban fringe staging areas. This assumption substantially increasesthe roadway geometry cost, (see Chapter 7), but decreases miles traveled for long doublesand the miles to and from the network.
The staging area costs are included in Chapter 7, “Roadway Geometry.” They are notincluded in the truck operating costs used by the Intermodal Transportation and Inventory CostModel because it is unclear what services would be offered and whether the staging areaswould be managed by the government or by private industry. The diversion analysis assumesall of the network interchange facilities are in place by the study analysis year (2000). Theseimprovements, of course, could not happen immediately so the diversion estimates must beconsidered to be long-term changes, assuming that all infrastructure improvements are madeand the network, staging area, and access provisions are as liberal as assumed in thisscenario.
Figure IV-29. Impact of Long-Doubles Network and Access Provisions
feet. This changes thecubic capacity of somefive- and six-axle tractorsemitrailers. However,underlying the analysis isan implicit assumption thatcurrent trailers over 53 feetwould continue to operatethrough the analysis Year2000. The analysisassumes that there would
be no impact on rail traffic,since the change affectsonly cube-limited freight. Most shippers currently userail for heavy bulkshipments and deploytrucks for lighter shipmentsthat fill the cube or volumeof a trailer.
Figure IV-30 outlines
assumptions regarding howfreight currently travelingin trailers over 53 feetwould likely respond tolimitations on these
IV-30
Original Truck Configuration Likely Reaction to the Scenario
Five-axle tractor semitrailer ö Less payload in a five-axle tractor semitrailer
Six-axle tractor semitrailer ö Less payload in a six-axle tractor semitrailer
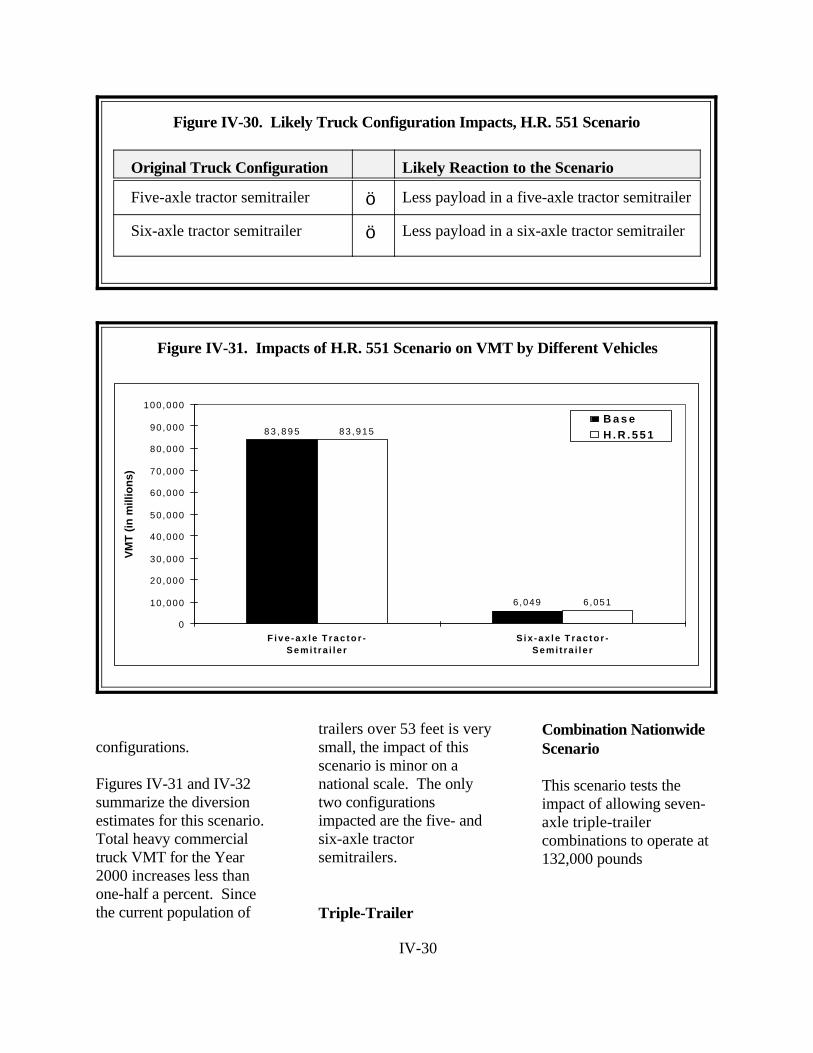
Figure IV-30. Likely Truck Configuration Impacts, H.R. 551 Scenario
8 3 , 8 9 5
6,049 6,051
83 ,915
0
10,000
20 ,000
30 ,000
40 ,000
50 ,000
60 ,000
70 ,000
80 ,000
90 ,000
100 ,000
F i v e - a x l e T r a c t o r -Semi t ra i l e r
S ix -ax le T rac to r -Semi t ra i l e r
VM
T (
in m
illio
ns)
B a s eH . R . 5 5 1
Figure IV-31. Impacts of H.R. 551 Scenario on VMT by Different Vehicles
configurations.
Figures IV-31 and IV-32summarize the diversionestimates for this scenario. Total heavy commercialtruck VMT for the Year2000 increases less thanone-half a percent. Sincethe current population of
trailers over 53 feet is verysmall, the impact of thisscenario is minor on anational scale. The onlytwo configurationsimpacted are the five- andsix-axle tractorsemitrailers.
Triple-Trailer
Combination NationwideScenario
This scenario tests theimpact of allowing seven-axle triple-trailercombinations to operate at132,000 pounds
IV-31
Although the Intermodal Transportation and Inventory Cost Model is used to analyze truck-to-truck and rail-to-truck diversion for the majority of the scenarios, it is not used to analyzethe H.R. 551 Scenario. This scenario requires a level of precision beyond the current truckdata set.
The H.R. 551 Scenario requires data on the population of trailers over 53 feet. This smallportion of the population, 1.16 percent of combination vehicle trailers (Truck Inventory andUse Survey, 1992), is not measured in the North American Truck Survey.
Figure IV-33. Use of the Intermodal Transportation and Inventory Cost Model toAnalyze the H.R. 551 Scenario
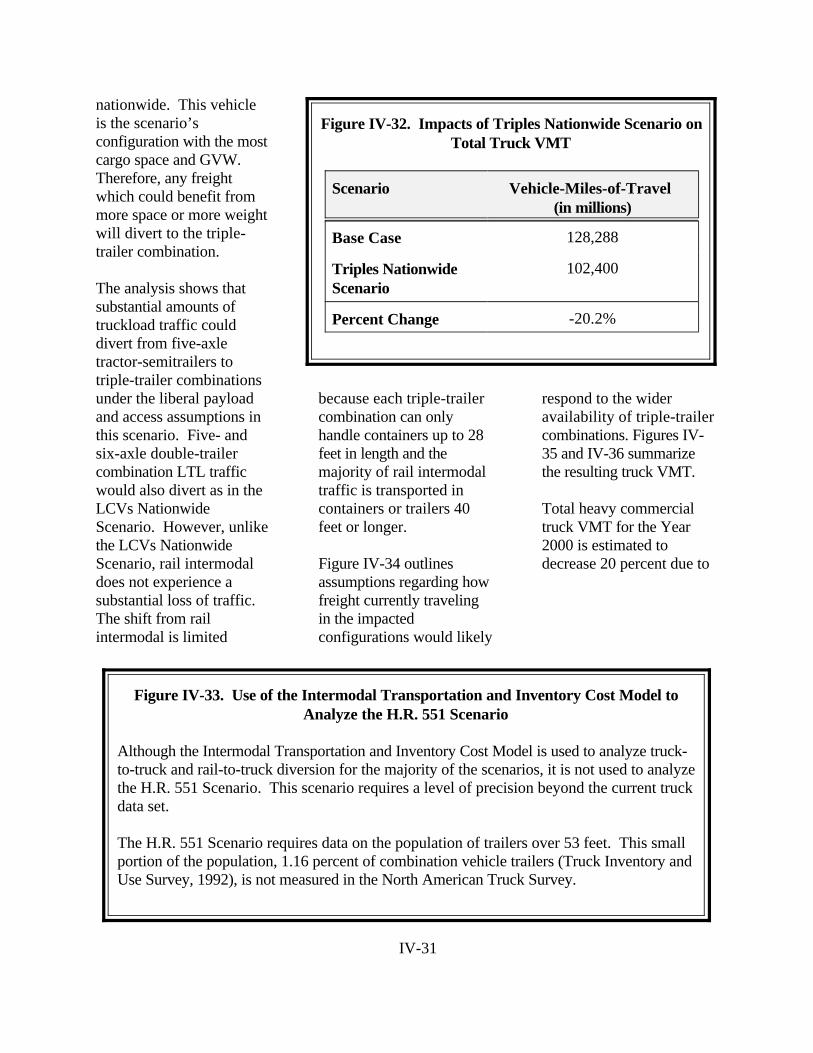
Scenario Vehicle-Miles-of-Travel (in millions)
Base Case 128,288
Triples NationwideScenario
102,400
Percent Change -20.2%
Figure IV-32. Impacts of Triples Nationwide Scenario onTotal Truck VMT
nationwide. This vehicleis the scenario’sconfiguration with the mostcargo space and GVW. Therefore, any freightwhich could benefit frommore space or more weightwill divert to the triple-trailer combination.
The analysis shows thatsubstantial amounts oftruckload traffic coulddivert from five-axletractor-semitrailers totriple-trailer combinationsunder the liberal payloadand access assumptions inthis scenario. Five- andsix-axle double-trailercombination LTL trafficwould also divert as in theLCVs NationwideScenario. However, unlikethe LCVs NationwideScenario, rail intermodaldoes not experience asubstantial loss of traffic. The shift from railintermodal is limited
because each triple-trailercombination can onlyhandle containers up to 28feet in length and themajority of rail intermodaltraffic is transported incontainers or trailers 40feet or longer.
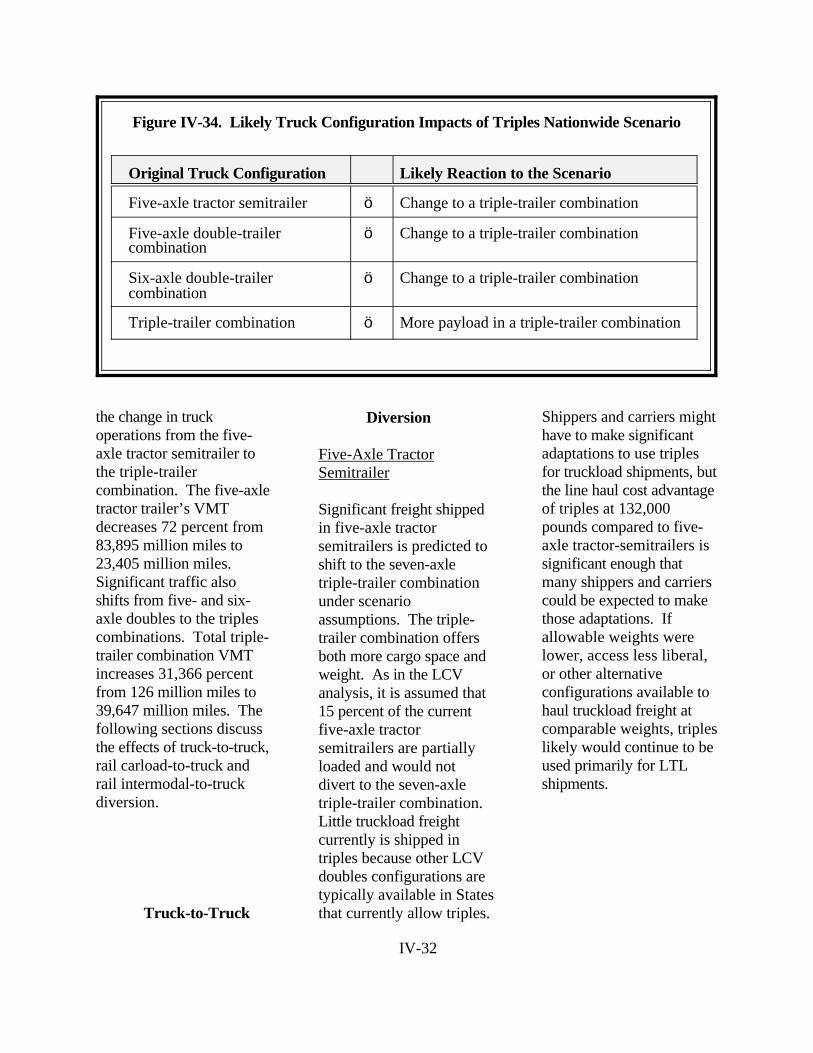
Figure IV-34 outlinesassumptions regarding howfreight currently travelingin the impactedconfigurations would likely
respond to the wideravailability of triple-trailercombinations. Figures IV-35 and IV-36 summarizethe resulting truck VMT.
Total heavy commercialtruck VMT for the Year2000 is estimated todecrease 20 percent due to
IV-32
Original Truck Configuration Likely Reaction to the Scenario
Five-axle tractor semitrailer ö Change to a triple-trailer combination
Five-axle double-trailercombination
ö Change to a triple-trailer combination
Six-axle double-trailercombination
ö Change to a triple-trailer combination
Triple-trailer combination ö More payload in a triple-trailer combination
Figure IV-34. Likely Truck Configuration Impacts of Triples Nationwide Scenario
the change in truckoperations from the five-axle tractor semitrailer tothe triple-trailercombination. The five-axletractor trailer’s VMTdecreases 72 percent from83,895 million miles to23,405 million miles. Significant traffic alsoshifts from five- and six-axle doubles to the triplescombinations. Total triple-trailer combination VMTincreases 31,366 percentfrom 126 million miles to39,647 million miles. Thefollowing sections discussthe effects of truck-to-truck,rail carload-to-truck andrail intermodal-to-truckdiversion.
Truck-to-Truck
Diversion
Five-Axle TractorSemitrailer
Significant freight shippedin five-axle tractorsemitrailers is predicted toshift to the seven-axletriple-trailer combinationunder scenarioassumptions. The triple-trailer combination offersboth more cargo space andweight. As in the LCVanalysis, it is assumed that15 percent of the currentfive-axle tractorsemitrailers are partiallyloaded and would notdivert to the seven-axletriple-trailer combination. Little truckload freightcurrently is shipped intriples because other LCVdoubles configurations aretypically available in Statesthat currently allow triples.
Shippers and carriers mighthave to make significantadaptations to use triplesfor truckload shipments, butthe line haul cost advantageof triples at 132,000pounds compared to five-axle tractor-semitrailers issignificant enough thatmany shippers and carrierscould be expected to makethose adaptations. Ifallowable weights werelower, access less liberal,or other alternativeconfigurations available tohaul truckload freight atcomparable weights, tripleslikely would continue to beused primarily for LTLshipments.

IV-33
83,895
5,263731 126942 133
39,647
23,405
0
10,000
20,000
30,000
40,000
50,000
60,000
70,000
80,000
90,000
100,000
Five-axle Tractor-Semitrailer
Five-axle Double Six-axle Double Triples
VM
T (
in m
illio
ns)
BaseTriples
Figure IV-35. Impact of Triples Nationwide Scenario on VMT by Different Vehicles
Five-and Six-axle Doubles
These trucks are usedprimarily for moving LTLshipments and all but15 percent of this long-haultraffic is predicted to shiftto triple-trailercombinations.
Rail Carload-to-Truck Diversion
Freight accounting for5 percent of rail carloadcar miles is predicted todivert to triples under thisscenario. The shipments
which divert to the triple-trailer combination areshort moves of suchcommodities as pulp,paper, and allied products,food and kindred products,lumber and wood products,primary metal industryproducts, and waste andscrap. Even though thescenario specifiessignificant increases fortruck weights, there islimited diversion ofcarload freight to trucks.
Rail Intermodal-to-Truck Diversion
Freight accounting for onepercent of current rail inter-modal car miles woulddivert to trucks. This issignificantly less than theLCVs Nation-wideScenario because thetriple-trailer combinationvehicle comprises short 28-foot trailers. OnlyTOFC/COFC shipmentscurrently traveling in 28-foot 28-foot trailers or
IV-34
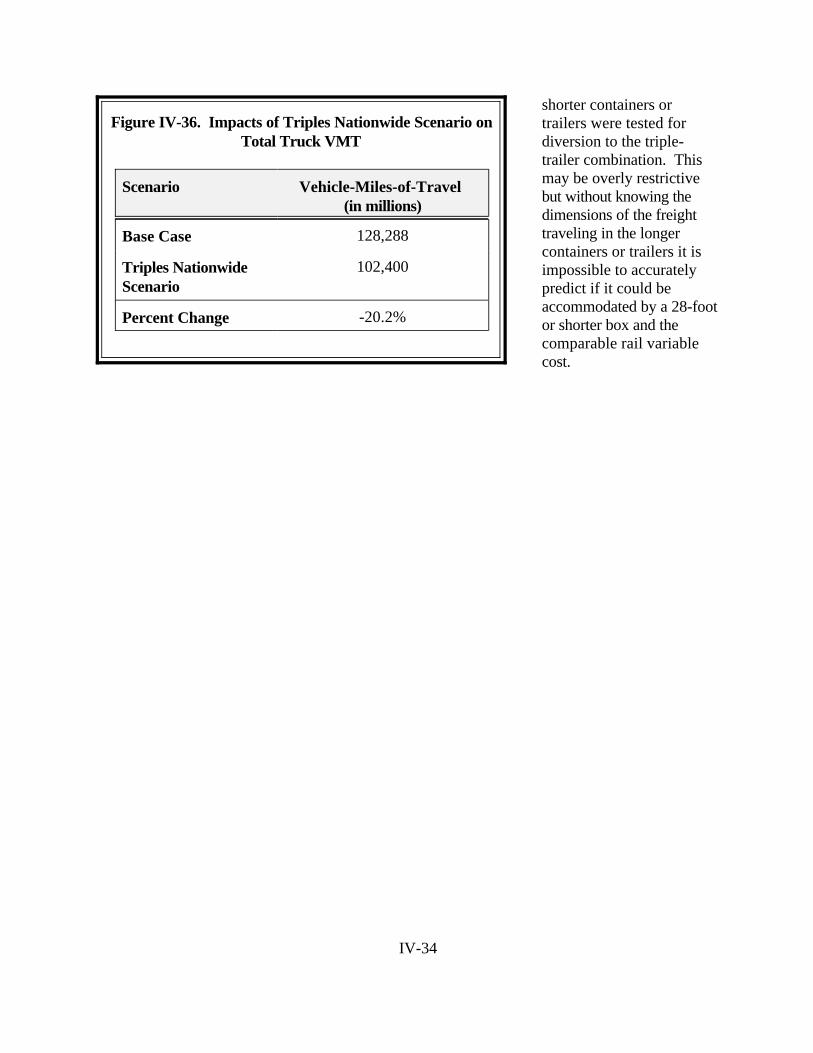
Scenario Vehicle-Miles-of-Travel (in millions)
Base Case 128,288
Triples NationwideScenario
102,400
Percent Change -20.2%
Figure IV-36. Impacts of Triples Nationwide Scenario onTotal Truck VMT
shorter containers ortrailers were tested fordiversion to the triple-trailer combination. Thismay be overly restrictivebut without knowing thedimensions of the freighttraveling in the longercontainers or trailers it isimpossible to accuratelypredict if it could beaccommodated by a 28-footor shorter box and thecomparable rail variablecost.