Embed Size (px)
Citation preview
Compressive and Bending Performance of Selectively Laser Melted AlSi10Mg Structures
D. Murphy, O. Fashanu, M. Spratt J. Newkirk and K. Chandrashekhara
Missouri University of Science and Technology, Rolla, MO 65409
H. Misak and D. Klenosky Spirit AeroSystems Wichita, KS 67278
Abstract Selective laser melting (SLM) is a widely used additive manufacturing technique that
effectively manufactures complex geometries such as cellular structures. However, challenges such as anisotropy and mechanical property variation are commonly found due to process parameters. In a bid to utilize this method for the commercial production of cellular structures, it is important to understand the behavior of a material under different loading conditions. In this work, the behavior of additively manufactured AlSi10Mg under compression, bending, and tension loads was investigated. Vertical and horizontal build directions are compared for each type of loading. Specimens were manufactured using the reduced build volume (RBV) chamber of the Renishaw AM 250 SLM machine.
1. INTRODUCTION Additive manufacturing as a whole began as a process to build small-scale prototypes, but
over the last decade has developed into a widely accepted and utilized method of manufacturing. Selective laser melting (SLM) is one of the many types of metal additive manufacturing that has been well developed in this time frame. Some benefits of SLM manufacturing include reduced cost, design flexibility, and improved mechanical property performance. However, large scale implementation of this process has yet to develop because of problems such as anisotropic behavior and inconsistent mechanical properties. Process parameters consist of material selection, laser parameters, and build parameters. All of these parameters have been shown in previous studies to affect microstructure, density, and mechanical properties of the SLM part. Understanding the effects of parameter changes is an important research topic to allow for the continued success of the SLM manufacturing technique [1-8].
Aboulkhair et al [1] focused their study on reducing the porosity of parts by optimizing the laser parameters. The study claims to have produced dense parts with relative densities of 99.8%. Brandl et al [2] varied the process parameters of build orientation, build plate temperature, and post process heat treatment to investigate their effects on high cycle fatigue, microstructure, and fracture type. It was found that the post process heat treatment had the most significant effect on each of these outputs. In another study done by Aboulkhair et al [3], the focus was to determine the effect on microstructure, tensile strength, and microhardness after a T6 heat treatment. While some mechanical properties increased (microhardness), others decreased (tensile strength). The SLM printed AlSi10Mg out performed a comparable cast aluminum alloy. Biff et al [4] researched
2177
Solid Freeform Fabrication 2019: Proceedings of the 30th Annual InternationalSolid Freeform Fabrication Symposium – An Additive Manufacturing Conference
the effect process parameters had on the behavior of the Si inside the fully dense AlSi10Mg part. It was found that the energy density of the laser was the most impactful process parameter to the development of Mg2Si precipitation. Other mechanical properties like creep have been investigated by Read et al [5] after a laser parameter optimization was conducted. It again was found that the SLM manufactured aluminum parts out-performed the conventionally manufactured cast alloys of similar composition. A study looking at the anisotropic behavior of SLM printed 304L stainless steel due to build parameters was done by Fashanu et al [6].
As mentioned, one of the biggest advantages to using the SLM process is the ability to fabricate complex shapes and geometries. Of these complex shapes, periodic lattice structures are of major interest for their ability to increase the strength to weight ratio of a part and that is the future goal of this current work. Maskery et al [7] fabricated and tested AlSi10Mg truss structure samples with uniform and graded density for their mechanical properties. Samples were also tested for heat treatment effects and found that heat treating increases the strength of the samples. Dong et al [8] studied lattice structures as well but wanted to see how the build orientation would affect the geometric accuracy, microstructure, and mechanical properties of the as built complex geometric parts. It was determined the geometric accuracy decreased as the strut angle went from increased from 35.5º to 90º (vertically built). On the other hand, the tensile properties were seen to increase as the angle increased since the parts had less porosity when built vertically compared to being built at an angle. In the current study, the mechanical properties of AlSi10Mg coupons manufactured with the SLM process were investigated. Solid coupons with varied build orientation were tested under compression, bending, and tension loading to give an idea of what behaviors are to be expected from geometrically complex parts. The coupons’ yield strengths were evaluated from the developed stress-strain curves and compared with previous studies.
2. EXPERIMENTAL METHODOLOGY The experimental portion of this study consists of three experiments: first, solid sample
compression tests with varied build orientation; second, solid sample 3-point bend testing with varied build orientation; third, mini-tensile testing was conducted for comparison to previous studies. The 0.2% offset yield strength is reported for each test, as well as the nonlinear stress-strain curves.
2.1 Fabrication of AlSi10Mg specimens with the SLM process
For the three experiments, the parts were fabricated using the RBV chamber in the Renishaw AM 250 machine at Missouri University of Science and Technology. The following describes the powder used, the SLM fabrication process, and the density measurements of the fabricated parts:
1. Powder characterization: AlSi10Mg is the powder used for the SLM process in this study. The size distribution of the powder particles was determined and summarized in Figure 1. The size distribution was determined by automatically counting over 8000 particles using an ASPEX scanning electron microscope (SEM) system located at Missouri S&T. It can be noted that about
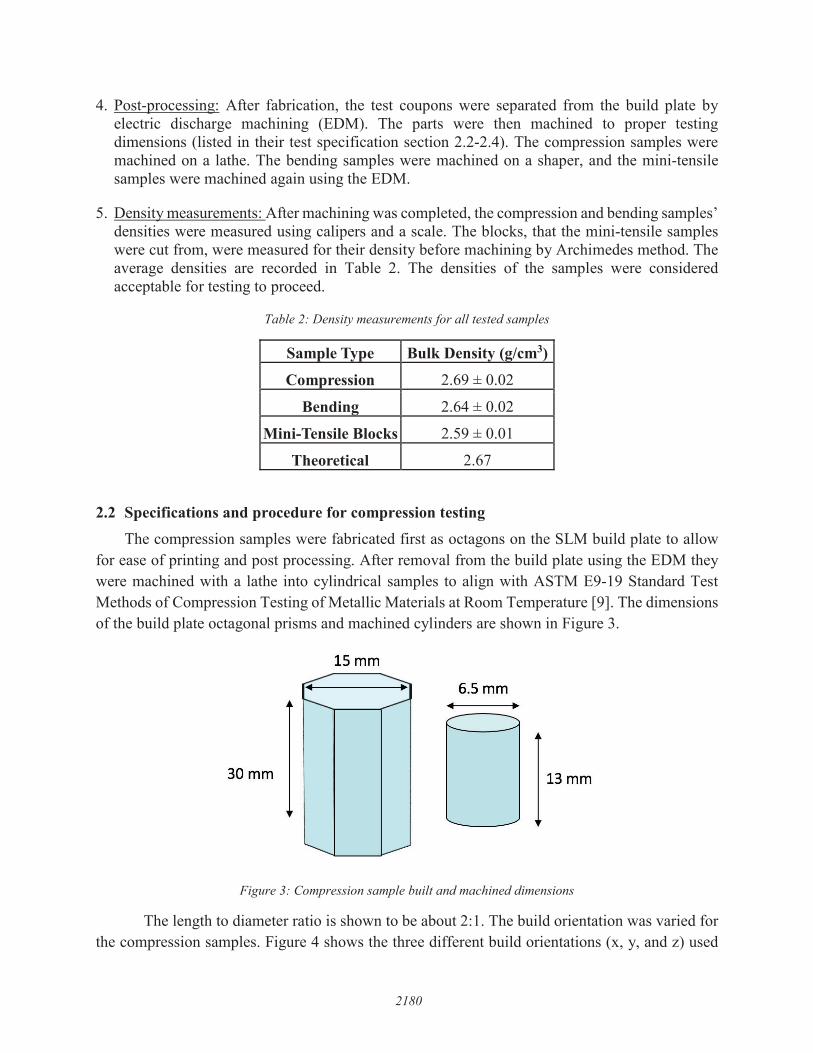
This shows that the mass majority of the powder particles fall in the range of 15 - is consistent with powders used in previous literature. Figure 2 is an SEM image of the powder
2178
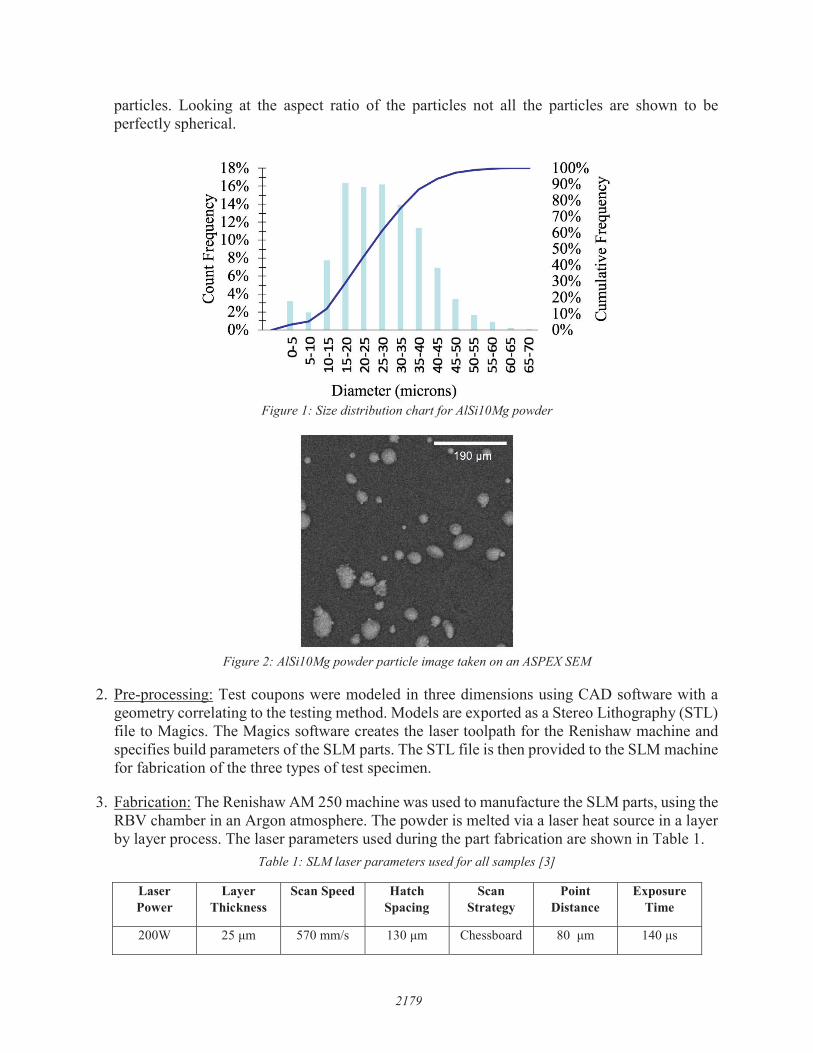
particles. Looking at the aspect ratio of the particles not all the particles are shown to be perfectly spherical.
Figure 1: Size distribution chart for AlSi10Mg powder
Figure 2: AlSi10Mg powder particle image taken on an ASPEX SEM
2. Pre-processing: Test coupons were modeled in three dimensions using CAD software with ageometry correlating to the testing method. Models are exported as a Stereo Lithography (STL)file to Magics. The Magics software creates the laser toolpath for the Renishaw machine andspecifies build parameters of the SLM parts. The STL file is then provided to the SLM machinefor fabrication of the three types of test specimen.
3. Fabrication: The Renishaw AM 250 machine was used to manufacture the SLM parts, using theRBV chamber in an Argon atmosphere. The powder is melted via a laser heat source in a layerby layer process. The laser parameters used during the part fabrication are shown in Table 1.
Table 1: SLM laser parameters used for all samples [3]
Laser Power
Layer Thickness
Scan Speed Hatch Spacing
Scan Strategy
Point Distance
Exposure Time
200W 570 mm/s Chessboard
2179
18% 100% 16% 90% >,
(.)
G" 14% 80% i::::: Q)
&J 12% 70% g. Q) ;:::l 60% 1--<
8'10% 50%
µ.. 1--<
8% Q) µ..
40% > ..... ..... § 6% 30% ~ -0 4%
;:::l
u 20% 8 2% 10% 0% 0%
L/'l 0 Ll'l O Ll'l O Ll'l@ Ll'l 0 L/'l 0 L/'l 0 0 .-i .-iNNl'l'll'l'l q"L/'l L/'l I.O I.O " I I I I I I I I I I I I I
L/'l 0 Ll'l O Ll'l O Ll'l@ Ll'l 0 L/'l @ L/'l .-i.-iNNl'l'll'l'l s::t" L/'l L/'l I.O
Diameter (microns)
4. Post-processing: After fabrication, the test coupons were separated from the build plate byelectric discharge machining (EDM). The parts were then machined to proper testingdimensions (listed in their test specification section 2.2-2.4). The compression samples weremachined on a lathe. The bending samples were machined on a shaper, and the mini-tensilesamples were machined again using the EDM.
5. Density measurements: After machining was completed, the compression and bending samples’densities were measured using calipers and a scale. The blocks, that the mini-tensile sampleswere cut from, were measured for their density before machining by Archimedes method. Theaverage densities are recorded in Table 2. The densities of the samples were consideredacceptable for testing to proceed.
Table 2: Density measurements for all tested samples
Sample Type Bulk Density (g/cm3)
Compression 2.69 ± 0.02
Bending 2.64 ± 0.02
Mini-Tensile Blocks 2.59 ± 0.01
Theoretical 2.67
2.2 Specifications and procedure for compression testing
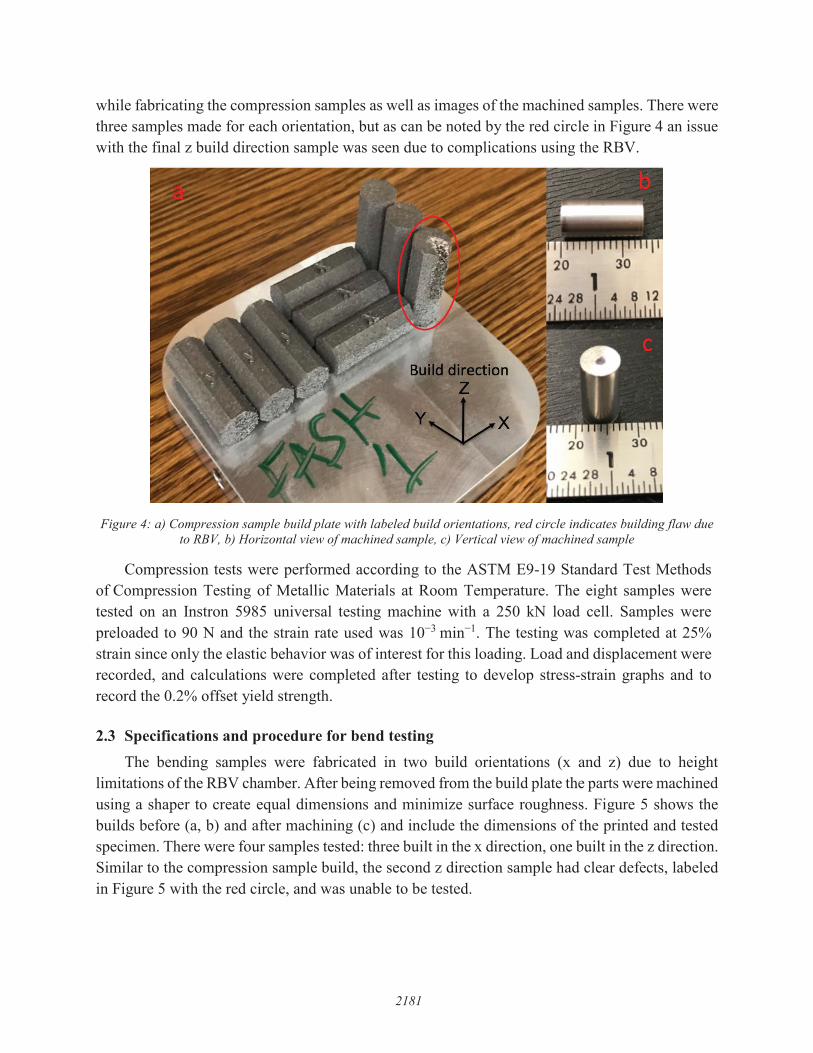
The compression samples were fabricated first as octagons on the SLM build plate to allow for ease of printing and post processing. After removal from the build plate using the EDM they were machined with a lathe into cylindrical samples to align with ASTM E9-19 Standard Test Methods of Compression Testing of Metallic Materials at Room Temperature [9]. The dimensions of the build plate octagonal prisms and machined cylinders are shown in Figure 3.
Figure 3: Compression sample built and machined dimensions
The length to diameter ratio is shown to be about 2:1. The build orientation was varied for the compression samples. Figure 4 shows the three different build orientations (x, y, and z) used
2180
15mm
6.5mm
30mm 13mm
while fabricating the compression samples as well as images of the machined samples. There were three samples made for each orientation, but as can be noted by the red circle in Figure 4 an issue with the final z build direction sample was seen due to complications using the RBV.
Figure 4: a) Compression sample build plate with labeled build orientations, red circle indicates building flaw due
to RBV, b) Horizontal view of machined sample, c) Vertical view of machined sample
Compression tests were performed according to the ASTM E9-19 Standard Test Methods of Compression Testing of Metallic Materials at Room Temperature. The eight samples were tested on an Instron 5985 universal testing machine with a 250 kN load cell. Samples were preloaded to 90 N and the strain rate used was 10 3 min 1. The testing was completed at 25% strain since only the elastic behavior was of interest for this loading. Load and displacement were recorded, and calculations were completed after testing to develop stress-strain graphs and to record the 0.2% offset yield strength.
2.3 Specifications and procedure for bend testing The bending samples were fabricated in two build orientations (x and z) due to height
limitations of the RBV chamber. After being removed from the build plate the parts were machined using a shaper to create equal dimensions and minimize surface roughness. Figure 5 shows the builds before (a, b) and after machining (c) and include the dimensions of the printed and tested specimen. There were four samples tested: three built in the x direction, one built in the z direction. Similar to the compression sample build, the second z direction sample had clear defects, labeled in Figure 5 with the red circle, and was unable to be tested.
2181
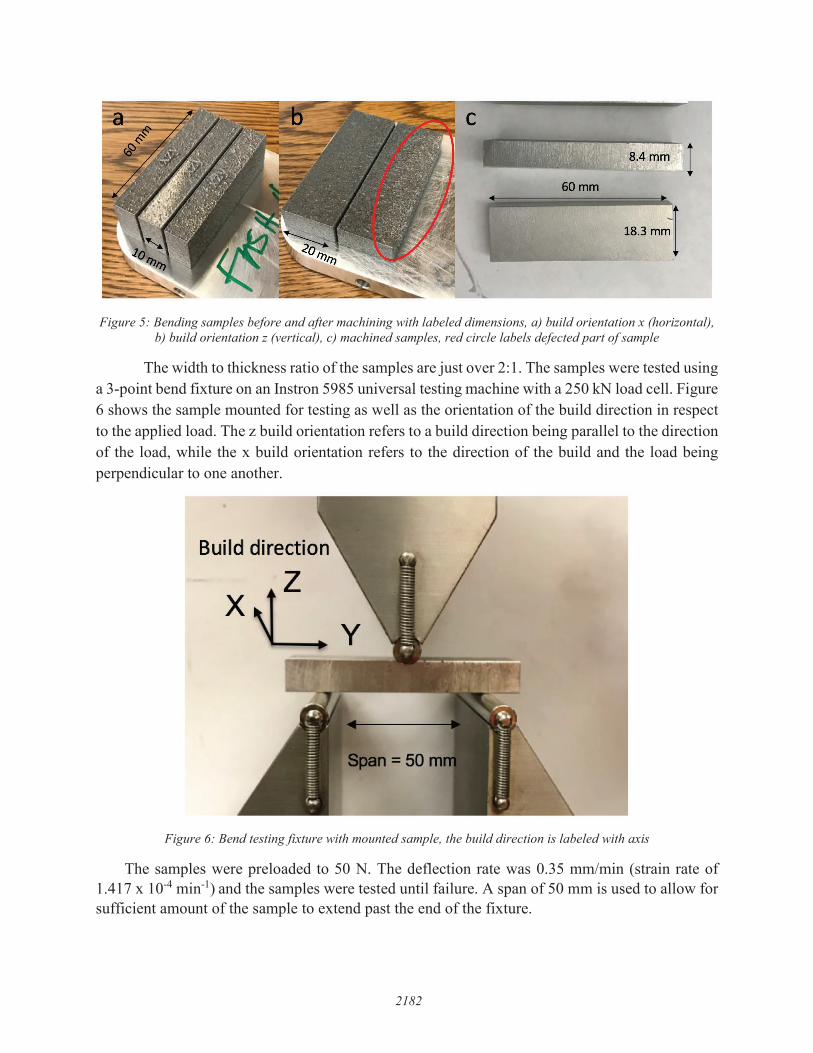
Figure 5: Bending samples before and after machining with labeled dimensions, a) build orientation x (horizontal), b) build orientation z (vertical), c) machined samples, red circle labels defected part of sample
The width to thickness ratio of the samples are just over 2:1. The samples were tested using a 3-point bend fixture on an Instron 5985 universal testing machine with a 250 kN load cell. Figure 6 shows the sample mounted for testing as well as the orientation of the build direction in respect to the applied load. The z build orientation refers to a build direction being parallel to the direction of the load, while the x build orientation refers to the direction of the build and the load being perpendicular to one another.
Figure 6: Bend testing fixture with mounted sample, the build direction is labeled with axis
The samples were preloaded to 50 N. The deflection rate was 0.35 mm/min (strain rate of 1.417 x 10⁻⁴ min-1) and the samples were tested until failure. A span of 50 mm is used to allow for sufficient amount of the sample to extend past the end of the fixture.
2182
8.4 mm I 60mm
18.3 mm
Build direction
z X
2.4 Specifications and procedure for mini-tensile testing
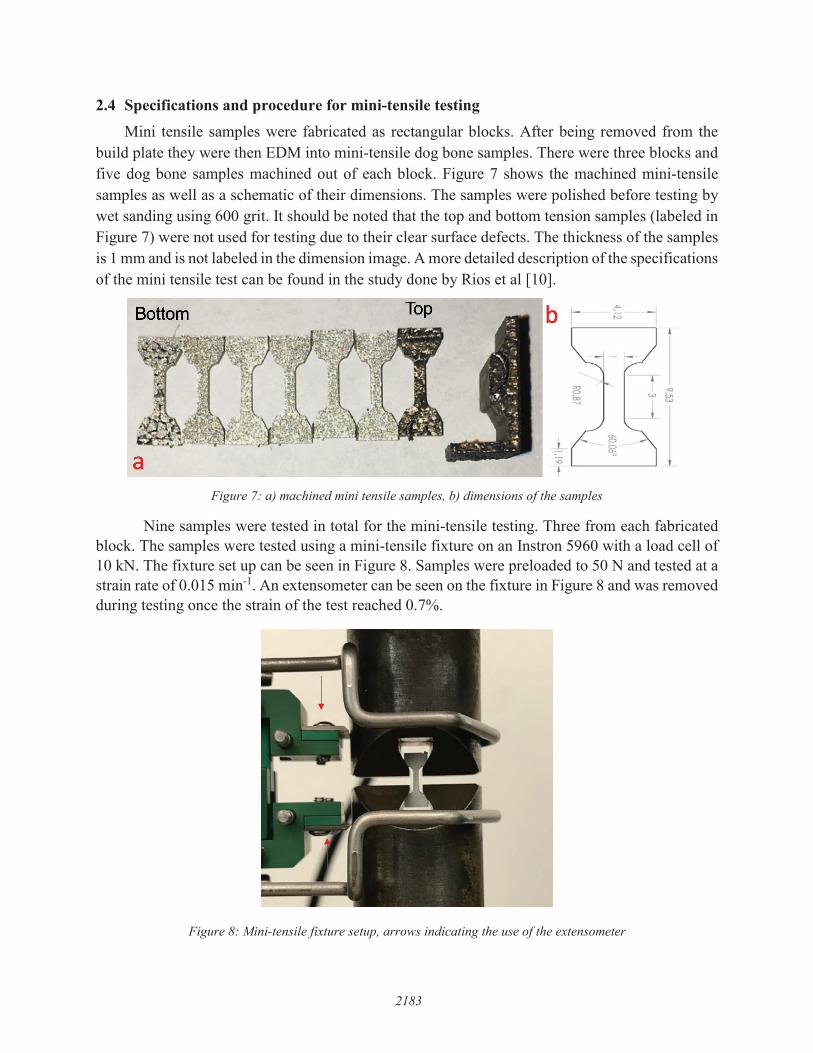
Mini tensile samples were fabricated as rectangular blocks. After being removed from the build plate they were then EDM into mini-tensile dog bone samples. There were three blocks and five dog bone samples machined out of each block. Figure 7 shows the machined mini-tensile samples as well as a schematic of their dimensions. The samples were polished before testing by wet sanding using 600 grit. It should be noted that the top and bottom tension samples (labeled inFigure 7) were not used for testing due to their clear surface defects. The thickness of the samples is 1 mm and is not labeled in the dimension image. A more detailed description of the specifications of the mini tensile test can be found in the study done by Rios et al [10].
Figure 7: a) machined mini tensile samples, b) dimensions of the samples
Nine samples were tested in total for the mini-tensile testing. Three from each fabricated block. The samples were tested using a mini-tensile fixture on an Instron 5960 with a load cell of 10 kN. The fixture set up can be seen in Figure 8. Samples were preloaded to 50 N and tested at a strain rate of 0.015 min-1. An extensometer can be seen on the fixture in Figure 8 and was removed during testing once the strain of the test reached 0.7%.
Figure 8: Mini-tensile fixture setup, arrows indicating the use of the extensometer
2183
Bottom Top
a
b
.!. ::0 l '
:-0 c.., t'.l
3. RESULTS AND DISCUSSION 3.1 Compression testing results
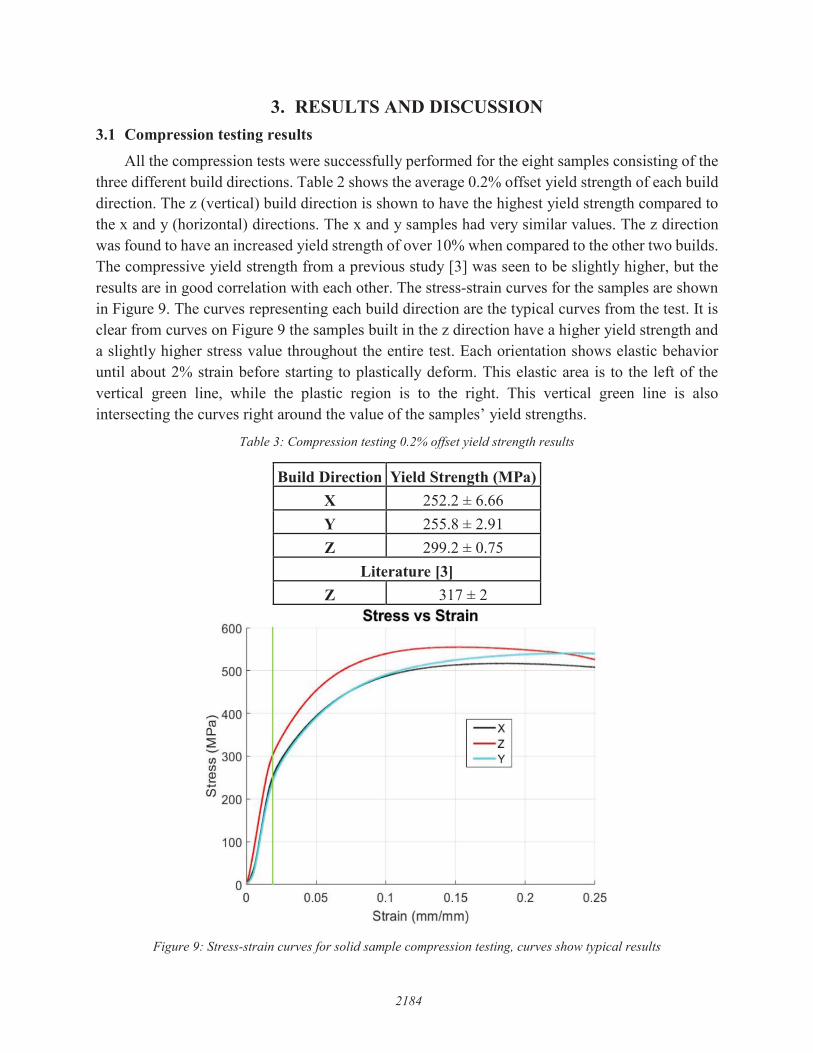
All the compression tests were successfully performed for the eight samples consisting of the three different build directions. Table 2 shows the average 0.2% offset yield strength of each build direction. The z (vertical) build direction is shown to have the highest yield strength compared to the x and y (horizontal) directions. The x and y samples had very similar values. The z direction was found to have an increased yield strength of over 10% when compared to the other two builds. The compressive yield strength from a previous study [3] was seen to be slightly higher, but the results are in good correlation with each other. The stress-strain curves for the samples are shown in Figure 9. The curves representing each build direction are the typical curves from the test. It is clear from curves on Figure 9 the samples built in the z direction have a higher yield strength and a slightly higher stress value throughout the entire test. Each orientation shows elastic behavior until about 2% strain before starting to plastically deform. This elastic area is to the left of the vertical green line, while the plastic region is to the right. This vertical green line is also intersecting the curves right around the value of the samples’ yield strengths.
Table 3: Compression testing 0.2% offset yield strength results
Build Direction Yield Strength (MPa) X 252.2 ± 6.66 Y 255.8 ± 2.91 Z 299.2 ± 0.75
Literature [3] Z 317 ± 2
Figure 9: Stress-strain curves for solid sample compression testing, curves show typical results
2184
600
500
..--..400 C'O a.. ~ 7:300 (/)
~
en 200
100
Stress vs Strain
o~~-~---~---~---~---~ 0 0.05 0.1 0.15 0.2 0.25
Strain (mm/mm)
3.2 Bend testing results
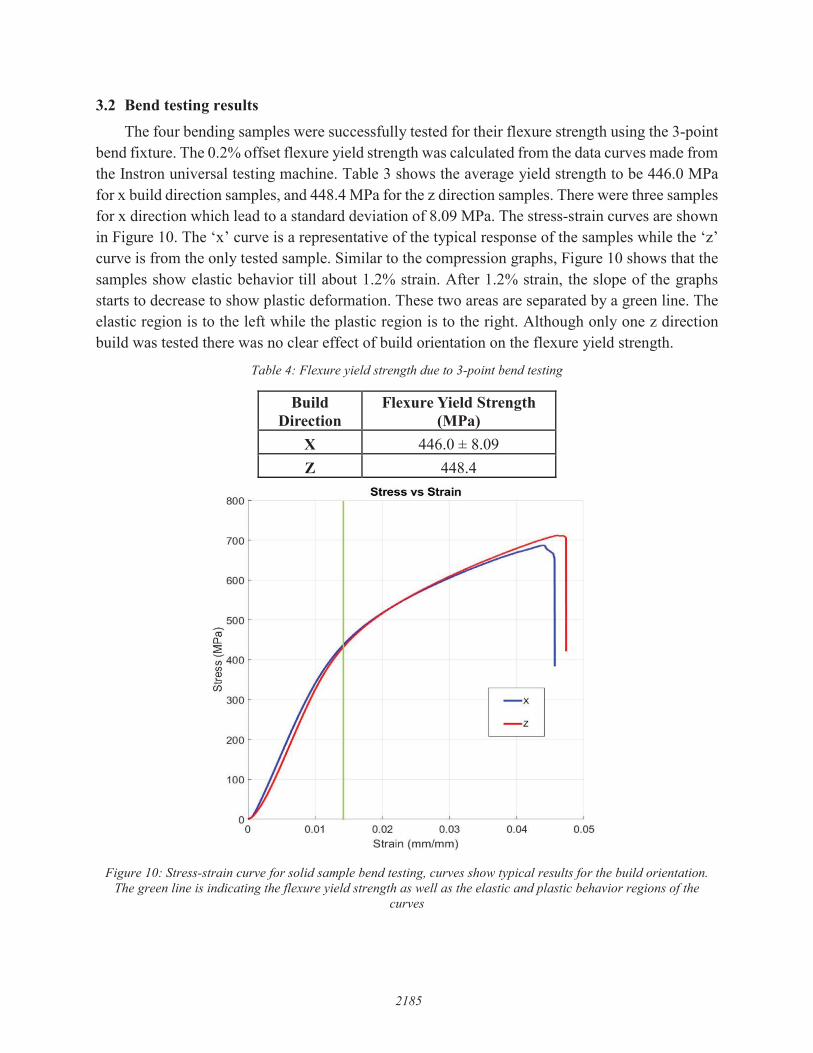
The four bending samples were successfully tested for their flexure strength using the 3-point bend fixture. The 0.2% offset flexure yield strength was calculated from the data curves made from the Instron universal testing machine. Table 3 shows the average yield strength to be 446.0 MPa for x build direction samples, and 448.4 MPa for the z direction samples. There were three samples for x direction which lead to a standard deviation of 8.09 MPa. The stress-strain curves are shown in Figure 10. The ‘x’ curve is a representative of the typical response of the samples while the ‘z’ curve is from the only tested sample. Similar to the compression graphs, Figure 10 shows that the samples show elastic behavior till about 1.2% strain. After 1.2% strain, the slope of the graphs starts to decrease to show plastic deformation. These two areas are separated by a green line. The elastic region is to the left while the plastic region is to the right. Although only one z direction build was tested there was no clear effect of build orientation on the flexure yield strength.
Table 4: Flexure yield strength due to 3-point bend testing
Build Direction
Flexure Yield Strength (MPa)
X 446.0 ± 8.09 Z 448.4
Figure 10: Stress-strain curve for solid sample bend testing, curves show typical results for the build orientation. The green line is indicating the flexure yield strength as well as the elastic and plastic behavior regions of the
curves
2185
-ro a... 2
800
700
600
500
';; 400 V)
~ u5
300
200
100
Stress vs Strain
~ L--=:J
o .._---~-------L--~----~----~---~ 0 0.01 0.02 0.03 0.04 0.05
Strain (mm/mm)
3.3 Mini-tensile testing results
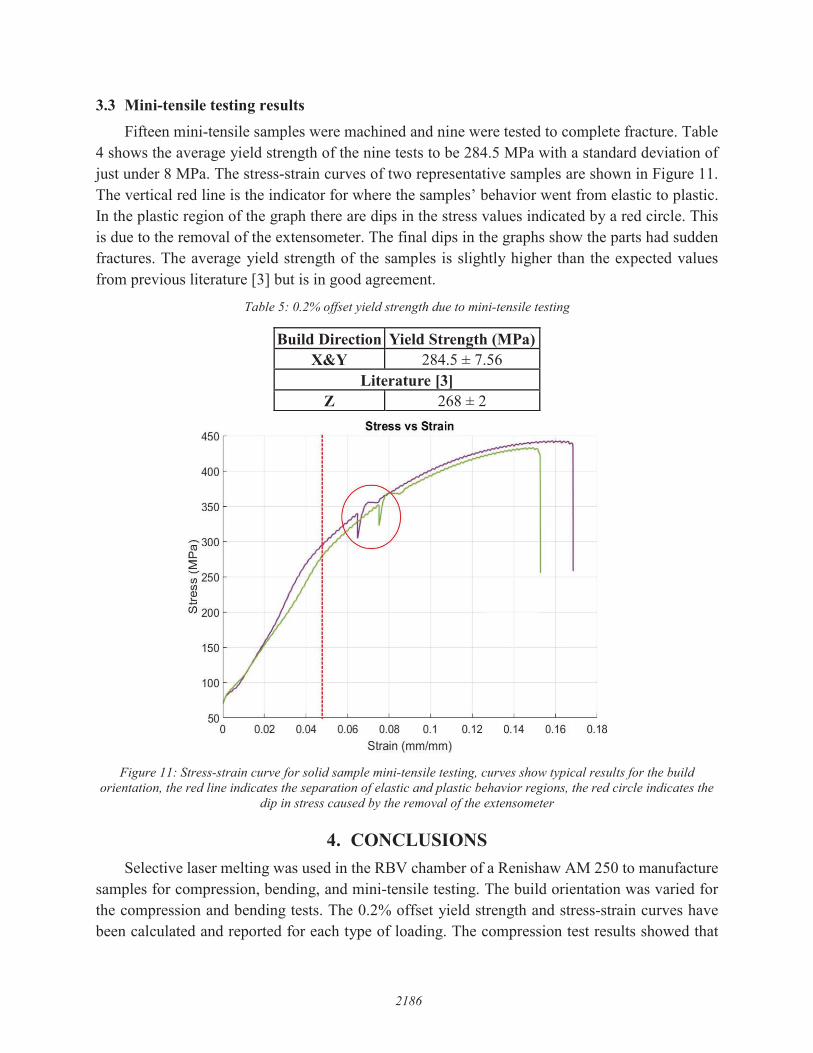
Fifteen mini-tensile samples were machined and nine were tested to complete fracture. Table4 shows the average yield strength of the nine tests to be 284.5 MPa with a standard deviation of just under 8 MPa. The stress-strain curves of two representative samples are shown in Figure 11. The vertical red line is the indicator for where the samples’ behavior went from elastic to plastic. In the plastic region of the graph there are dips in the stress values indicated by a red circle. This is due to the removal of the extensometer. The final dips in the graphs show the parts had sudden fractures. The average yield strength of the samples is slightly higher than the expected values from previous literature [3] but is in good agreement.
Table 5: 0.2% offset yield strength due to mini-tensile testing
Build Direction Yield Strength (MPa) X&Y 284.5 ± 7.56
Literature [3] Z 268 ± 2
Figure 11: Stress-strain curve for solid sample mini-tensile testing, curves show typical results for the build
orientation, the red line indicates the separation of elastic and plastic behavior regions, the red circle indicates the dip in stress caused by the removal of the extensometer
4. CONCLUSIONS Selective laser melting was used in the RBV chamber of a Renishaw AM 250 to manufacture
samples for compression, bending, and mini-tensile testing. The build orientation was varied for the compression and bending tests. The 0.2% offset yield strength and stress-strain curves have been calculated and reported for each type of loading. The compression test results showed that
2186
450
400
350
ci,300 a.. ~ ~250 (/J
~
in 200
150
100
Stress vs Strain
so ~-~--~-~--~--~-~--~-~--~ 0 0.02 0.04 0.06 0.08 0.1 0.12 0.14 0.16 0.18
Strain (mm/mm)
the samples built in the z direction had an increased yield strength of over 10% when compared to the sample built in the x and y directions. The compressive yield strength from a previous study was found to be comparable. The bending test showed no clear difference in yield strength or behavior of the samples built in the x and z direction. The mini tensile samples were built in the x and y direction and were shown to have a yield strength that was comparable to previously reported tensile results. This showed our test samples built using the RBV of the Renishaw were on par with samples built using the entire build chamber.
5. ACKNOWLEDGEMENTSThis research is sponsored by the Industrial Consortium of the Center for Aerospace
Manufacturing Technologies (CAMT) at Missouri University of Science and Technology. The authors would also like to thank Honeywell Federal Manufacturing and Technology for the use of the Renishaw machine.
6. REFERENCES[1] N. T. Aboulkhair, N. M. Everitt, I. Ashcroft, and C. Tuck, “Reducing porosity in AlSi10Mg parts
processed by selective laser melting,” Addit. Manuf., vol. 1–4, pp. 77–86, 2014.
[2] E. Brandl, U. Heckenberger, V. Holzinger, and D. Buchbinder, “Additive manufactured AlSi10Mgsamples using Selective Laser Melting ( SLM ): Microstructure , high cycle fatigue , and fracturebehavior,” J. Mater., vol. 34, pp. 159–169, 2012.
[3] N. T. Aboulkhair, I. Maskery, C. Tuck, I. Ashcroft, and N. M. Everitt, “The microstructure andmechanical properties of selectively laser melted AlSi10Mg: The effect of a conventional T6-like heattreatment,” Mater. Sci. Eng. A, vol. 667, pp. 139–146, 2016.
[4] nfluence of processparameters on Mg2Si precipitation and Si spheroidization,” J. Alloys Compd., vol. 755, pp. 100–107,2018.
[5]optimisation and mechanical properties development,” Mater. Des., vol. 65, pp. 417–424, 2015.
[6] O. Fashanu, M. Buchely, M. Spratt, K. Chandrashekhara, J. Newkirk, H. Misak, and M. Walker,“Effect of SLM build parameters on the compressive properties of 304L stainless steel,”Manufacturing and Materials Processing, vol. 3, pp. 1-15, 2019.
[7] I. Maskery, N. T. Aboulkhair, A. Aremu, C. Tuck, I. Ashcroft, R. Wildman, and R. Hague, “Amechanical property evaluation of graded density Al-Si10-Mg lattice structures manufactured byselective laser melting,” Mater. Sci. Eng. A, vol. 670, pp. 264–274, 2016.
[8] Z. Dong, Y. Liu, W. Li, and J. Liang, “Orientation dependency for microstructure , geometric accuracyand mechanical properties of selective laser melting AlSi10Mg lattices,” J. Alloys Compd., vol. 791,pp. 490–500, 2019.
[9] M. Products, T. Modulus, C. Modulus, and S. Rates, “Standard test methods of compression testing ofmetallic materials at room temperature,” 2019.
[10] C. O. Rios, T. Amine, and J. W. Newkirk, “Tensile behavior in selective laser melting,” Int. J. Adv.Manuf. Technol., vol. 96, no. 1–4, pp. 1187–1194, 2018.
2187

![Experimental behaviour and strength of concrete-encased … · 2019-03-27 · bending and axial compressive load [3–6], and behaviour under biaxial bending and axial compressive](https://img.pdfslide.net/doc/110x75/5e54a910ee6ea919d33e4e9a/experimental-behaviour-and-strength-of-concrete-encased-2019-03-27-bending-and.jpg)


![UNIVERSITY OF THE BASQUE COUNTRY DETERMINATION OF TRANSVERSE COMPRESSIVE STRENGTH OF LONG FIBER COMPOSITES BY THREE-POINT BENDING OF [90m/0n] LAMINATED](https://img.pdfslide.net/doc/110x75/56649d2e5503460f94a05143/university-of-the-basque-country-determination-of-transverse-compressive-strength.jpg)


![Research Article Strength and Deformability of Fiber ...bending only fractions of a percent []. Inclusion of basalt ber in concrete resulted in decreasing of the compressive strength](https://img.pdfslide.net/doc/110x75/60a68305fbd3223aa352bdf2/research-article-strength-and-deformability-of-fiber-bending-only-fractions.jpg)