Embed Size (px)
Citation preview

SSC-267
COMPRESSIVESTRENGTHOFSHIP HULL GIRDERS
PART Ill
THEORYANDADDITIONALEXPERIMENTS
This document has been approvedfor public release and sale; its
distribution is unlimited.
SHIP STRUCTURE COMMITTEE1977
. ~ .—.
. —----- .
MEMBER AGENCIES:
(JNITEDSTATESCOASTGUARDNAVALSHIPSYSTEMSCOMMANDMILITARYSEALIFTCOMMANDMARITIMEADMINISTRATIONAMENCAN8LIREAUOFSHIPPING
SHIP STRUCTURE COMMllTEEAN INTERAGENCY ADVISORY
COMMITTEE DEDICATED TO IMPROVING
THE STRUCTURE OF 5HIP$
ADDRESS CORRESPONDENCE TO:
SECRE”rARYSHIP STRUCTURE COMMITTEEU.S. COAST GUARD HEADQUARTERSWASHINGTON, 13.C. 20591
6 September 1977SR-206
The Ship Structure Committee has been sponsoring aninvestigation into the ultimate strength of a ship’s hull girderunder various combinations of longitudinal, transverse, and normal
loads in an effort to develop an analytical expression for use bythe ship designers.
This report is the third in a series covering thetheory and additional experiments on the compressive strength of
ship hull girders.
If you have any comments on this report or suggestionsfor other projects in the ship structure area, they will be mostwelcome.
Jj’qd&’&&-. .Rear Admiral, U. S. Coast GuardChairman, Ship Structure Committee

SSC-267
FINAL TECHNICAL REPORT
on
Project SR-206
“Small Hull Girder Model”
COMPRESSIVE STRENGTH OF SHIP HULL GIRDERS
PART III
THEORY AND ADDITIONAL EXPERIMENTS
by
H. Becker and A. Colao
SANDERS ASSOCIATES, INC.
under
Department of the NavyNaval Ship Systems CommandContract NOO024-72-C-5565
This doeu.menthas been approved fop public ?e’baseand sale: its distribution is un~imited.
U. S. Coast Guard HeadquartersWashington, D.C.
1977

ABSTRACT
A phenomenologlcal theory has been developed for predicting the ultimatestrength of rectangular structural plates loaded in uni axial longitudinalcompression, uni axial transverse compression and biaxial compression.The effects of normal pressure also were considered.
The theory was found to be in reasonable agreement with experimentaldata. Certain areas of the theory and some of the experiments requireadditional study.
The longitudinal compression theory was found to agree well with cor-responding theories of other investigators. However, the new theoryemploys the detailed stress-strain curve for a given material, whichthe others do not, and demonstrates that, in general, strength predictionrequires a curve for each structural material. The commonly used para-
meter, (b/t)(ocy/E)’/2, is shown not to be universally employable across
the total material spectrum as the factor identifying ultimate strength.
Other results of broad interest are the demonstration of the applicabilityof a biaxial plasticity law to biaxial strength theory and the delineationof a method for selecting an optimum material for compression strength.
The use of stress-strain curves for strain analysis of critical andultimate strengths is described. They were employed.to constructtheoretical strength curves.
Theoretical relations and corresponding curves have been developed forperfect plates. The effects of strength degrading factors are discussedand the analysis of residual stress effects is included.
-ii-

CONTENTS PAGE
SCOPE OF INVESTIGATION ...........................................Purpose of Project ................Uniaxial Theory
......................................
Biaxial Theory.....,........,.................
...........................................Effect of Normal Pressure ......................................Form of Report ......................................Acknowledgment ..............................i.......
UNIAXIAL LONGITUDINAL STRENGTH ......................................Introduction ......................................Plate Failure ......................................Basic Theoretical Approach ......................................Plate Buckling Theory ..................................i...Strain Analysis of Plate Buckling .............................Pseudo Flange Action .i....................................Theoretical Scatter Band .....,................................General Discussion of Degrading Factors ..,.............i.....Degradation by Residual Stresses ...............................Degradation by Initial Imperfections ..........................Degradation by Internal Stress Deviations ....................Experimental Boundary Conditions ...........,....0.............Effect of Plate Length ......................................Theoretical Strength Curves for Simply Supported Plates ...Comparison of Theory with Experiment .........................Other Theoretical Procedures for Simply Supported Plates ..Flange Strength ............................................
UNIAXIAL TRANSVERSE STRENGTH......”...’.”..”JJ “......*..”..”......-....Introduction ............................,....,.....”.s.Post-buckling Stress Distribution”..”.’..”..”. ‘“””....”..””.’.’Effect of Residual Stresses ................................ ..””Effect of Initial Imperfections ........”””.”....”..”..”.”.. ..””Stress Non-uniformity ................................● ..........
Effect of Plate Length ........● ..........................*.... .*”
BIAXIAL STRENGTH ................................... ....*”. .Introduction .....................”...,...... ........ “..Principle ........................J..*.... .....”” “.”Theory ...........................................
Comparison of Theory with Experiment ........................
EFFECT OF NORMAL PRESSURELongitudinal StrengthTransverse Strength-Biaxial Strength
1112233
444
?
1:1112121516171819202628
29292929313131
323?3?3335
39394141
-i{’L-

.. ....
MATERIAL COMPARISONS .............................................Introduction .............................................Optimum Material for Thick Plates .........................Identification of Optimum Material ........................
GRILLAGE FAILURE MODES .........................Introduction
........................................
Panel Failure.................
.....................-...................Stiffener Torsion Failure ........................Crippling
..............................................
General Instability ......................................
Role of Plate........
.........................................Loadings ..................................Comparison of Failure Modes
.........................*....* ........
CONCLUSIONS ....................................................
RECOMMENDATIONS ....................................................
APPENDIX I - EXPERIMENTS AND DATA ....................Specimen Characteristics .........................
...........
Load-Applications Devices ..............................
Data Acquisition ...................
...................Experimental Errors (Current Series) .....................
........
Data
APPENDIX II - THE STRESS-STRAIN CURVE .........................
APPENDIX III - POLYAXIAL PLASTIC BUCKLING .....................General Solutions ........................................Shear Buckling ............................Biaxial Compression B~;[ling
.......................................
REFERENcEs ...................................................
PAGE42:424243
45454545
::464646
47
48
57
65
-’iv-

NOMENCLATURE
Symbol s
Ay, Ax
a
,“b
be
c
c
D
E
Area, in2
Length of plate, in.
Width of plate, in. (outside dimensions of tube)
Effective width of equivalent flange, in,
Shell buckling coefficient, figure 22
Loss of perfect plate buckling stress
Bending stiffness of plate, Et3/[12(1-w2)], in-lb.
Young’s modulus, msi (1 msi = 106 psi) or psi
E E+.-.Y Secant and tangent moduli, msi or psi2!
F
9~
j
K
k
kx
kY
k
m
N~
NY
Px
PY
L
(t/ b)(E/@l/2
Multiplier converting Ocy to oe
Number of effective transverse flanges in a plate atbiaxial failure
Component of plasticity reduction factor
km2/12[(1-ve2)]
Buckling coefficient
Longitudinal buckling coefficient
Transverse buckling coefficient
Multiplier of plate thickness (t) to obtain effectivewidth of weld tension stress region on one side ofweld centerline
Number of longitudinal half waves in buckled plate
Plate longitudinal loading, tox = Px/4b, lb/in.
Plate transverse loading, toy = 0,707 Py/a, lb/in.
Force applied longitudinally to tube, lb. (See sketch, P.69)
Force applied diagonally transversely to tube, lb.(See sketci~, p.69)
-7) -
P
s
t
w
x
Y
a
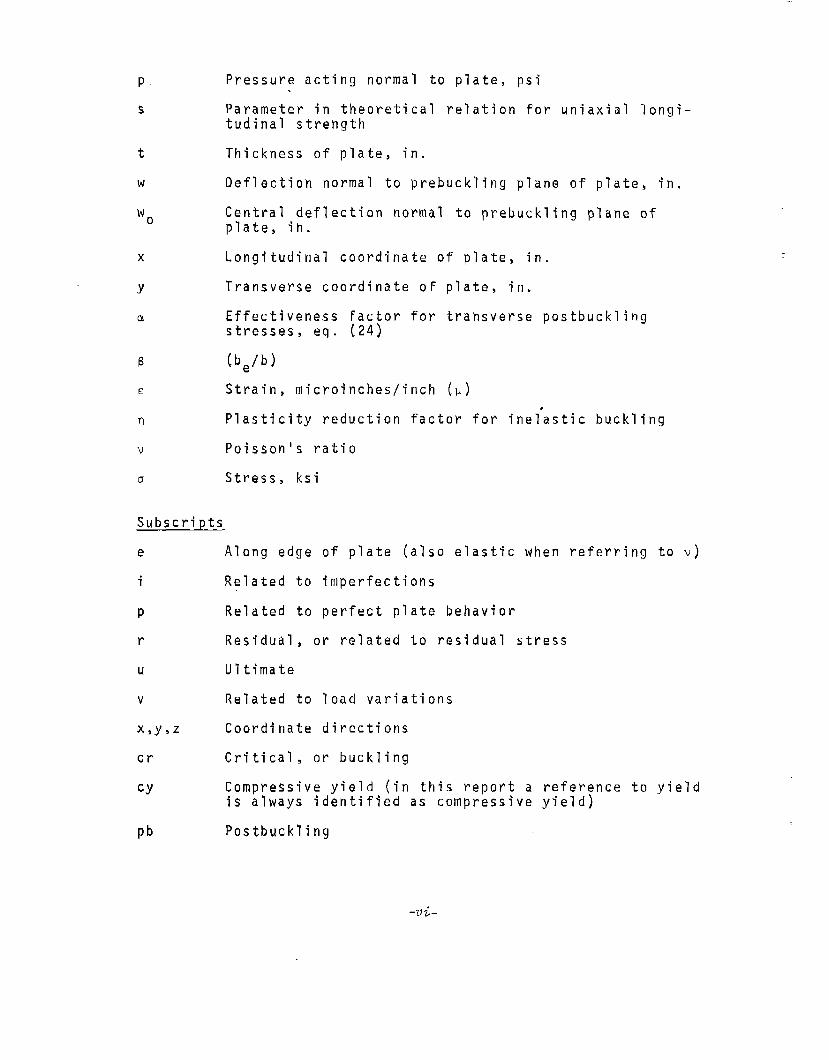
Pressure acting normal to plate, psi
Parameter in theoretical relation for uniaxial longi-tudinal strength
Thickness of plate, in,
Deflection normal to prebuckling plane of plate, in.
Central deflection normal to prebuckling plane ofplate, ih.
Longitudinal coordinate of plate, in.
Transverse coordinate of plate, in.
Effectiveness factor for trartsverse postbucklingstresses, eq. (24)
(be/b)
Straih, microinches/inch (p)
Plasticity reduction factor for inelastic buckling
Poisson’s ratio
Stress, ksi
Subscripts
e Along edge of plate (also elastic when referring to v)
i Related to imperfections
P Related to perfect plate behavior
r Residual, or related to residual stress
u Ultimate
v Related to load variations
X,y,z Coordinate directions
cr Critical, or buckling
Cy Compressive yield (in this report a reference to yieldis always identified as compressive yield)
pb Postbuckling
-vi-
Combined subscripts may be formed from the above. For example:
Xcr x-direction (or longitudinal) critical or bucklihg
yu y-direction (or transverse) ultimate
.
SHIP STRUCTURE COMMITTEE
The SHIP STRUCTURE COMMITTEE is constituted to prosecute a researchprogram to improve the hull structures of ships by an extension of knowledgepertaining to design, materials and methods of fabrication.
RADM W. M. Benkert, USCG (Chairman)Chief, Office of Merchant Marine Safety
U.S. Coast Guard Headquarters
Mr. P. M. Palermo Mr. M. PitkinAsst. for Structures Asst. Administrator forNaval Ship Engineering Center Commercial DevelopmentNaval Ship Systems Command Maritime Administration
Mr. John L. Foley Mr. C. J. WhitestoneVice President Engineer OfficerAmer,ican Bureau of Shipping Military Sealift Command
SHIP STRUCTURE SUBCOMMITTEE
The SHIP STRUCTURE SUBCOMMITTEE acts for the Ship Structure Committeeon technical matters by providing technical coordination for the determinationof goals and objectives of the program, and by evaluating and interpreting theresults in terms of ship structural design, construction and operation.
NAVAL SEA SYSTEMS COMMAND
Mr. R. Johnson - MemberMr. J. B. O’Brien - Contract AdministratorMr. C. Pohler - MemberMr. G. Sorkin - Member
U.S. COAST GUARD
LCDR E. A. Chazal - SecretaryLCDR S. H. Davis - MemberCAPT C. B. Glass - MemberLCDR J. N. Naegle - Member
MARITIME ADMINISTRATION
Mr. F. Dashnaw - MemberMr. N. Harmner - MemberMr. R. K. Kiss - MemberMr. F. Seibold - Member
MILITARY SEALIFT COMMAND
Mr. T. W. Chapman - MemberCDR J. L. Simmons - MemberMr. A. B. Stavovy - MemberMr. D. Stein - Member
AMERICAN BUREAU OF SHIPPING
NATIONAL ACADEMY OF SCIENCESSHIP RESEARCH COMMITTEE
Pr@f. J. E. Goldberg - LiaisonMr. R. W. Rumke - Liaison
SOCIETY OF NAVAL ARCHITECTS &MARINE ENGINEERS
Mr. A. B. Stavovy - Liaison
WELDING RESEARCH COUNCIL
Mr. K. H. Koopman - Liaison
INTERNATIONAL SHIP STRUCTURESCONGRESS
Prof. J. H. Evans - Liaison
U.S. COAST GUARD ACADEMY
CAPT W. C. Nolan - Liaison
STATE UNIV. OF N.Y. MARITIME COLLEGE
Dr.”W. R. Porter - Liaison
AMERICAN IRON & STEEL INSTITUTE
Mr. R. H. Sterne - Liaison
Mr. S. G. Stlansen - ChairmanDr. H. Y. Jan - Member U.S. NAVAL ACADEMY
Mr..I. L. Stern - Member Dr. R. Bhattacharyya - Liaison

SCOPE OF INVESTIGATION
Purpose of Project
This investigation had the major purpose of developing a usable theoryfor predicting the strength of rectangular flat plates in polyaxialcompression. The theory is developed for materials typical of currentand projected ship construction.
An additional purpose of the investigation was to acquire experimentaldata on materials and plate proportions different from those in thepreceding investigation (Ref. 1) in order to provide a broader experi-mental base from which to test the theory in a critical fashion.
The form of the theory is applicable to a large range of practical shipdesign problems. It is useful for the construction of design chartsand should apply to materials different from those investigated in thisproject. The general form of the theory contains identification of thematerial parameters to permit the construction of design charts. How-ever, this investigation has been confined to the development of thebasis for the charts. It is considered that chart development is beyondthe scope of the current project.
lJniaxial Theory
The primary emphasis throughout the current investigation was on thedevelopment of a reasonably clear understanding of the physical charac-ter of uniaxial plate strength as determined by laboratory experimentsand the , >nner in which those results relate to the strength of a platein a ship. For this reason, the technical content of the report beginswith an exposition of uniaxial plate strength, to which the primary massof experimental data pertains.
In this development frequent use is made of the concept of strain analy-sis of buckling. This requires a detailed understanding of the charac-ter of the stress-strain curve and presents related information forseveral materials including the curves for the materials used in thesestudies. One of the consequences of the current theory of platestrength is the indication that it is possible to identify the proper-ties of an optimum material for compression strength. This was doneusing the stress-strain curve alone.
The main stream of the investigation pertains to plates supported onall edges. However, data exist on the strength of flanges which areplates supported on three sides and free on the fourth. The uniaxialtheory was extended to that case with good agreement, as will be shown.
The uniaxial theory was compared to experimental data provided by manyinvestigators. The theory not only predicts the behavior of a perfectplate, but also identifies the influence of strength-degrading factors.
When conducting a plate experiment the feature that is most difficultto control is a set of boundary conditions on the plate edges. In asense, a critical evaluation of a given set of experiments is as muchan assessment of the test technique as of the experimental data. For
1

this reason, an analysis is presented of the procedure used in thisinvestigation and of procedures used by other investigators. The in-fluence of the test method upon the data is discussed. Also importantis the comparison of the experiment with the behavior of the plate ina ship grillage.
One of the bounds of plate strength theory is the thick-plate regimein which plastic buckling will occur. A resume of plastic-bucklingtheory is presented in Appendix III together with some results notpreviously reported.
Biaxial Theory
When a plate is subjected to both transverse and longitudinal membranecompression the buckling and strength can differ radically from thatunder uniaxial compression. The biaxial theory addresses this problemwith the purpose of identifying a computation technique useful for gen-eral analysis and design. The development of the theory depended uponthe results of the uni axial investigations. The results of Ref. 1 arenow explicable. The most important result was the identification of alack of boundary condition control in the previous studies when plateswere loaded transversely with no concomitant longitudinal load. Currentexaminations, in which these boundary conditions were controlled, haveshown most of the previous data to agree well with biaxial theory.Furthermore, they have made possible the careful selection of test loadcombinations to check critically the applicability of the biaxialstrength theory during the current test series.
Effect of Normal Pressure
The effect of normal pressure has been separated from membrane strengthanalysis. If it were possible to develop a basic mathematical procedure(such as plastic finite element analysis), then all these phenomenatheoretically could be encompassed in an integrated approach.
In this investigation the effect of normal pressure was identified forthe uni axial case first. Some of the results of Ref. 1 were employedfor this purpose. These relate to the shell theory for the strength ofcompressed plates subjected to normal pressure.
The interaction of normal pressure with plate biaxial strength isapparently considerably more complex. An explanation is offered whichis shown to agree reasonably well with observations. However, therequirement for additional research for this area is indicated.
-2-

Form of Report
The theoretical approach is based upon features of plate strength, andu on a uniaxial theory, described in previous reports (References 1 and!2 . Those reports also contain the seeds of the polyaxial theory de-
veloped during the current investigation. It would be possible to pre-sent the polyaxial theory by referring to those previous results atpertinent stages in the development of the polyaxial theory. However,it is felt that a more useful purpose would be served by presenting theentire development systematically in this report. The advantage of anintegrated approach in one report is felt great enough to outweighpossible objections to some repetition.
The experimental procedure is essentially the same as for Ref. 1. Somemodifications have been made to test equipment. These are describedin this report. However, the description of the basic procedure has notbeen repeated. The data from all box experiments appear together withthe experimental procedure in Appendix I.
The conclusions and recommendations relate to the degree of understand-ing of the phenomenology of plate strength under polyaxial loads.Several features require further study. Also, the theory may be testedby comparison with the more fundamental methods of determining platestrength such as the use of finite element analysis. Areas for furtherstudy also are delineated.
Discussions are presented on the strengths of grillages, in whichrectangular plates of various types provide the load-carrying capacity.In the general survey of Reference 2, the state-of-the-art in grillagestrength referred to gaps in the current state of knowledge. Some ofthose gaps have been partially filled by various investigators as indi-cated in the discussion in that section which is subsequent to the mainstream of the report. No new theoretical approaches are presented.This section primarily contains a discussion of the various modes ofgrillage strength with emphasis on the use of strain analysis.
Acknowledgment
The authors wish to express appreciation to Mr. W. F. Bierds, Jr., andMr. R. W. James who designed and built the compression whiffletrees,modified the transverse compression fixtures and pressurization equip-ment and performed many of the experimental tasks.
-3-

Introduction
The uniaxial
UNIAXIAL LONGITUDINAL STRENGTH
theory em~lovs a ~henomenoloaical model of the ~ost-buckling stress di;tribut~on within a pla~e. The developmen~ of thetheory was presented in Reference 1. It is repeated here for con-venience and also because it forms the basis of the biaxial strengththeory.
The procedure to be employed in this section will be the developmentof the basic theory for supported plates. This will be followed bycorrelation of theory with existing test data. The same basicapproach for simply supported plates has been applied to flanges.The development of the flange theory also will be presented afterwhich a comparison will be shown with flange-strength data.
Hypothetically, maximum strength would be achievable only by a per-fect plate, which is defined as a flat plate with no residualstresses under a uniform stress field throughout: Strength-degradingeffects are described and” are related to observed test results. Ifdegradation is severe enough to obliterate the plate-buckling load-carrying capacity, the plate is classed as poor and the ultimatestrength is presumed to be minimal. This applies to plates withlarge initial imperfections, residual stresses and certain types ofloading nonuniformities.
In the process of developing the plate-strength theory use has beenmade of the critical strain approach to stability analysis. Successwith this technique is documented in Reference 1 which shows howthe method was used to predict the effects of residual stress.
Plate Failure
The classical description of buckling is the sudden change fromthe flat state to the bent state. Classical buckling will notoccur in a practical plate since it is virtually impossible to avoidimperfections in the plate. As a result, the plate will begin todeflect normal to the plane as s~on as load is applied. The buckleheight will grow with load, Consequently, the identification of thebuckling stress usually involves some mathematical process togetherwith measurement of lateral movement.
Buckling will occur in a flat plate at a load level below that whichwill induce failure. After the plate buckles in this nonclassicalsense, the ability to carry load beyond the critical level is confinedmainly to regions near the plate edges if the plate is moderatelythick to very thin. When the edge stress level reaches the regionof the yield strength of the plate material, the plate is not ableto support additional load and collapse occurs. The strength level
-4-

is considerably greater than the critical stress level for thinplates, in which buckling will occur elastically. It is essentiallythe same as the critical stress for thick plates, in which bucklingwill occur plastically.
The problem of predicting plate strength with an explicit relationis to identify the character of the post-buckling stress at theinstant of failure. This was done by von Karman (Reference 3)who confined the load-carrying capacity to the edges, which wereassumed to act as flanges operating at the yield strength of thematerial. Bengtson (Reference 4
iamplified that approach by in-
cluding the buckling stress in t e heart of the plate. The theoryto be described incorporates the additional stress distribution whichwould provide a smooth transition from Ocy at the edges to acr in
the center. Furthermore, it is assumed that the plate may not beperfect and consequently a coefficient is added to reduce the post-buckling stress at the heart of the plate to a value below thecritical stress for a perfect plate. This is a consequence ofassuming that strength degradation arises from buckling degradation.
Basic Theoretical App roach for Supp orted Plates
The assumed post-buckling longitudinal membrane stresses in a perfectrectangular plate are shown in Figure 1. The force balance yields
(1 -
boxu = 2b oe cy + (b - 2be)(l - C)OX ~r
b/2 - b
J
e
+ 2[0Cy
- (1 - C)ox Cr] [y(b/2 - be)-l]sdyo
Typical AssumedPostbucklir, q pOstbucklingStress ... . Stress,Oistr{butiwn Distribution
)s~cy - ( 1 - CL7CJ
I
‘CY
C)a
J’ d
‘x u
F
+ Y
I
(1)
FIGURE 1 LONGITUDI~JAL
POSTBUCKLING STRESS
DISTRIBUTIONIN SUPPORTED PLATES
-5-
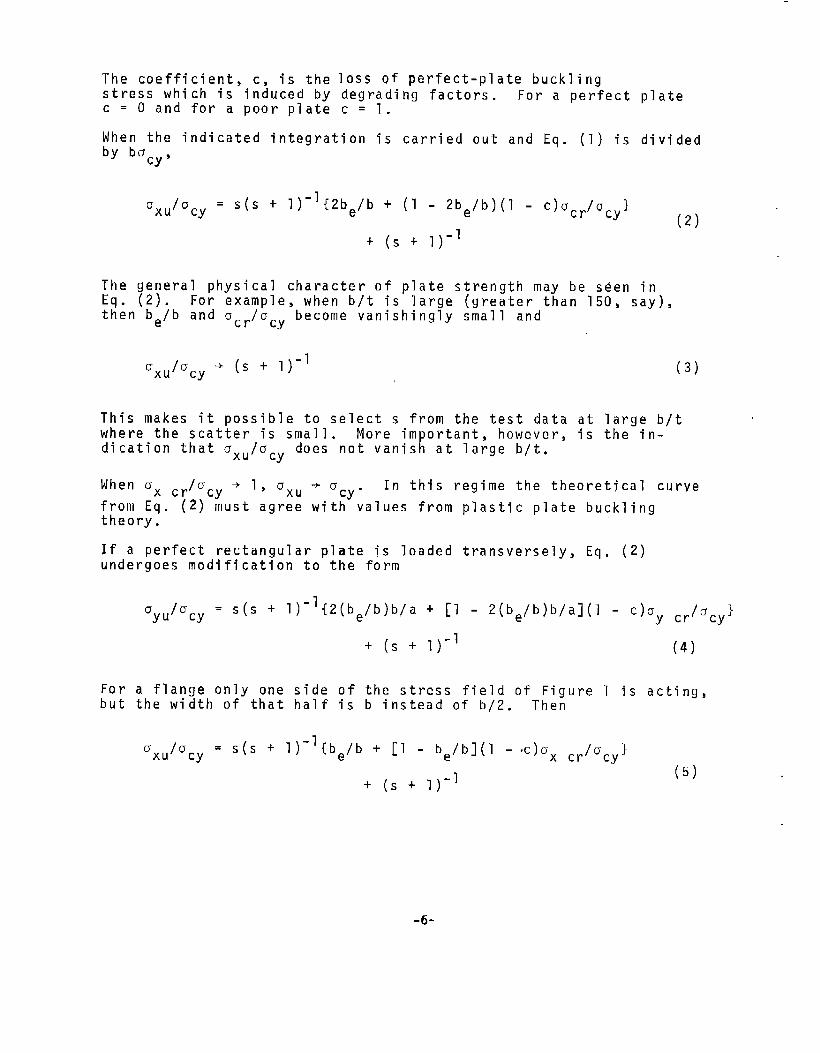
The coefficient, c, is the 10SS of perfect-plate bucklingstress which is induced by degrading factors. For a perfect platec = O and for a poor plate c = 1.
When the indicated integration is carried out and Eq. (1) is dividedby bo
Cy ‘
‘Xu lacy ‘ S(S + 1)-1 {2be/b + (1 - 2be/b)(l - C) Ocr/OCy }
(2)
+ (s + 1)-’
The general physical character of plate strength may be sden inEq. (2). For example,then be/b and Ocr/acy
when b/t is large (greater than 150, say),become vanishingly small and
Uxulo Cy+ (s + 1)-’ (3)
This makes it possible to select s from the test data at large b/twhere the scatter is small. More important, however, is the in-dication that Uxu/ocy does not vanish at large b/t.
When ax cr/”cy + 1’ ‘XU + ‘cy”
In this regime the theoretical curve
~;~~r~q. (?) must agree with values from plastic plate buckljng●
If a perfect rectangular plate is loaded transversely, Eq. (2)undergoes modification to the form
/0‘yu Cy= S(S + 1)-1{ 2( be/ b) b/a + [1 - 2( be/ b) b/a](l - C)O y #ocy}
+ (s + 1)-1 (4)
For a flange only one side of the stress field of Figure 1 is acting,but the width of that half is b instead of b/2. Then
axu/ocy = S(S + l)-l{be/b + [1 - be/b](l -.c)ax cr/ocy}
(5)+ (s + 1)-1
-6-

In the preceding development it is assumed that the centerline stressin the plate remains at the critical value. This is open to questionfor a number of reasons. For wide plates, for example, the post-buckling stress may be nearzero, as is explained below. For longplates, the centerline stress has been reported to decrease, by someinvestigators (Duffy and Allnut, for example, in Ref. 5), as theload is increased above critical toward ultimate. One of themost interesting results was obtained by C. Smith* during a testof a grillage under longitudinal compression. The plate postbucklingstrains at the centerline decreased in the plates near one unloadededge of the grillage, increased in the plates. at the other edge, andremained essentially constant at Ocr in the plates midway between.
In that t~st the end loading was controlled by jacks to be unifo;m.
In the bbsence of more definitive data, the choice of constantpostbuckling stress at the critical value has been made in developingthe theory for perfect long plates longitudinally compressed.
Plate Buckling Theory
The fundamental mathematical theory of structural stability fre-quently utilizes a differential equation derived from the physicsof the deformed state of the structure under load (see Appendix III).This equation can b~ solved to find the minimum magnitude of thetype of load applied to the structure subject to the applicableboundary conditions.
Two tools of the theory are the stress-strain curve and the conceptof critical strain. They are useful in analyzing inelasticbuckling and assessing the influence of degrading factors. Exactmathematical solutions for both elastic and inelastic problems areavailable in closed form for a large number of shapes and boundaryconditions. Numerical solutions have been obtained for caseswhich do not lead easily to closed-form solutions for which energysolutions (and, more recently, finite-element computer programs)are employed.
in the case of perfect rectangular plates the analyses yieldthe result
acr= ~[k?2E/12(1 - v e2)I(W2 (6)
in which p embodies the inelastic properties of the plate material(Table IIw1; wh?le k embodies the effects of the boundary con-ditions and plate shape. For a simply supported infinitely longrectangular plate under longitudinal compression, k = 4 and (Table III-1)
1 - Vz
n ‘1 2
‘—(Es/E)[O.S + 0.25(1 + 3Et/E~)i/2~
- v
(7)
* Private communication
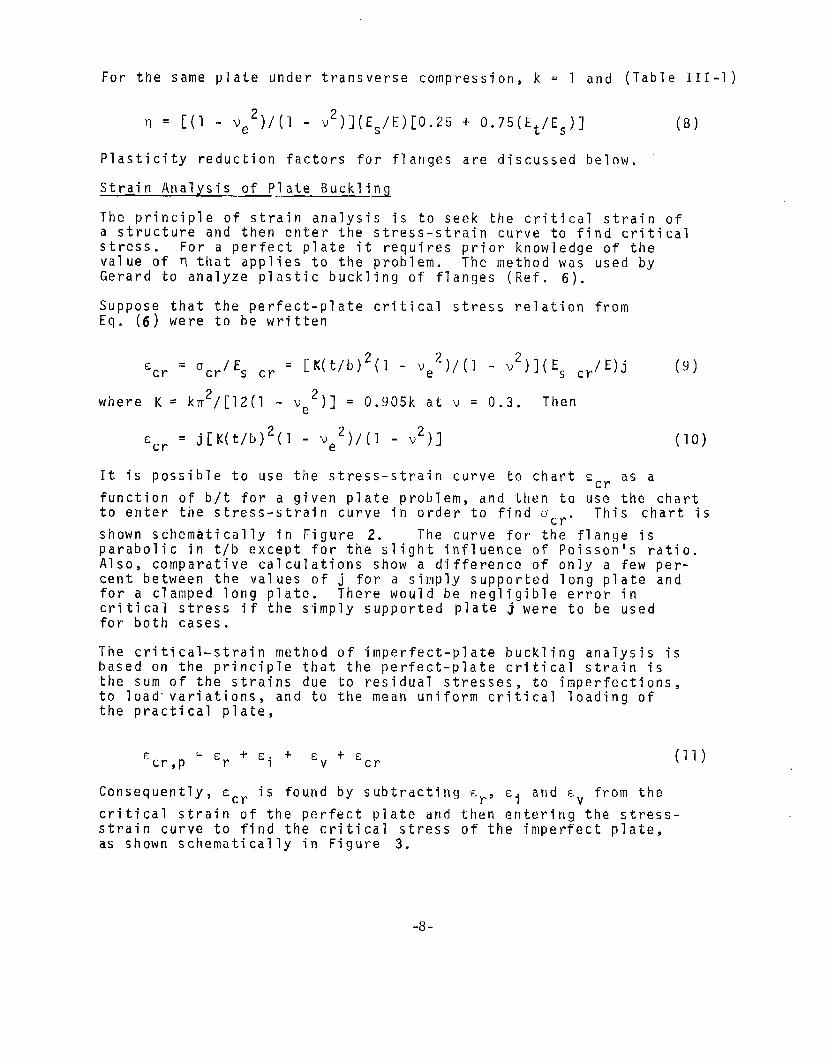
For the same plate under transverse compression, k = 1 and (Table 111-1)
n = [(1 - ve2)/(1 - V2)](ES/E) [0.25 + 0.75 (Et/EJ] (8)
Plasticity reduction factors for flanges are discussed below.
Strain Analysis of Plate Buckling
The principle of strain analysis is to seek the critical strain ofa structure and then enter the stress-strain curve to find criticalstress. For a perfect plate it requires prior knowledge of thevalue of n that applies to the problem. The method was used byGerard to analyze plastic buckling of flanges (Ref. 6).
Suppose that the perfect-plate critical stress relation fromEq. (6) were to be written
Ecr = Ucr/Es Cr = [K(t/L)2(l - ve2)/(1 - v2)](Es cr/E)j
where K = km2/[12(1 - ve2)l = o.905k at v = 0.3. Then
Ecr
= j[K(t/b)2(l - ve2)/(1 - V2)]
It is possible to use the stress-strain curve to chart ~cr as a
(9)
(lo)
function of b/t for a given plate problem, and then to use the chartto enter the stress-strain curve in order to find Ucr. This chart is
shown schematically in Figure 2. The curve for the flange isparabolic in t/b except for the slight influence of Poisson’s ratio.Also, comparative calculations show a difference of only a few per-cent between the values of j for a simply supported long plate andfor a clamped long plate. There would be negligible error incritical stress if the simply supported plate j were to be usedfor both cases.
The critical-strain method of imperfect-plate buckling analysis isbased on the principle that the perfect-plate critical strain isthe sum of the strains due to residual stresses, to imperfections,to loadvariations, and to the mean uniform critical loading ofthe practical plate,
= +E+‘cr,p ‘r
+ Ei ‘v cr (11)
Consequently, Ecr is found by subtracting Er, Ei and E “ from the
critical strain of the perfect plate and then entering the stress-strain curve to find the critical stress of the imperfect plate,as shown schematically in Figure 3.
-8-

a
I“Cr
acr
tib
SS Plate
7
\
\
c ‘crFla;;es SS Plates
k = 0.433 k = 4.0
FIGURE 2BUCKLING STRAIN ANALYSIS
F(!R PERFECT PLATE
o
—
\
‘CrDegraded
Plate
E crt/b Perfect Plate
=Perfect Plate
- Degraded Plate
Total
fDegradationStrain
FIGURE 3
BUCKLI!IG STRAIN ANrn.LYSIS FORDEGR,4DED PLATE
-9-

Pseudo Flange Action
Each edge strip of the plate in Figure 1 is considered a flange ofwidth be which is hinged along the unloaded edge and which buckles
at oCy
so that
oCy= rII0.433m2E/12(1 - ve2)](t/be)2 (12)
Then
be/b = CF(rI)l/2 (13)
where
C = [0.433Tr2/12(1 - ve2)]1’2 = 0.626 with Ve = 0.3,
F = (t/b)(E/ocy)l’2,
rI=(E s ~y/E)(l - ve2)/(1 - V2),
v = 0.5 - 0.2E s ~y/E (Eq. 111-12)
E, CYIE
= [1 + 0.002E/@
SO that
be/b = 0.597F(1 + 0.002E/@””2 X
{1 - [0.5 - 0.2(1 + 0.002E/ocy)-1]2}-1’2 = ‘F
(14)
Eq. (14) shows belb to depend upon b/t and E/ocy. The range of
(be/b)/F is shown in Figure 4 over the range of E/ocy relevant to
ship structural materials.
0.5
1~
FIGLlllE 4 EFFECTIVE WIDTH OF PSEUDO FLANGESAT PLATE ULTIMATE LOAD
o 0.4
bJb ● BF
0.3200 400 600 aoo 1000
-1o-
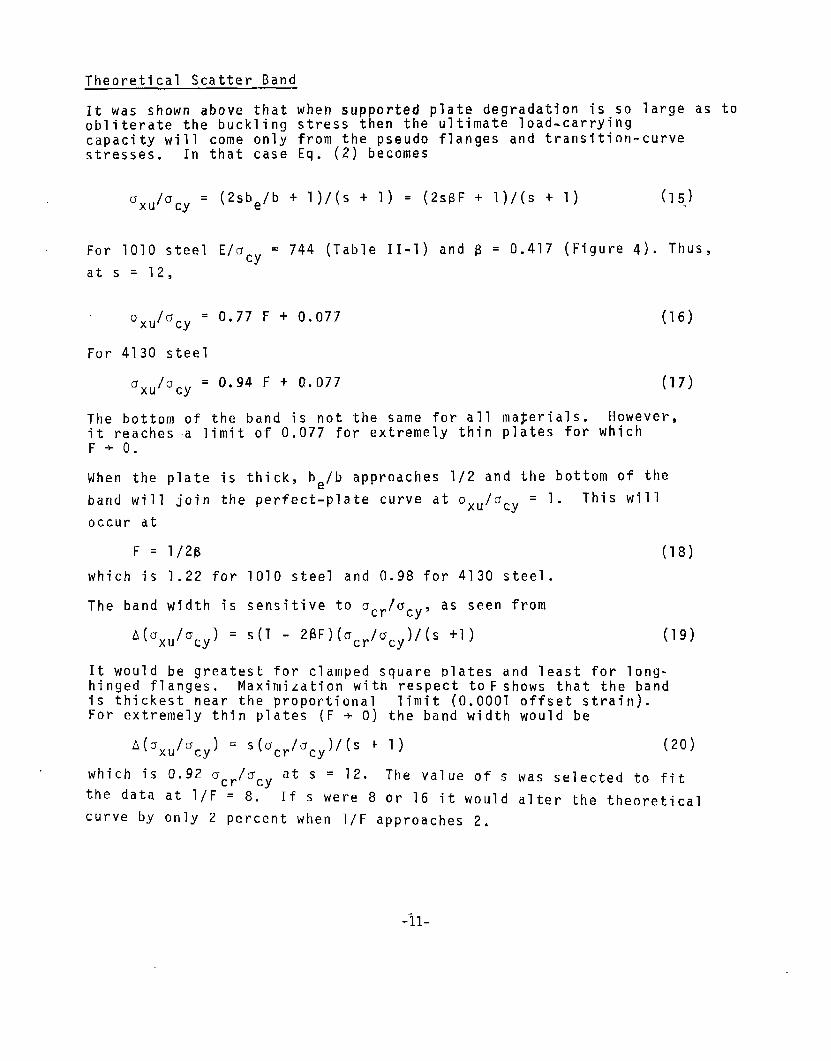
Theoretical Scatter Band
It was shown above that when supported plate degradation is so large as toobliterate the buckling stress then the ultimate load-carryingcapacity will come only from the pseudo flanges and transition-curvestresses. In that case Eq. (2) becomes
Crxulucy ‘ (2sbe/b + 1)/(s + 1) = (2sf3F+ 1)/(s + 1) (15J
For 1010 steel E/ocy = 744 (Table II-1) and B = 0.417 (Figure 4). Thus,
at s = 12,
Dxu/ucy = 0.77 F + 0.077 (16)
For 4130 steel
*XU /ocy ‘ 0.94 F + 0.077 (17)
The bottom of the band is not the same for all majerials. However,it reaches a limit of 0.077 for extremely thin plates for whichF+O.
When the plate is thick, be/b approaches 1/2 and the bottom of the
band will join the perfect-plate curve at Oxu/o Cy =1. This will
occur at
F = l/2B (18)
which is 1.22 for 1010 steel and 0.98 for 4130 steel.
The band width is sensitive to ucr/acy, as seen from
A(axu/acy) = S(1 - 2BF)(ucr/acy)/(s +1) (19)
It would be greatest for clamped square plates and least for long-hinged flanges. Maximization with respect to Fshows that the bandis thickest near the proportional limit (0.0001 offset strain).For extremely thin plates (F + O) the band width would be
A(uxu/ocy) = S(c7cr/@/(S + 1) (20)
which is 0.92 acr/acy at s = 12. The value of s was selected to fit
the data at l/F = 8. If s were 8 or 16 it would alter the theoretical
curve by only 2 percent when l/F approaches 2.
-il-

General Discussion of Degrading Factors
Plate-strength degrading factors arise from all the processes to whicha plate is subjected including fabrication -in the mill, installationin the ship and the accumulated action of the sea upon the ship struc-ture up to the moment of application of the load which would producecollapse by instability. An extensive bookkeeping process would berequired, together with sophisticated measuring devices, in order torecord that history of ship plate degradation. It is more practicalto idealize the effects and to deal with probable ranges of the asso-ciated parameters.
The degrading factorsmost commonly mentioned in regard to platastrength are residual stresses and initial imperfections. An addi-tional influence is the presence of stresses which cause a departurein the internal plate loading from the perfectly uniform stress fieldwhich normally is assumed to be applied to the plate. It is the pur-pose of this section, and of the three which follow, to discuss themanner in which those factors are taken into account in developing thetheory presented in this report.
Degradation is assumed to be confined to the heart of the plate wherethe local load-carrying capacity of a perfect plate would be providedmainly by the critical stress. Therefore, reduction of the post-buckling load-carrying capacity would be equivalent to reduction ofthe critical stress for a long plate under longitudinal compression.Degradation is expressed as a fraction, c, of the critical stress. Itis incorporated in the basic strength relation of Eq. ( 2 )
%Uiucy= s(s+l)-1[2be/b + (1-2be/b)(l-c)ocr/o ] + S(s+l )-’
Cy
Degradation by Residual Stresses
Measurements have been made by various investigators (Refs. 7, 8 and 1,for example) to determine residual stre~ses in welding plates. The approach isto assume a stress field as shown in Figure 5. The problem is to deter-mine representative values for the width of the tension block, which isusually expressed as a multiple, 1, of the plate thickness. The valueof L can range from O for an annealed laboratory test plate to a magni-tude as great as 7 or 8 depending upon the welding procedure. Therealso has “been some expression of the viewpoint that L can be reducedby shakedown in a ship. However, there is a possibility that thereduction in R may be converted to an initial imperfection (or to anenlargement of initial imperfections already present).
The force balance for the stress field in Figure 5 yields the relation
Dr/crCy
= (b/2flt - 1)-1 (21)
Once the value oflis known for a plate with a given b/t fabricatedfrom a material with a known Ocy then the critical stress can be found
from Eq. (21) and the strain, gr/E. can be found on the assumption that
-12-

~Approxitnationto Actual 1
Idealization-b
+Ue
Jo b/2 -4
FIGURE 5 SIMPLIFIED RESIDUAL STRESS FIELDDEPICTING BALANCE OF INTERNALFORCES
centerline residual is elastic.
The magnitude of L has been expressed in terms of welding parameters(Ref. 8, for example). Those results have not been related to elec-tron beam welding which was used in Ref. 1 and in the current tests.The residual stress fields for several plates were constructed throughthe use of a shaving operation described in Ref. (l). The centerlineresidual also was measured by trepanning, both in Ref. (1) and in afew specimens during the current study. The results show that theidealization of Figure 5 is not accurate enough for fine detailed anal- -ysis. However, it may be sufficiently accurate for practical use.
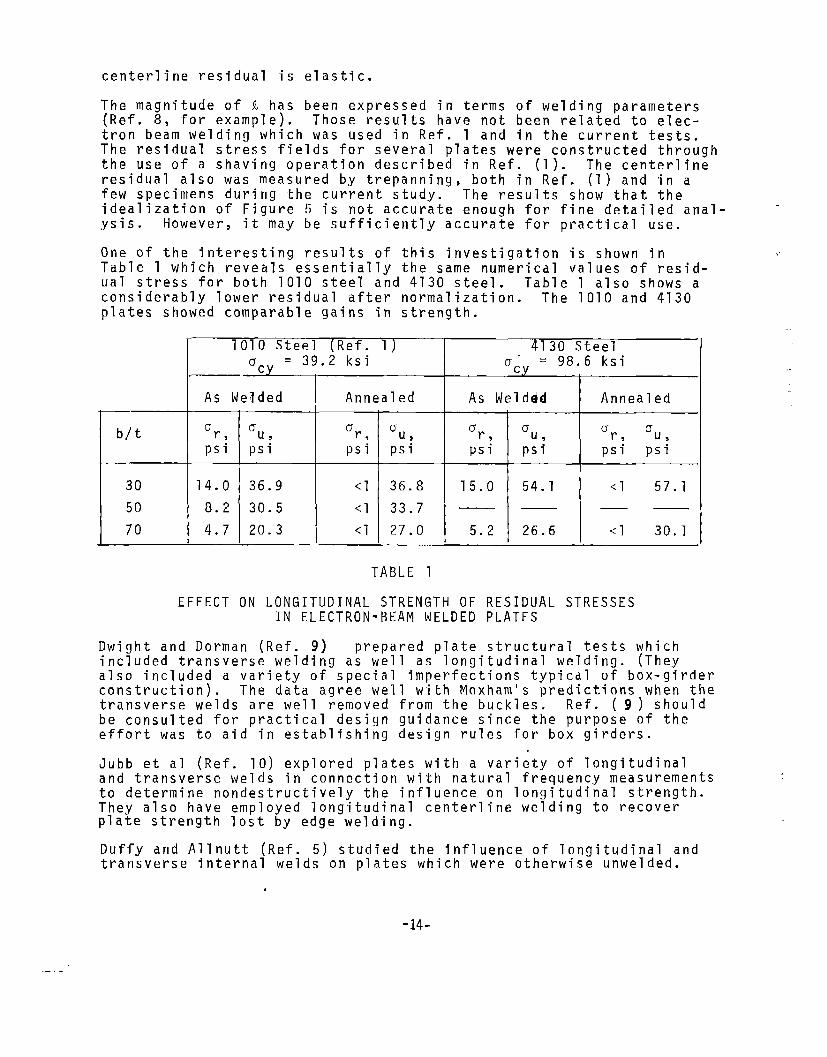
One of the interesting results of this investigation 5s shown inTable 1 which reveals essentially the same numerical values of resid-
..-
ual stress for both 1010 steel and 4130 steel. Table 1 also shows aconsiderably lower residual after normalization. The 1010 and 4130plates showed comparable gains in strength.
1010 Steel (Ref. 1) 4130 Steelo = 39.2 ksiPII 0“ = 98.6 ksiP11
*J
As Welded
Fb/t
ur,
psi
30 14.0
50 8.2
70 4.7
0u,
psi
36.9
30.5
20.3
Annealed As Welddd Annealed
I Iu r, Ou or o
u,or,
Du
psi ps: Ps: psi psi ps:
<1 36.8 15.0 54.1 <1 57.1
<1 33.7 — — — —
<1 27.0 5.2 26.6 <1 30.1
TABLE 1
EFFECT ON LONGITUDINAL STRENGTH OF RESIDUAL STRESSESIN ELECTRON-BEAM WELDED PLATES
Dwight and Dorman (Ref. 9) prepared plate structural tests whichincluded transverse welding as well as longitudinal welding. (Theyalso included a variety of special imperfections typical of box-girderconstruction). The data agree well with Moxham’s predictions when thetransverse welds are well removed from the buckles. Ref. (9) shouldbe consulted for practical design guidance since the purpose of theeffort was to aid in establishing design rules for box girders.
Jubb et al (Ref. 10) explored plates with a variety of longitudinaland transverse welds in connection with natural frequency measurementsto determine nondestructively the influence on longitudinal strength.They also have employed longitudinal centerline welding to recoverplate strength lost by edge welding.
Duffy and Allnutt (Ref. 5) studied the influence of longitudinal andtransverse internal welds on plates which were otherwise unwelded.
i
-14-
They showed a small gain in strength for longitudinal centerline weldsand the same magnitude loss for transverse centerline welds.
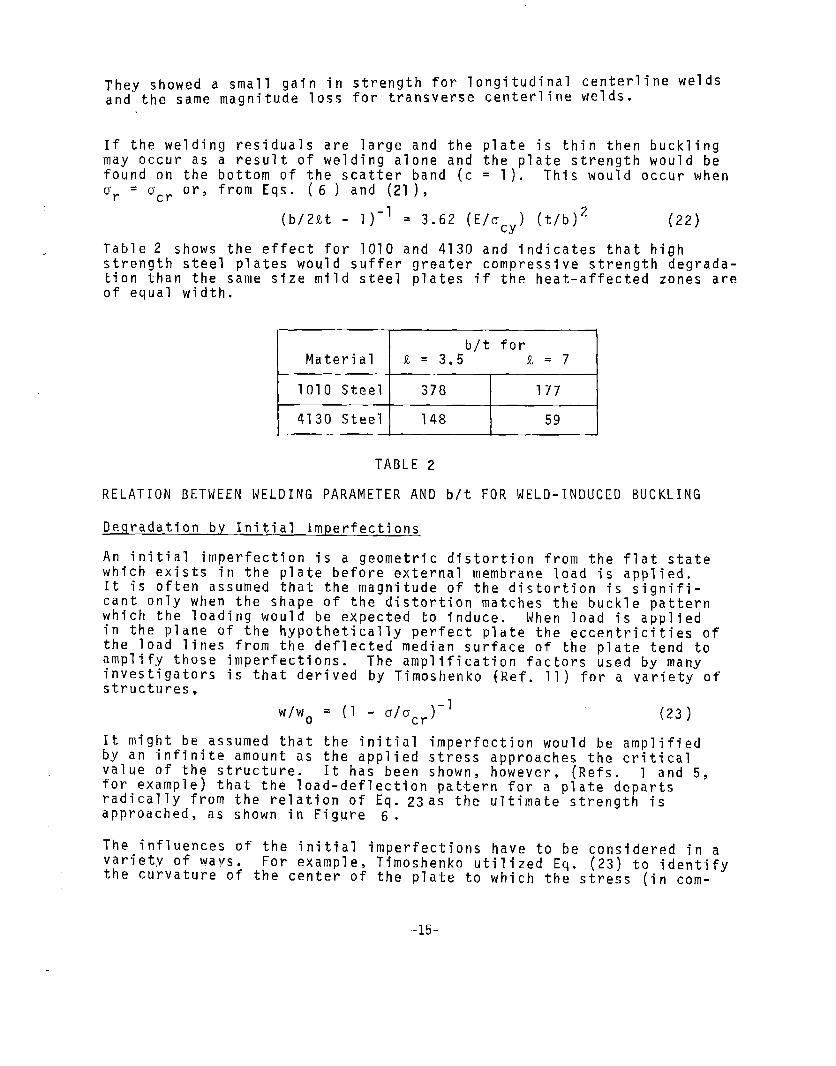
If the welding residuals are large and the plate is thin then bucklingmay occur as a result of welding alone and the plate strength would befound on the bottom of the scatter band (c = 1). This would occur whenOr=o ~r or, from Eqs. (6 ) and (21),
(b/2!zt - 1)-’ = 3.62 (E/ucy) (t/b)z (22)
Table 2 shows the effect for 1010 and 4130 and indicates that highstrength steel plates would suffer greater compressive strength degrada-tion than the same size mild steel plates if the heat-affected zones areof equal width.
b/t forMaterial k = 3.5 1=7
1010 Steel 378 177
4130 Steel 148 59
TABLE 2
RELATION BETWEEN WELDING PARAMETER AND b/t FOR WELD-INDUCED BUCKLING
Degradation b.y Initial Imperfections
An initial imperfection is a geometric distortion from the flat statewhich exists in the plate before external membrane load is applied.It is often assumed that the magnitude of the distortion is signifi-cant only when the shape of the distortion matches the buckle patternwhich the loading would be expected to induce. When load is appliedin the plane of the hypothetically perfect plate the ,eccentricities ofthe load lines from the deflected median surface of the plate tend toamplify those imperfections. The amplification factors used by manyinvestigators is that derived by Timoshenko (Ref. 11) for a variety ofstructures,
w/w. = (1 - cr/crcr)-’ (23 )
It might be assumed that the initial imperfection would be amplifiedby an infinite amount as the applied stress approaches the criticalvalue of the structure. It has been shown, however, (Refs. 1 and 5,for example) that the load-deflection pattern for a plate departsradically from the relation of Eq. 23as the ultimate strength isapproached, as shown in Figure 6 .
The influences of the initial imperfections have to be considered in avariet,v of ways. For example, Timoshenko utilized Eq. (23) to identifythe curvature of the center of the plate to which the stress (in com-
-15-

bination with the membrane stress) would reach the yield value atwhich point failure was assumed to occur. More recently, other theo-retical approaches (discussed bel’ow) incorporate the behavior in themathematics of post-buckling action.
Degradation by Internal Stress Deviations
It is shown below, in the section onexperimental boundary conditions,that there is no practical method of conducting a plate experiment sothat the boundary conditions are identical to those assumed theoreti-cally in conducting plate-strength analyses. One of the potentialdegrading factors is the restraint, at the loading heads, of thePoisson lateral expansion under the longitudinal stress field. If thefriction forces are large enough to permit complete restraint at thoselocations then a transverse compressive stress would be induced equalin magnitude to Vux. This laterally compressed zone might extend as
much as 3/4 of the plate width away from each loaded edge. The effectwould be to lower the level of the longitudinal stress at which buck-ling would occur. If loaded-edge rotational restraint is assumed tobe absent, and if the interaction curve for an elastic biaxial stressfield is employed, the longitudinal critical stress theoreticallycould be reduced by 40% or more.
2000
1000
0 4
FIGURE 6 POST BUCKLING CURVATURE
o
Curvature (Arbitrary Units)
.-16-
Experimental Boundary Conditions
Theoretically, the process of buckling is considered to occur suddenlyon a specimen to which the buckling boundary conditions are appliedonly at the onset of buckling and not before. Furthermore, the stressdistribution is assumed to be controlled precisely to a prescribeddistribution which is usually assumed to be uniform throughout the plate.An alternative assumption is that the end shortening is uniform at allload levels up to failure. It is virtually impossible to conduct abuckling experiment in complete consonance with the theoretical ideali-zation because of the practical difficulty of achieving those conditions.The plates of these investigations were loaded in a manner that inducedresistance to membrane strains, to transverse deflection and to twistingand bending at all load levels up to buckling. The prebuckling con-straints induced prebuckling load nonuniformities in each specimen.Furthermore, the loading platens continued to exert restraints of thetype just described during buckling, post buckling and failure. Theprecise measurement of those features wou’ld involve instrumentationconsiderably more extensive than the scope of this program permitted.
In spite of those effects, all specimens were assumed theoreticallyto be simply supported and uniformly loaded when a/b was equal to 3.It is doubtful that rotational restraint on the loaded edges wassignificant for specimens with a/b = 3 since the buckling stress fora clamped loaded boundary theoretically would be only 10 percent abovethe simply supported case for a/b = 3. The influence theoreticallycould have been much more for a/b = 1.5 and there is Indication thatthis was true. Therefore, it would be necessary to assess the importanceof this aspect of the testing process when checking correlation betweentheory and experiment, if the theory is based upon simply supportedloaded boundaries.
There is no known method of specimen design and loading that avoidsthese problems completely. Every loading device includes some measureof uncertainty. In the NSRDC experiments (References 5 and 12,for example) the use of gripping” structures a’may have affected the load distribution afterfriction which could have caused some of thegrip columns. As a result, the plate failureless than the apparent value from Px/Ax. The
ong the unloaded edgesbuckling because ofoad to be carried in thestress could have beenprimary virtue of square
tube tests is the high probability that the specimen faces providesimple support to each other on the unloaded edges. Furthermore, itis reasonable to assume loading symmetry at any cross section of thisspecimen if the load boundaries have been fabricated with a high degreeof flatness and if proper load distributing pads are used, as were donein these tests.
In addition to the rotational restraints possible at the loading heads,it is also possible for the membrane strains parallel to the loadededges to be restrained by the loading heads as result of the frictionbetween the head and loaded edge. This theoretically could induce atransverse membrane stress in the vicinity of the loaded edge as largeas Vax. The consequent biaxiality would lower the longitudinal critical
-17-
..
stress of the plate in the region of the loaded edge and therebyreduce the plate strength as was discussed above. This effect alsowould occur where transverse frames or bulkheads are welded to theplate. In some measure, therefore, the test procedure of this investi-gation simulated the action of plates in a ship.
Effect of Plate Length
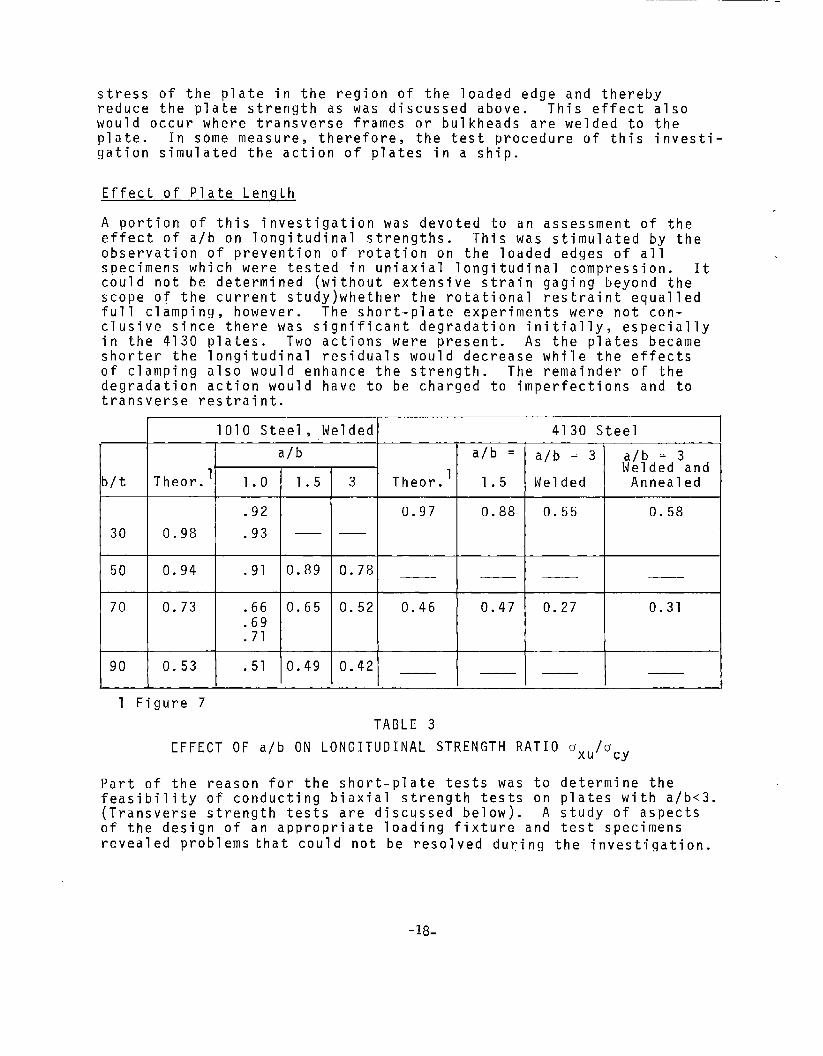
A portion of this investigation was devoted to an assessment of theeffect of a/b on longitudinal strengths. This was stimulated by theobservation of prevention of rotation on the loaded edges of allspecimens which were tested in uniaxial longitudinal compression. Itcould not be determined (without extensive strain gaging beyond thescope of the current study)whether the rotational restraint equalledfull clamping, however. The short-plate experiments were not con-clusive since there was significant degradation initially, especiallyin the 4130 plates. Two actions were present. As the plates becameshorter the longitudinal residuals would decrease while the effectsof clamping also would enhance the strength. The remainder of thedegradation action would have to be charged to imperfections and totransverse restraint.
b/t
30
50
70
90
—. ...-—.—
1010 Steel, Welde~ 4130 Ste:n
.heor. ”
0.98
0.94
0.73
0.53
I
a/b
1.0 I 1.5
. 92 I
.93 —
*. 71 I
a/b = a/b = 3~~?d;d3and
3 Theor.l 1.5 Welded Annealed
0.97 0.88 0.55 0.58
1.78 — —
0.52 0.46 0.47 0.27 0.31
I 1 I II
0.42 I — — I II I I 1
1 Figure 7
TABLE 3
EFFECT OF a/b ON LONGITUDINAL STRENGTH RATIO oxu/ucy
Part of the reason for the short-plate tests was to determine thefeasibility of conducting biaxial strength tests on plates with a/b<3.(Transverse strength tests are discussed below). A study of aspectsof the design of an appropriate loading fixture and test specimensrevealed problems that could not be resolved during the investigation.
-18-
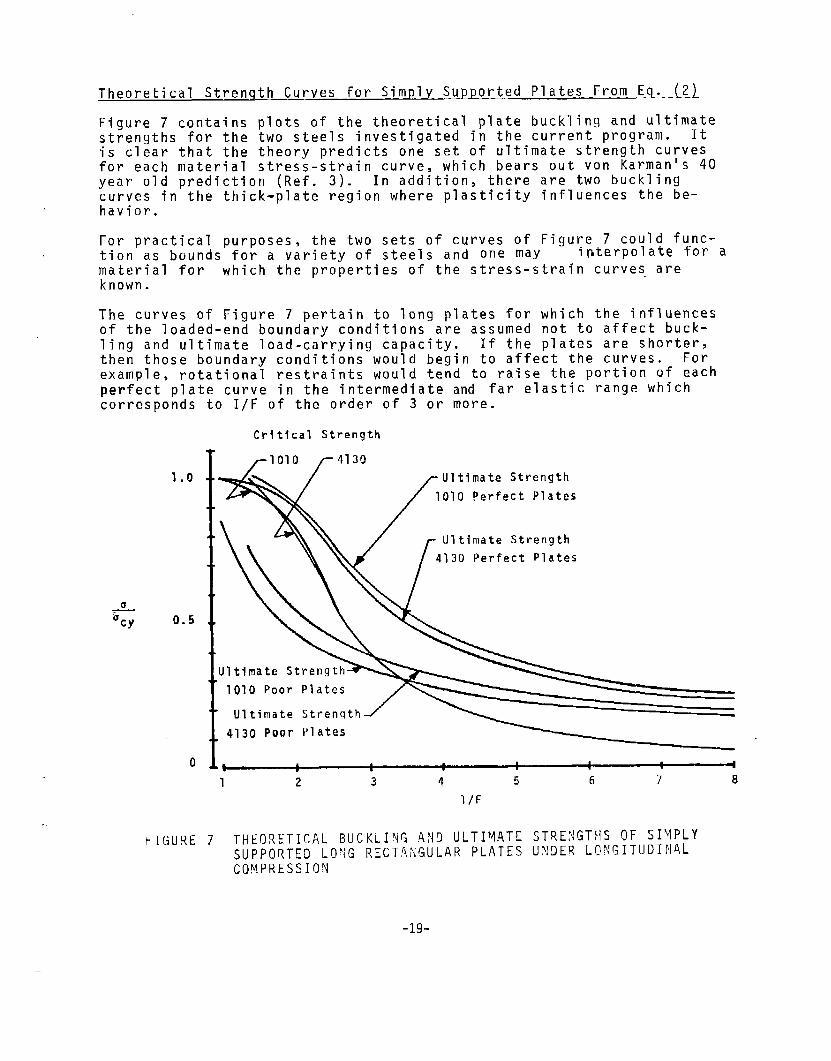
Theoretical Strenctth Curves for Simply Supported Plates From ECL. (2)
Figure 7 contains plots of the theoretical plate buckling and ultimatestrengths for the two steels investigated in the current program. Itis clear that the theory predicts one set of ultimate strength curvesfor each material stress-strain curve, which bears out von Karman’s 40year old prediction (Ref. 3). In addition, there are two bucklingcurves in the thick-plate region where plasticity influences the be-havior.
For practical purposes, the two sets of curves of Figure 7 could func-tion as bounds for a variety of steels and orle maY interpolate for amaterial for which the properties of the stress-strain curves- areknown.
The curves of Figure 7 pertain to long plates for which the influencesof the loaded-end boundary conditions are assumed not to affect buck-ling and ultimate load-carrying capacity. If the plates are shorter,then those boundary conditions would begin to affect the curves. Forexample, rotational restraints would tend to raise the portion of eachperfect plate curve in the intermediate and far elastic range whichcorresponds to I/F of the order of 3 or more.
Critical Strength
+acy
1.0
0.5
0
I ~’o’”po ~Llltimate Strength
I\#/;:::::;’4130 Perfect Plates
t4130 Poor Plates
——————— “1, * I
1 2 3 4 5 6 7 8
l/F
FIGURE 7 THEORETICAL BUCKLIYG AND ULTIMATE STRENGTHS OF SIVPLYSUPPORTED LOVG RECT?\NGULAR PLATES UNDER LONGITUDINALCOMPRESSION
-19-
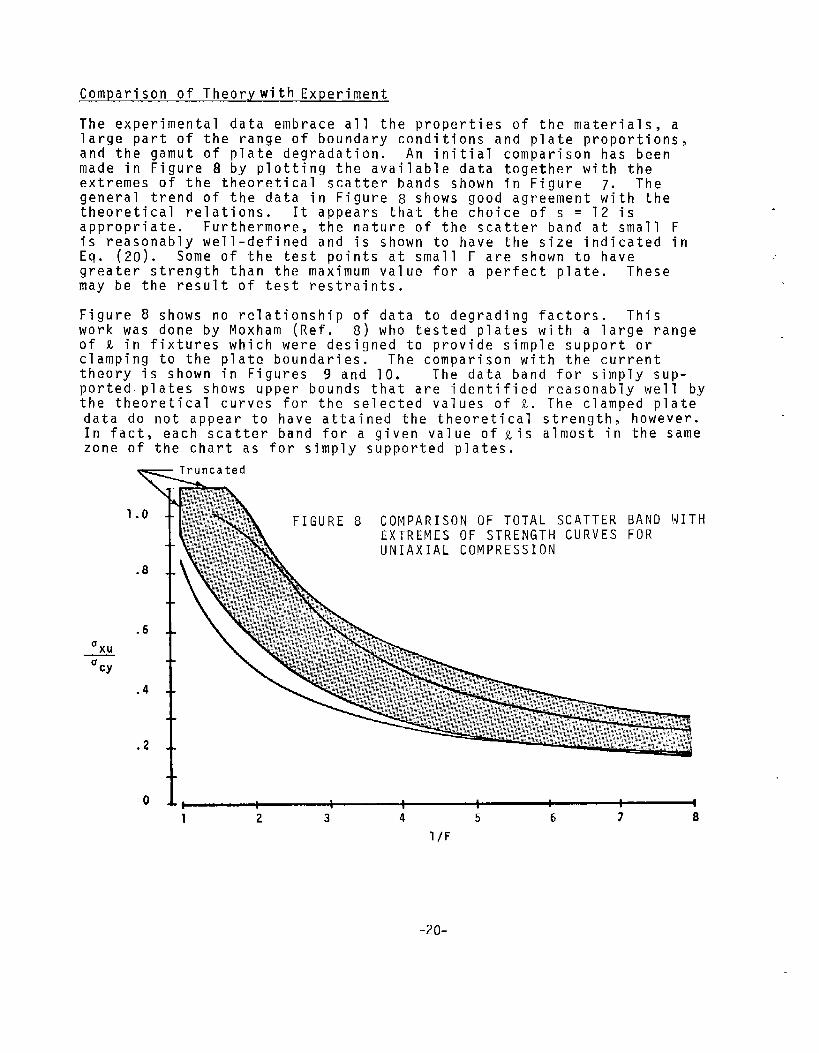
Comparison of Theory with Experiment
The experimental data embrace all the properties of the materials, alarge part of the range of boundary conditions and plate proportions,and the gamut of plate degradation. An initial comparison has beenmade in Figure 8 by plotting the available data together with theextremes of the theoretical scatter bands shown in Figure 7. Thegeneral trend of the data in Figure 8 shows good agreement with thetheoretical relations. It appears that the choice of s = 12 isappropriate. Furthermore, the nature of the scatter band at small Fis reasonably well-defined and is shown to have the size indicated inEq. (2o). Some of the test points at small F are shown to havegreater strength than the maximum value for a perfect plate. Thesemay be the result of test restraints.
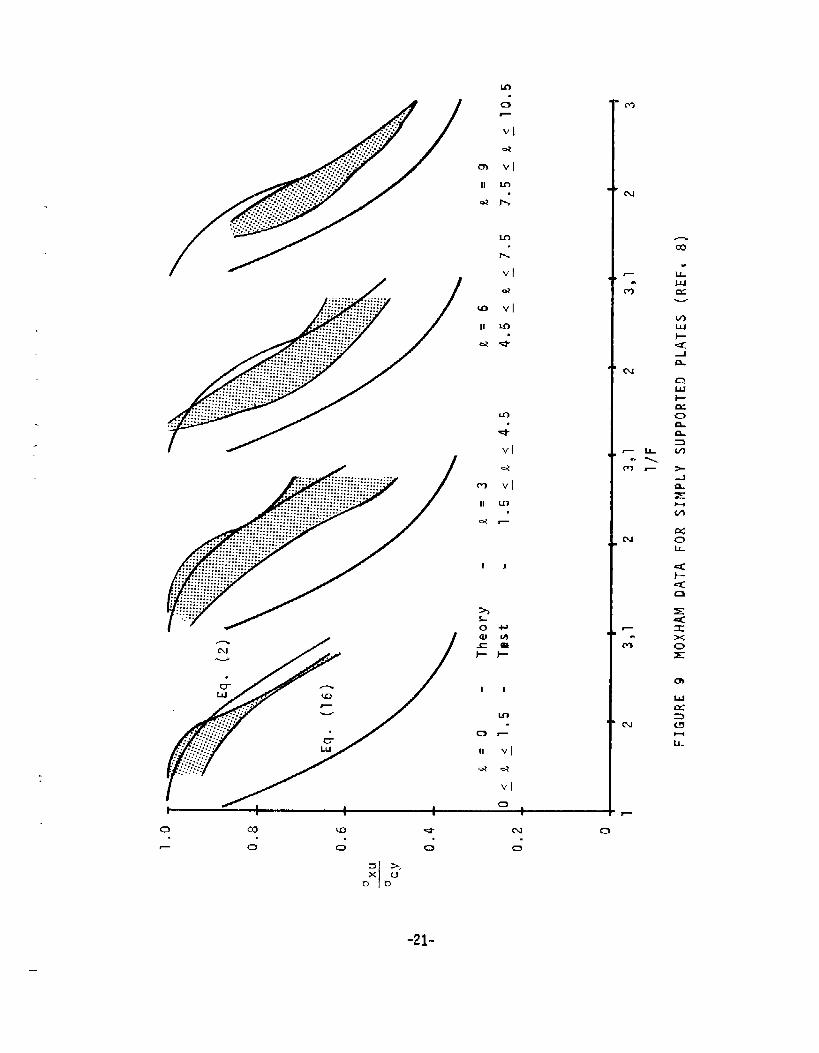
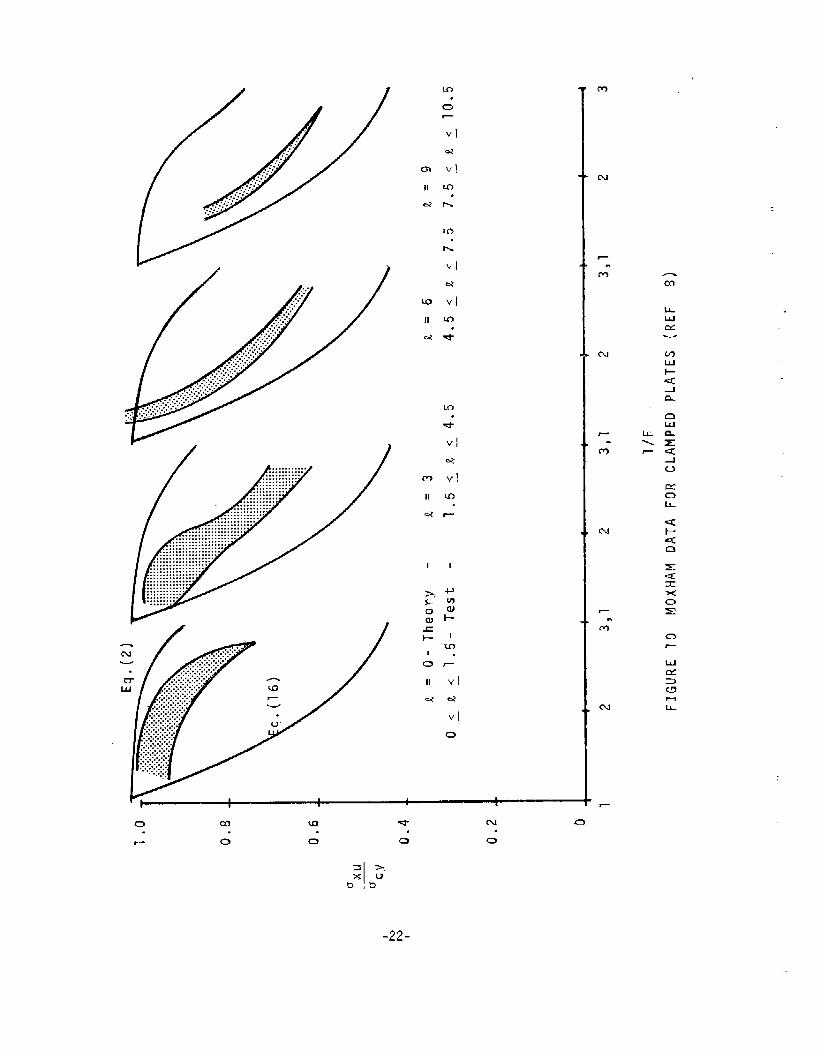
Figure 8 shows no relationship of data to degrading factors. Thiswork was done by Moxham (Ref. 8) who tested plates with a large rangeof L in fixtures which were designed to provide simple support orclamping to the plate boundaries. The comparison with the currenttheory is shown in Figures 9 and 10. The data band for simply sup-ported. plates shows upper bounds that are identified reasonably well bythe theoretical curves for the selected values of L. The clamped platedata do not appear to have attained the theoretical strength, however.In fact, each scatter band for a given value of ~is almost in the samezone of the chart as for simply supported plates.
‘Xu
aCy
o I, v # v I1 2 3 4 5 6 7 8
l/F
‘-20-
-21-
—
......
m
.
. ......
.-,
m
.m
Cu
J--
.
w
c-d
r.
m
ml
0 m a e N 0
I--
.
0 0 0 0
-22-

Many of the test specimens in the scatter band of Figure 8 were fabri-cated into shapes such as angles and channels by bending a flat plateinto the desired configuration. This could raise the compressiveyield strength of the plate material in the bend zone thereby generat-ing an increase in ultimate load-carrying capacity.
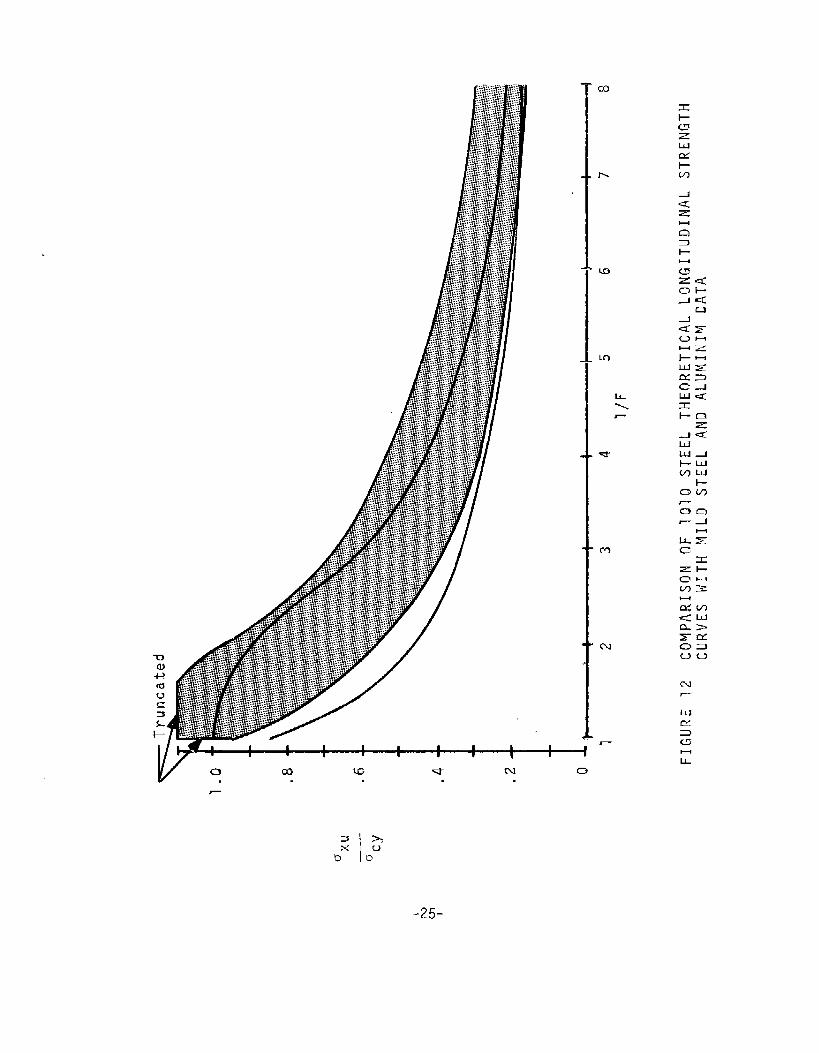
Figure II shows a comparison of data for high-strength steels with thetheoretical curves for 4130, while Figure 12shows a comparison of mildsteels and aluminum alloys with the 1010 curves. Theoretically, it isimproper to include the aluminum alloys in this comparison. However,many of those test specimens were formed by bending of initially flatplates into the desired shapes and the scatter band reveals the largegain in strength for the thicker plates which can occur as a result ofthat cold work. Material property data are not available to permitconstructing the theoretical aluminum alloy curves to Include thateffect. Consequently, they have been included in-Figure 12 only toreveal the magnitude of the achievable strength increase.
At this point it is possible to see the significance of the theoreticalbounds of the scatter band. The general agreement with the test datashow that no practical plate would be expected to have a strength lessthan the bottom curve. Also, perfect plates with simply supportededges probably would not exceed the strength level indicated by the topof the band. In fact, if a plate test should reveal higher strength itwould be well to examine the details of that test guided by some of thefactors mentioned above. It is important to indicate, in this regard,that Eq. (2) is not considered to be the most precise relation of platestrength. It agrees well with more basic theories, as discussed below;although there are differences. However, the important point is thatany well-founded theoretical perfect plate curve will provide an upperbound from which departures may not be charged to variations in plateparameters alone.
-23-

T
1 2 3 4l/F 5
6 7
FIGURE 11 COMPARISON OF 4130 STEEL THEORETICALLONGITUDINAL STRENGTH CURVES NITHHIGH-STRENGTH STEEL DATA
‘m
r..
m
Ln
IL-..7
*
O-Y
ml
0
mll--
UIx
H
IL
.25.

Other Theoretical Procedures for Simply Supported Plates
This section is intended as an overview of some of the more recentapproaches to predict plate strength. Most investigators utilizedeither a phenomenological theory or a strictly empirical approach.The differences among the various methods lie in the choice of themathematical model and in the influences of practical design consider-ations upon the fitting of curves through the experimental data. Inall cases a single curve has been utilized to predict strength for avariety of different materials, except for Dwight, Ractliffe andMoxham (Refs. 7 and 13) who incorporated the effects of initial imper-fections and residual stresses to obtain individual curves for thosetypes of degradation.
The phenomenological theories were essentially those of von Karman (theflange approach) and Bengtson (the flange and critical plate approach),both of which are mentioned briefly above. These would predict zerostrength for thin plates in contrast to experimental data which appearto show finite strength for large b/t.
Dawson and Walker (Ref. 14) have employed a variation of Coan’s theoret-ical procedure (Ref. 15) which utilizes a distribution of membranestress across the plate width that is slightly different from thatemployed in deriving Eq. (2). Dawson and Walker also have included adegradation term to account for imperfections. Their theoretical curve(Figure 13) is close to the perfect plate theory from Eq. (2) exceptfor the thick-plate end where the effects of plasticity have not beenincluded.
In Dwight and Ractliffe’s theory (Ref. 7) the plate unloaded edges wereconstrained by transverse edge stresses and the stress-strain curve wasassumed to be elastic-el astoplastic. They were able to account for theeffects of degradation and obtained good agreement with the experimentaldata.
Faulkner (Ref. 16) employed basic theory in conjunction with empiricalcurves. However, he utilized a tangent--modulus relation which would behighly specialized to tension stress-strain curves for mild steel.Faulkner also has explored another important strength problem. Thetheories that have been presented to date, including that which appearsin this report, are deterministic. They include the possibility ofmodifications to the theoretical curves as a result of changes in mate-rial properties, plate dimensions and degrading factors. Faulkner andMansour (Refs. 16 and 17) have investigated statistical approaches andhave found good predictive capability relative to the mass of experi-mental data. That approach could be amplified in scope by addressingeach of the relevant structural parameters (boundary conditions, typesof degradation, influence of material properties, etc.) and then per-forming a statistical evaluation for each parameter. For example, someof the reason for the existence of data above the theoretical perfectplate curve has been charged to boundary restraint. These may be takeninto account in defining a proper design curve for ship construction ifthe buckling boundary conditions of the ship plates can be identified.
-26-

Moxham (Ref. 8) calculated plate strength with a finite-element com-puterization based on the plastic variational principle in which resid-uals and imperfections are included. The analysis is based on anassumed elastic-plastic stress-strain curve (Es/E = 1 for E less s
and O for E > E ). He compared strengths theoretically for a var~~ty— Cyof values of ECV, E and b/t for each of several selected values of F.
He found the’ safie strength value over the total range of parameters ateach F value and concluded that strength could be related to l/F forall materials. This was in contradiction to the current result, and tovon Karman’s prognostication, that a different strength curve would berequired for each of a range of materials with different stress-straincurves.
In order to test the concept more accurately in a fundamental way itwould be necessary to Utilize the complete stress-strain curve in theyield region. It is doubtful that an elastic-el astoplastic curve(E> Oatc~&cv ) would be sufficiently accurate.
One of the inter~sting results of Moxham’s analysis was the indicationthat the ultimate strength of a plate could be attained with the ulti-mate amplitude of an imperfection of the order of the plate thicknessat the instant of failure. This differs from the value, used byDawson and Walker, of an ultimate imperfection equal to 4t. However,Moxham also showed little variation in ultimate strength for a largerange of initial imperfections and ultimate imperfections, both theo-retically and experimentally.
Dwight & Ractliffe (Ref. 7)
—---Theor,v
Dawson & Walker (Ref. 14)
FIGURE 13 1010 STEEL DATA
1 2 3 4 5 6 7 8
l/F
-2j’-

, .
Flange Strength
The general utility of the basic plate strength concept was testedby comparing the predictions to flange test data. The internalstress diagram of Figure 1 leads to Eq. (5)
cfxu/ocy = S(S + l)-l[l)e/i) + (1 - be/b)(] - c)ocr/(Tcy]
+ (s + l)-’ (5)
Stowell developed a basic theory of flange strength (Ref. 18). Itagrees with test data only at small values of F, which is proportional
to (ocy/ocr)”2. A comparison was made in Ref. lgusing test data
on cru~iforms and formed angles. The results are presented inFigure 14 together with Stowellls theory and also with Eq ~t(;a:.The theoretical bottom of the scatter band also is shown.obtained by letting c = 1 in Eq. ( 5), which yields
oxu/clcy = (she/b + 1)/(s + 1) (23)
This, also, is the same as for supported plates [Eq. (15)] exceptfor the factor of 2 before be/b.
The thinner scatter band was predicted above (p.17).
Stress-strain curves would be required to extend the theoretical curvesinto the plastic range for comparison with Ractliffe’s data (Ref. 24).
!4ew Theory, qaximum([;! ;;;fect H!noed Fl?ngas)
~ini~.m, (Large lmperfe. tions andResiduals)
— — —— Stowell (Ref.
Gerard (Ref. 19)
I
1.0 2.0 3.0
(Ocyhy
20)
FIGURE 14 FLANGE STRENGTH COMPARISONS
_7Q_

I.INIAXIAL TRANSVERSE STRENGTH
Introduction
The prediction of transverse strength is discussed in the followingparagraphs primarily to identify the aspect of the strength de-grading factor, which is slightly different in form from thatwhich affects longitudinally compressed plates,
Eq. (4) can be used to predict the strength of a transverselycompressed plate with a/b > 1. One of the problems in predictingtransverse strength is associated with the determination of thepostbuckling stress at the heart of the plate. In an extremelylong plate the transverse loading would tend to Induce wide-columnaction. A column is known to exhibit negligible postbuckling load-carrying capacity. For a square plate the postbuckling load wouldbe the same as for a long plate compressed longitudinally. Con-sequently it is necessary to define the transition of the post-buckling action for 1 ~ a/b < CO. This may be viewed as anadditional degrading factor.
Postbuckling Stress Distribution
The postcritical stress at the heart of a transversely compressedplate might be expected to approach zero for a perfect long plateunder transverse compression, to be equal to the critical stress(for a perfect plate) when a/b = 1, to decrease gradually at firstas a/b is increased from 1, and to approach the zero value asympto-tically. There is no information in the literature on this phenomenon.Furthermore, a basic mathematical solution of the problem was notattempted at the present time. It is an area for further research.The approach taken in this project was to assume a variation asshown in Figure 15, The coefficient a is expressed in the form
u = [(a/b’- 1)2 + 1]-’ (24)
It is a multiplier of o cr/ocy in Eq, (4 ) which now will take
the form
/0‘yu Cy
= S(S + 1)-1{ 2( be/ b) (b/a)
+ [1 - (2be/b)(b/a)(l - c)u(ocr/ocy)]}+ (5 + 1)-1
(25)
Effect of Residual Stresses
When a plate is welded on all four edges, residual stresses areinduced both longitudinally and transversely. If the two effectsare assumed to be separable and superposible, then the transversecomponent at the longitudinal centerline in the midlength would bepredictable in the same manner as for the longitudinal residuals.However, if the plate is long, then it is unlikely that the residualstress field will extend far from the short welded edges. It
, -29-

1.0
a
0.5
Q
u’
[
(:.1)%
1 2 3
d/b
FIGURE 15 ~RANSVERSE POSTBUCKLINGEFFECTIVENESS AT CENTEROF LONG PLATES
-30-

probably would be confined to a region that would extend lengthwiseno further than three-quarters of one plate width. In effect, thebehavior would be synonymous to flange action. On the assumptionthat pseudo flange width equals 3b/4, the residual transverse com-pression (on the assumption of rectangular and compression blocks)is
+ = (3b/4Lt - l)-l.Cy (26)
The effect of this residual stress distribution is to decrease thestrength in a zone nat far from a loaded edge but to leave it unaf-fected in the middle of the plate.
.Effect of Initial Imperfections
The critical imperfection shape for a transversely compressed longplate would be a transverse half wave which extends essentially thefull length of the plate. This is different in form from the criticalimperfection shape for longitudinal compression which would be pillow-shaped with a square periodicity. Therefore, it would be unlikelythat a long plate would be degraded simultaneously by a single imperfec-tion. In fact, if the initial imperfection were to match the longi-tudinal buckle pattern then the transverse buckling stress might beenhanced. However, the influence on strength may differ from theinfluence on buckling stress because the failure mode shape would be asingle buckle both longitudinally and transversely.
Stress Non-uniformity
If a plate were,to be compressed transversely~ the lengthwise poissonexpansion could be resisted thereby inddcing a biaxial field in a man-ner which is the reciprocal of the effect induced by longitudinal load-ing. In a laboratory test the frictional constraints would induce anaction of this nature unless steps were taken to permit free longitudi-nal motion. In the current series of experiments the use of a whiffle-tree avoided this problem. However, it also caused a departure fromthe behavior of a plate in a ship in which the longitudinal stiffeningsystem would induce such a constraint. It would be effective to asmall degree, however, since the stiffener cross-section area miqht be
Considerably less than that of the Plate or (at a maximum) of th~same magnitude as that of the plate.
Effect of Plate Length
Transverse strength tests were conducted on 4130 plates with alb = 1.5.The strengths were calculated using Eq. (25). For b/t = 30, ovu/ocv =
0.55 compared to the theoretical value of 0.71 while, for b/t L 70,”
‘vu/ocv ‘ 0.31 compared to 0.31 theoretically. As in the case of the
. .short longitudinal tests the results are not conclusive. Imperfectionswere still present while longitudinal residuals probably were reduced.There should have been no clamping action. However, some transversemembrane stresses should have remained as a result of the welding tothe end plates.
-31-

BIAXIAL STRENGTH
Introduction
The phenomenological uniaxial strength theory has been enunciatedand experimental support has been delineated. The primary physicalmechanism of plate strength is the attainment of the compressiveyield strength at the plate supported edges. In the uniaxial case,those were the edges parallel to the loading direction. The yieldstrength would be the value obtained from a uniaxial stress-straincurve.
In this section a theory is presented for biaxial strength based uponthe same general type of physical behavior is for uniaxial strength.The only difference is the utilization of a law of yielding for bi-axial fields. In the case of biaxial compression all four plateedges are under load. It is possible for failure to occur at eitherpair of plate edges. Therefore, it would be necessary to determinewhich set of edges reaches combined-stress yield first. In general,this determination can be made beforehand for a range of a/b andcharts can be constructed to identify plate strength. Charts are in-cluded in this report for a/b = 3 to compare theory with experiment.
The theory embraces the range from thick plates (for which plastic+buckling behavior controls) to very thin plates (in which the bucklingstress is an extremely small proportion of the maximum load-carryingcapability).
The theoretical approach has two aspects. One involves the identi-fication of the numerical loading combination for a specific platefrom which it is possible to compute Ocu. In the otherj nondimensional
relations ar~ presented for determining interaction under biaxialloading.
Upon completion of the presentation of the basic theory, the experi-mental data from the current test series and from Ref. 1 areemployed to depict the correlation with theory.
PrinciDle
As stated above, the biaxial-strength theory for plates is based onthe principle that the load-carrying capacity will be reached when thestress fiel”d at any edge satisfies the plasticity condition (Ref. 20)
(27)
For inelastic buckling, the ultimate load is assumed to be synonymouswith the critical load and plastic-buckling theory is directly ap-plicable. Furthermore, Eq. (27) is germane to inelastic-bucklingtheory as shown in Appendix II.
-32-
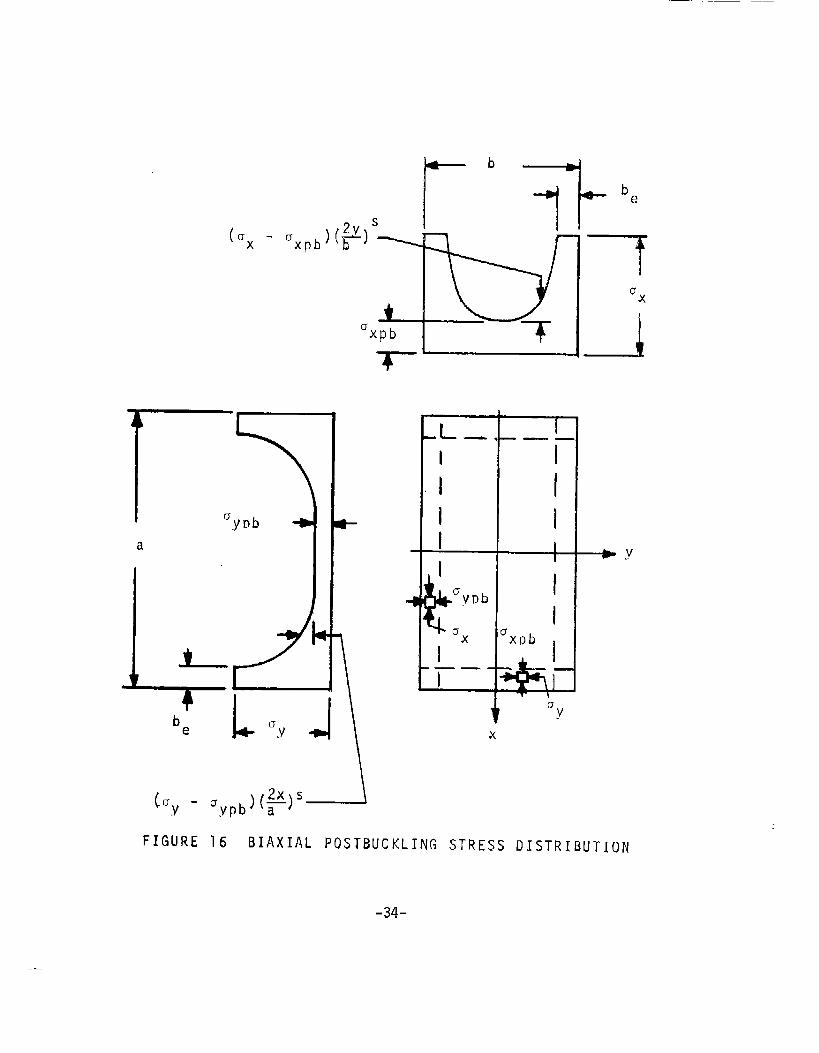
The post buckling stress field in a biaxially compressed rectangularplate that buckles elastically is assumed as shown in Figure 16.This model is an extension of the uniaxial phenomenological model. Thedifference is the set of biaxial fields in the edge regions.
It is possible to deduce a general aspect of biaxial strength from themodel in Figure 16. If the postbuckling stresses at the plate centerwere to be considerably less than u
Cy ‘then the edge stress could ap-
proach acv in either the x or the y direction. This means that there
would be little interaction between the strengths for any load combination.
The basic theoretical procedure employs Eqs. (2) and (25) for longitudinaland transverse strengths, respectively,
Uxu/acy = S(S + 1)-1{2be/b + (1 - 2be/b)(l - C)Ocr/@(2)
+(s +1)-’
‘1 2 be/b)b/a +a[/0‘yu Cy =s(s+1){( 1 - 2( be/ b) b/a](l - C)oy cr/ocy}
+ (s +1)-’ (25)
For a given load combination the edge stresses are computed using theplasticity condition of Eq. (27). However, no change in effective widthis assumed. This the~retically should involve little error since thereshould be 15 percent deviation at the most in the edge values ofa or ux
y at failure according to Eq. (27).
The application of the theory requires knowledge of the biaxial post-buckling x and y stresses at the heart of the plate. This, in turn,requires data on the effect of residual stresses, initial imperfections,constraint stresses and the influence of normal pressure. Anotheraspect of biaxial strength is the process of mode jumping in which aplate in biaxial compression will buckle in one mode (possibly 3 halfwaves longitudinally for a/b = 3) and fail in another (one half wavelongitudinally) as was observed during the experiments of Reference 1.This implies one set of stresses in the heart of the plate betweenbuckling and failure and another stress field at failure. Also, thebehavior would depend upon whether the test load is a uniform dis-tribution of membrane force (which was employed in the current studies)or a uniform membrane displacement.
These complexities were bypassed in the current study by utilizingL normalized interaction relations (See Figures 17-21) to see if the
elastic buckling interaction curve would be usable for thick plates, inwhich plastic buckling would occur, and to see if the stress intensityrelation would apply to thin plates, in which buckling would be elastic.This was attempted in Reference 1 without success, However, the uniaxial
_33_
t- ‘ --+
((Jx
●
by - aypb) ‘%)’1
I II II II I
I
k I‘VrhI
u‘xpb
lx——I
x
FIGURE 16 BIAXIAL POSTBUCKLING STRESS DISTRIBUTION
-34-

transverse strengths were not correctly determined in that studybecause of improper boundary conditions. More reliable values wereemployed in the current task based on uniaxial transverse strengththeory and on measured transverse strengths using end plates to enforcesimple support at the tube ends when ax = O.
In summary, then, the approach to biaxial ultimate strength determina-tion in this investigation was to utilize uniaxial strength data andthen to employ interaction relations in terms of the stress ratiosax/oxu and o /o In order to apply this procedure pi-operly to
.Y .Yu”biaxial strength prediction it is necessary to have a complete back-ground of data on uniaxial longitudinal and transverse strengths to beable to compute Oxu and o for practical plates.
yu
Comparison of Theory with Experiment
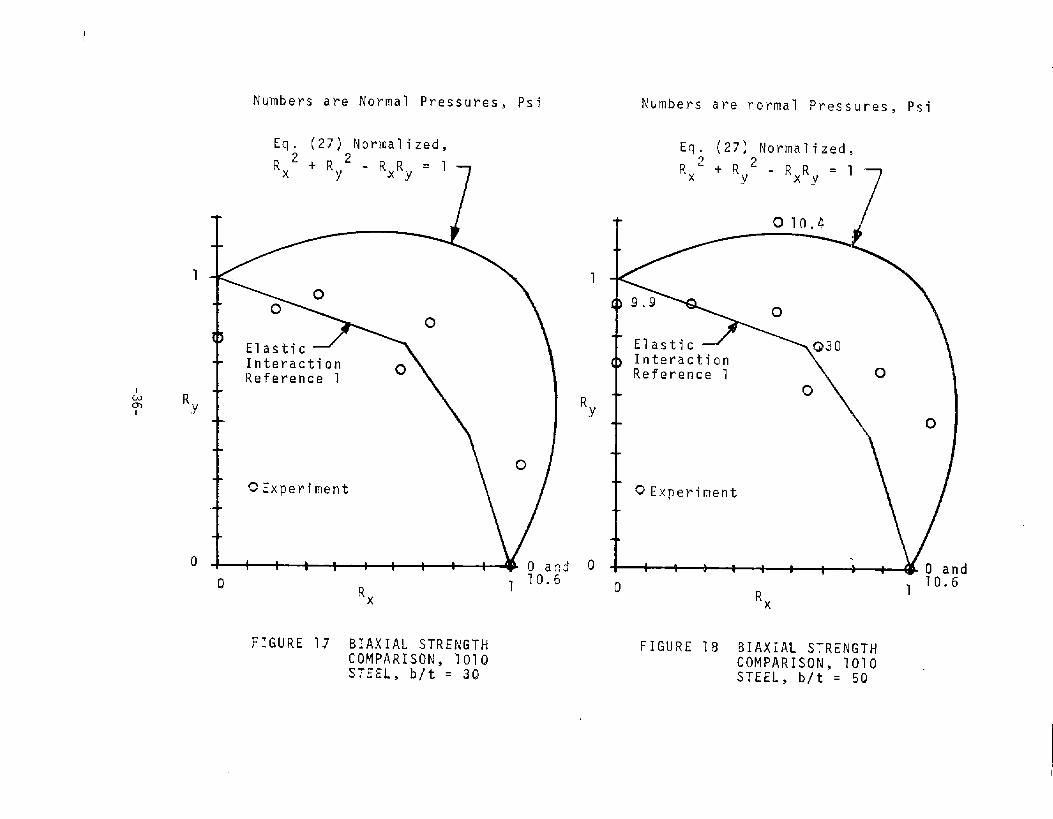
Figures 17 through 21 display the biaxial test results for 1010 and4130 steels. The reference ultimate strength for the 1010 steeltransverse stress ratio (R ‘Uy/Uyu ) was the theoretical value. The
Yexperimental value of axu was used for the longitudinal compression
stress ratio (Rx = Ox/axU). The circles on the Ry axes of Figures 17
through 20 depict the observed transverse strength for 1010 steels, inwhich improper boundary conditions were employed.
In the construction of Figure 21 the experimental transverse strengthswere used together with the experimental longitudinal strengths forboth stress ratios.
The general trend of the data for biaxial strength alone is seen tovary from the elastic interaction relation for b/t = 30 to the plasticstress intensity relationship Eq. (27) for b/t = 70 in the carbonsteel specimens. At b/t = 30 both the longitudinal and the transversecompression strengths approached yield. They were elastic at b/t = 90.
For 4130 steel the results appear to support the use of the stressintensity interaction law except for the welded plates with b/t = 30.The reason for the large values of RV on those specimens is not clear.
They may have been less degraded tha~ the other 4130 specimens. It isto be noted that the uniaxial longitudinal strengths were observed tolie close to the bottom of the theoretical 4130 scatter band for thetest specimens, for which b/t = 30 and 70.
The effect of normal pressure is not easily identifiable. In a fewcases the pressure did not appear to change the. position of the testpoint on the interaction diagram while, for other specimens, thestrengths appeared to have been shifted from the stress intensity lawto the elastic biaxial buckling interaction law. It would have re-quired a considerable increase in the scope of the project to testenough specimens at appropriate pressures to identify the trend ofbiaxial strength for selected stress ratios. A discussion of therelationship of normal pressure to biaxial strength appears below.
-35.
Am1
1
Ry
o
Numbers are Normal Pressures, Psi Numbers are normal Pressures, Psi
Eq. (27) Normalized,~ 2+R 2 - RR ,x Y Xy= 7
I
Reference 1
0Rx i 70”
1
RY
!?d o6
Eq. (.27) Normalized,
RX2+R2-RR=IY x y 7
Elastic
{) InteractionReference 1
Q Experiment
,, 10.60
Rx
FIGURE 17 BIAXIAL STRENGTH FIGURE ?8 BIAXIAL STRENGTHCOMPARISON, 1010 COMPARISON, 1010 ,STEEL, b/t = 30 STEEL, b/t = 50

RY
o
Numbers are Normal Pressures, Psi
Eq. (22) Normalized,
R2+Ry2-RxRy=lx
t
016
E?astic Interaction
4b
I
‘Y
o
Numbers are Normal Pressures, Psi
Ea. (22) Normalized,. .
Rx’ + R d - RXRY = ?.Y
t
Elastic Interaction
to Rx 110.6 0 Rx 1
FIGURE 19 BIAXIAL STRENGTH FIGURE 20 BIAXIAL STRENGTHCOMPARISON, 1010 COMPARISON, 1010STEEL STEEL

1
Ry
0
Q ,, 1
Rx
Eq. (22) Normalized,
~2+R2x Y
-RR=lXY
B
o
ED●
Wb/t = 30, Melded andNormalized
~b/t = 30, Welded
Ob/t = 70, Welded andNormalized
●b/t = 70, Welded
1P k b 1
●
FIGURE 21 BIAXIA L S~RENGTh COMPARISON) 413(I STEEL

EFFECT OF NORMAL PRESSURE
Longitudinal Strength
The application of normal pressure to a perfect plate would tend tobulge the plate into an initial imperfection, the shape of whichwould depend upon the plate boundary conditions. If the plate weresimply supported then the application of normal pressure to a longplate would tend to deform the median surface of the plate into asector of a cylinder with a cross-section shape approachingparabolic. The cylindrical shape would be constant except near theends where the deflection would be maintained at zero.
If the plate were to be subjected to longitudinal compression thecylindrical shape would stiffen the plate against buckling, whichwould occur as a continuous sine wave in a long flat plate. The con-sequent gain in buckling strength was investigated by Levy and hiscoworkers (Ref. 21) through the use of large-deflection theory. Asimple approximation was developed in Ref. 2 based upon the hypothesisthat the plate would behave as a section of a cylinder in compression.This predicts much smaller strengths than the Levy approach. However,it agrees reasonably well with the trend of the experimental datashown in Table 4.
1010 Steelp = 10 psi
b/t Theory Exper.
30 <0.01 <0.01
50 <(),01 <().()1
7H 0.04 0;06
90 0.26 -0.03
4130 Steelp = 30 psi
Theory I Exper. II
<0.07 0.06 I0.10 I 0.12 I
TABLE 4
LONGITUDINAL STRENGTH INCREASE, A(uxu/crcy), DUE TO NORMAL PRESSURE
The cylindrical shell theory requires the calculation of the centralradius of curvature of the cy-lindrical bulge. This can be done usingelementary beam theory. When the result is combined with the chartthat relates cylinder compression strength to shell geometry (Ref. 22),which is duplicated in Figure 22, the buckling strength relative to aflat plate can be computed with the relation
ucr/cl = 1 + 0.027 (Cp/E)2 (b/t)8cr flat
(26)
This approach is an approximation. It is subject to significant errorbecause of the fact that thin-wall cylinder strength prediction has alow degree of reliability (Ref. 22). This sensitivity
Yis reflected in a
range of values for C at any given value of (p/E)(b/t h. The curve inFigure 22 is an average.
-39-

1
c 0.1
0.01
10 102 103 104
R/t = (0.88 E/p)(t/b)2
FIGURE 22 BUCKLING COEFFICIENT FORNORMAL PRESSURE EFFECT,E~. (26)
-40-
The increase in longitudinal buckling strength should lead to a corre-sponding increase in longitudinal ultimate strength if the post-buck-ling stresses at the heart of the plate were to remain at the enhancedvalue induced by the normal pressure. The data in Table 4 would appearto support that hypothesis.
Transverse Strength
The same deformation shape that enhances longitudinal strength, as aresult of normal pressure application, would tend to degrade transversestrength. When a plate is loaded transversely under uniaxial compres-sion a single full-length imperfection would have the same form as thebuckle pattern. Furthermore, the initial amplitude of the pressure-induced deflection would be enlarged by the application of the trans-verse membrane load. These two actions would tend to drive the platecombined stress (membrane plus bending) to the yield strength therebyproducing premature buckling.
The premature loss of buckling strength in the heart of the transverse-ly compressed long plate should have little effect upon the ultimatestrength, however, since the post-buckling stress in that zone would besmall.
Biaxial Strength
When a plate is subjected to biaxial membrane loading the effect ofnormal pressure would depend upon the relative proportions of thelongitudinal and transverse loads. This can be seen in Figures 17through 21. It would appear that a go-no-go situation exists. Thereseems to be a critical pressure below which the biaxial plate strengthis not affected by normal pressure and above which the strength isdriven to a lower value which appears to lie in the region of theelastic interaction curve for biaxially loaded plates. The mechanism ofthis process is not clear. Calculations have shown that the transi-tional condition occurs when transverse membrane and the bendingstresses reach o However, as was pointed out above, the stresses
Cy .exist in” the heart of the plate where, under uniaxial transverse compres-sion, there is little post-buckling transverse stress in a lonq Plate.On the other hand, the longitudinal loading could induce asinusoidal buckle pattern which may inhibit the collapse of the plateunder the transverse loads through the initiation of a series of nodelines that act in the manner of transverse stiffeners. If the normalpressure is strong enough to drive the nodes to a stress intensityequal to yield then the plate should collapse. Otherwise, the biaxialstrength will be achieved in. spite of the normal pressure. This is anobvious area for further study.
-41-
MATERIAL COMPARISONS
Introduction
It is the purpose of this discussion to indicate the influence of com-pressive yield strength on the ultimate uniaxial compression strengthsof plates fabricated from different materials. It must be emphasizedthat these comments and conclusions pertain onl,y to compression andnot to tension.
The fundamental information utilized in this discussion is the stress-strain curve. Once the basic mechanisms for plate strength are iden-tified, the detailed evaluation of a given configuration requires theknowledge of the stress-strain curve.
Optimum Material for Thick Plates
Two steels with widely different yield strengths were used in thisinvestigation for obtaining experimental data. The stress-straincurves appear in Figure II-2. Consider a plate thickness such that thecritical strain is large enough to enter the yield regions for bothmaterials. This would be true for simply supported rectangular plateswith b/t = 30, for example. The longitudinal critical strain would be4,000 p. For perfect plates compressive load-carrying capacity isessentially the compressive yield strength. However, it is more real-istic to assume that ship plates will not be perfect. If the totaldegradation strain is subtracted from the perfect-plate critical strainthe result would be a relatively small strength loss for the weakersteel. However, depending upon the magnitude of the subtractivestrains, a large strength loss can occur in the stronger steel. Thisresult was observed in the current experiments.
One implication is that in a real ship structure the proportionate gainin compressive load-carrying capacity, when considering the use of ahigh-strength steel, may be considerably less than the increase in yieldstrength over that of a weaker steel. The yield strength increase forthe two steels of Figure 11-2 was 150%.The increase in plate strengthwas less than 60%. Essentially the same increase could have beenobtained using a material with a yield strength of approximately 70 ksiand a sharp knee (n = 20 or more).
Another im~lication is that the evaluation of relative structural per-formances can be made with no more information than the compressionstress-strain curve for each material under consideration. Thisassumes that the phenomenology of plate strength and the associated de-grading factors are now understood well enough to permit these materialcomparisons.
The preceding discussions are related to the strength of the platesalone. Ship plating is stiffened. The load-carrying capacity of thecombination could depend more on the stiffening system than on the plate.If the strength of the grillage depends primarily on the strength of thestiffening system as a set of columns then the above comments againwould apply. The plastic strength of a column is closely related to the
-42-
tangent modulus of the column material. Consequently, the criticalstrain under that condition would force the effective strength to theleft on each of the stress-strain curves. For most high-strengthsteels the knee is rounded somewhat in the manner shown for 4130 steel.Once again, the gain in load-carrying capacity may be significantlyless than the gain in yield strength.
Identification of Optimum Material
The preceding discussions have provided the background for the selec-tion of an optimum material for compression strength of plate. As inthe previous cases this pertains to uniaxial compression alone.
Suppose it is desired to determine the properties of a steel thatwould operate more effectively to resist compression. The first stepwould be the selection of plate proportions for very high loadings whichwould correspond to b/t of the order of 30. The next steps would be todraw the Young’s modulus line on graph paper (Figure 23) and to mark offthe critical strain on the strain axis. For many materials the critical
strain can be approximated by Ecr = (t/b)z so that Ecr = 0.0033. If a
vertical line is drawn at that strain value it will intersect theYoung’s modulus line at the stress level for a perfect plate.
Now reduce the strain level by the total degradation strain values. On ‘the basis of the data from this investigation that might be of theorder of 0.001. The net strain is then O.0023. If a vertical line isdrawn at that strain it will intersect Young’s modulus at a stress levelof approximately 70 ksi, assuming E = 30 msi.
This would be the largest practical yield strength for a steel with asharply rounded knee on the basis of the foregoing discussions.
When buckling occurs in the plastic range, the parameter F may be used toassess the change in ultimate strength with u
Cy .Since Uxu/o
cy decreases
with increased oCv
more or less in the manner” shown in Figure 7 then it
is clear that inc;eased a implies decreased ocY
Xula Cv for a given b/t and
E for l/F in the range between 2 and 6, say. At smaller F the value of/ocy‘Xu
would be independent of OCY. However, this range would involve
b/t va-lues which may be impractical- for ship construction.
Some of the information in the literature indicates attainment of ahigher fraction of yield strength for the stronger steels than wasobserved in the current studies on 4130 steel. These are traceable tothe plate restraints during testing.
-43-

Plastic acr
PerfectPlate
Plastic ucr
Practical +Plate
Degraded PlateCritical Strain
/ E for Material Class
E
Perfect PlateCritical Strain
FIGURE 23 DETERMINATION OF OPTIMUM YIELD STRENGTH FORPRACTICAL PLATES FABRICATED FROM GIVENCLASS OF MATERIALS
-44-
GRILLAGE FAILURE MODES
Int~oduction
The major portion of this research has been on rectangular flat plates.This section discusses the manner in which that information fits intothe overall problem of ship hull girder strength. The various modes ofinstability failure are examined and the relation of plate strength tohull strength is indicated.
Panel Failure
When a grillage is composed of longitudinally stiffened plates support-ed b.y transverses, the strength of the panel between the transversesmay be controlled by the column action of the plate-stiffener system.That is to say, if the plate strength exceeds the strength of thestiffeners acting as columns (together with whatever effective platewidth is brought into play) then panel failure may be the instabilitymode provided that all other failure modes have greater attainablestress levels. The column failure is assumed to occur in the same man-ner as a block cross-section column. Twisting and crippling would notbe a source of concern for this type of failure. In a column thechange from the straight state to the bent state is sudden. Further-more, there is no mechanism that would permit the column to carry anysignificant load beyond the critical value. Therefore, column failureunder a dead load is synonymous with buckling.
Stiffener Torsional Failure
Another possible instability mode would involve the rotation of thestiffeners between transverses. This could occur if the stiffenerspresented a slender cross section with a narrow flange. The resultantmovement of the flange translation perpendicular to the stiffener weband parallel to the plane of the plate as well as rotation about alongitudinal axis would result in another mode of collapse of thestiffening system and therefore of the panel between transverses.
Crip pling
The stiffeners may have sufficient column strength and sufficient tor-sional rigidity to stabilize the plating and withstand panel failureto a high enough level for design purposes. However, it is importantto insure a still higher level for stiffener flange buckling, which isa form of a general type of failure known as crippling. This type ofinstability almost invariably would take place in the plastic range.As a result flange buckling would be equivalent to flange failure.
General Instability
If the transverses are relatively light frames then the possibilityexists that the entire grillage will be subjected to instability inthe manner of an orthotropic plate. This type of buckling probablywould be synonymous with failure. Theoretically, the application ofproper boundary conditions to the grillage edges could permit thegrillage to carry load beyond general instability in a manner similar
-45-

to that in which a plate can have a strength greater than the bucklingstress. Howeve~, in the proportions of a practical ship, such asituation is unlikely.
Role of Plate
If the stiffeners are small then it would be reasonable to expect thatplate strength would equal panel strength, or perhaps general instabil-ity strength. If the stiffeners are large with column strengths con-siderably greater than the plate ultimate strength then the role of theplate may be small in controlling the panel strength and also generalinstability. There would need to be an effort to identify the proper-ties of the transition between those two extremes. For example, it isnecessary to know whether plate buckling would tend to degrade thecolumn strength of the stiffener to any extent. At present, thisinfluence may be considered small. It is probably considerably lessthan for a stiffened cylinder for which the effect first was identified.
Loadings
In the preceding discussions of this section the loading has implicitybeen assumed to be longitudinal compression only. Detailed examinationshave not been made of grillages loaded in biaxial compression. Only asmall amount of work has been done on any phase of biaxial compressionloading on plates. Therefore, it is not possible to identify reliablythe interaction of the plate with the stiffening system for such a loadfield. If shearing stresses were to be imposed in addition to biaxialloading, the problem is more complicated. The presence of the tensionfield in a shear buckling situation exerts a radical influence upon themovements of the grillage boundaries and brings into play a stronginteraction with the side shell that does not occur for longitudinalcompression.
Comparison of Failure Modes
In terms of overall bending strength of the ship hull girder, it isclear that a number of failure modes must be investigated to determinethe manner in which the grillage would be expected to exhibit instabil-ity. The edges of a plate are usually considered to reach materialyield strength at the time the plate fails. Consequently, all failuremodes of the stiffening system must achieve at least that same stresslevel and still be stable in order to drive the plate to the maximumload carrying capability.
It now remains to find a simple method of comparing the individualstrengths as identifed above. This is achieved most effectively.through the critical strain approach employing the stress-strain curve.It also is possible to utilize materials for stiffeners which havegreater strength than,materials used for plates. In this manner, itmay be possible to operate the stiffeners in the elastic range whilethe plate boundaries are at stresses in the neighborhood of the yieldstrength of the plate material.
w46-

The mode comparisons would be made by identifying the critical strainfor each type of instability identified above. The criterion for therelative strain magnitudes would be stipulated by the structuraldesigner. This process would be the most effective way to identifyeffectively the order of failure of grillage components made of mildsteel, which has a flat tangent modulus in the yield region.
CONCLUSIONS
The major conclusions to be drawn from the results of this investigationare as follows:
1. The basic theory of biaxial strength agrees well enough with ex-periments to be useful for ship design. However, the experimentalfoundation should be amplified with careful attention paid tocontrolling the boundary conditions and to identifying those whichact on plates in a ship.
2. In general, one set of strength curves is required for each struc-tural material covering the practical range-of residual stressesand initial imperfections from perfect plates to poor plates.
3. The compression stress-strain curve is indispensable in evaluatingplate strength, and conclusions about strength prediction could
be in error if only the parameter, l/F = (b/t)(Ucy/E)l’2, is used.
In that connection, the critical strain approach provides a simplemeans of accounting for strength degrading phenomena, which appearto be confined to reduction of the critical strength component ofthe ultimate strength.
4. It is possible to identify the yield strength of an optimum steel(or other material) for ship construction using stress-straincurves.
5. Plastic buckling in the yield range is synonymous with collapse.For a material with a relatively sharp knee the loss of strengthfrom degrading factors would be small compared to the strengthloss for elastically buckling plates.
6. The effects of normal pressure are predictable for uniaxialcompression. The mechanism for biaxial compression needs furtherstudy.
-47-

RECOMMENDATIONS
1. The biaxial strength groundwork should be tested in ship-sectionstructural models of larger scale than those employed during theseinvestigations. In each test sufficient instrumentation shouldbe provided to establish plate boundary conditions.
2. Compression stress-strain curves should be determined for the rangeof ship structural materials in use and contemplated. Enoughsamples o? each material should be tested to identify the size ofthe scatter band for statistical analysis.
3. Attempts should be made to incorporate realistic stress-straincurve properties in fundamental mathematical strength analysessuch as the application of finite-element computerization to plasticvariational theory.
4. Experiments on the influence of normal pressure on biaxial strengthshould be designed and conducted to amplify the data base.
5. Design studies should be promulgated to determine procedures foroptimizing structures for biaxial strength. Both minimum weightand minimum cost criteria should be used. Also, existing shipsshould be investigated to determine whether they have adequatebiaxial strength for the intended missions.
-48-

APPENDIX I - EXPERIMENTS AND DATA
Specimen Characteristics
In this series of experiments almost all specimens were 0.025-inchthick 4130 steel plates electron-beam welded into square cross-sectionbox tubes with a/b = 3, 1.5 and 1.0. Width/thickness, b/t, was 30and 70. Two tubes were made from l/16-inch thick 1010 carbon-steelplates with b/t = 70. The test specimen dimensions for the currentseries are shown in Figure I-1. Details of the 1010 steel specimensof the previous investigation appear in Reference 1 .
The compressive stress-strain curves are shown in Figure II-2. Thetest procedure was the same as in the previous study (Reference 1)except for a modification to the transverse loading fixture describedbelow.
The current transverse strength tests and biaxial compression testswere conducted on 4130 steel specimens with end plates. Figure I-2depicts the range of end fixtures studied and shown the dimensions ofthe plates selected for the test program.
Load-Application Devices
The test equipment was essentially the same as in Reference 1 . Minormodifications were required for the stainless steel specimens whichwere 0.025 inches thick compared to the 0.030 inch thick mild steelspecimens tested in Reference 1. In addition, the transverse load-ing fixture was redesigned with the purpose of achieving more uniformloading on all four sides.
The new transverse load device was a compressive whiffletree whichspread a single concentrated load into forces at eight equally spacedpads for a/b = 3 and into four pads for a/b = 1.5. The details areshown in Figures I-3 and I-4.
The whiffletree arrangement was employed to achieve maximum uniformityof transverse loading along the length of the specimen. It was antici-pated that this also would result in more uniform distribution offorces into each of the four plates in the square tube.
Data Acquisition
Membrane forces and tube internal pressures were measured throughgages described in Reference 1 and were recorded manually. The same istrue of strain during the trepanning studies to measure residualstresses. The strain data and the load for stress.strain curve deter-mination were recorded autographically.
Experimental Errors (Current Series)
The extreme variation in thickness was 2 percent but the mass of datayielded a variation of less than 1 percent. The largest departurefrom the nominal width (b/t = 30 was 2 percent. All others were of the
-49-
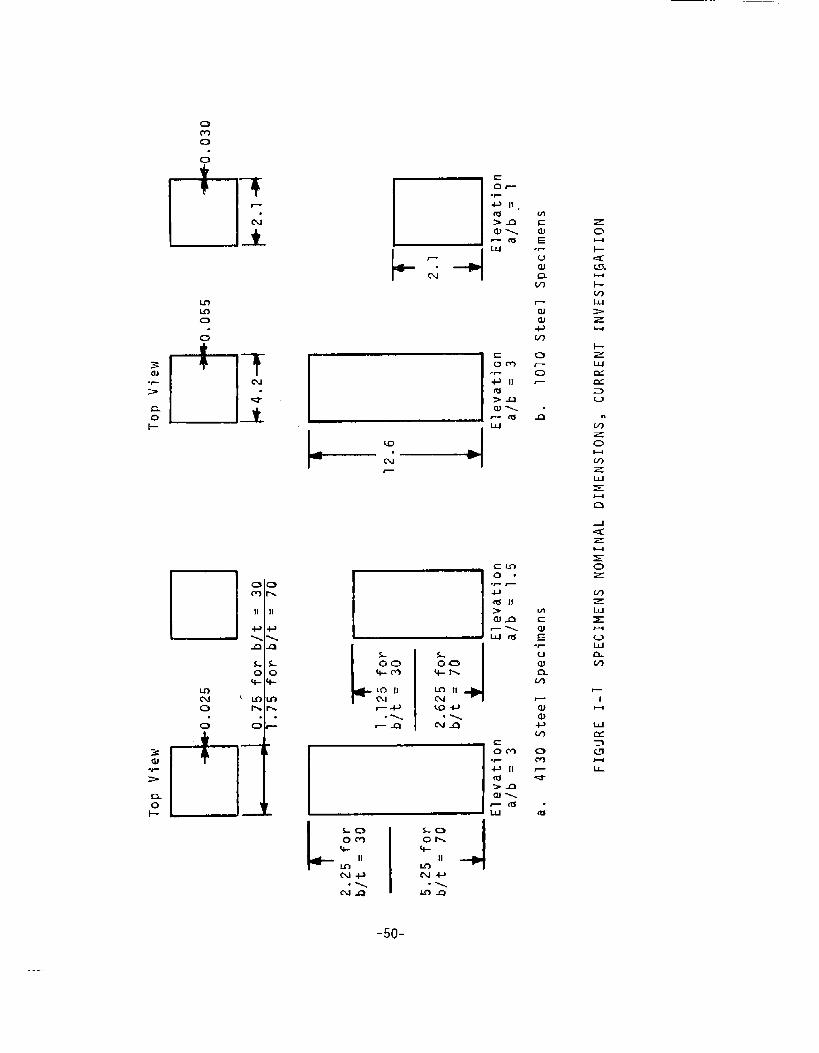
9mo
.
0
4J II,fu>-CI J-..-mw
oP
o
n .m
H
u-lzwEH
n
cmo.
.F r.lJm 11>an----Ufou
,
cOm
~r.1J II#>nw---
l-laLLl
&
L.5(3-
m“2

-il P-1/4” Square
a. Cruciform (Schematic)
imen Outline
m IJJ-
– 4-40Screw
—_—— —0.025” Thick 4130 Steel
I
I Electron Beam Weld to
I~Inne~ Surface of Plate
f’1k—_—__.—
b. Locally Attached Plate (Schematic)
r 0.025° Thick 4]30 Steel
I
Electron Beam MeldEnd of Plate
o QI ~7 n 0.45 for b/t = 70
to
c. Final Design Perforated Cover Plate
FIGURE I-2 END PLATE CONFIGURATIONS
-51-

o-lIv
/01
,500
-?E-.-–J–.
.~:
L-
.——
——- ,F.——--n,+0—r--,,-0 ,80
—
+
./s
,/500
Joo —
./87 ,L
r—/.<00—
..30-lr1
I
FIGURE 1734 WHIFFLETEEE FOR TRANSVERSE LOADING OF 4130SPECIMENS WITH b~t = 70

/25J
I .
li!i!iII
B2LA ,
L–––—.
25W
—,I
RFL-----
I
FIGURE 1-4 WHIFFLETREE FOR TRANSVERSE LOADING OF 4130 SPECIMENS WITH b/T = 30
—
v- /.00 —

order of 1/2 percent. Therefore, use of the nominal cross-sectionarea (instead of the directly measured value) could have involved amaximum error of 3 percent for b/t = 30 and 1.5 percent for all otherspecimens. Furthermore, the maximum departure from nominal of thetheoretical elastic longitudinal buckling stress could have been 6 per-cent for b/t = 30 but would have been less than 3 percent for b/tgreater than 30. All specimens were flat within 0.002 in.
All specimen lengths were smaller than nominal by 1 percent or less,which would have introduced a negligible effect on longitudinal buck-ling stresses ( and probably on strength also) since the buckling coef-ficient curve is flat at a/b = 3. There could be a maximum deviationof 4 percent in the theoretical wide column buckling stress and 2 per-cent in the applied transverse stress.
The maximum load variation could have been no more than 1/2 percent atthe longitudinal compression failure loads, and the same accuracywould apply to the transverse forces. The strain gage data are con-sidered reltable to better than 1 percent.
Young’s modulus in compression was 28.8 msi for one 4130 test specimenand 30.0 msi for the other which is 2 percent on either side of theaverage. It was 29.0 in both compression and tension for the 1010steel specimens. The compressive yield strengths at 0.002 offsetstrain were 102,500 psi and 98,700 psi for the 4130 specimens (2 per-cent either side of the average) while the average compressive yieldfor 1010 steel was 39,400 psi with a variation of 2 percent for sevenspecimens. These specimens are too few to permit a rational statisti-cal analysis on material properties. Average values were used inreducing the data and constructing theoretical curves.
Experimental errors for the previous tests are of the same order asabove. Details may be found in Ref. 1.
-54-
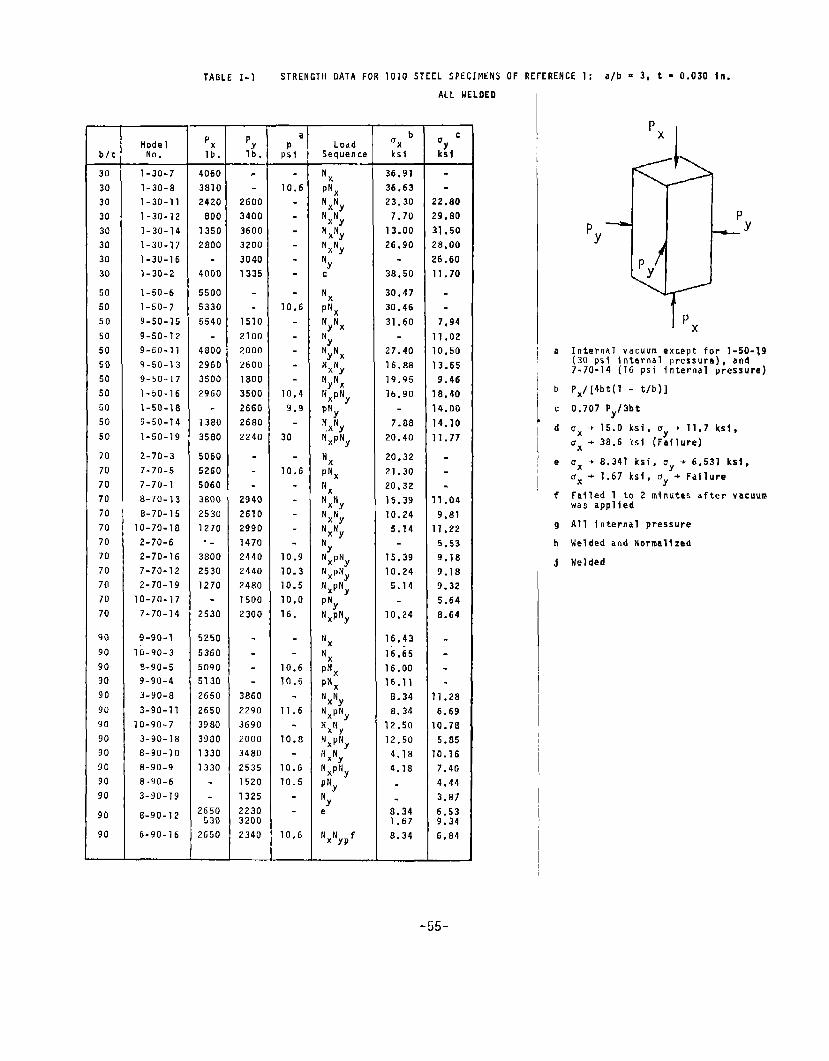
TABLE I-1 STRENGTH DATA FOR 1010 STEEL SPECIMENS OF REFERENCE 1: a/b = 3, t ■ 0.030 In.
ALL UELDED
b/t
7
303030
30303030
5050505050505050505050
707070707070707070707070
909090909090909090909090
90
90
ModelNo.
1-30.7
1-30-81-30-11
1-30-121-30-141-30-17
1-30-161-30-2
1-50-61-50-7
9-50-15
9-50-129-50-119-50-13
9-50-17
1-50-161-50-189-50-14
1-50-19
2-70-37.70-5
7-70-18-70-13
8-70-1510-70-182-70-62-70-167-70-12
.2-70-1910-70-177-70-14
9-90-1
IG-90-39.90-59-90-43-90-8
3-90-1110-90-73-90-188-90-108-90-9
8-90-63-90-19
8-90-12
6-90-16
Px
lb.
40603810
2420800
13502800
.
4000
55005330
5540
4800
296035002960
13803580
50605260
50603800
253o1270.-
38002530
1270.
2530
5250
536050905130
2650
26503980
398013301330..
2650530
2650
P
1;.
.
26003400
36003200
3040
1335
.
.
1510
2100
20002600
18003500
26602680
2240
.
.
294cI
26102990
1470244024402480
15002300
.
.
3860
2290
369020003480
2535
15201325
223032002340
a
P:i
.10.6
.
.
.
.
.
.
10.6
.
10,49.9
30
10.6..
.
.
10.9
10.310.510,0
16.
10.610.5
.
11.6.
10.8.
10.610.5
.
.
10,6
LoadSequence
Nx
PNX
NXNY
NN
N~N;
t4xNy
‘Yc
Nx
pNx
NYNXN
N;NX
NN
N;N;
Nxp Ny
PNY
N,xwy
NxpNy
Nx
PNXNx
?4XNYNN
N;N;NyNxpNyNXPNY
NxpNy
PNyNxpNy
Nx
Nx
PNXPNXNXNY
Nxp Ny
NXNY
Nxp Ny
IixNy
NxpNy
p WY
Ny
e
NxNypf
bQxksl
36.9136.6323.30
7,70
13.0026.90
.
38.50
30.4730.46
31,60.
27.40
16.8819.9516,90
7.8820.40
20.3221.30
20.32
15,3910.24
5.14
16.39
10.245.14
10.24
16,43
16.65
16.00
16.11
8.34
8.34
12.50
12.50
4.18
4.18
.
.
8.341.67
8.34
c‘Yksi
.
.2,809.80
1.508,00
6.60
1.70
.
.
7*94
1.020,50
3.659.46
8.40
4.00
4.10
1.77
.
.
1.049.811.22
5.539.18
9.189,32
5.64
8.64
.
.
1.28
6,690.78
5.850.167.40
4.443.07
6.539.34
6.84
ia Interns(30 psi7-70-14
II b Px/[4bt
c 0.707 P
vacuuminterns(16 psi
1 - tfb
/3bt
] Px
except for l-50-~9pressure) , and
internal pressure)
1
bd Ux+ 15.0 k.si, Uy+ 11.7 ksi,
1Ux + 38.5 isi (Failure)
/e Ox + 8,341 ksi, uY
+ 6.531 ksi,
i ‘x+ 1.67 ksi, u + Faf lure
Y
f Failed 1 to 2 minutes after vacuumwas applied
g All internal pressure
h Welded and Normalized
j Welded
-55-
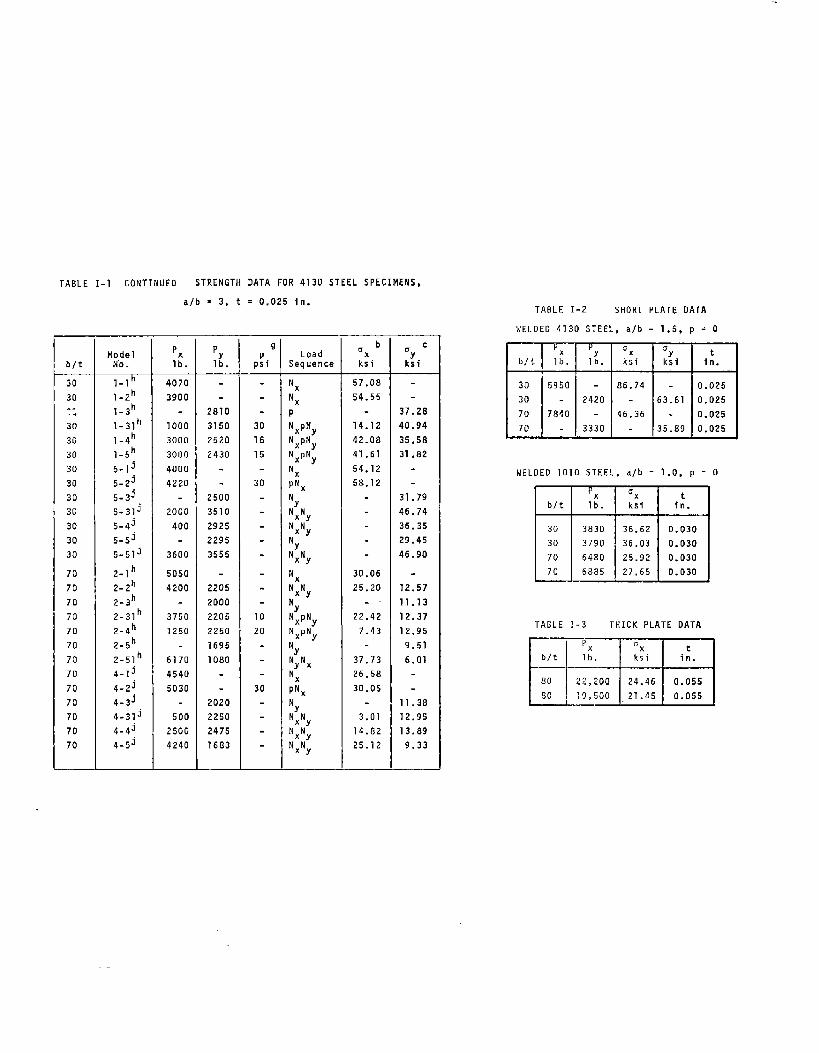
TABLE I-1 CONTINUED STRENGTH DATA FOR 4130 STEEL SPECIMENS,
blt
30
30...430
3030
30303030
303030
70
7070
7070
707070
7070
707070
ModelN“o.
I-lh
I-zh
l-3h
l-31h
l-4h
l-5h~-lj
5-2j
~.3j
5+31j
5-43S-5J
5-51J
2-lb
2-2h
2-3h
2-31h
2-4h
2-5h
2-51h4-lj
4-2j4-3j
4d31j
4-43
4-5j
a/b = 3, t = 0.025 In,
Px
lb.
40703900
.
10003000
3000
40004220
2000
400
3600
5050
4200
37501250
6170
45405030
500
25004240
P
1:.
.
2810
31502520
2430..
25003510
292522953555
22052000
22052250
16951080
.
20202250
24751683
9
p!i
.
.30
1515
30
.
.
1020.
.
30
.
LoadSequence
Nx
Nx
PNxpNyNxpNyNXPNY
NxPNX
NN:NY
NXNY
‘YNNXY
NxNXNY
Ny
NxpNyNxpNy
‘YNNy%NxpNxNNYN
N:N;NXNY
b‘xksi
57.08
54.55.
14.12
42.08
41.61
54.12
58.12
.
.
30.06
25.20
-.
22.42
7.43
.
37,73
26.58
30.05
3.01
14.82
25.12
c“Yksi
37.2840.94
35.5831,82.
31.7946.7436.3529.45
46.90
.
12.5711.13
12.3712.95
9.516.01
11.3812.95
13.899.33
TABLE I-2 SHORT PLATE DATA
WELDEO 4130 STEEL, a/b = 1.5, p = O
30 5950 - 86.74 - 0.02530 - 2420 - 63.61 0.02570 7840 - 46.36 - 0.025“70 - 3330 - 35.89 0,025
WELDEO 1010 STEEL, a/b = 1.0, p = O
Px ~xb/t lb. ksi i;.
30 3830 36.62 0.03030 3790 36,03 0.03070 6480 25.92 0.03070 6885 27.65 0.030
TABLE 1-3 THICK PLATE OATA
——P ~‘x
b/t lb. ksi i:. I80 22,200 I 24.46 I 0.05580 , 19,500 21.45 0.055 I
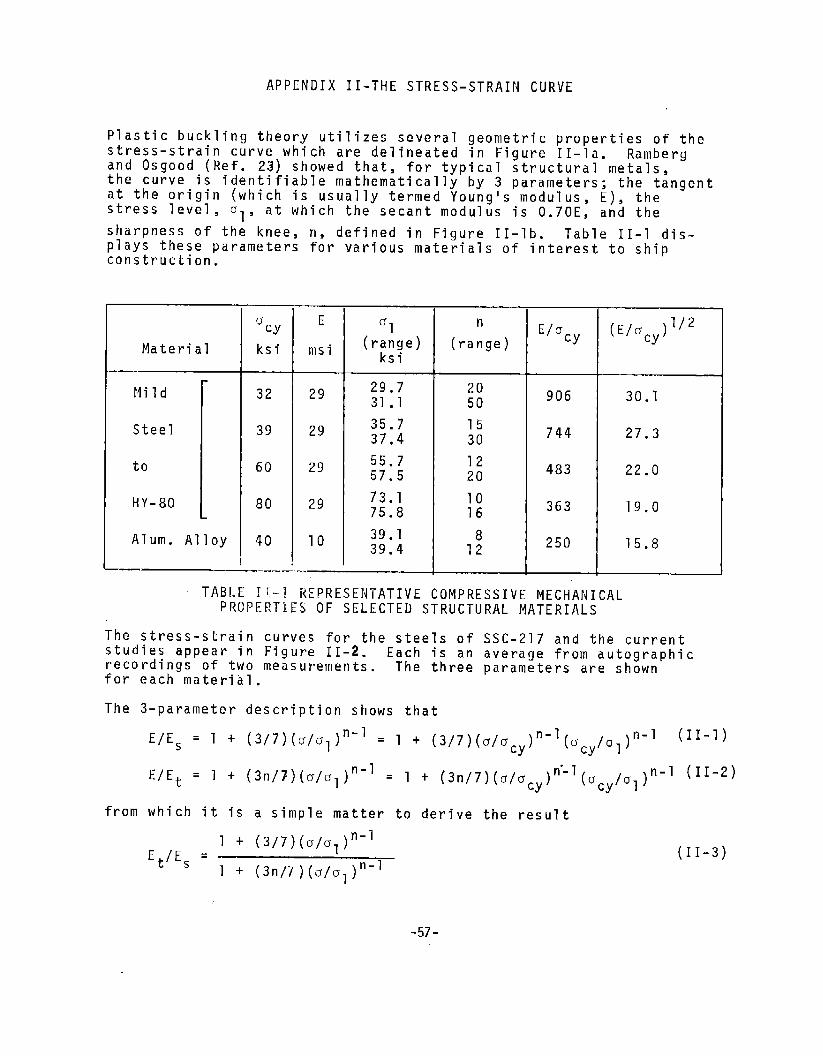
APPENDIX II-THE STRESS-STRAIN CURVE
Plastic buckling theory utilizes several geometric properties of thestress-strain curve which are delineated in Figure 11-la. Rambergand Osgood (Ref. 23) showed that, for typical structural metals,the curve is identifiable mathematically by 3 parameters; the tangentat the origin (which is usually termed Young’s modulus, E), thestress level, al, at which the secant modulus is 0.70E, and the
sharpness of the knee, n, defined in Figure II-lb. Table II-1 dis-plays these parameters for various materials of interest to shipconstruction.
GCy E
al nE/ocy (E/acy) l/2
Material ksi msi(r:;fe) (range)
1-Plild 32 29
29.7 2031.1 50
906 30.1
Steel 39 29 35.7 1537*4 30
744 27.3
to 60 29 55.7 1257.5 20 483 22.0
HY-80 80 29 73.1 1075.8 16
363 19.0
Alum. Alloy 40 10 39.1 839.4 12
250 15.8
.— --- —-...—
TABLE 1:!-1 REPRESENTATIVE COMPRESSIVE MECHANICALPROPERTIES OF SELECTED STRUCTURAL MATERIALS
The stress-strain curves for the steels of SSC-217 and the currentstudies appear in Figure II-2. Each is an average from autographicrecordings of two measurements. The three parameters are shownfot- each material.
The 3-parameter description shows that
E/E~ = 1 + (3/7) (u/o, )n-’ = 1 + (3/7) (o/ocy) n-l (~cy/@n-1 (II-1)
E/Et = 1 + (3n/7)(0/al)n-’ = 1 + (3n/7)(a/ucy)n”-’(~cy/U1)n-’ (11-2)
from which it is a simple matter to derive the result
1 + (3/7)(u/al)n-’Et/Es = (II-3)
1 + (3n/7)(o/01)n-’
-57-

Pn , Shape Factor
L1coI
&
a, Curve Properties Showinq 3Parameters of Ramberg andilsgood
‘tdu/dE
50
n
10
51
~) . 1.2
al/~2b. Determination of n
FIGURE 11.1 THREE PARAMETER DESCRIPTIONS OF STRESS-STRAIN CURVES
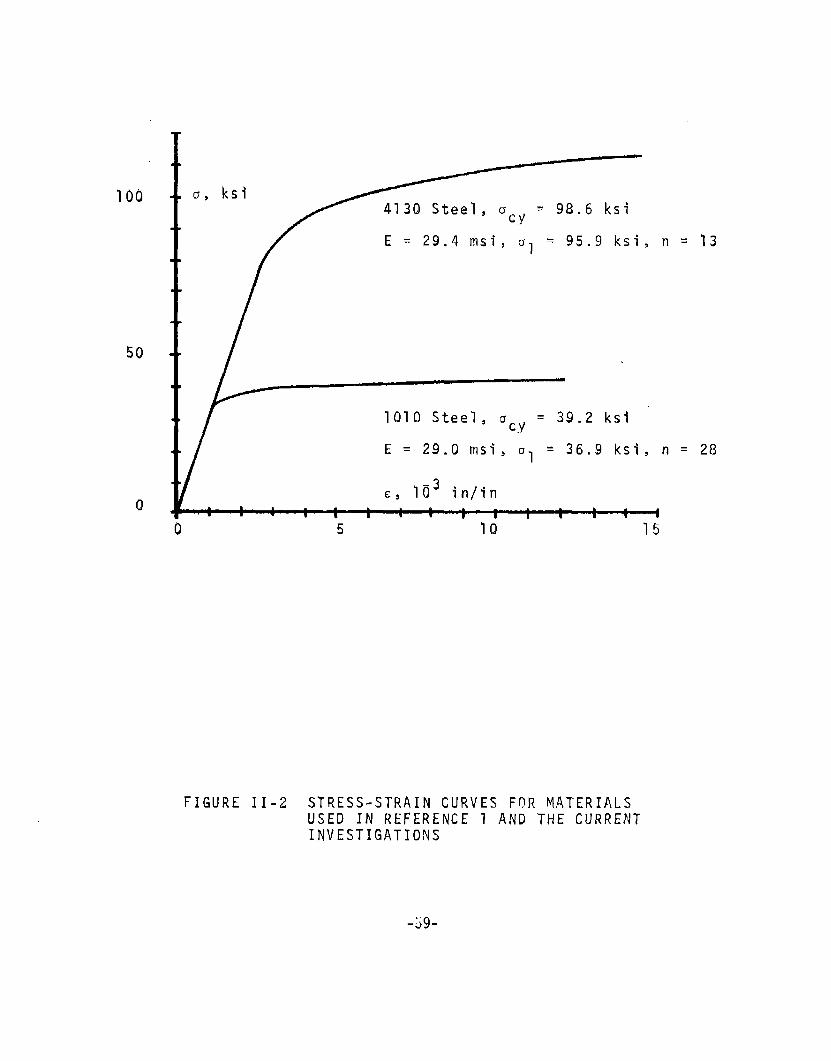
100
50
c1
T
U, ksi
/-===
E = 29.0 msi,‘1
= 36.9 ksi, n
E, 103 in/in
E = 29.4 msi,‘1
= 95.9 ksi, n = 13
1010 Steel, acy = 39.2 ksi
o 5 10 15
= 28
FIGURE II-2 STRESS-STRAIN CURVES FOR MATERIALSUSED IN REFERENCE 1 AND THE CURRENTINVESTIGATIONS
-39-

n .. .
From the conventional definition of the compressive yield strength,o ~y, the compressive yield strain is
ECy = 0.00z + Ocy/E
and since Es = U/E, Eq. (II-4) reveals that
E/E s Cy = EE/Ocy = 1 + 0.002E/aCy
Consequently,
(ocy/u, )n-’ = 0.00467E/ucy
(II-4)
(II-5)
(II-6)
which shows that o ~ o ~ since E/a > 214 for ship materials
(see Table II-l). CyCy
The proportional limit is often expressed as the stress at an offsetstrain of 0.0001,
‘pl = ‘“000’ + ‘pi/E(II-7)
This may be combined with Eq. (II-4) to obtain
‘pl /ocy ‘ 20-’/n (II-8)
For n = 10, u /opl Cy = 0.74. For mild steel (n = 20, say) compared
to high strength steel (n = 10, say)
(“pllucy)n=zo /(5pl/o~y)n=10 = 1.162
This result becomes significant when materials are compared forcompressive efficiency.
-60-

APPENDIX III POLYAXIAL PLASTIC BUCKLING
An approach to the analysis of plastic buckling in flat plates waspresented by Stowell (Ref. 20). The analyses in this section make
use of his differential equation for rectangular plates
cla4w/ax4 - c2a4w/ax3ay + 2c3a4w/ax2ay2 - c4a4w/axay3
+ c5a4w/ay4 + (!ix/D’)a2w/ax2 + 2(N xy/D’)a2w/axay (III-1)
+ (Piy/D’)a2w/ay2 ‘ o
using Di = Est3/9 and in which w is the out-of-plane movement.
A tractable solution for a simply supported plate in biaxial com-pression (and also shear under certain conditions) has beenemployed in the form (with x in the a-direction and Y in the b-direction).
w = wosin[(mm/a)(x + c.y)]sin(n.Y/b) (III-2)
which assumes one-half wave in the y direction.into Eq. (III-1),
When substituted
C1(mm/a)4 - c2zj(mn/a)4 + 2C3(mm/a)2[(cmm/a)2 + (m/b)2]
- C4G(mm/a)2[(Gmm/a)2 + 3(m/b)2] + C5{[(cmm/a)2 + (n/b)2]2(III-3)
+ 4G2m2~4/a2b2} = (Nx/D’)(mm/a)2 + 2( Nxy/D’) (mm/a)2
+ (Ny/D’)[(Cmn/a)2 + (n/b)2]
The coefficients are as follows
In the plastic region
C1=l - $UX/q)2(l - Et/Es)
C2 = 3( OxT/ai2)(l - Et/Es)
C3 =1- ;[(5XOY + 2T2)/Oi2](l - Et/ES)
C4= 3(0yT/0i2)(1 - Et/E~)
C52(1 - Et/Es)= 1 ~ ~(Oy/ai)
In the elastic region
C1=l
C2=C
C3=1
C4= o
C5= 1
-61-
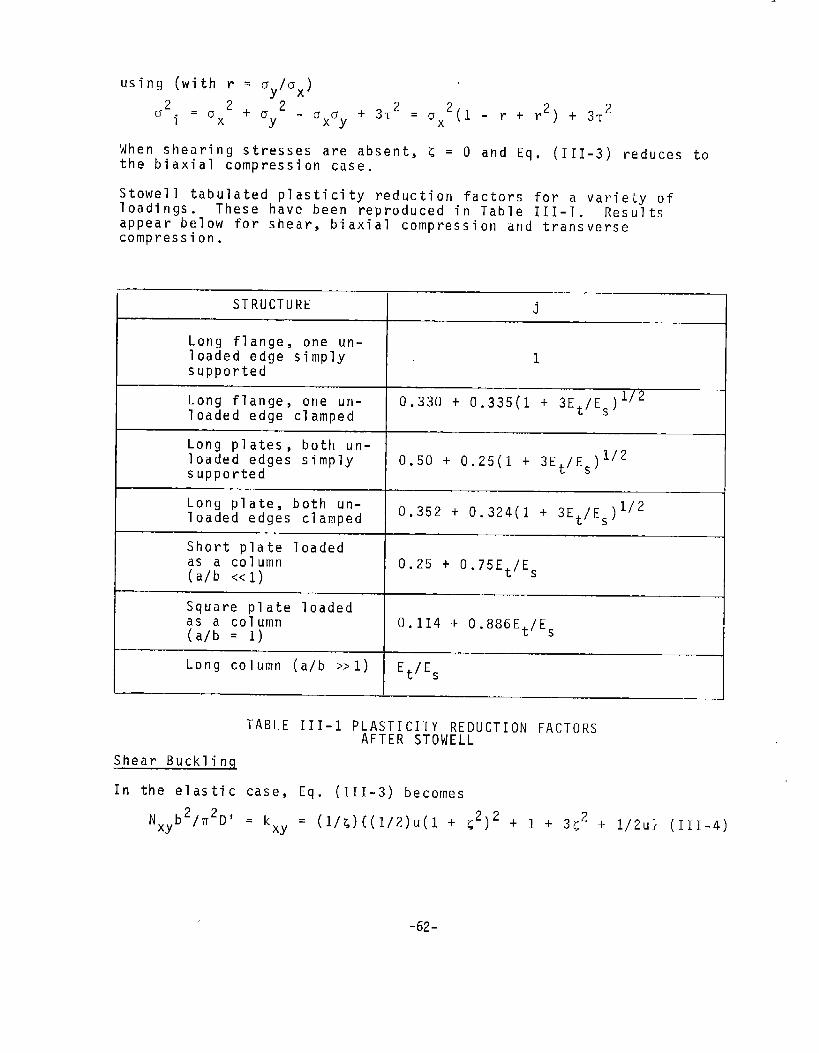
using (with r = oy/ux)
~’ 2+a2-ax~y +~=2=~x2(~ -r+r2)+~~2i
‘o x Y
When shearing stresses are absent, C! = O and Eq. (III-3) reduces tothe biaxial compression case.
Stowell tabulated plasticity reduction factors for a variety ofloadings. These have been reproduced in Table III-1. Resultsappear below for shear, biaxial compression and transversecompression.
STRUCTURE j
Long flange, one un-loaded edge simply 1supported
Long flange, one un- 0.330 + 0.335(1 + 3Et/Es)l/2loaded edge clamped
Long plates, both un-loaded edges simply 0.50 + 0.25(1 + 3Et/Es)l/2supported
Long plate, both un-loaded edges clamped 0.352 + 0.324(1 + 3Et/E#2
Short plate loadedas a column 0.25 + 0.75Et/Es(a/b <<1)
Square plate loadedas a column(a/b = 1)
0.114 + 0.13tIbEt/ES
Long column (a/b >>1) Et/Es
TABLE III-1 PLASTICITY REDUCTION FACTORSAFTER STOWELL
Shear Bucklin~
In the elastic case, Eq. (111-3) becomes
Nxyb2/~2D’ = kXy = (1/ G){(l/2)u(l + C2)2 + 1 -I-3C2 + l/2u} (111-4)
-62-

This is exactly the same relation, presented by Timoshenko (Ref. 11),which was based on-l~~e use of energy procedures. Through mini-
mization, L = (2) and u = 2/3. These yield kxy = 5.66, which
is 6 percent Greater than the infinite series value of 5.35.
Eq. (III-4) applies to infinitely long plates. For plates offinite length, the expression
kXy
= 9.34 - 4.00(1 - b/a)l/2 (III-5)
gives a somewhat better fit than that presented by Timoshenko. I
For plastic shear buckling,
kXy = (1/c) [(u/2)(1 + 2c3# + C4) + 3L2 + (1/2u) + C3] (III-6)
The minimization process involves matching u and u to C3. Since
this result is not of immediate consequence to the current project,no further action will be taken here on shear plastic buckling.
Biaxial Compression Buckling
With L = O and utilizing NY
= rNx,
(b2Nx/m2D J)[(mb/a)2 + r] = C1(mb/a)4 + 2C3(mb/a)2 + C5 (III-7)
where Cl = 1 - (3/4)(1 - r + r2)-1(1 - Et/E~)
C3=1- (3/4)r(l - r + r2)-1(1 - Et/Es)
C5 = 1 - (3/4)r2(l - r + r2)-1(1 - Et/E~)
When N = O, Eq. (III-7) reduces to the frequently used result
for un;axial plastic compressive buckling (Table III-l).
In the elastic range, Eq. (III-7) is the biaxial relation presentedby Timoshenko (Ref. 11 ).
(b2Nx/m2Df )[(mb/a)2 + r] = [(mb/a)2 + 1]2
When r = NY
= o,
k = b2Hx/m2D = (a/rob + mb/a)2x
When Nx = IIXy
= o,
c1 = C3 = 1’ C2 = C4 = O, and C5 = 1/4 + (3/4)(Et/ES) (III-8)
-63-
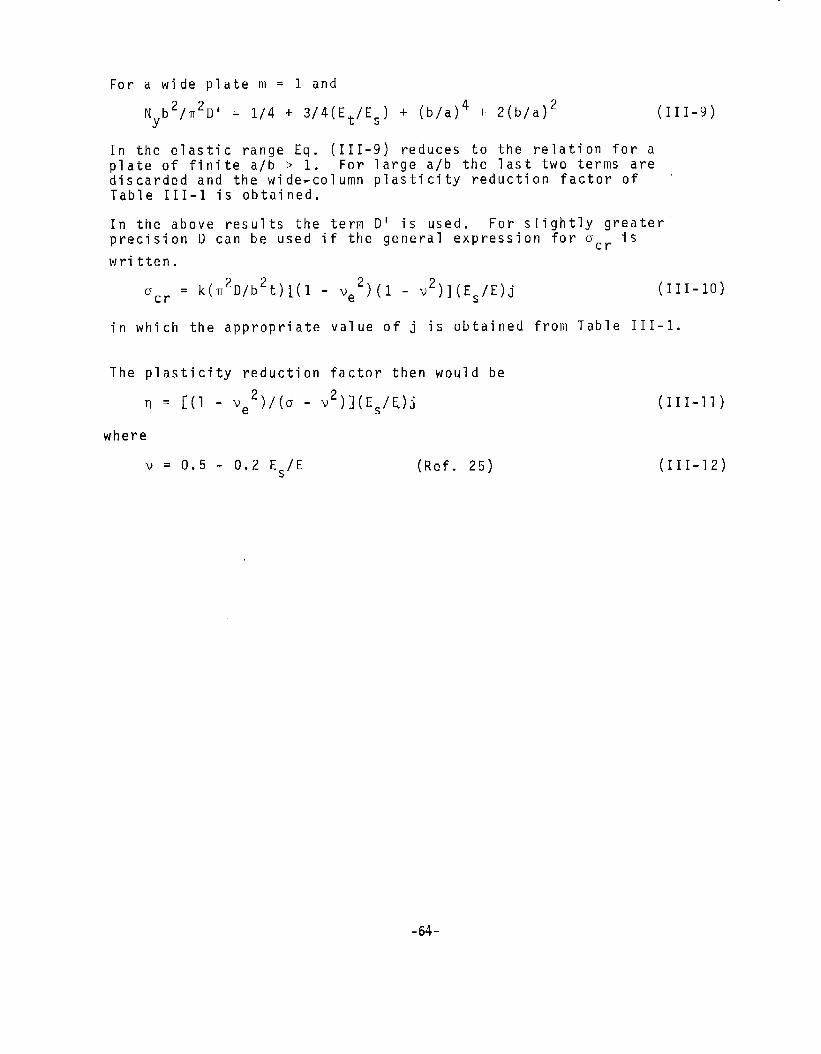
For a wide plate m = 1 and
Nyb2/~2D’ = 1/4 + 3/4(Et/E~) + (b/a)4 + 2(b/a)2 (III-9)
In the elastic range Eq. (III-9) reduces to the relation for aplate of finite a/b > 1. For large a/b the last two terms arediscarded and the wide-column plasticity reduction factor ofTable III-1 is obtained.
In the above results the term D’ is used. For slightly greaterprecision D can be used if the general expression for acr is
written.
Gcr
= k(m2D/b2t)[(l - ve2)(l - v2)](Es/E)j (III-Io)
in which the appropriate value of j is obtained from Table 111-1.
The plasticity reduction factor then would be
~ = [(1 - Ve2)/(0 - V2)](E5/E.)j (III-11)
where
v = 0.5 - 0.2 Es/E (Ref. 25) (III-12)
-64-

REFERENCES
1.
2.
3.
4.
5.
6.
7.
8.
Becker, H., R. Goldman, J. Pozerycki and A. Colao, “CompressiveStrength of Ship Hull Girders, Part I - Unstiffened Plates”.U. S. Ship Structure Committee Report SSC-217, 1970. AD 717590.
Becker, H., “Feasibility Study of Model Tests on Ship HullGirders”. U. S. Ship Structure Committee Report SSC-194,May 1969. AD 687220.
von Karman, T., E. Sechler and L. Donnell, “The Strength ofThin Plates in Compression”. Journal of Applied Mechanics,V.. 54, 1932, p. 53ff.
Bengt$on, H. W., “Ship Plating Under Compression and HydrostaticPressure”. Trans. SNAME, v. 47, no. 80, 1939, pp. 80-116.
Duffy, D. J. and R. B. Allnutt, “Buckling and Ultimate St, ?ngthsof Plating Loaded in Edge Compression. Prog. Rep. No. 1,6061-T6 Aluminum Plates”. DTMB Report 1419, April 1960.
Gerard, G., “Secant Modulus Method for Determining Plate In-stability Above the Proportional Limit”. Journal of AeronauticalSciences, v. 13, no. 1, January 1946, pp. 38-44, 48.
Dwight, J. B. and A. T, Ractliffe, “The Strength of Thin Platesin Compression”, Published in “Thin-Walled Steel Structures”,Ed. by Rockey and Hill, Gordon and Breach, N. Y., 1969, pp. 3-34.
Moxham, K. E., “Buckling Tests on Individual Welded Steel Platesin Compression”. Cambridge University Report CUED/C-Struct/TR.3,1971.
9. Dwight, J. B. and A. P. Ilorman, “Tests on Stiffened CompressionPanels and Plate Panels”. STEEL BOX GIRDERS - Proceedings ofthe London International Conference, 13-14 February 1973,~~:;~;n B, Paper 5, pp. 63-75, Institution of Civil Engineering,
.
10. Jubb, J. E. M., 1. G. Phillips and A. Panas. Several Reportsin Process of Publication.
11. Timoshenko, S., “Theory of Elastic Stability”. McGraw-Hill,1936.
12. Vasta, J., Unpublished U. S. Experimental Model Basin ProgressReports , ca 1940.
13. Moxham, K. E., “Theoretical Prediction of the Strength ofWelded Steel Plates in Compression”. Cambridge UniversityReport CUED/C-Struct/TR.2, 1971.
14. Dawson, R. G. and A. C. Walker, “A Proposed Method for theDesign of Thin-Walled Beams which Buckle Locally”. The Struc-tural Engineer, v. 50, no. 2, February 1972, pp. 95-105.
-65-

15*
16.
17.
18.
19.
20.
21.
22.
23.
24.
25.
Coan, J. M,, “Large-Deflection Theory for Plates with SmallInitial Curvature Loaded in Edge Compression”. Journal ofApplied Mechanics, v. 18, no. 2, June 1951, pp. 143-151.
Faulkner, D., “Compression Strength and Chance”. Componentof M.I.T. Report on Ship Structural Design Concepts, Cornell
Maritime Press, Inc., Cambridge, MD. 1975.
Mansour, A. E. and D. Faulkner, “On Applying the StatisticalApproach to Extreme Sea Loads and Ship Hull Strength”. Trans.Royal Institute of Naval Architects, v. 115, 1973, pp. 277-314.
Stowell, E. Z., “Compressive Strength of Flanges”. NACA
TN 2020, 1950.
Gerard, G., “Handbook of Structural Stability. Part IV -Failure of Plates and Composite Elements”. NACA TN 3784,August 1957.
Stowell, E. Z., “A Unified Theory of Plastic Buckling ofColumns and Plates”. NACA TR 898, 1947.
McPherson, A. E., S, Levy and G. Zibritosky, “Effects ofNormal Pressureor Strength of Axially Loaded Sheet-StringerPanels”. NACA TN 1041, July 1946.
Gerard, G. and H. Becker, ‘lHandbook of Structural $~j~~llty.Part III - Buckling of Curved Plates and Shells”.TN 3783, August 1957.
Ramberg, W. and W. R. Osgood, “Description of Stress-StrainCurves by Three Parameters”. NACA TN 902, July 1943.
Ractliffe, A. T., “The Strength of Plates in Compression”.Cantab Ph.D. Thesis, October 1968.
Gerard, G. and Wildhorn,S. ”A Study of Poissonrs Ratio in the
Yield Region”. NACA TN 2561, January 1952.
-66-

S,.<.tirt[l Ll,3ss,tlra1,0n
DOCLIMENT CONTROL DATA- RRD
COMPRESSIVE STRENGTH OF SHIP HULL GIRDERS - PART III - ‘THEORY AND ADDITIONAL EXPERIMENTS
TESCRIUTIVE NOTES (Type of report and inclusive date=)
Final ReportAU TUOR, SI (Fir.sf name, middle initial, Iast name)
H. Becker and .4.Colao
REPORT DATE
April 1977,..ToTA.~. or PAGE, 7b. NO. OF REFS
25. . cONTRACT OR GRANTNO 9a. ORIGIMATOR,S R<PORT NUMBEe[S)
NOO024-72-C-5565b. PROJECT NO,
SR-206c, ~b.OTHER REPORT NO(5) (ArIy other nwnbers that may b.? assigned
th~s report)
SSC-267d.
D. DISTRIBUTION 5TATEMENT
This document has been approved for public
release and sale; its distribution is unlimited.
1. SUPPLEMEPITAqY NOTES 12 SPONSORING MILITA~Y ACTIVITY
I Naval Sea Systems Command1
3, ABSTRAA phenomenological theory has been developed for predicting the ultimatestrength of rectangular structural plates loaded in uniaxial longitudinalcompression, uniaxial transverse compression and biaxial compression.The effects of normal pressure also were considered.
The theory was found to be in reasonable agreement with experimentaldata. Certain areas of the theory and some of the experiments requireadditional study.
The longitudinal compression theory was found to agree well with cor-responding theories of other investigators. However, the new theoryemploys the detailed stress-strain curve for a given material, whichthe others do not, and demonstrates that, In general, strength predictionrequires a curve for each structural material. The commonly used para-
meter, (b/t)(acy/E)l’2, is shown not to be universally employable across
the total material spectrum as the factor identifying ultimate strength.
Other results of broad interest are the demonstration of the applicabilityof a biaxial plasticity law to biaxial strength theory and the delineationof a method for selecting an optimum material for compression strength.
The use of stress-strain curves for strain analysis of critical andultimate strengths is described. They were employed to constructtheoretical strength curves.
Theoretical relations and corresponding curves have been developed forperfect plates. The effects of strength degrading factors are discussedand the analysis of residual stress effects is included.
)DT:R’6,1473 (“” 1) ~5/N0101-807.6801
* Us. Go— NT PP.INTTNG OFFICE , 1977 0-730.678/660

SHIP RESEARCH C0Mt41TTEEMaritime Transportation Research Board
National Ac?demy of Sciences-National Research Council
The Ship Research Committee has technical cognizance of theinteragency Ship Structure Committee’s research program:
PROF. J. E. GOLDBERG, Chairman, School of C<viZ Engrg., Georg<a Inst. of Tech.DR. J. M. BARSOM, Sect<on Supervisor, lJ.S. steeZ CorporationMR. D. P. COURTSAL, Vice &esidwzt, DRAVO CorporationMR. E. S. DILLON, Consultmt, SiZver Spting, iYaPuZadDEAN D. C. DRUCKER, CoZZege of h’ngineeting,University of IllinoisPRC)F. L. LANDNEBER, Inst. of HydrauZZc Research, The Vnivezwity of IowaMR. O. H. OAKLEY, Con=ltant, “McLean,Virg{niaMR. D. P. ROSEMAN, Chief Naval Arci%teet, Hy&ona+ics, IncuilEA!lR. D. STOUT, Graduate School, Lehigh UniversityMR. R..N. RLNIKE,.Eheoutive Seeretq, Ship Research Committee
The Ship Design, Response, and Load Criteria Advisory Grotipprepared the project prospectus and evaluated the proposals for this project:
MR. D. P. ROSEMAN, Chairman, Chief Naval Arehiteet, Hydromutics, Inc.PROF. A. H.-S. ANG, Dept. of Civ<Z Engineez%ng, University of nlino~sPROF. S. H. CRANDALL, Dept. ofMee~. Engrg., Massachusetts Inst. of Tec?wwZogyDR. D. D. KANA, Manager= Struct. DyMies & ACOUS*~CS, S.w. R=-Ch~ns+~~t~MR. M. J. LANE, StructwaZ Engineer, Bethzehm Steel cowo~at~onDR. M. K. OCH1, Research Scientist, Naval Skip Research & De-velopmentCenterPROF. W. D. PILKEY, Dept. of Meckmtis, University of VirginiaPROF. H. E. SHEETS, Ctman, Dept. of Ocean En@neez%ng, Univ. ofRhode IsktiMR. H. S. TOWNSEND, Consultant, Westpo~t, ConnecticutPROF. G. A. HEMPNER, School of l%grg. Science & Mechanics, Georgia Inst. of
Technology
The SR-206 Project Advisory Committee provided the liaisontechnical guidance, and reviewed the project reports with the investigator:
PROF. J. E. GOLDBERG, Chairman, School ofCiviZ Engrg., Georgia Inst. ofl’ech.MR. J. VR5TA, Senior Consultant, Litton Systems, Inc.PROF. G. A. WEMPNER, School of Engrg. Science ii Mechanics, GeoPgia In#t. of
Technology.
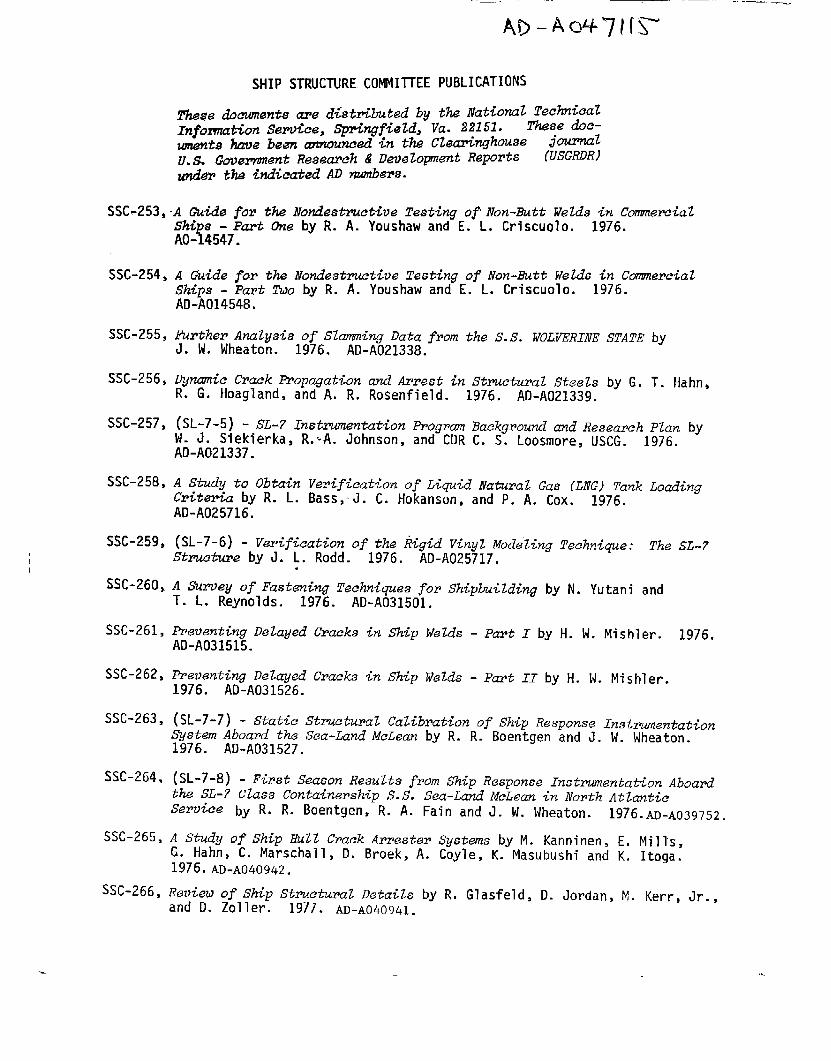
SSC.253,
SSC-254,
SSC-255,
SSC-256,
SSC-257,
SSC-258,
SSC-.259,
SSC-260,
SSC-261,
SSC-262,
SSC-263,
SSC-264,
SSC-2653
SSC-266,
SHIP STRUCTURE COMMIITEE PUBLICATIONS
T@e doeweni% are distributedby the iVationaZTechnicalInfozw?ationService,Springfield,Va. 22151. These doc-
um.entehave been announcedin the CZe&nghou8e journal
U.S. Goi@-mt Research& Deti@ZopmentReports (USGRDR)
unddP the hdicatedAD numbers.
A Guidefor the illondestmctivisT.eatingofiVon-EuttWelds in CommereiaZ5’h@8 -Part One by R. A. Youshaw and E. L. Criscuolo. 1976.AO-14547 .
A Guidefor the Nondestmctive Tesi%ngof Non-ButtWeZd6in CommereiaZShips - Part ?3J0 by R. A. Youshaw and E. L. Criscuolo. 1976.A1l-AO14548.
i?wthep AnaZysis of Sbuning Data from the S.S. WOLVER1iWSTATE byJ. W. Wheaton. 1976. AD-A021338.
Dynamic Crack Wopagation and Arrest in StructuralSteels by G. T. Hahn,R. G. Hoagland, and A. R. Rosenfield. 1976. AD-A021339.
(S1-7-5) - SL-7 Instrumentation Progrmn Baekgrouml and Researeh PZan byW. J. Siekierka,R.+A. Johnson,and CDR C. S. Loosmore, USCG. 1976.AD-A021337.
A Study to Obtain Verification of Liquid NaturaZ Gas (LNG) Tank LoadingCriteria by R. L. Bass$J. C. Hokanson, and P. A. Cox. 1976.AD-A025716.
(SL-7-6) - Verification of the Rigid VinyZkfod&ZingTeehn@ue: TheSL-7Struetune by J. L. Rodd. 1976. AD-A025717,
.
A Suxwey of FasteningTechniquesfor Shipbuilding by N. Yutani andT. L. Reynolds. 1976. AD-A031501.
PreventingDeZayedAD-A031515.
Preventing DeZayed1976. AD-A031526.
Cracks in Ship WeZds - Part X by H
Cracks in Ship WeZds - p~t II by
W. Mishler. 1976.
1. W. Mishler.
(SL-7-7) - StiatieStmctu~a2 Ca2;b~ation of Sh{p Response InstrumentationSystem Abood the Sea-Land MeLean by R. R. Boentgen and J. W. Wheaton.1976. AD-A031527.
(SL-7-8) - Fi~st Season ResuZts from Ship Response Instxwnentation Aboardthe SL-7 Class Containership S.S. Sea-Land McLean in North AtiknticService by R. R. Boentgen, R. A. Fain and J. M. Wheaton. 1976.AD-A039J52.
A Study of Ship HuZZ Crack Azwester Systems by M. Kanninen, E. Mills,
G. Hahn, C. Marschall, D. Broek, A. Coyle, K. Masubushi and K. Itoga.
1976.AD-AoG09Gz.
Revi# of Ship Structural DetaiZsand D. Zoner. 1977. AD-A040941.
by R. Glasfeld, D. Jordan, h!. Kerr,Jr.,