Embed Size (px)
Citation preview
1
Compressor rub verified by rotating phase symptoms
Nicolas Péton, Charles Grislin1 and Guillame Christin2
1GE Measurement and Control, 14 rue de la Haltinière, 44303 Nantes, France 2GE Measurement and Control, 68 chemin des Ormeaux, 69760 Limonest, France
Abstract This case history describes an example of how 1X rotating phase angle was corroborated with other symptoms to identify a rub on a turbo-compressor. The customer had noticed an increasing vibration trend and requested GE to collect data while the machine was operating at nominal speed. Vibration data was collected using an ADRE 408 unit. GE’s Machinery Diagnostic Services team was invited to perform vibration measurement on a compressor to investigate reasons of high vibrations The hydrogen compressor described in these events is a 3-stage centrifugal unit manufactured in 1972. It is coupled directly to its driver, a steam turbine with a normal operating speed between 9500 and 10 000 rpm. The machine is monitored with a Bently Nevada 3300 system using XY proximity probe pairs on each fluid-film bearing. As shown in the instrumentation diagram (Figure 1) two axial probes and a Keyphasor transducer are also installed on the machine 1 Machine train description
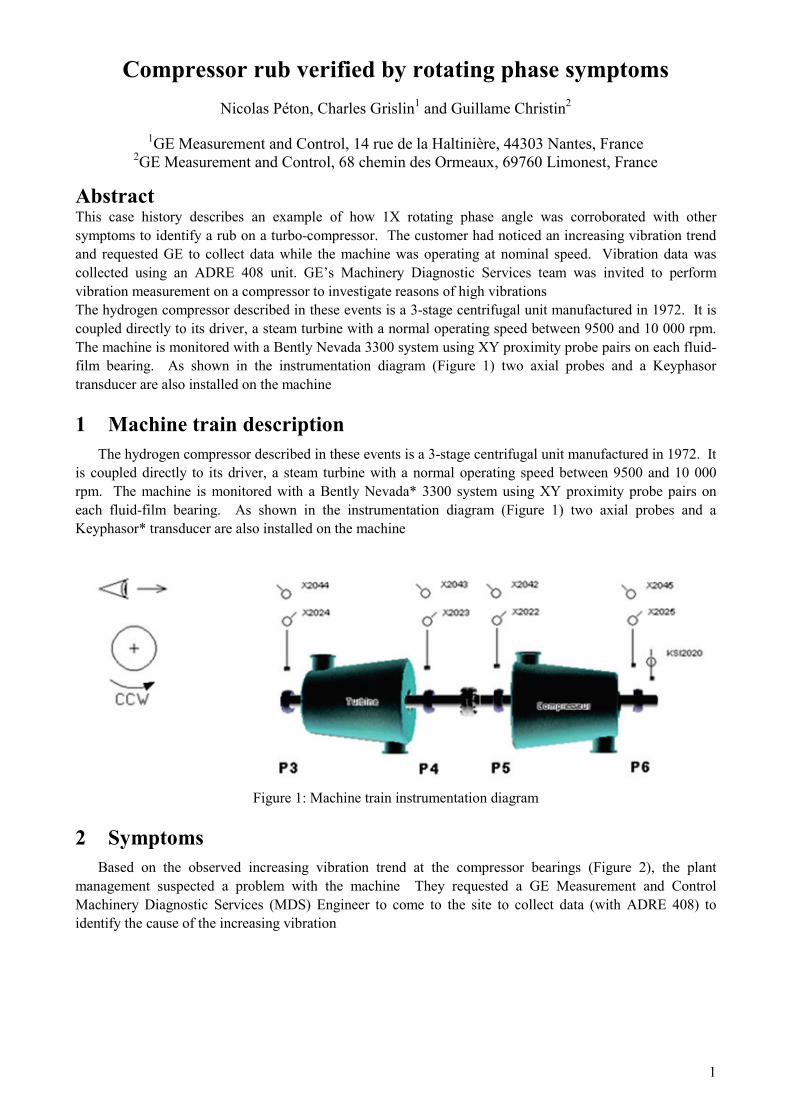
The hydrogen compressor described in these events is a 3-stage centrifugal unit manufactured in 1972. It is coupled directly to its driver, a steam turbine with a normal operating speed between 9500 and 10 000 rpm. The machine is monitored with a Bently Nevada* 3300 system using XY proximity probe pairs on each fluid-film bearing. As shown in the instrumentation diagram (Figure 1) two axial probes and a Keyphasor* transducer are also installed on the machine
Figure 1: Machine train instrumentation diagram
2 Symptoms
Based on the observed increasing vibration trend at the compressor bearings (Figure 2), the plant management suspected a problem with the machine They requested a GE Measurement and Control Machinery Diagnostic Services (MDS) Engineer to come to the site to collect data (with ADRE 408) to identify the cause of the increasing vibration
2
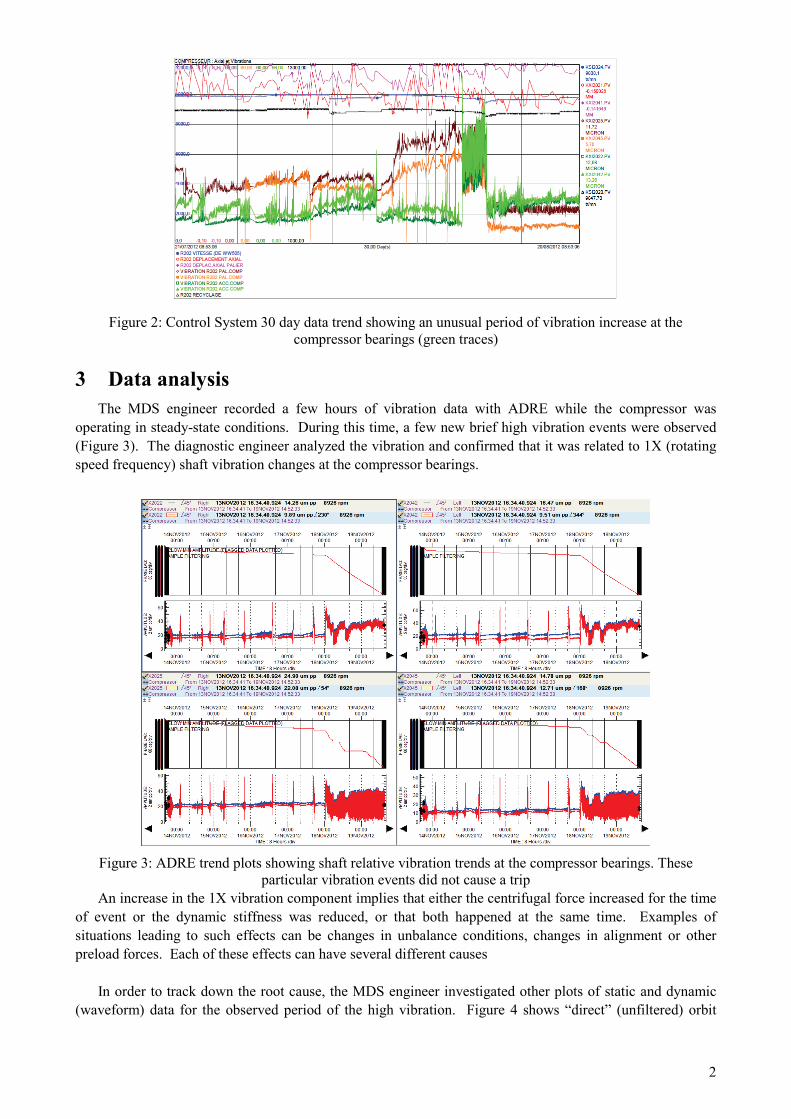
Figure 2: Control System 30 day data trend showing an unusual period of vibration increase at the compressor bearings (green traces)
3 Data analysis
The MDS engineer recorded a few hours of vibration data with ADRE while the compressor was operating in steady-state conditions. During this time, a few new brief high vibration events were observed (Figure 3). The diagnostic engineer analyzed the vibration and confirmed that it was related to 1X (rotating speed frequency) shaft vibration changes at the compressor bearings.
Figure 3: ADRE trend plots showing shaft relative vibration trends at the compressor bearings. These particular vibration events did not cause a trip
An increase in the 1X vibration component implies that either the centrifugal force increased for the time of event or the dynamic stiffness was reduced, or that both happened at the same time. Examples of situations leading to such effects can be changes in unbalance conditions, changes in alignment or other preload forces. Each of these effects can have several different causes
In order to track down the root cause, the MDS engineer investigated other plots of static and dynamic
(waveform) data for the observed period of the high vibration. Figure 4 shows “direct” (unfiltered) orbit
3
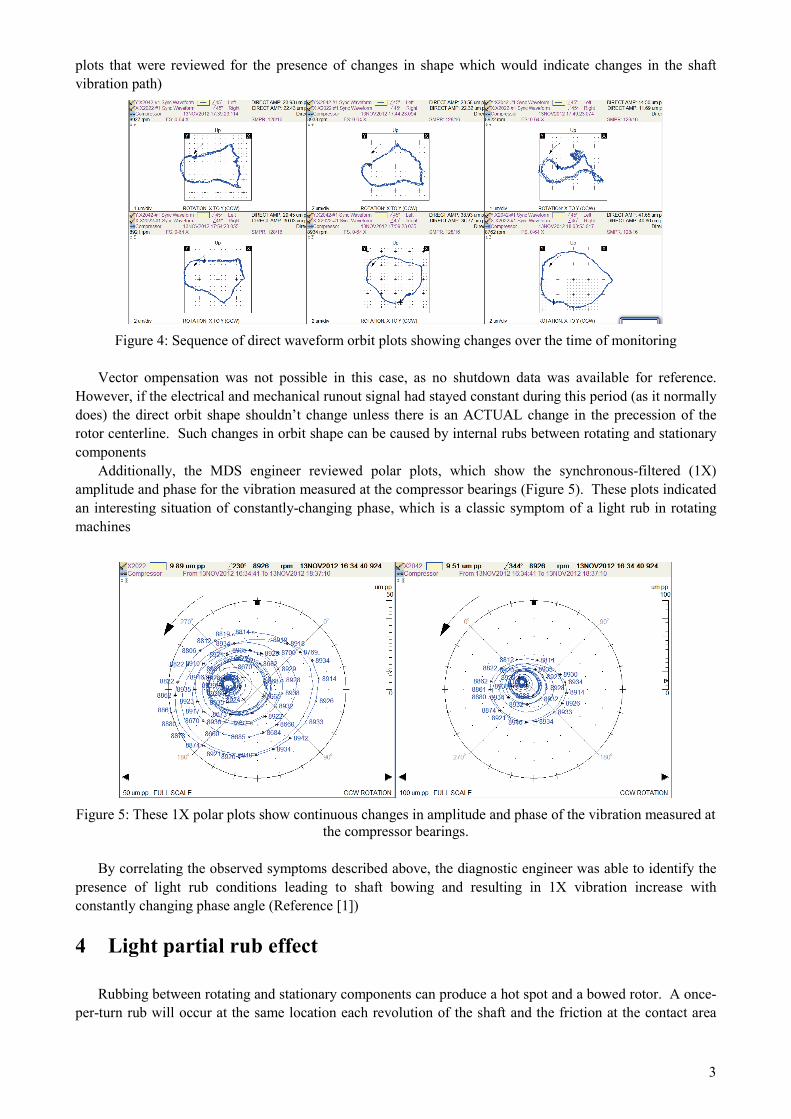
plots that were reviewed for the presence of changes in shape which would indicate changes in the shaft vibration path)
Figure 4: Sequence of direct waveform orbit plots showing changes over the time of monitoring Vector ompensation was not possible in this case, as no shutdown data was available for reference.
However, if the electrical and mechanical runout signal had stayed constant during this period (as it normally does) the direct orbit shape shouldn’t change unless there is an ACTUAL change in the precession of the rotor centerline. Such changes in orbit shape can be caused by internal rubs between rotating and stationary components
Additionally, the MDS engineer reviewed polar plots, which show the synchronous-filtered (1X) amplitude and phase for the vibration measured at the compressor bearings (Figure 5). These plots indicated an interesting situation of constantly-changing phase, which is a classic symptom of a light rub in rotating machines
Figure 5: These 1X polar plots show continuous changes in amplitude and phase of the vibration measured at the compressor bearings.
By correlating the observed symptoms described above, the diagnostic engineer was able to identify the
presence of light rub conditions leading to shaft bowing and resulting in 1X vibration increase with constantly changing phase angle (Reference [1])
4 Light partial rub effect
Rubbing between rotating and stationary components can produce a hot spot and a bowed rotor. A once-
per-turn rub will occur at the same location each revolution of the shaft and the friction at the contact area
4
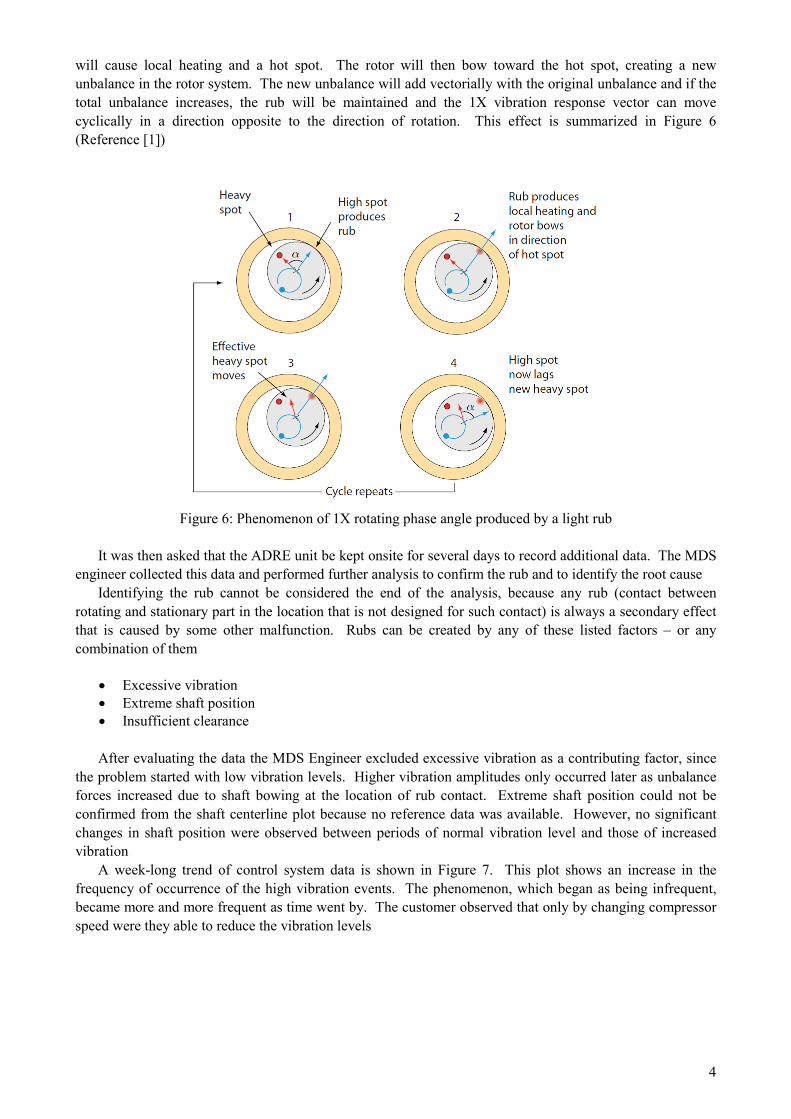
will cause local heating and a hot spot. The rotor will then bow toward the hot spot, creating a new unbalance in the rotor system. The new unbalance will add vectorially with the original unbalance and if the total unbalance increases, the rub will be maintained and the 1X vibration response vector can move cyclically in a direction opposite to the direction of rotation. This effect is summarized in Figure 6 (Reference [1])
Figure 6: Phenomenon of 1X rotating phase angle produced by a light rub It was then asked that the ADRE unit be kept onsite for several days to record additional data. The MDS
engineer collected this data and performed further analysis to confirm the rub and to identify the root cause Identifying the rub cannot be considered the end of the analysis, because any rub (contact between
rotating and stationary part in the location that is not designed for such contact) is always a secondary effect that is caused by some other malfunction. Rubs can be created by any of these listed factors – or any combination of them
• Excessive vibration • Extreme shaft position • Insufficient clearance After evaluating the data the MDS Engineer excluded excessive vibration as a contributing factor, since
the problem started with low vibration levels. Higher vibration amplitudes only occurred later as unbalance forces increased due to shaft bowing at the location of rub contact. Extreme shaft position could not be confirmed from the shaft centerline plot because no reference data was available. However, no significant changes in shaft position were observed between periods of normal vibration level and those of increased vibration
A week-long trend of control system data is shown in Figure 7. This plot shows an increase in the frequency of occurrence of the high vibration events. The phenomenon, which began as being infrequent, became more and more frequent as time went by. The customer observed that only by changing compressor speed were they able to reduce the vibration levels

5
Figure 7: Data trend from 14 through 21 November, shows that the high vibration event began occurring
more frequently. 5 Conclusions
One possible cause for a light rub could be insufficient clearances at the oil seals or at the labyrinth seals. The MDS Engineer noticed that after the vibration increased for a while, it would eventually drop back to previous levels
He hypothesized that a possible explanation for this behavior was the continuous formation of deposits in the compressor seals. Once the deposits exceeded the available clearance, a light rub would be developed at one point of the shaft surface, causing an increase of the shaft surface temperature and subsequent shaft bowing. The shaft bow, and increased vibration would then clear the deposits, restoring seal clearance and reducing vibration levels until the next time deposits built up to a significant level
Since the high vibration events were occurring with increasing regularity, (Figures 8 and 9), it was possible that more and more deposits were forming in the seals, and they were no longer being removed by periods of rubbing. Two areas were suspected for the deposits – the oil seals or the labyrinth seals
Figure 8: ADRE « direct » (unfiltered) vibration trend for a 6 day period from 13 through 19 November.

6
Figure 9: ADRE 1X (filtered) polar plot of vibration data recorded for a 6 day period from 13 through 19
November 6 Corrective actions
The machine was stopped and the seals were inspected. Significant deposits were found on the labyrinth seals (Figure 10). Analysis determined the composition to be ferrous sulfide, which provided important information for the plant engineering staff that was investigating the root cause of the event
The deposits were so significant that the customer decided to replace the shaft rather than just cleaning it. With the spare shaft installed the clearances on the labyrinth seals were increased to accommodate the possibility of additional deposits. The compressor was restarted and operated normally with no signs of elevated vibration
Figure 10: Photos show ferrous sulphide deposits in labyrinth seals.
References [1] Bently D.E, Hatch C.H, Fundamental of Rotating Machinery Diagnostics, Bently Pressurized Bearing
Company, 2002