Embed Size (px)
Citation preview
SECTION 13
Compressors and Expanders
AVR = actual volumetric rate m3/h (i.e. at process condi-tions)
Ap = cross sectional area of piston, (mm2)Ar = cross sectional area of piston rod, (mm2)
Bp = brake or shaft power kWC = cylinder clearance as a percent of cylinder volume
Cp = specific heat at constant pressure, kJ/(kg • °K) Cv = specific heat at constant volume, kJ/(kg • °K)D = cylinder inside diameter, mmd = piston rod diameter, mm
EP = extracted power of expander kWF = an allowance for interstage pressure drop, Eq 13-4
Ghp = gas power, actual compression power, kW,excluding mechanical losses, W
H = head, N • M/kgh = enthalpy, kJ/kg
IVR = inlet volumetric rate m3/h, usually at suctionconditions
k = isentropic exponent, Cp/Cv
MCp = molar specific heat at constant pressure,kJ/(kmole • °K)
MCv = molar specific heat at constant volume,kJ/(kmole • °K)
M = molecular massNr = speed, rpm
Nm = molar flow, moles/hn = polytropic exponent or number of molesP = pressure, kPa (abs)
Pc = critical pressure, kPa (abs)PD = piston displacement, m3/hPL = pressure base used in the contract or regulation,
kPa (abs)pPc = pseudo critical pressure, kPa (abs)PR = reduced pressure, P/Pc
pTc = pseudo critical temperature, KPV = partial pressure of contained moisture, kPa (abs)
p = pressure, kg/m2
FIG.
Nomen
13
The reciprocating compressor consists of one or more cylin-ders each with a piston or plunger that moves back and forth,displacing a positive volume with each stroke.
The diaphragm compressor uses a hydraulically pulsed flex-ible diaphragm to displace the gas.
Compressors
Depending on application, compressors are manufacturedas positive-displacement, dynamic, or thermal type (Fig. 13-2).
Positive displacement types fall in two basic categories: re-ciprocating and rotary.
Q = inlet capacity (IVR) m3/h
R = universal gas constant = 8.314 kPa (abs) • m3
kg mole • °K
= 213.6 kg • mkmole • K
= 8.314 kJkmole • K
r = compression ratio, P2/P1
s = entropy, kJ/kg • K) or number of wheelsSVR = standard volumetric rate m3/h measured at
101.35 kPa and 15°Cstroke = length of piston movement, mm
T = absolute temperature, KTc = critical temperature, KTR = reduced temperature, T/Tc
t = temperature, °CV = specific volume, m3/kg
VE = volumetric efficiency, percentW = work, N • Mw = weight flow, kg/hX = temperature rise factory = mole fractionZ = compressibility factor
Zavg = average compressibility factor = (Zs + Zd)/2η = efficiency, expressed as a decimal
Subscriptsavg = average
d = dischargeis = isentropic processL = standard conditions used for calculation or
contractp = polytropic processS = standard conditions, usually 101.35 kPa (abs), 15°Cs = suctiont = total or overall1 = inlet conditions2 = outlet conditions
13-1
clature
-1
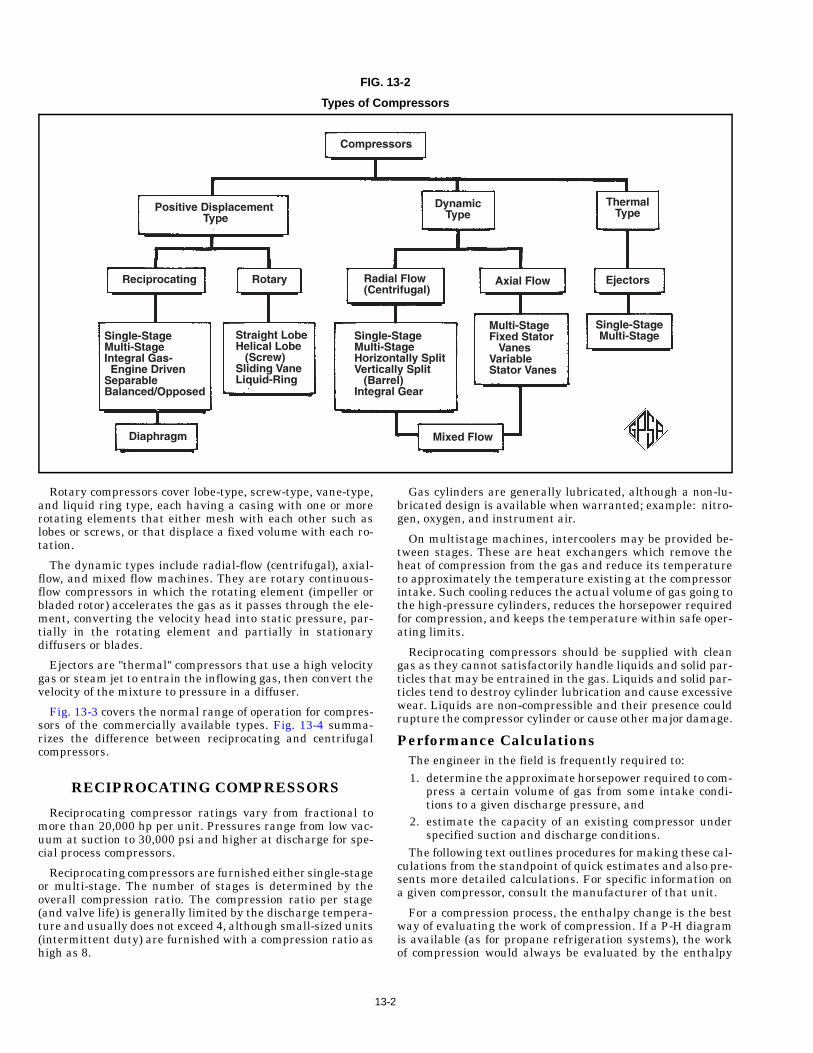
FIG. 13-2
Types of Compressors
Rotary compressors cover lobe-type, screw-type, vane-type,and liquid ring type, each having a casing with one or morerotating elements that either mesh with each other such aslobes or screws, or that displace a fixed volume with each ro-tation.
The dynamic types include radial-flow (centrifugal), axial-flow, and mixed flow machines. They are rotary continuous-flow compressors in which the rotating element (impeller orbladed rotor) accelerates the gas as it passes through the ele-ment, converting the velocity head into static pressure, par-tially in the rotating element and partially in stationarydiffusers or blades.
Ejectors are "thermal" compressors that use a high velocitygas or steam jet to entrain the inflowing gas, then convert thevelocity of the mixture to pressure in a diffuser.
Fig. 13-3 covers the normal range of operation for compres-sors of the commercially available types. Fig. 13-4 summa-rizes the difference between reciprocating and centrifugalcompressors.
RECIPROCATING COMPRESSORS
Reciprocating compressor ratings vary from fractional tomore than 20,000 hp per unit. Pressures range from low vac-uum at suction to 30,000 psi and higher at discharge for spe-cial process compressors.
Reciprocating compressors are furnished either single-stageor multi-stage. The number of stages is determined by theoverall compression ratio. The compression ratio per stage(and valve life) is generally limited by the discharge tempera-ture and usually does not exceed 4, although small-sized units(intermittent duty) are furnished with a compression ratio ashigh as 8.
13-
Gas cylinders are generally lubricated, although a non-lu-bricated design is available when warranted; example: nitro-gen, oxygen, and instrument air.
On multistage machines, intercoolers may be provided be-tween stages. These are heat exchangers which remove theheat of compression from the gas and reduce its temperatureto approximately the temperature existing at the compressorintake. Such cooling reduces the actual volume of gas going tothe high-pressure cylinders, reduces the horsepower requiredfor compression, and keeps the temperature within safe oper-ating limits.
Reciprocating compressors should be supplied with cleangas as they cannot satisfactorily handle liquids and solid par-ticles that may be entrained in the gas. Liquids and solid par-ticles tend to destroy cylinder lubrication and cause excessivewear. Liquids are non-compressible and their presence couldrupture the compressor cylinder or cause other major damage.
Performance CalculationsThe engineer in the field is frequently required to:1. determine the approximate horsepower required to com-
press a certain volume of gas from some intake condi-tions to a given discharge pressure, and
2. estimate the capacity of an existing compressor underspecified suction and discharge conditions.
The following text outlines procedures for making these cal-culations from the standpoint of quick estimates and also pre-sents more detailed calculations. For specific information ona given compressor, consult the manufacturer of that unit.
For a compression process, the enthalpy change is the bestway of evaluating the work of compression. If a P-H diagramis available (as for propane refrigeration systems), the workof compression would always be evaluated by the enthalpy
2
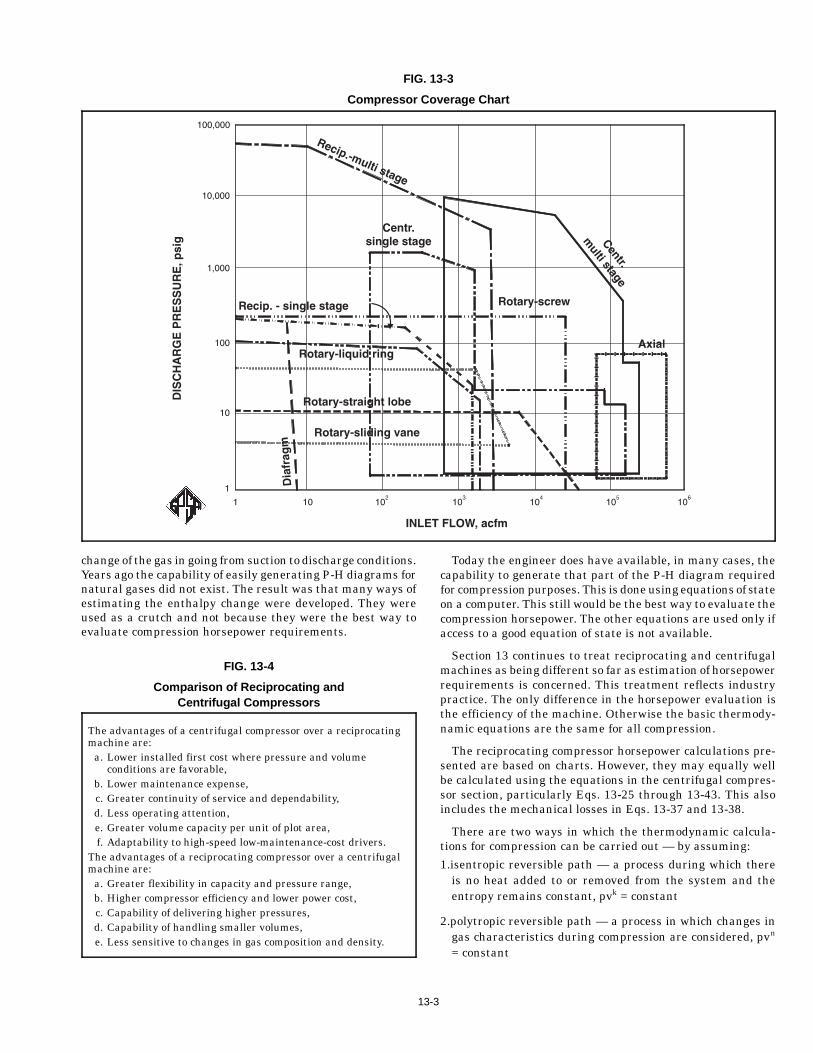
FIG. 13-3
Compressor Coverage Chart
change of the gas in going from suction to discharge conditions.Years ago the capability of easily generating P-H diagrams fornatural gases did not exist. The result was that many ways ofestimating the enthalpy change were developed. They wereused as a crutch and not because they were the best way toevaluate compression horsepower requirements.
The advantages of a centrifugal compressor over a reciprocatingmachine are:
a. Lower installed first cost where pressure and volumeconditions are favorable,
b. Lower maintenance expense,c. Greater continuity of service and dependability,d. Less operating attention,e. Greater volume capacity per unit of plot area,f. Adaptability to high-speed low-maintenance-cost drivers.
The advantages of a reciprocating compressor over a centrifugalmachine are:
a. Greater flexibility in capacity and pressure range,b. Higher compressor efficiency and lower power cost,c. Capability of delivering higher pressures,d. Capability of handling smaller volumes,e. Less sensitive to changes in gas composition and density.
FIG. 13-4
Comparison of Reciprocating andCentrifugal Compressors
13
Today the engineer does have available, in many cases, thecapability to generate that part of the P-H diagram requiredfor compression purposes. This is done using equations of stateon a computer. This still would be the best way to evaluate thecompression horsepower. The other equations are used only ifaccess to a good equation of state is not available.
Section 13 continues to treat reciprocating and centrifugalmachines as being different so far as estimation of horsepowerrequirements is concerned. This treatment reflects industrypractice. The only difference in the horsepower evaluation isthe efficiency of the machine. Otherwise the basic thermody-namic equations are the same for all compression.
The reciprocating compressor horsepower calculations pre-sented are based on charts. However, they may equally wellbe calculated using the equations in the centrifugal compres-sor section, particularly Eqs. 13-25 through 13-43. This alsoincludes the mechanical losses in Eqs. 13-37 and 13-38.
There are two ways in which the thermodynamic calcula-tions for compression can be carried out — by assuming:
1.isentropic reversible path — a process during which thereis no heat added to or removed from the system and theentropy remains constant, pvk = constant
2.polytropic reversible path — a process in which changes ingas characteristics during compression are considered, pvn
= constant
-3
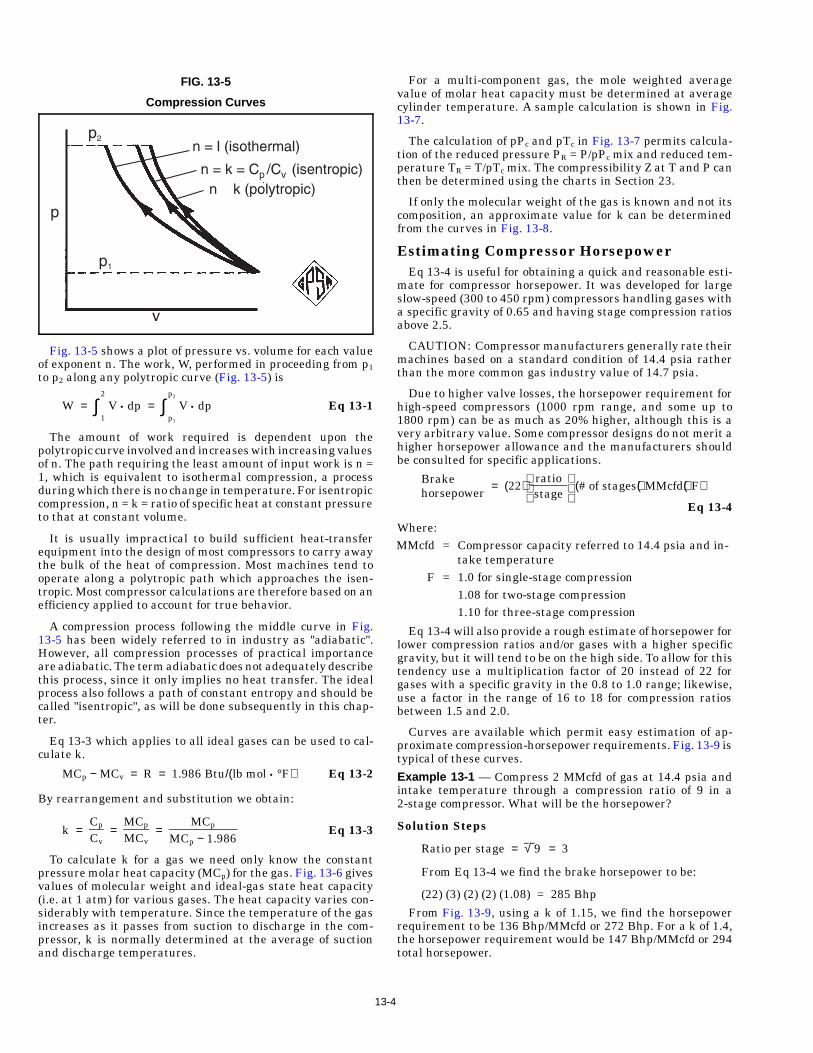
FIG. 13-5
Compressi on Curves
Fig. 13-5 shows a plot of pressure vs. volume for each valueof exponent n. The work, W, performed in proceeding from p1to p2 along any polytropic curve (Fig. 13-5) is
W = ∫ 1
2
V • dp = ∫ p1
p2
V • dp Eq 13-1
The amount of work required is dependent upon thepolytropic curve involved and increases with increasing valuesof n. The path requiring the least amount of input work is n =1, which is equivalent to isothermal compression, a processduring which there is no change in temperature. For isentropiccompression, n = k = ratio of specific heat at constant pressureto that at constant volume.
It is usually impractical to build sufficient heat-transferequipment into the design of most compressors to carry awaythe bulk of the heat of compression. Most machines tend tooperate along a polytropic path which approaches the isen-tropic. Most compressor calculations are therefore based on anefficiency applied to account for true behavior.
A compression process following the middle curve in Fig.13-5 has been widely referred to in industry as "adiabatic".However, all compression processes of practical importanceare adiabatic. The term adiabatic does not adequately describethis process, since it only implies no heat transfer. The idealprocess also follows a path of constant entropy and should becalled "isentropic", as will be done subsequently in this chap-ter.
Eq 13-3 which applies to all ideal gases can be used to cal-culate k.
MCp − MCv = R = 1.986 Btu/(lb mol • °F) Eq 13-2
By rearrangement and substitution we obtain:
k = Cp
Cv =
MCp
MCv =
MCp
MCp − 1.986Eq 13-3
To calculate k for a gas we need only know the constantpressure molar heat capacity (MCp) for the gas. Fig. 13-6 givesvalues of molecular weight and ideal-gas state heat capacity(i.e. at 1 atm) for various gases. The heat capacity varies con-siderably with temperature. Since the temperature of the gasincreases as it passes from suction to discharge in the com-pressor, k is normally determined at the average of suctionand discharge temperatures.
13
For a multi-component gas, the mole weighted averagevalue of molar heat capacity must be determined at averagecylinder temperature. A sample calculation is shown in Fig.13-7.
The calculation of pPc and pTc in Fig. 13-7 permits calcula-tion of the reduced pressure PR = P/pPc mix and reduced tem-perature TR = T/pTc mix. The compressibility Z at T and P canthen be determined using the charts in Section 23.
If only the molecular weight of the gas is known and not itscomposition, an approximate value for k can be determinedfrom the curves in Fig. 13-8.
Estimating Compressor HorsepowerEq 13-4 is useful for obtaining a quick and reasonable esti-
mate for compressor horsepower. It was developed for largeslow-speed (300 to 450 rpm) compressors handling gases witha specific gravity of 0.65 and having stage compression ratiosabove 2.5.
CAUTION: Compressor manufacturers generally rate theirmachines based on a standard condition of 14.4 psia ratherthan the more common gas industry value of 14.7 psia.
Due to higher valve losses, the horsepower requirement forhigh-speed compressors (1000 rpm range, and some up to1800 rpm) can be as much as 20% higher, although this is avery arbitrary value. Some compressor designs do not merit ahigher horsepower allowance and the manufacturers shouldbe consulted for specific applications.
Brakehorsepower
= (22)
ratio stage
(# of stages)(MMcfd)(F)
Eq 13-4
Where:MMcfd = Compressor capacity referred to 14.4 psia and in-
take temperatureF = 1.0 for single-stage compression
1.08 for two-stage compression1.10 for three-stage compression
Eq 13-4 will also provide a rough estimate of horsepower forlower compression ratios and/or gases with a higher specificgravity, but it will tend to be on the high side. To allow for thistendency use a multiplication factor of 20 instead of 22 forgases with a specific gravity in the 0.8 to 1.0 range; likewise,use a factor in the range of 16 to 18 for compression ratiosbetween 1.5 and 2.0.
Curves are available which permit easy estimation of ap-proximate compression-horsepower requirements. Fig. 13-9 istypical of these curves.
Example 13-1 — Compress 2 MMcfd of gas at 14.4 psia andintake temperature through a compression ratio of 9 in a2-stage compressor. What will be the horsepower?
Solution Steps
Ratio per stage = √ 9 = 3
From Eq 13-4 we find the brake horsepower to be:
(22) (3) (2) (2) (1.08) = 285 Bhp
From Fig. 13-9, using a k of 1.15, we find the horsepowerrequirement to be 136 Bhp/MMcfd or 272 Bhp. For a k of 1.4,the horsepower requirement would be 147 Bhp/MMcfd or 294total horsepower.
-4
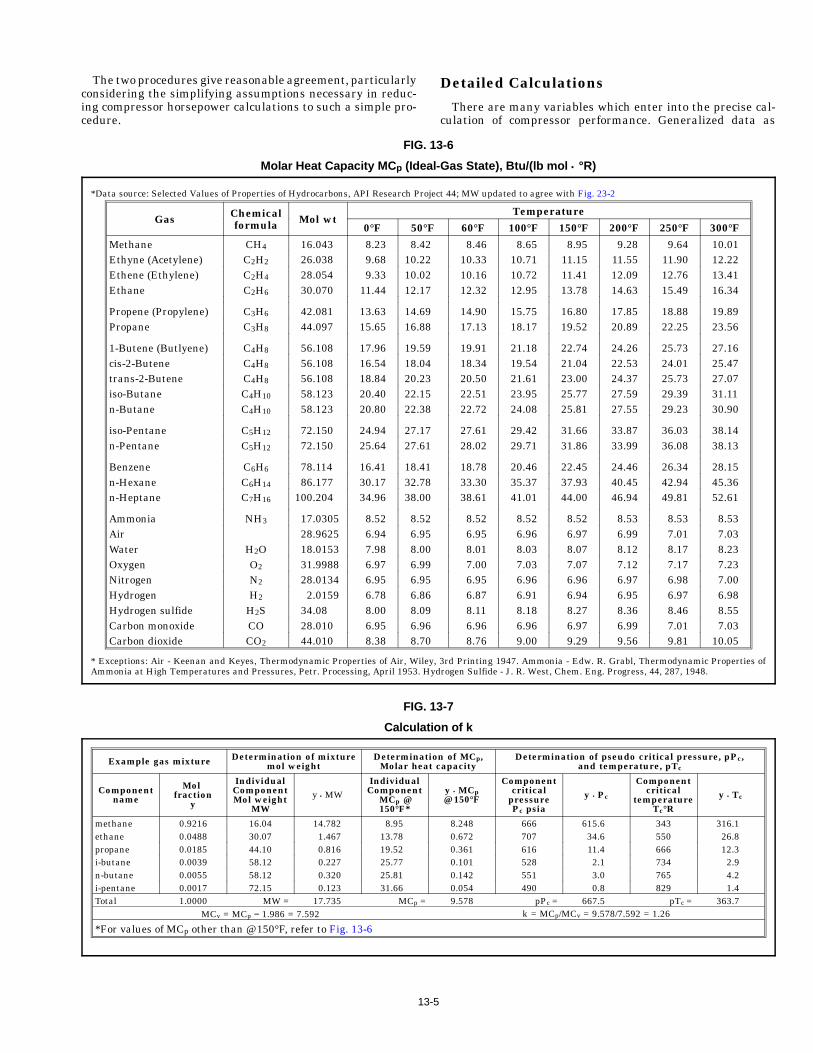
The two procedures give reasonable agreement, particularlyconsidering the simplifying assumptions necessary in reduc-ing compressor horsepower calculations to such a simple pro-cedure.
*Data source: Selected Values of Properties of Hydrocarbons, API Research Pro
Gas Chemicalformula Mol wt
0°F 50°
Methane CH4 16.043 8.23 8.42Ethyne (Acetylene) C2H2 26.038 9.68 10.22Ethene (Ethylene) C2H4 28.054 9.33 10.02Ethane C2H6 30.070 11.44 12.17
Propene (Propylene) C3H6 42.081 13.63 14.69Propane C3H8 44.097 15.65 16.88
1-Butene (Butlyene) C4H8 56.108 17.96 19.59cis-2-Butene C4H8 56.108 16.54 18.04trans-2-Butene C4H8 56.108 18.84 20.23iso-Butane C4H10 58.123 20.40 22.15n-Butane C4H10 58.123 20.80 22.38
iso-Pentane C5H12 72.150 24.94 27.17n-Pentane C5H12 72.150 25.64 27.61
Benzene C6H6 78.114 16.41 18.41n-Hexane C6H14 86.177 30.17 32.78n-Heptane C7H16 100.204 34.96 38.00
Ammonia NH3 17.0305 8.52 8.52Air 28.9625 6.94 6.95Water H2O 18.0153 7.98 8.00Oxygen O2 31.9988 6.97 6.99Nitrogen N2 28.0134 6.95 6.95Hydrogen H2 2.0159 6.78 6.86Hydrogen sulfide H2S 34.08 8.00 8.09Carbon monoxide CO 28.010 6.95 6.96Carbon dioxide CO2 44.010 8.38 8.70
* Exceptions: Air - Keenan and Keyes, Thermodynamic Properties of Air, WileAmmonia at High Temperatures and Pressures, Petr. Processing, April 1953. H
FIG.
Molar Heat Capacity MC p (Ide
Example gas mixture Determination of mixturemol weight
DeterminatMolar hea
Componentname
Mol fraction
y
IndividualComponentMol weight
MWy • MW
IndividualComponent
MCp @150°F*
methane 0.9216 16.04 14.782 8.95 ethane 0.0488 30.07 1.467 13.78 propane 0.0185 44.10 0.816 19.52 i-butane 0.0039 58.12 0.227 25.77 n-butane 0.0055 58.12 0.320 25.81 i-pentane 0.0017 72.15 0.123 31.66 Total 1.0000 MW = 17.735 MCp =
MCv = MCp − 1.986 = 7.592
*For values of MCp other than @ 150°F, refer to Fig. 13-6
FIG.
Calcula
13
Detailed Calculations
There are many variables which enter into the precise cal-culation of compressor performance. Generalized data as
ject 44; MW updated to agree with Fig. 23-2
Temperature
F 60°F 100°F 150°F 200°F 250°F 300°F
8.46 8.65 8.95 9.28 9.64 10.01 10.33 10.71 11.15 11.55 11.90 12.22 10.16 10.72 11.41 12.09 12.76 13.41 12.32 12.95 13.78 14.63 15.49 16.34
14.90 15.75 16.80 17.85 18.88 19.89 17.13 18.17 19.52 20.89 22.25 23.56
19.91 21.18 22.74 24.26 25.73 27.16 18.34 19.54 21.04 22.53 24.01 25.47 20.50 21.61 23.00 24.37 25.73 27.07 22.51 23.95 25.77 27.59 29.39 31.11 22.72 24.08 25.81 27.55 29.23 30.90
27.61 29.42 31.66 33.87 36.03 38.14 28.02 29.71 31.86 33.99 36.08 38.13
18.78 20.46 22.45 24.46 26.34 28.15 33.30 35.37 37.93 40.45 42.94 45.36 38.61 41.01 44.00 46.94 49.81 52.61
8.52 8.52 8.52 8.53 8.53 8.53 6.95 6.96 6.97 6.99 7.01 7.03 8.01 8.03 8.07 8.12 8.17 8.23 7.00 7.03 7.07 7.12 7.17 7.23 6.95 6.96 6.96 6.97 6.98 7.00 6.87 6.91 6.94 6.95 6.97 6.98 8.11 8.18 8.27 8.36 8.46 8.55 6.96 6.96 6.97 6.99 7.01 7.03 8.76 9.00 9.29 9.56 9.81 10.05
y, 3rd Printing 1947. Ammonia - Edw. R. Grabl, Thermodynamic Properties ofydrogen Sulfide - J. R. West, Chem. Eng. Progress, 44, 287, 1948.
13-6
al-Gas State) , Btu/(lb mol • °R)
ion of MCp,t capacity
Determination of pseudo critical pressure, pPc,and temperature, pTc
y • MCp@ 150°F
Componentcritical
pressurePc psia
y • Pc
Componentcritical
temperatureTc°R
y • Tc
8.248 666 615.6 343 316.10.672 707 34.6 550 26.80.361 616 11.4 666 12.30.101 528 2.1 734 2.90.142 551 3.0 765 4.20.054 490 0.8 829 1.4
9.578 pPc = 667.5 pTc = 363.7k = MCp/MCv = 9.578/7.592 = 1.26
13-7
tion of k
-5
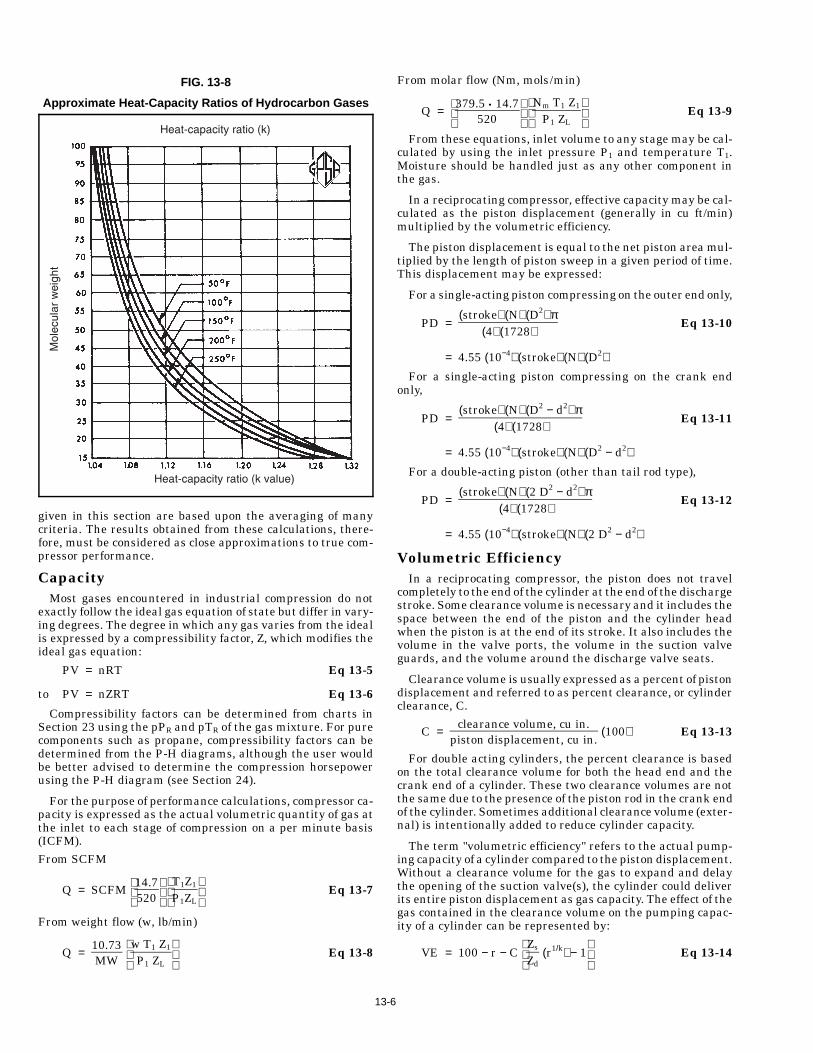
FIG. 13-8
Approximate Heat-Capacity Ratios of Hydrocarbon Gases
given in this section are based upon the averaging of manycriteria. The results obtained from these calculations, there-fore, must be considered as close approximations to true com-pressor performance.
CapacityMost gases encountered in industrial compression do not
exactly follow the ideal gas equation of state but differ in vary-ing degrees. The degree in which any gas varies from the idealis expressed by a compressibility factor, Z, which modifies theideal gas equation:
PV = nRT Eq 13-5
to PV = nZRT Eq 13-6
Compressibility factors can be determined from charts inSection 23 using the pPR and pTR of the gas mixture. For purecomponents such as propane, compressibility factors can bedetermined from the P-H diagrams, although the user wouldbe better advised to determine the compression horsepowerusing the P-H diagram (see Section 24).
For the purpose of performance calculations, compressor ca-pacity is expressed as the actual volumetric quantity of gas atthe inlet to each stage of compression on a per minute basis(ICFM).
From SCFM
Q = SCFM
14.7520
T1Z1
P1ZL
Eq 13-7
From weight flow (w, lb/min)
Q = 10.73MW
w T1 Z1
P1 ZL
Eq 13-8
13
From molar flow (Nm, mols/min)
Q =
379.5 • 14.7520
Nm T1 Z1
P1 ZL
Eq 13-9
From these equations, inlet volume to any stage may be cal-culated by using the inlet pressure P1 and temperature T1.Moisture should be handled just as any other component inthe gas.
In a reciprocating compressor, effective capacity may be cal-culated as the piston displacement (generally in cu ft/min)multiplied by the volumetric efficiency.
The piston displacement is equal to the net piston area mul-tiplied by the length of piston sweep in a given period of time.This displacement may be expressed:
For a single-acting piston compressing on the outer end only,
PD = (stroke) (N) (D2) π
(4) (1728)Eq 13-10
= 4.55 (10−4) (stroke) (N) (D2)For a single-acting piston compressing on the crank end
only,
PD = (stroke) (N) (D2 − d2) π
(4) (1728)Eq 13-11
= 4.55 (10−4) (stroke) (N) (D2 − d2)For a double-acting piston (other than tail rod type),
PD = (stroke) (N) (2 D2 − d2) π
(4) (1728)Eq 13-12
= 4.55 (10−4) (stroke) (N) (2 D2 − d2)
Volumetric EfficiencyIn a reciprocating compressor, the piston does not travel
completely to the end of the cylinder at the end of the dischargestroke. Some clearance volume is necessary and it includes thespace between the end of the piston and the cylinder headwhen the piston is at the end of its stroke. It also includes thevolume in the valve ports, the volume in the suction valveguards, and the volume around the discharge valve seats.
Clearance volume is usually expressed as a percent of pistondisplacement and referred to as percent clearance, or cylinderclearance, C.
C = clearance volume, cu in.
piston displacement, cu in. (100) Eq 13-13
For double acting cylinders, the percent clearance is basedon the total clearance volume for both the head end and thecrank end of a cylinder. These two clearance volumes are notthe same due to the presence of the piston rod in the crank endof the cylinder. Sometimes additional clearance volume (exter-nal) is intentionally added to reduce cylinder capacity.
The term "volumetric efficiency" refers to the actual pump-ing capacity of a cylinder compared to the piston displacement.Without a clearance volume for the gas to expand and delaythe opening of the suction valve(s), the cylinder could deliverits entire piston displacement as gas capacity. The effect of thegas contained in the clearance volume on the pumping capac-ity of a cylinder can be represented by:
VE = 100 − r − C
Zs
Zd (r1/k) − 1
Eq 13-14
-6
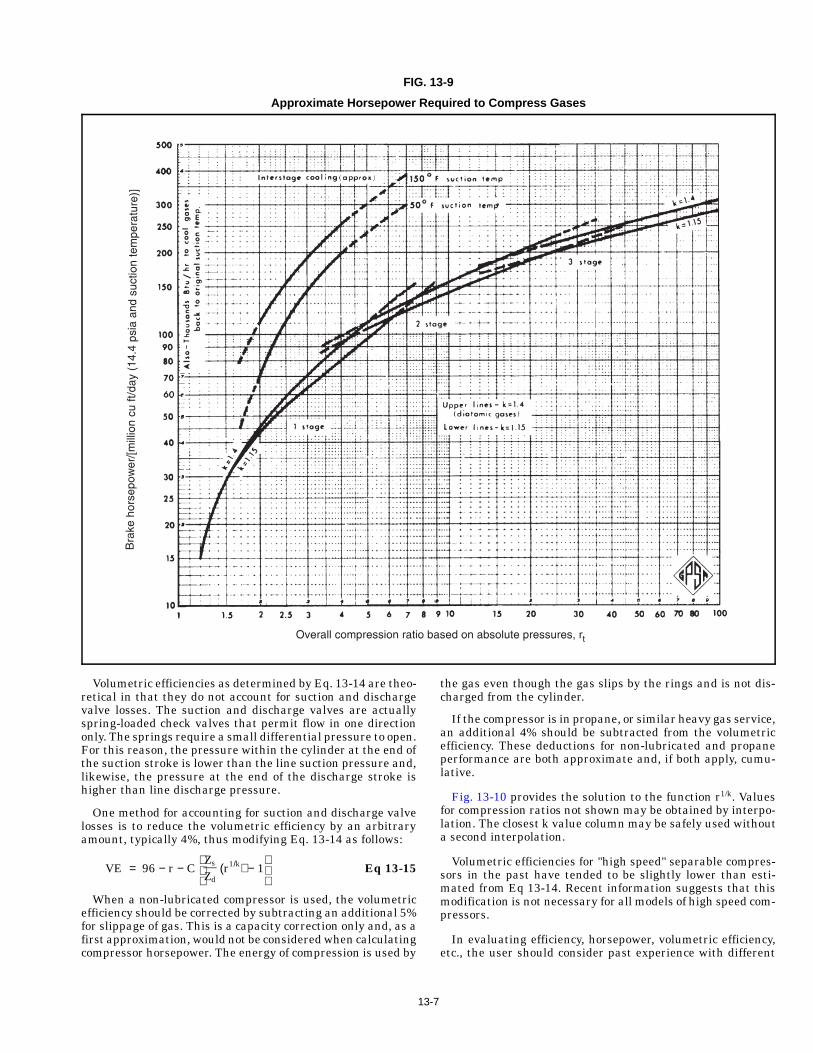
FIG. 13-9
Approximate Horsepower Required to Compress Gases
Volumetric efficiencies as determined by Eq. 13-14 are theo-retical in that they do not account for suction and dischargevalve losses. The suction and discharge valves are actuallyspring-loaded check valves that permit flow in one directiononly. The springs require a small differential pressure to open.For this reason, the pressure within the cylinder at the end ofthe suction stroke is lower than the line suction pressure and,likewise, the pressure at the end of the discharge stroke ishigher than line discharge pressure.
One method for accounting for suction and discharge valvelosses is to reduce the volumetric efficiency by an arbitraryamount, typically 4%, thus modifying Eq. 13-14 as follows:
VE = 96 − r − C
Zs
Zd (r1/k) − 1
Eq 13-15
When a non-lubricated compressor is used, the volumetricefficiency should be corrected by subtracting an additional 5%for slippage of gas. This is a capacity correction only and, as afirst approximation, would not be considered when calculatingcompressor horsepower. The energy of compression is used by
13
the gas even though the gas slips by the rings and is not dis-charged from the cylinder.
If the compressor is in propane, or similar heavy gas service,an additional 4% should be subtracted from the volumetricefficiency. These deductions for non-lubricated and propaneperformance are both approximate and, if both apply, cumu-lative.
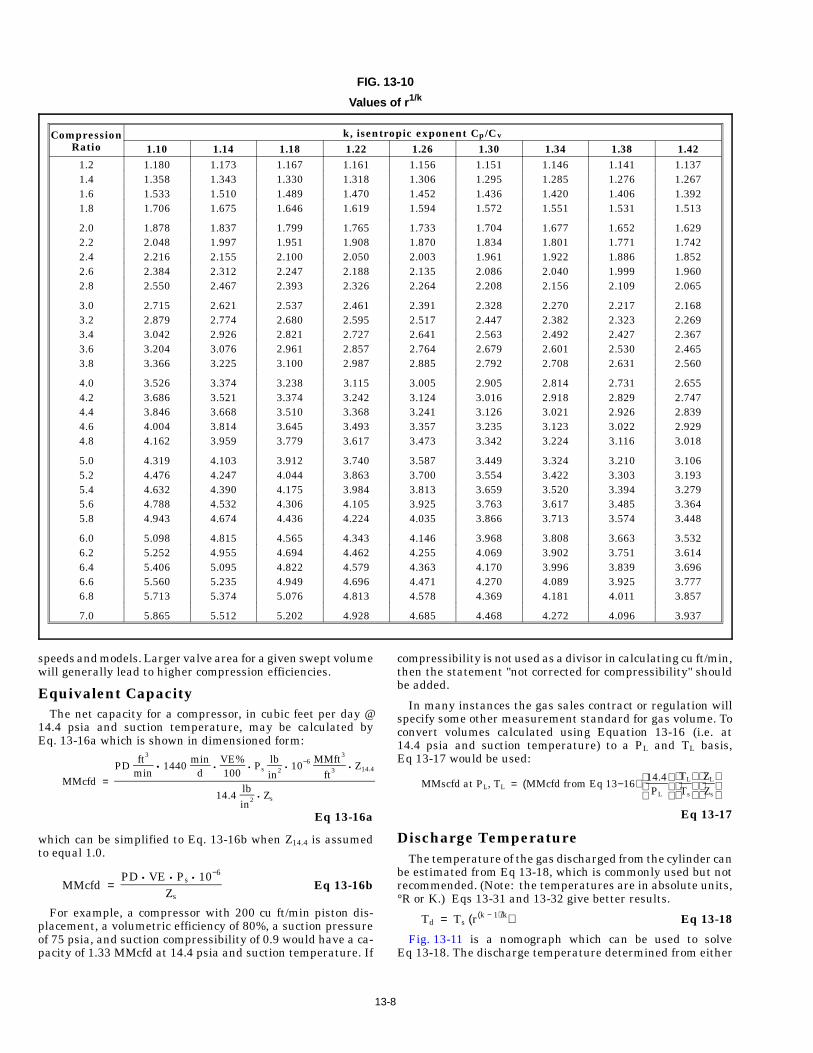
Fig. 13-10 provides the solution to the function r1/k. Valuesfor compression ratios not shown may be obtained by interpo-lation. The closest k value column may be safely used withouta second interpolation.
Volumetric efficiencies for "high speed" separable compres-sors in the past have tended to be slightly lower than esti-mated from Eq 13-14. Recent information suggests that thismodification is not necessary for all models of high speed com-pressors.
In evaluating efficiency, horsepower, volumetric efficiency,etc., the user should consider past experience with different
-7
CompressionRatio
k, isentropic exponent Cp/Cv
1.10 1.14 1.18 1.22 1.26 1.30 1.34 1.38 1.421.2 1.180 1.173 1.167 1.161 1.156 1.151 1.146 1.141 1.1371.4 1.358 1.343 1.330 1.318 1.306 1.295 1.285 1.276 1.2671.6 1.533 1.510 1.489 1.470 1.452 1.436 1.420 1.406 1.3921.8 1.706 1.675 1.646 1.619 1.594 1.572 1.551 1.531 1.513
2.0 1.878 1.837 1.799 1.765 1.733 1.704 1.677 1.652 1.6292.2 2.048 1.997 1.951 1.908 1.870 1.834 1.801 1.771 1.7422.4 2.216 2.155 2.100 2.050 2.003 1.961 1.922 1.886 1.8522.6 2.384 2.312 2.247 2.188 2.135 2.086 2.040 1.999 1.9602.8 2.550 2.467 2.393 2.326 2.264 2.208 2.156 2.109 2.065
3.0 2.715 2.621 2.537 2.461 2.391 2.328 2.270 2.217 2.1683.2 2.879 2.774 2.680 2.595 2.517 2.447 2.382 2.323 2.2693.4 3.042 2.926 2.821 2.727 2.641 2.563 2.492 2.427 2.3673.6 3.204 3.076 2.961 2.857 2.764 2.679 2.601 2.530 2.4653.8 3.366 3.225 3.100 2.987 2.885 2.792 2.708 2.631 2.560
4.0 3.526 3.374 3.238 3.115 3.005 2.905 2.814 2.731 2.6554.2 3.686 3.521 3.374 3.242 3.124 3.016 2.918 2.829 2.7474.4 3.846 3.668 3.510 3.368 3.241 3.126 3.021 2.926 2.8394.6 4.004 3.814 3.645 3.493 3.357 3.235 3.123 3.022 2.9294.8 4.162 3.959 3.779 3.617 3.473 3.342 3.224 3.116 3.018
5.0 4.319 4.103 3.912 3.740 3.587 3.449 3.324 3.210 3.1065.2 4.476 4.247 4.044 3.863 3.700 3.554 3.422 3.303 3.1935.4 4.632 4.390 4.175 3.984 3.813 3.659 3.520 3.394 3.2795.6 4.788 4.532 4.306 4.105 3.925 3.763 3.617 3.485 3.3645.8 4.943 4.674 4.436 4.224 4.035 3.866 3.713 3.574 3.448
6.0 5.098 4.815 4.565 4.343 4.146 3.968 3.808 3.663 3.5326.2 5.252 4.955 4.694 4.462 4.255 4.069 3.902 3.751 3.6146.4 5.406 5.095 4.822 4.579 4.363 4.170 3.996 3.839 3.6966.6 5.560 5.235 4.949 4.696 4.471 4.270 4.089 3.925 3.7776.8 5.713 5.374 5.076 4.813 4.578 4.369 4.181 4.011 3.857
7.0 5.865 5.512 5.202 4.928 4.685 4.468 4.272 4.096 3.937
FIG. 13-10
Values of r 1/k
speeds and models. Larger valve area for a given swept volumewill generally lead to higher compression efficiencies.
Equivalent CapacityThe net capacity for a compressor, in cubic feet per day @
14.4 psia and suction temperature, may be calculated byEq. 13-16a which is shown in dimensioned form:
MMcfd = PD
ft3
min • 1440
mind
• VE%100
• Ps lbin2 • 10−6
MMft3
ft3 • Z14.4
14.4 lbin2 • Zs
Eq 13-16a
which can be simplified to Eq. 13-16b when Z14.4 is assumedto equal 1.0.
MMcfd = PD • VE • Ps • 10−6
ZsEq 13-16b
For example, a compressor with 200 cu ft/min piston dis-placement, a volumetric efficiency of 80%, a suction pressureof 75 psia, and suction compressibility of 0.9 would have a ca-pacity of 1.33 MMcfd at 14.4 psia and suction temperature. If
13
compressibility is not used as a divisor in calculating cu ft/min,then the statement "not corrected for compressibility" shouldbe added.
In many instances the gas sales contract or regulation willspecify some other measurement standard for gas volume. Toconvert volumes calculated using Equation 13-16 (i.e. at14.4 psia and suction temperature) to a PL and TL basis,Eq 13-17 would be used:
MMscfd at PL, TL = (MMcfd from Eq 13−16)
14.4PL
TL
Ts
ZL
Zs
Eq 13-17
Discharge TemperatureThe temperature of the gas discharged from the cylinder can
be estimated from Eq 13-18, which is commonly used but notrecommended. (Note: the temperatures are in absolute units,°R or K.) Eqs 13-31 and 13-32 give better results.
Td = Ts (r(k − 1)/k) Eq 13-18
Fig. 13-11 is a nomograph which can be used to solveEq 13-18. The discharge temperature determined from either
-8
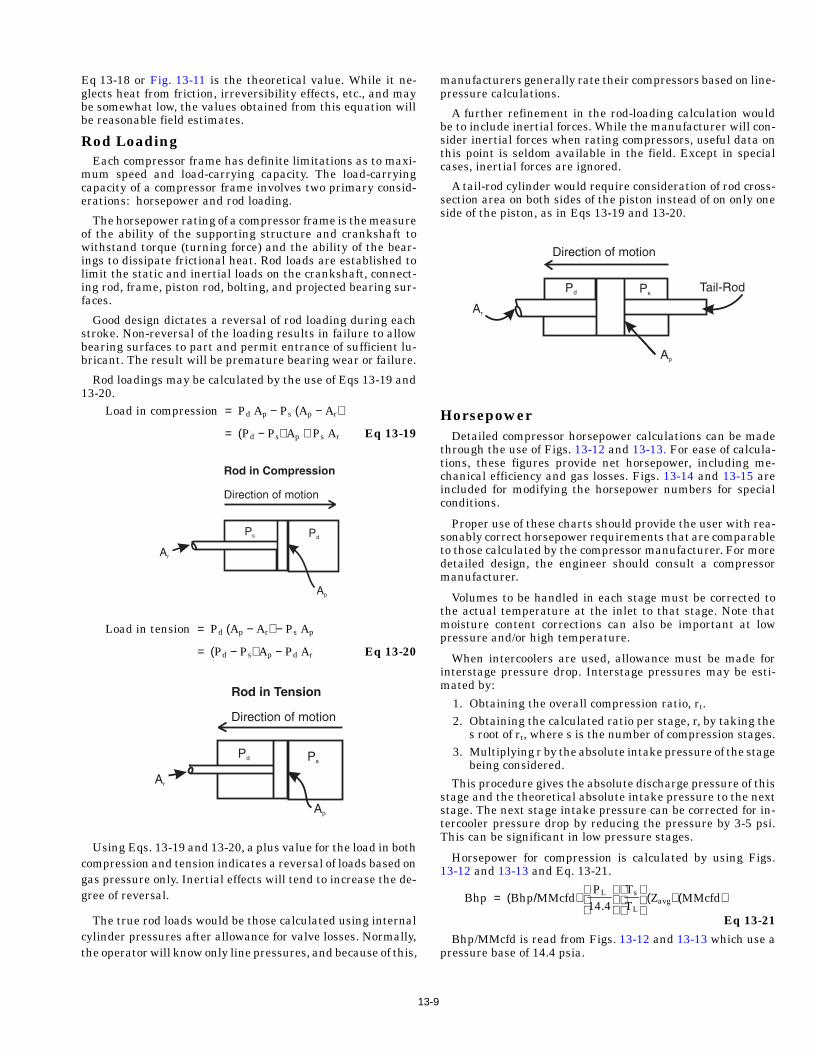
Eq 13-18 or Fig. 13-11 is the theoretical value. While it ne-glects heat from friction, irreversibility effects, etc., and maybe somewhat low, the values obtained from this equation willbe reasonable field estimates.
Rod LoadingEach compressor frame has definite limitations as to maxi-
mum speed and load-carrying capacity. The load-carryingcapacity of a compressor frame involves two primary consid-erations: horsepower and rod loading.
The horsepower rating of a compressor frame is the measureof the ability of the supporting structure and crankshaft towithstand torque (turning force) and the ability of the bear-ings to dissipate frictional heat. Rod loads are established tolimit the static and inertial loads on the crankshaft, connect-ing rod, frame, piston rod, bolting, and projected bearing sur-faces.
Good design dictates a reversal of rod loading during eachstroke. Non-reversal of the loading results in failure to allowbearing surfaces to part and permit entrance of sufficient lu-bricant. The result will be premature bearing wear or failure.
Rod loadings may be calculated by the use of Eqs 13-19 and13-20.
Load in compression = Pd Ap − Ps (Ap − Ar)
= (Pd − Ps) Ap + Ps Ar Eq 13-19
Load in tension = Pd (Ap − Ar) − Ps Ap
= (Pd − Ps) Ap − Pd Ar Eq 13-20
Using Eqs. 13-19 and 13-20, a plus value for the load in bothcompression and tension indicates a reversal of loads based ongas pressure only. Inertial effects will tend to increase the de-gree of reversal.
The true rod loads would be those calculated using internalcylinder pressures after allowance for valve losses. Normally,the operator will know only line pressures, and because of this,
13
manufacturers generally rate their compressors based on line-pressure calculations.
A further refinement in the rod-loading calculation wouldbe to include inertial forces. While the manufacturer will con-sider inertial forces when rating compressors, useful data onthis point is seldom available in the field. Except in specialcases, inertial forces are ignored.
A tail-rod cylinder would require consideration of rod cross-section area on both sides of the piston instead of on only oneside of the piston, as in Eqs 13-19 and 13-20.
HorsepowerDetailed compressor horsepower calculations can be made
through the use of Figs. 13-12 and 13-13. For ease of calcula-tions, these figures provide net horsepower, including me-chanical efficiency and gas losses. Figs. 13-14 and 13-15 areincluded for modifying the horsepower numbers for specialconditions.
Proper use of these charts should provide the user with rea-sonably correct horsepower requirements that are comparableto those calculated by the compressor manufacturer. For moredetailed design, the engineer should consult a compressormanufacturer.
Volumes to be handled in each stage must be corrected tothe actual temperature at the inlet to that stage. Note thatmoisture content corrections can also be important at lowpressure and/or high temperature.
When intercoolers are used, allowance must be made forinterstage pressure drop. Interstage pressures may be esti-mated by:
1. Obtaining the overall compression ratio, rt.2. Obtaining the calculated ratio per stage, r, by taking the
s root of rt, where s is the number of compression stages.3. Multiplying r by the absolute intake pressure of the stage
being considered.
This procedure gives the absolute discharge pressure of thisstage and the theoretical absolute intake pressure to the nextstage. The next stage intake pressure can be corrected for in-tercooler pressure drop by reducing the pressure by 3-5 psi.This can be significant in low pressure stages.
Horsepower for compression is calculated by using Figs.13-12 and 13-13 and Eq. 13-21.
Bhp = (Bhp/MMcfd)
PL
14.4
Ts
TL
(Zavg) (MMcfd)
Eq 13-21
Bhp/MMcfd is read from Figs. 13-12 and 13-13 which use apressure base of 14.4 psia.
-9
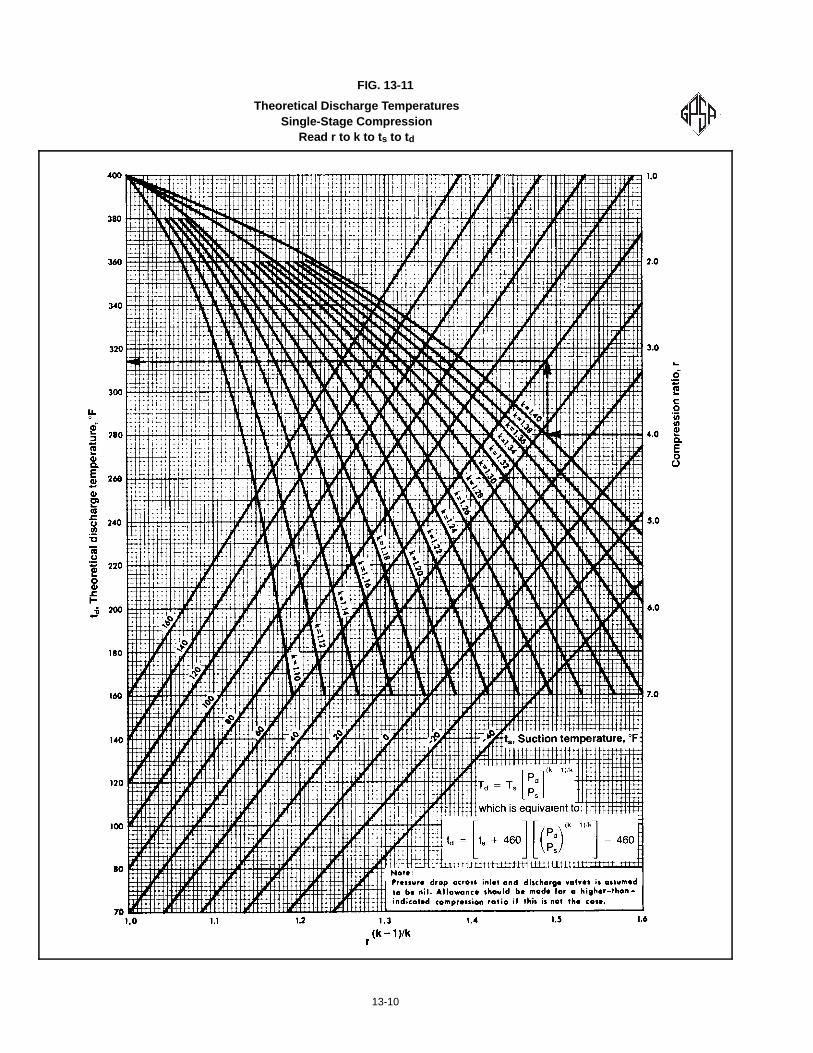
FIG. 13-11
Theoretical Discharge TemperaturesSingle-Stage Compression
Read r to k to t s to t d
13-10
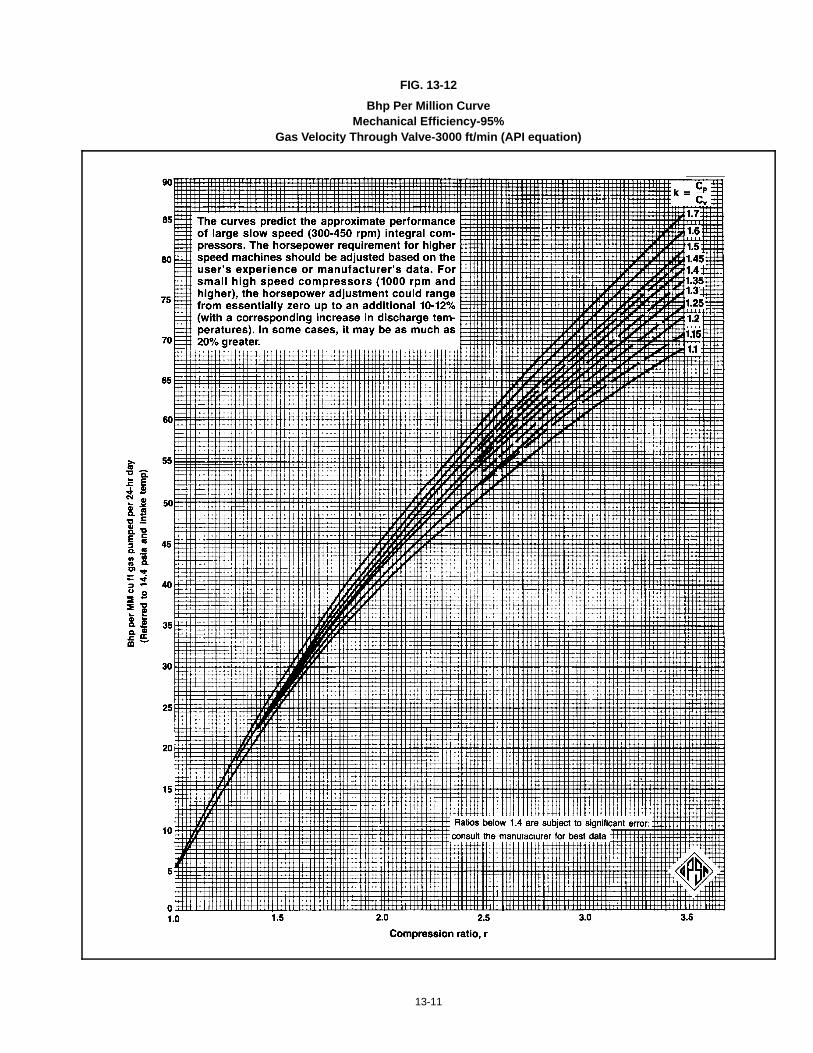
FIG. 13-12
Bhp Per Million CurveMechanical Efficiency-95%
Gas Velocity Through Valve-3000 ft/min (API equation)
13-11
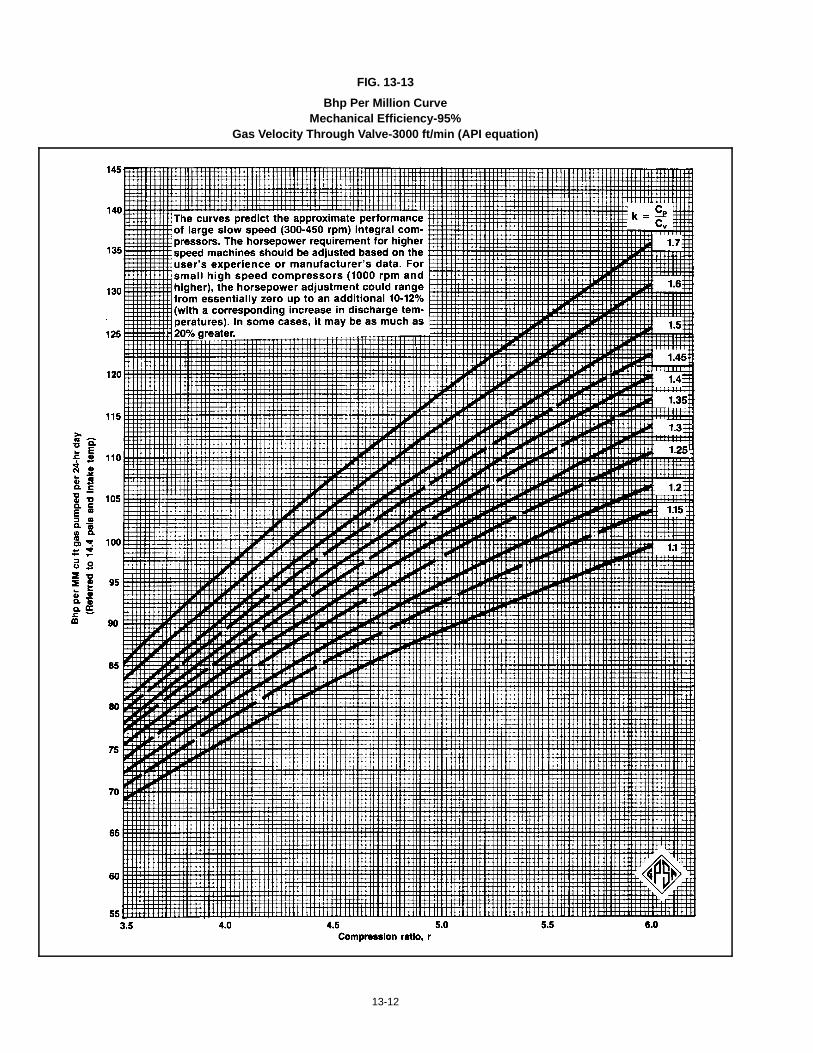
FIG. 13-13
Bhp Per Million CurveMechanical Efficiency-95%
Gas Velocity Through Valve-3000 ft/min (API equation)
13-12
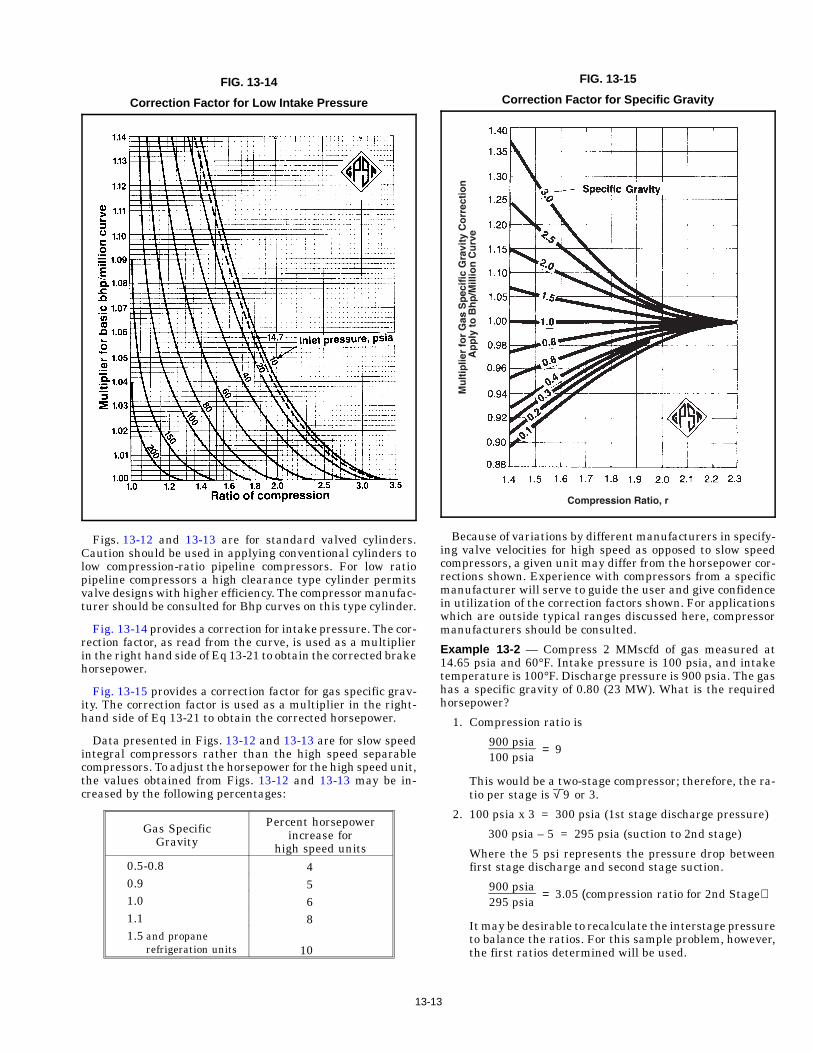
FIG. 13-14
Correcti on Factor for Low Intake Press ure
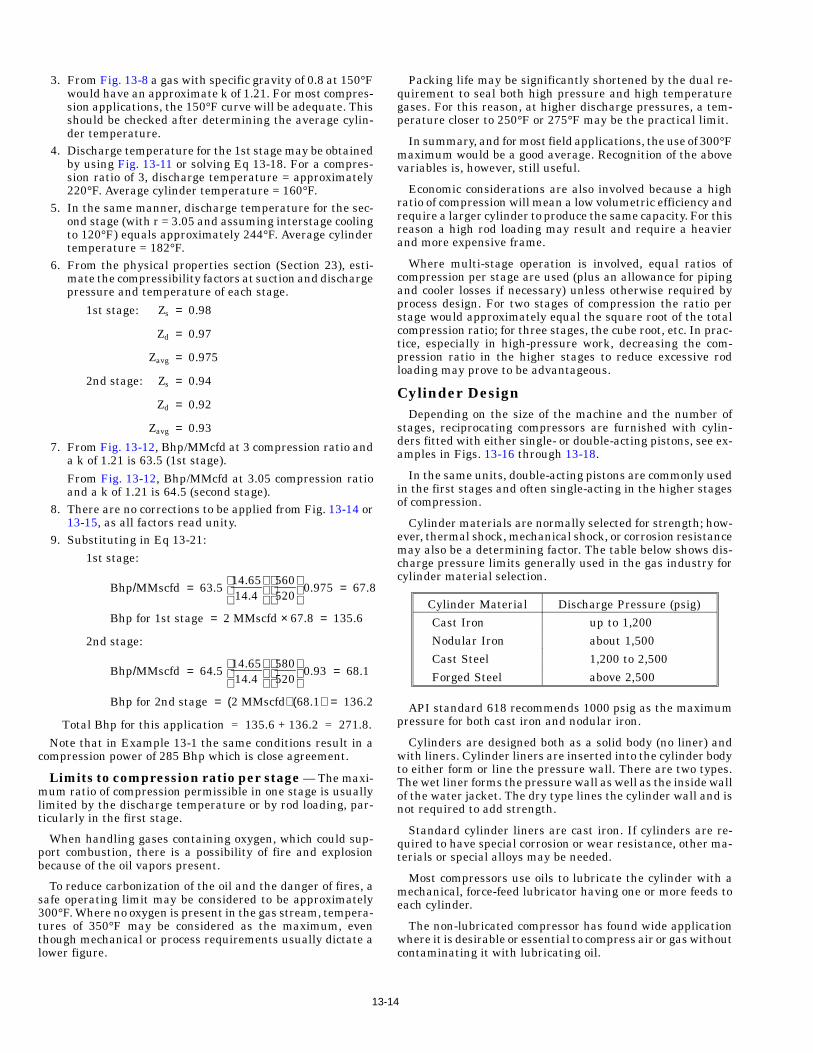
FIG. 13-15
Correction Factor for Specif ic Gravity
Figs. 13-12 and 13-13 are for standard valved cylinders.Caution should be used in applying conventional cylinders tolow compression-ratio pipeline compressors. For low ratiopipeline compressors a high clearance type cylinder permitsvalve designs with higher efficiency. The compressor manufac-turer should be consulted for Bhp curves on this type cylinder.
Fig. 13-14 provides a correction for intake pressure. The cor-rection factor, as read from the curve, is used as a multiplierin the right hand side of Eq 13-21 to obtain the corrected brakehorsepower.
Fig. 13-15 provides a correction factor for gas specific grav-ity. The correction factor is used as a multiplier in the right-hand side of Eq 13-21 to obtain the corrected horsepower.
Data presented in Figs. 13-12 and 13-13 are for slow speedintegral compressors rather than the high speed separablecompressors. To adjust the horsepower for the high speed unit,the values obtained from Figs. 13-12 and 13-13 may be in-creased by the following percentages:
Gas SpecificGravity
Percent horsepowerincrease for
high speed units0.5-0.8 40.9 51.0 61.1 81.5 and propane
refrigeration units 10
13-
Because of variations by different manufacturers in specify-ing valve velocities for high speed as opposed to slow speedcompressors, a given unit may differ from the horsepower cor-rections shown. Experience with compressors from a specificmanufacturer will serve to guide the user and give confidencein utilization of the correction factors shown. For applicationswhich are outside typical ranges discussed here, compressormanufacturers should be consulted.
Example 13-2 — Compress 2 MMscfd of gas measured at14.65 psia and 60°F. Intake pressure is 100 psia, and intaketemperature is 100°F. Discharge pressure is 900 psia. The gashas a specific gravity of 0.80 (23 MW). What is the requiredhorsepower?
1. Compression ratio is
900 psia100 psia
= 9
This would be a two-stage compressor; therefore, the ra-tio per stage is √ 9 or 3.
2. 100 psia x 3 = 300 psia (1st stage discharge pressure)
300 psia – 5 = 295 psia (suction to 2nd stage)
Where the 5 psi represents the pressure drop betweenfirst stage discharge and second stage suction.
900 psia295 psia
= 3.05 (compression ratio for 2nd Stage)
It may be desirable to recalculate the interstage pressureto balance the ratios. For this sample problem, however,the first ratios determined will be used.
13
3. From Fig. 13-8 a gas with specific gravity of 0.8 at 150°Fwould have an approximate k of 1.21. For most compres-sion applications, the 150°F curve will be adequate. Thisshould be checked after determining the average cylin-der temperature.
4. Discharge temperature for the 1st stage may be obtainedby using Fig. 13-11 or solving Eq 13-18. For a compres-sion ratio of 3, discharge temperature = approximately220°F. Average cylinder temperature = 160°F.
5. In the same manner, discharge temperature for the sec-ond stage (with r = 3.05 and assuming interstage coolingto 120°F) equals approximately 244°F. Average cylindertemperature = 182°F.
6. From the physical properties section (Section 23), esti-mate the compressibility factors at suction and dischargepressure and temperature of each stage.
1st stage: Zs = 0.98
Zd = 0.97
Zavg = 0.975
2nd stage: Zs = 0.94
Zd = 0.92
Zavg = 0.93
7. From Fig. 13-12, Bhp/MMcfd at 3 compression ratio anda k of 1.21 is 63.5 (1st stage).
From Fig. 13-12, Bhp/MMcfd at 3.05 compression ratioand a k of 1.21 is 64.5 (second stage).
8. There are no corrections to be applied from Fig. 13-14 or13-15, as all factors read unity.
9. Substituting in Eq 13-21:1st stage:
Bhp/MMscfd = 63.5
14.6514.4
560520
0.975 = 67.8
Bhp for 1st stage = 2 MMscfd × 67.8 = 135.6
2nd stage:
Bhp/MMscfd = 64.5
14.6514.4
580520
0.93 = 68.1
Bhp for 2nd stage = (2 MMscfd) (68.1) = 136.2
Total Bhp for this application = 135.6 + 136.2 = 271.8.
Note that in Example 13-1 the same conditions result in acompression power of 285 Bhp which is close agreement.
Limits to compression ratio per stage — The maxi-mum ratio of compression permissible in one stage is usuallylimited by the discharge temperature or by rod loading, par-ticularly in the first stage.
When handling gases containing oxygen, which could sup-port combustion, there is a possibility of fire and explosionbecause of the oil vapors present.
To reduce carbonization of the oil and the danger of fires, asafe operating limit may be considered to be approximately300°F. Where no oxygen is present in the gas stream, tempera-tures of 350°F may be considered as the maximum, eventhough mechanical or process requirements usually dictate alower figure.
13-
Packing life may be significantly shortened by the dual re-quirement to seal both high pressure and high temperaturegases. For this reason, at higher discharge pressures, a tem-perature closer to 250°F or 275°F may be the practical limit.
In summary, and for most field applications, the use of 300°Fmaximum would be a good average. Recognition of the abovevariables is, however, still useful.
Economic considerations are also involved because a highratio of compression will mean a low volumetric efficiency andrequire a larger cylinder to produce the same capacity. For thisreason a high rod loading may result and require a heavierand more expensive frame.
Where multi-stage operation is involved, equal ratios ofcompression per stage are used (plus an allowance for pipingand cooler losses if necessary) unless otherwise required byprocess design. For two stages of compression the ratio perstage would approximately equal the square root of the totalcompression ratio; for three stages, the cube root, etc. In prac-tice, especially in high-pressure work, decreasing the com-pression ratio in the higher stages to reduce excessive rodloading may prove to be advantageous.
Cylinder DesignDepending on the size of the machine and the number of
stages, reciprocating compressors are furnished with cylin-ders fitted with either single- or double-acting pistons, see ex-amples in Figs. 13-16 through 13-18.
In the same units, double-acting pistons are commonly usedin the first stages and often single-acting in the higher stagesof compression.
Cylinder materials are normally selected for strength; how-ever, thermal shock, mechanical shock, or corrosion resistancemay also be a determining factor. The table below shows dis-charge pressure limits generally used in the gas industry forcylinder material selection.
Cylinder Material Discharge Pressure (psig)
Cast Iron up to 1,200
Nodular Iron about 1,500
Cast Steel 1,200 to 2,500
Forged Steel above 2,500
API standard 618 recommends 1000 psig as the maximumpressure for both cast iron and nodular iron.
Cylinders are designed both as a solid body (no liner) andwith liners. Cylinder liners are inserted into the cylinder bodyto either form or line the pressure wall. There are two types.The wet liner forms the pressure wall as well as the inside wallof the water jacket. The dry type lines the cylinder wall and isnot required to add strength.
Standard cylinder liners are cast iron. If cylinders are re-quired to have special corrosion or wear resistance, other ma-terials or special alloys may be needed.
Most compressors use oils to lubricate the cylinder with amechanical, force-feed lubricator having one or more feeds toeach cylinder.
The non-lubricated compressor has found wide applicationwhere it is desirable or essential to compress air or gas withoutcontaminating it with lubricating oil.
14
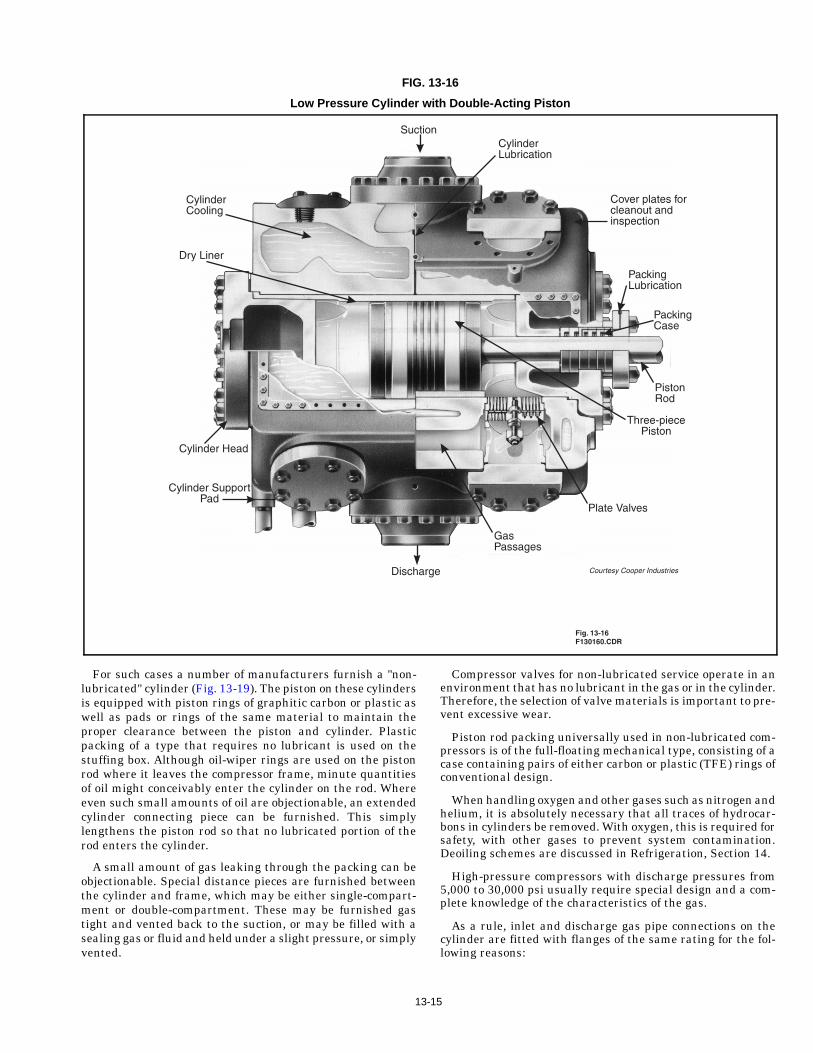
FIG. 13-16
Low Pressure Cylinder with D ouble-Act ing Piston
For such cases a number of manufacturers furnish a "non-lubricated" cylinder (Fig. 13-19). The piston on these cylindersis equipped with piston rings of graphitic carbon or plastic aswell as pads or rings of the same material to maintain theproper clearance between the piston and cylinder. Plasticpacking of a type that requires no lubricant is used on thestuffing box. Although oil-wiper rings are used on the pistonrod where it leaves the compressor frame, minute quantitiesof oil might conceivably enter the cylinder on the rod. Whereeven such small amounts of oil are objectionable, an extendedcylinder connecting piece can be furnished. This simplylengthens the piston rod so that no lubricated portion of therod enters the cylinder.
A small amount of gas leaking through the packing can beobjectionable. Special distance pieces are furnished betweenthe cylinder and frame, which may be either single-compart-ment or double-compartment. These may be furnished gastight and vented back to the suction, or may be filled with asealing gas or fluid and held under a slight pressure, or simplyvented.
13-1
Compressor valves for non-lubricated service operate in anenvironment that has no lubricant in the gas or in the cylinder.Therefore, the selection of valve materials is important to pre-vent excessive wear.
Piston rod packing universally used in non-lubricated com-pressors is of the full-floating mechanical type, consisting of acase containing pairs of either carbon or plastic (TFE) rings ofconventional design.
When handling oxygen and other gases such as nitrogen andhelium, it is absolutely necessary that all traces of hydrocar-bons in cylinders be removed. With oxygen, this is required forsafety, with other gases to prevent system contamination.Deoiling schemes are discussed in Refrigeration, Section 14.
High-pressure compressors with discharge pressures from5,000 to 30,000 psi usually require special design and a com-plete knowledge of the characteristics of the gas.
As a rule, inlet and discharge gas pipe connections on thecylinder are fitted with flanges of the same rating for the fol-lowing reasons:
5
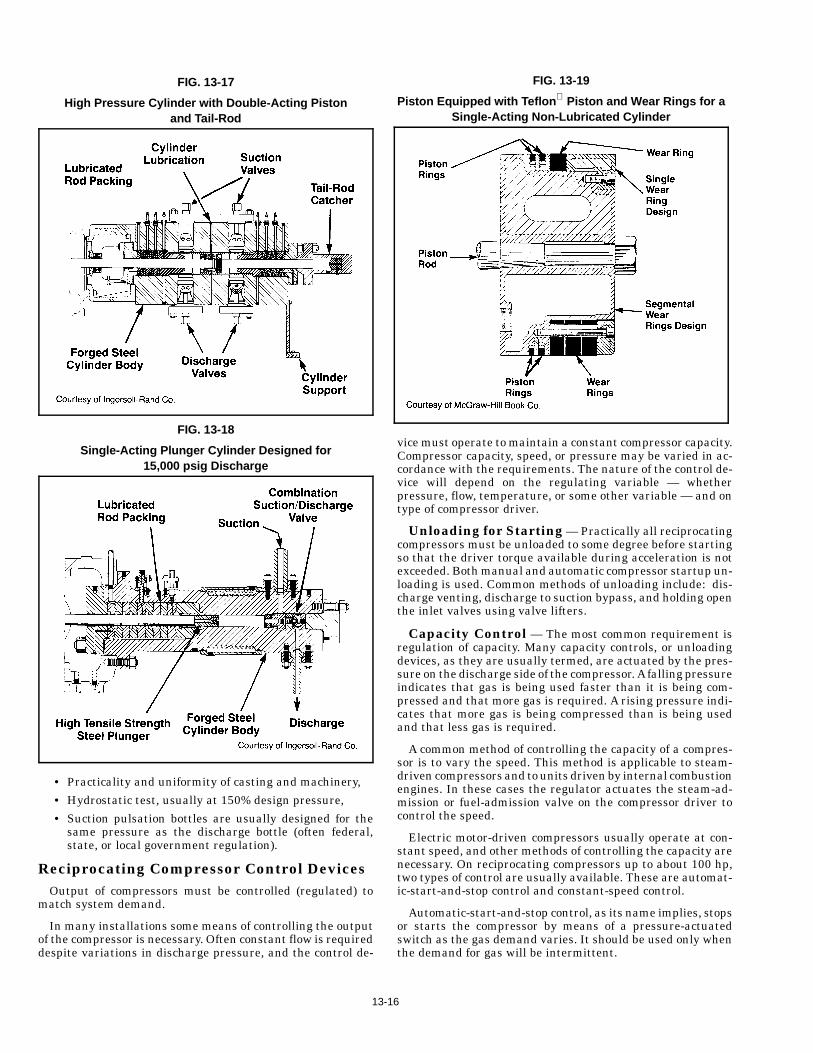
FIG. 13-17
High Pressure Cylinder with Double-Acting Pistonand Tail-Rod
FIG. 13-18
Single-Acting Plunger Cylinder Designed for15,000 psig Discharge
FIG. 13-19
Piston Equipped with Teflon Piston and Wear Rings for aSingle-Acting Non-Lubricated Cylinder
• Practicality and uniformity of casting and machinery,
• Hydrostatic test, usually at 150% design pressure,
• Suction pulsation bottles are usually designed for thesame pressure as the discharge bottle (often federal,state, or local government regulation).
Reciprocating Compressor Control DevicesOutput of compressors must be controlled (regulated) to
match system demand.
In many installations some means of controlling the outputof the compressor is necessary. Often constant flow is requireddespite variations in discharge pressure, and the control de-
13-
vice must operate to maintain a constant compressor capacity.Compressor capacity, speed, or pressure may be varied in ac-cordance with the requirements. The nature of the control de-vice will depend on the regulating variable — whetherpressure, flow, temperature, or some other variable — and ontype of compressor driver.
Unloading for Starting — Practically all reciprocatingcompressors must be unloaded to some degree before startingso that the driver torque available during acceleration is notexceeded. Both manual and automatic compressor startup un-loading is used. Common methods of unloading include: dis-charge venting, discharge to suction bypass, and holding openthe inlet valves using valve lifters.
Capacity Control — The most common requirement isregulation of capacity. Many capacity controls, or unloadingdevices, as they are usually termed, are actuated by the pres-sure on the discharge side of the compressor. A falling pressureindicates that gas is being used faster than it is being com-pressed and that more gas is required. A rising pressure indi-cates that more gas is being compressed than is being usedand that less gas is required.
A common method of controlling the capacity of a compres-sor is to vary the speed. This method is applicable to steam-driven compressors and to units driven by internal combustionengines. In these cases the regulator actuates the steam-ad-mission or fuel-admission valve on the compressor driver tocontrol the speed.
Electric motor-driven compressors usually operate at con-stant speed, and other methods of controlling the capacity arenecessary. On reciprocating compressors up to about 100 hp,two types of control are usually available. These are automat-ic-start-and-stop control and constant-speed control.
Automatic-start-and-stop control, as its name implies, stopsor starts the compressor by means of a pressure-actuatedswitch as the gas demand varies. It should be used only whenthe demand for gas will be intermittent.
16
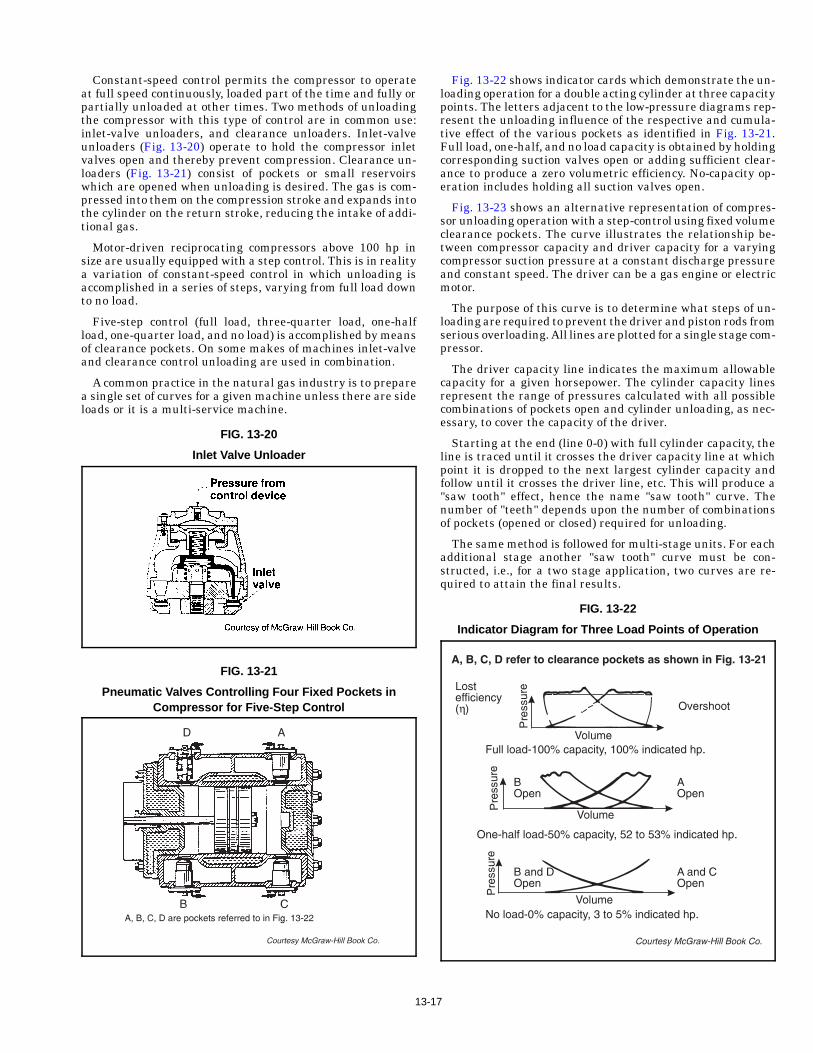
Constant-speed control permits the compressor to operateat full speed continuously, loaded part of the time and fully orpartially unloaded at other times. Two methods of unloadingthe compressor with this type of control are in common use:inlet-valve unloaders, and clearance unloaders. Inlet-valveunloaders (Fig. 13-20) operate to hold the compressor inletvalves open and thereby prevent compression. Clearance un-loaders (Fig. 13-21) consist of pockets or small reservoirswhich are opened when unloading is desired. The gas is com-pressed into them on the compression stroke and expands intothe cylinder on the return stroke, reducing the intake of addi-tional gas.
Motor-driven reciprocating compressors above 100 hp insize are usually equipped with a step control. This is in realitya variation of constant-speed control in which unloading isaccomplished in a series of steps, varying from full load downto no load.
Five-step control (full load, three-quarter load, one-halfload, one-quarter load, and no load) is accomplished by meansof clearance pockets. On some makes of machines inlet-valveand clearance control unloading are used in combination.
A common practice in the natural gas industry is to preparea single set of curves for a given machine unless there are sideloads or it is a multi-service machine.
FIG. 13-20
Inlet Valve Unloader
FIG. 13-21
Pneumatic Valves Contr olling Four Fixed Pockets inCompressor for F ive-Step Contr ol
13-
Fig. 13-22 shows indicator cards which demonstrate the un-loading operation for a double acting cylinder at three capacitypoints. The letters adjacent to the low-pressure diagrams rep-resent the unloading influence of the respective and cumula-tive effect of the various pockets as identified in Fig. 13-21.Full load, one-half, and no load capacity is obtained by holdingcorresponding suction valves open or adding sufficient clear-ance to produce a zero volumetric efficiency. No-capacity op-eration includes holding all suction valves open.
Fig. 13-23 shows an alternative representation of compres-sor unloading operation with a step-control using fixed volumeclearance pockets. The curve illustrates the relationship be-tween compressor capacity and driver capacity for a varyingcompressor suction pressure at a constant discharge pressureand constant speed. The driver can be a gas engine or electricmotor.
The purpose of this curve is to determine what steps of un-loading are required to prevent the driver and piston rods fromserious overloading. All lines are plotted for a single stage com-pressor.
The driver capacity line indicates the maximum allowablecapacity for a given horsepower. The cylinder capacity linesrepresent the range of pressures calculated with all possiblecombinations of pockets open and cylinder unloading, as nec-essary, to cover the capacity of the driver.
Starting at the end (line 0-0) with full cylinder capacity, theline is traced until it crosses the driver capacity line at whichpoint it is dropped to the next largest cylinder capacity andfollow until it crosses the driver line, etc. This will produce a"saw tooth" effect, hence the name "saw tooth" curve. Thenumber of "teeth" depends upon the number of combinationsof pockets (opened or closed) required for unloading.
The same method is followed for multi-stage units. For eachadditional stage another "saw tooth" curve must be con-structed, i.e., for a two stage application, two curves are re-quired to attain the final results.
FIG. 13-22
Indicato r Diagram for Three Load Points of Operati on
17
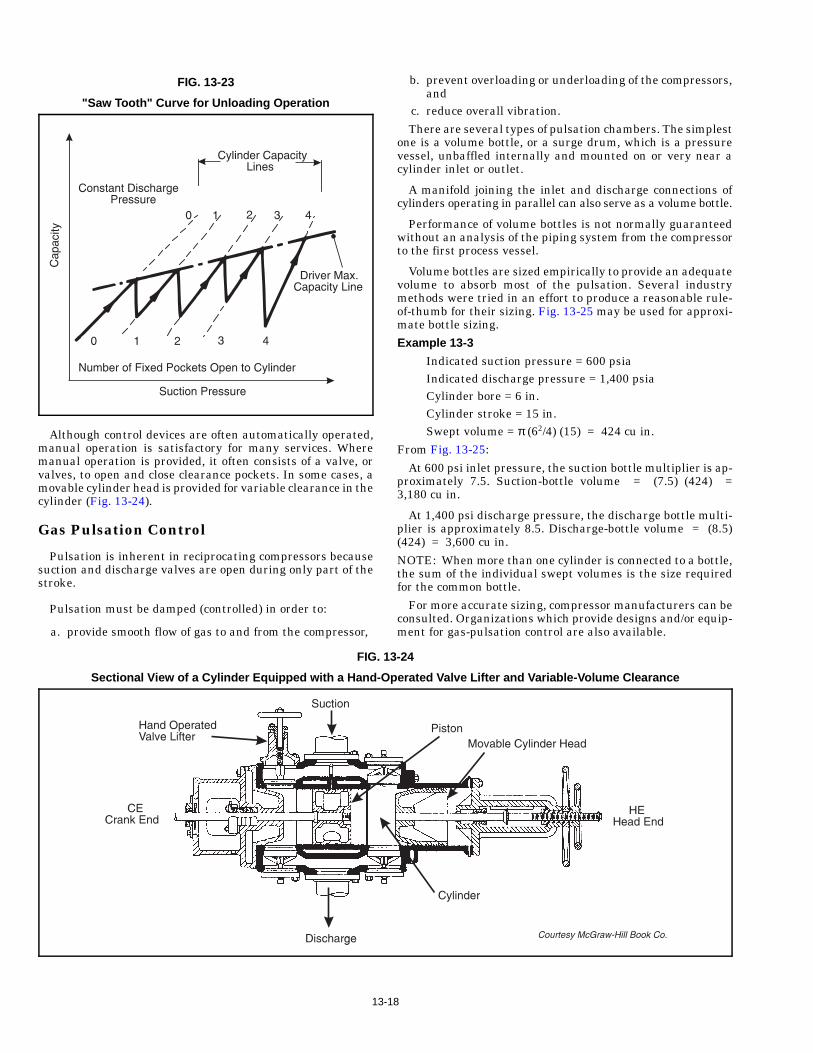
FIG. 13-23
"Saw Tooth" C urve f or Unloading Operat ion
Although control devices are often automatically operated,manual operation is satisfactory for many services. Wheremanual operation is provided, it often consists of a valve, orvalves, to open and close clearance pockets. In some cases, amovable cylinder head is provided for variable clearance in thecylinder (Fig. 13-24).
Gas Pulsation Control
Pulsation is inherent in reciprocating compressors becausesuction and discharge valves are open during only part of thestroke.
Pulsation must be damped (controlled) in order to:
a. provide smooth flow of gas to and from the compressor,
FIG. 13
Secti onal View of a Cyl inder Equipped wit h a Hand-Op
13-1
b. prevent overloading or underloading of the compressors,and
c. reduce overall vibration.
There are several types of pulsation chambers. The simplestone is a volume bottle, or a surge drum, which is a pressurevessel, unbaffled internally and mounted on or very near acylinder inlet or outlet.
A manifold joining the inlet and discharge connections ofcylinders operating in parallel can also serve as a volume bottle.
Performance of volume bottles is not normally guaranteedwithout an analysis of the piping system from the compressorto the first process vessel.
Volume bottles are sized empirically to provide an adequatevolume to absorb most of the pulsation. Several industrymethods were tried in an effort to produce a reasonable rule-of-thumb for their sizing. Fig. 13-25 may be used for approxi-mate bottle sizing.
Example 13-3
Indicated suction pressure = 600 psiaIndicated discharge pressure = 1,400 psiaCylinder bore = 6 in.Cylinder stroke = 15 in.Swept volume = π (62/4) (15) = 424 cu in.
From Fig. 13-25:
At 600 psi inlet pressure, the suction bottle multiplier is ap-proximately 7.5. Suction-bottle volume = (7.5) (424) =3,180 cu in.
At 1,400 psi discharge pressure, the discharge bottle multi-plier is approximately 8.5. Discharge-bottle volume = (8.5)(424) = 3,600 cu in.
NOTE: When more than one cylinder is connected to a bottle,the sum of the individual swept volumes is the size requiredfor the common bottle.
For more accurate sizing, compressor manufacturers can beconsulted. Organizations which provide designs and/or equip-ment for gas-pulsation control are also available.
-24
erate d Valve Lifter an d Variab le-Volume Clearance
8
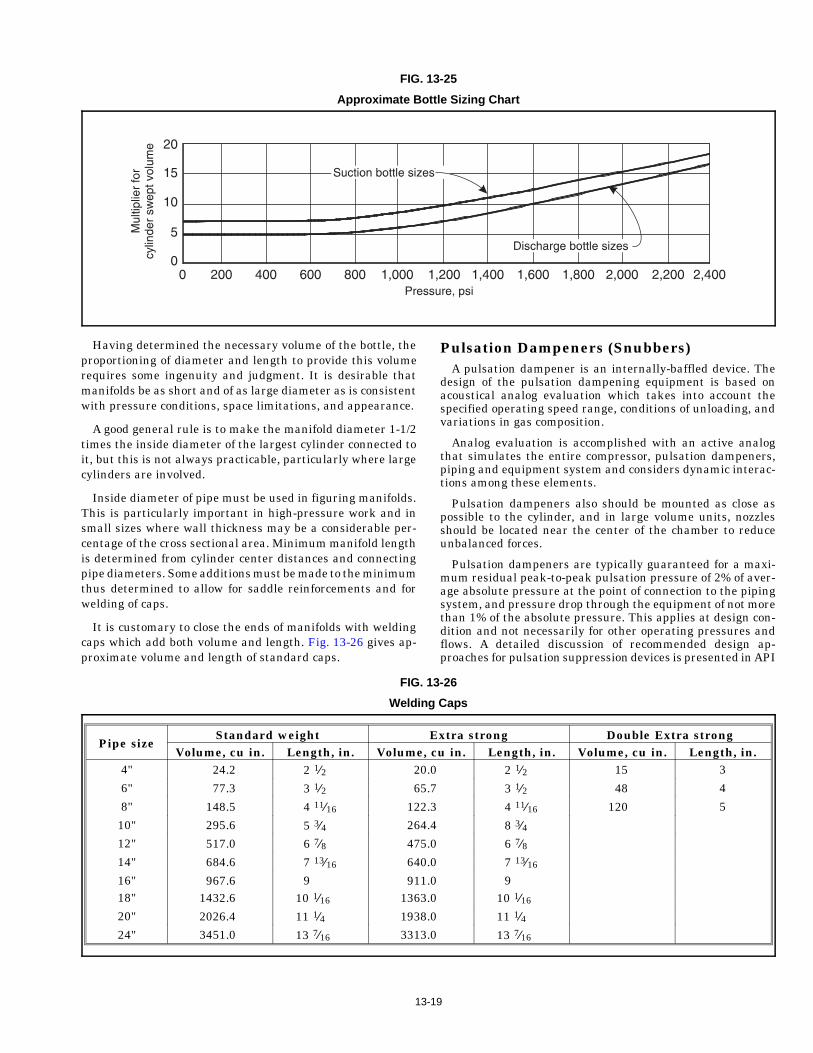
FIG. 13-25
Approximate B ottle S izing Chart
Having determined the necessary volume of the bottle, theproportioning of diameter and length to provide this volumerequires some ingenuity and judgment. It is desirable thatmanifolds be as short and of as large diameter as is consistentwith pressure conditions, space limitations, and appearance.
A good general rule is to make the manifold diameter 1-1/2times the inside diameter of the largest cylinder connected toit, but this is not always practicable, particularly where largecylinders are involved.
Inside diameter of pipe must be used in figuring manifolds.This is particularly important in high-pressure work and insmall sizes where wall thickness may be a considerable per-centage of the cross sectional area. Minimum manifold lengthis determined from cylinder center distances and connectingpipe diameters. Some additions must be made to the minimumthus determined to allow for saddle reinforcements and forwelding of caps.
It is customary to close the ends of manifolds with weldingcaps which add both volume and length. Fig. 13-26 gives ap-proximate volume and length of standard caps.
Pipe sizeStandard weight E
Volume, cu in. Length, in. Volume, 4" 24.2 2 1⁄2 20.0
6" 77.3 3 1⁄2 65.7
8" 148.5 4 11⁄16 122.3
10" 295.6 5 3⁄4 264.4
12" 517.0 6 7⁄8 475.0
14" 684.6 7 13⁄16 640.0
16" 967.6 9 911.018" 1432.6 10 1⁄16 1363.0
20" 2026.4 11 1⁄4 1938.0
24" 3451.0 13 7⁄16 3313.0
FIG. 1
Welding
13-1
Pulsation Dampeners (Snubbers)A pulsation dampener is an internally-baffled device. The
design of the pulsation dampening equipment is based onacoustical analog evaluation which takes into account thespecified operating speed range, conditions of unloading, andvariations in gas composition.
Analog evaluation is accomplished with an active analogthat simulates the entire compressor, pulsation dampeners,piping and equipment system and considers dynamic interac-tions among these elements.
Pulsation dampeners also should be mounted as close aspossible to the cylinder, and in large volume units, nozzlesshould be located near the center of the chamber to reduceunbalanced forces.
Pulsation dampeners are typically guaranteed for a maxi-mum residual peak-to-peak pulsation pressure of 2% of aver-age absolute pressure at the point of connection to the pipingsystem, and pressure drop through the equipment of not morethan 1% of the absolute pressure. This applies at design con-dition and not necessarily for other operating pressures andflows. A detailed discussion of recommended design ap-proaches for pulsation suppression devices is presented in API
xtra strong Double Extra strongcu in. Length, in. Volume, cu in. Length, in. 2 1⁄2 15 3
3 1⁄2 48 4
4 11⁄16 120 5
8 3⁄4 6 7⁄8 7 13⁄16
9 10 1⁄16
11 1⁄4 13 7⁄16
3-26
Caps
9
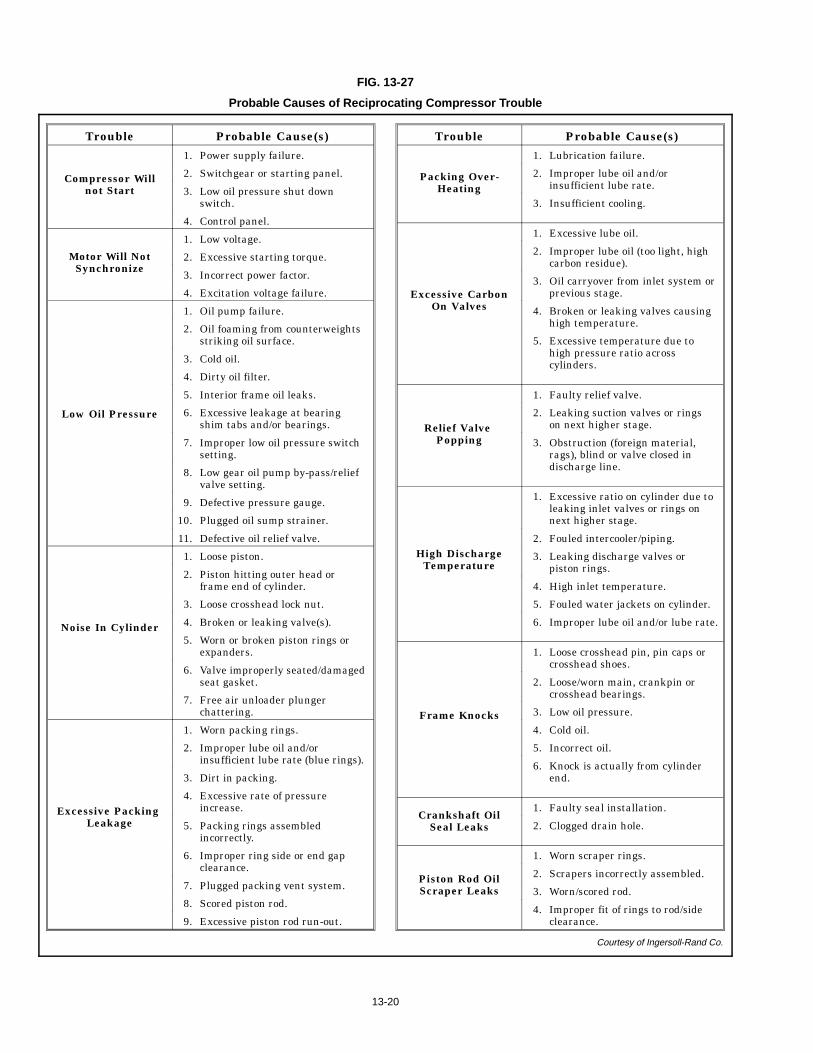
FIG. 13-27
Probable Causes of Reciprocating Compressor Trouble
Trouble Probable Cause(s)
Compressor Willnot Start
1. Power supply failure.
2. Switchgear or starting panel.
3. Low oil pressure shut downswitch.
4. Control panel.
Motor Will NotSynchronize
1. Low voltage.
2. Excessive starting torque.
3. Incorrect power factor.
4. Excitation voltage failure.
Low Oil Pressure
1. Oil pump failure.
2. Oil foaming from counterweightsstriking oil surface.
3. Cold oil.
4. Dirty oil filter.
5. Interior frame oil leaks.
6. Excessive leakage at bearingshim tabs and/or bearings.
7. Improper low oil pressure switchsetting.
8. Low gear oil pump by-pass/reliefvalve setting.
9. Defective pressure gauge.
10. Plugged oil sump strainer.
11. Defective oil relief valve.
Noise In Cylinder
1. Loose piston.
2. Piston hitting outer head orframe end of cylinder.
3. Loose crosshead lock nut.
4. Broken or leaking valve(s).
5. Worn or broken piston rings orexpanders.
6. Valve improperly seated/damagedseat gasket.
7. Free air unloader plungerchattering.
Excessive Packing Leakage
1. Worn packing rings.
2. Improper lube oil and/orinsufficient lube rate (blue rings).
3. Dirt in packing.
4. Excessive rate of pressureincrease.
5. Packing rings assembledincorrectly.
6. Improper ring side or end gapclearance.
7. Plugged packing vent system.
8. Scored piston rod.
9. Excessive piston rod run-out.
13-20
Trouble Probable Cause(s)
Packing Over-Heating
1. Lubrication failure.
2. Improper lube oil and/orinsufficient lube rate.
3. Insufficient cooling.
Excessive CarbonOn Valves
1. Excessive lube oil.
2. Improper lube oil (too light, highcarbon residue).
3. Oil carryover from inlet system orprevious stage.
4. Broken or leaking valves causinghigh temperature.
5. Excessive temperature due tohigh pressure ratio acrosscylinders.
Relief Valve Popping
1. Faulty relief valve.
2. Leaking suction valves or ringson next higher stage.
3. Obstruction (foreign material,rags), blind or valve closed indischarge line.
High DischargeTemperature
1. Excessive ratio on cylinder due toleaking inlet valves or rings onnext higher stage.
2. Fouled intercooler/piping.
3. Leaking discharge valves orpiston rings.
4. High inlet temperature.
5. Fouled water jackets on cylinder.
6. Improper lube oil and/or lube rate.
Frame Knocks
1. Loose crosshead pin, pin caps orcrosshead shoes.
2. Loose/worn main, crankpin orcrosshead bearings.
3. Low oil pressure.
4. Cold oil.
5. Incorrect oil.
6. Knock is actually from cylinderend.
Crankshaft OilSeal Leaks
1. Faulty seal installation.
2. Clogged drain hole.
Piston Rod OilScraper Leaks
1. Worn scraper rings.
2. Scrapers incorrectly assembled.
3. Worn/scored rod.
4. Improper fit of rings to rod/sideclearance.
Courtesy of Ingersoll-Rand Co.
Standard 618, Reciprocating Compressors for General Refin-ery Services.
As pressure vessels, all pulsation chambers (volume bottlesand dampeners) are generally built to Section VIII of ASMECode and suitable for applicable cylinder relief valve set pres-sure.
Suction pulsation chambers are often designed for the samepressure as the discharge units, or for a minimum of 2/3 of thedesign discharge pressure.
TroubleshootingMinor troubles can normally be expected at various times
during routine operation of the compressor. These troubles aremost often traced to dirt, liquid, and maladjustment, or to op-erating personnel being unfamiliar with functions of the vari-ous machine parts and systems. Difficulties of this type canusually be corrected by cleaning, proper adjustment, elimina-tion of an adverse condition, or quick replacement of a rela-tively minor part.
Major trouble can usually be traced to long periods of opera-tion with unsuitable coolant or lubrication, careless operationand routine maintenance, or the use of the machine on a serv-ice for which it was not intended.
A defective inlet valve can generally be found by feeling thevalve cover. It will be much warmer than normal. Dischargevalve leakage is not as easy to detect since the discharge isalways hot. Experienced operators of water-cooled units canusually tell by feel if a particular valve is leaking. The bestindication of discharge valve trouble is the discharge tempera-ture. This will rise, sometimes rapidly, when a valve is in poorcondition or breaks. This is one very good reason for keepinga record of the discharge temperature from each cylinder.
Recording of the interstage pressure on multistage units isvaluable because any variation, when operating at a givenload point, indicates trouble in one or the other of the twostages. If the pressure drops, the trouble is in the low pressurecylinder. If it rises, the problem is in the high pressure cylin-der.
Troubleshooting is largely a matter of elimination based ona thorough knowledge of the interrelated functions of the vari-ous parts and the effects of adverse conditions. A complete listof possible troubles with their causes and corrections is im-practical, but the following list of the more frequently encoun-tered troubles and their causes is offered as a guide(Fig. 13-27).
CENTRIFUGAL COMPRESSORS
This section is intended to supply information sufficientlyaccurate to determine whether a centrifugal compressorshould be considered for a specific job. The secondary objectiveis to present information for evaluating compressor perform-ance.
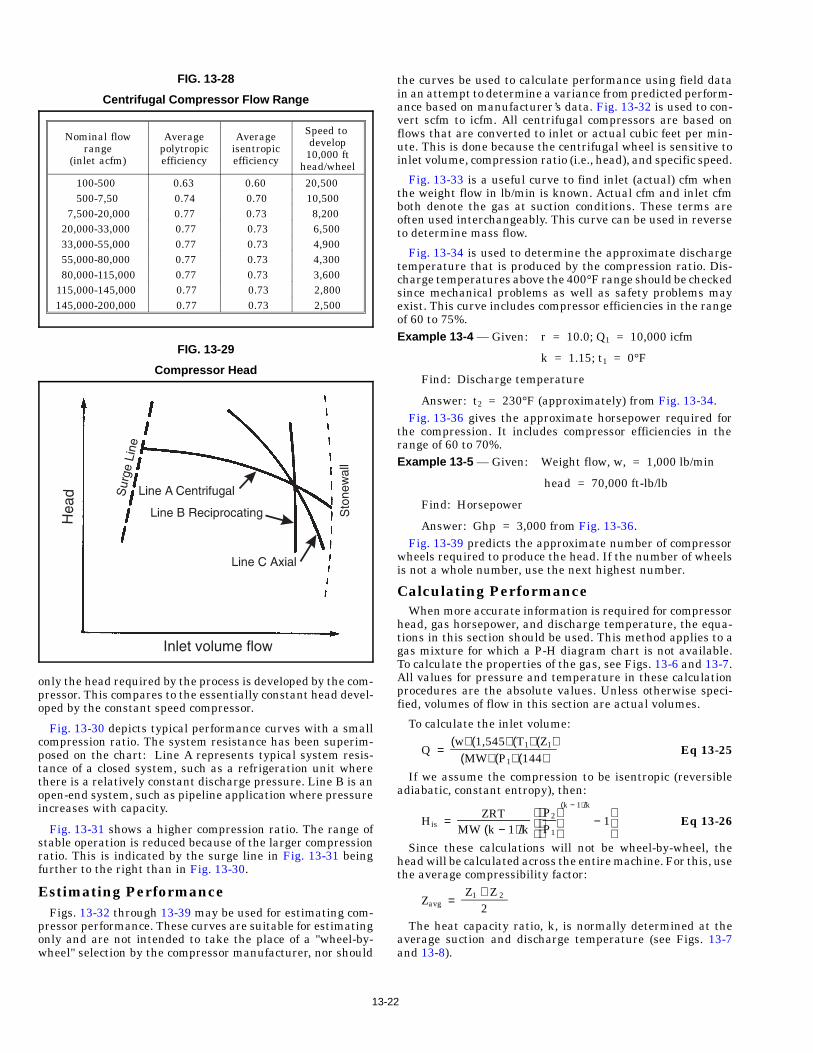
Fig. 13-28 gives an approximate idea of the flow range thata centrifugal compressor will handle. A multi-wheel (multi-stage) centrifugal compressor is normally considered for inletvolumes between 500 and 200,000 inlet acfm. A single-wheel(single stage) compressor would normally have application be-tween 100 and 150,000 inlet acfm. A multiwheel compressorcan be thought of as a series of single wheel compressors con-tained in a single casing.
13-
Most centrifugal compressors operate at speeds of3,000 rpm or higher, a limiting factor being impeller stressconsiderations as well as velocity limitation of 0.8 to0.85 Mach number at the impeller tip and eye. Recent ad-vances in machine design have resulted in production of someunits running at speeds in excess of 40,000 rpm.
Centrifugal compressors are usually driven by electric mo-tors, steam or gas turbines (with or without speed-increasinggears), or turboexpanders.
There is an overlap of centrifugal and reciprocating com-pressors on the low end of the flow range, see Fig. 13-3. On thehigher end of the flow range an overlap with the axial com-pressor exists. The extent of this overlap depends on a numberof things. Before a technical decision could be reached as tothe type of compressor that would be installed, the service,operational requirements, and economics would have to beconsidered.
Performance CalculationsThe operating characteristics must be determined before an
evaluation of compressor suitability for the application can bemade. Fig. 13-29 gives a rough comparison of the charac-teristics of the axial, centrifugal, and reciprocating compres-sor.
The centrifugal compressor approximates the constanthead-variable volume machine, while the reciprocating is aconstant volume-variable head machine. The axial compres-sor, which is a low head, high flow machine, falls somewherein between. A compressor is a part of the system, and its per-formance is dictated by the system resistance. The desired sys-tem capability or objective must be determined before acompressor can be selected.
Fig. 13-30 is a typical performance map which shows thebasic shape of performance curves for a variable-speed cen-trifugal compressor. The curves are affected by many vari-ables, such as desired compression ratio, type of gas, numberof wheels, sizing of compressor, etc.
With variable speed, the centrifugal compressor can deliverconstant capacity at variable pressure, variable capacity atconstant pressure, or a combination variable capacity andvariable pressure.
Basically the performance of the centrifugal compressor, atspeeds other than design, is such that the capacity will varydirectly as the speed, the head developed as the square of thespeed, and the required horsepower as the cube of the speed.As the speed deviates from the design speed, the error of theserules, known as the affinity laws, or fan laws, increases. Thefan laws only apply to single stages or multi-stages with verylow compression ratios or very low Mach numbers.Fan Laws:
Q ∝ N; i.e., Q110
N110 =
Q100
N100 =
Q90
N90Eq 13-22
H ∝ N2; i.e., H110
(N110)2 = H100
(N100)2 = H90
(N90)2 Eq 13-23
Bhp ∝ N3; i.e., Bhp110
(N110)3 = Bhp100
(N100)3 = Bhp90
(N90)3 Eq 13-24
By varying speed, the centrifugal compressor will meet anyload and pressure condition demanded by the process systemwithin the operating limits of the compressor and the driver.It normally accomplishes this as efficiently as possible, since
21
Nominal flowrange
(inlet acfm)
Averagepolytropicefficiency
Averageisentropicefficiency
Speed to develop
10,000 fthead/wheel
100-500 0.63 0.60 20,500500-7,50 0.74 0.70 10,500
7,500-20,000 0.77 0.73 8,20020,000-33,000 0.77 0.73 6,50033,000-55,000 0.77 0.73 4,90055,000-80,000 0.77 0.73 4,30080,000-115,000 0.77 0.73 3,600
115,000-145,000 0.77 0.73 2,800145,000-200,000 0.77 0.73 2,500
FIG. 13-28
Centrif ugal Compressor F low Range
FIG. 13-29
Compressor Head
only the head required by the process is developed by the com-pressor. This compares to the essentially constant head devel-oped by the constant speed compressor.
Fig. 13-30 depicts typical performance curves with a smallcompression ratio. The system resistance has been superim-posed on the chart: Line A represents typical system resis-tance of a closed system, such as a refrigeration unit wherethere is a relatively constant discharge pressure. Line B is anopen-end system, such as pipeline application where pressureincreases with capacity.
Fig. 13-31 shows a higher compression ratio. The range ofstable operation is reduced because of the larger compressionratio. This is indicated by the surge line in Fig. 13-31 beingfurther to the right than in Fig. 13-30.
Estimating PerformanceFigs. 13-32 through 13-39 may be used for estimating com-
pressor performance. These curves are suitable for estimatingonly and are not intended to take the place of a "wheel-by-wheel" selection by the compressor manufacturer, nor should
13-2
the curves be used to calculate performance using field datain an attempt to determine a variance from predicted perform-ance based on manufacturer’s data. Fig. 13-32 is used to con-vert scfm to icfm. All centrifugal compressors are based onflows that are converted to inlet or actual cubic feet per min-ute. This is done because the centrifugal wheel is sensitive toinlet volume, compression ratio (i.e., head), and specific speed.
Fig. 13-33 is a useful curve to find inlet (actual) cfm whenthe weight flow in lb/min is known. Actual cfm and inlet cfmboth denote the gas at suction conditions. These terms areoften used interchangeably. This curve can be used in reverseto determine mass flow.
Fig. 13-34 is used to determine the approximate dischargetemperature that is produced by the compression ratio. Dis-charge temperatures above the 400°F range should be checkedsince mechanical problems as well as safety problems mayexist. This curve includes compressor efficiencies in the rangeof 60 to 75%.Example 13-4 — Given: r = 10.0; Q1 = 10,000 icfm
k = 1.15; t1 = 0°F
Find: Discharge temperature
Answer: t2 = 230°F (approximately) from Fig. 13-34.Fig. 13-36 gives the approximate horsepower required for
the compression. It includes compressor efficiencies in therange of 60 to 70%.Example 13-5 — Given: Weight flow, w, = 1,000 lb/min
head = 70,000 ft-lb/lb
Find: Horsepower
Answer: Ghp = 3,000 from Fig. 13-36.Fig. 13-39 predicts the approximate number of compressor
wheels required to produce the head. If the number of wheelsis not a whole number, use the next highest number.
Calculating PerformanceWhen more accurate information is required for compressor
head, gas horsepower, and discharge temperature, the equa-tions in this section should be used. This method applies to agas mixture for which a P-H diagram chart is not available.To calculate the properties of the gas, see Figs. 13-6 and 13-7.All values for pressure and temperature in these calculationprocedures are the absolute values. Unless otherwise speci-fied, volumes of flow in this section are actual volumes.
To calculate the inlet volume:
Q = (w) (1,545) (T1) (Z1)
(MW) (P1) (144)Eq 13-25
If we assume the compression to be isentropic (reversibleadiabatic, constant entropy), then:
His = ZRT
MW (k − 1)/k
P2
P1
(k − 1)/k
− 1
Eq 13-26
Since these calculations will not be wheel-by-wheel, thehead will be calculated across the entire machine. For this, usethe average compressibility factor:
Zavg = Z1 + Z 2
2The heat capacity ratio, k, is normally determined at the
average suction and discharge temperature (see Figs. 13-7and 13-8).
2
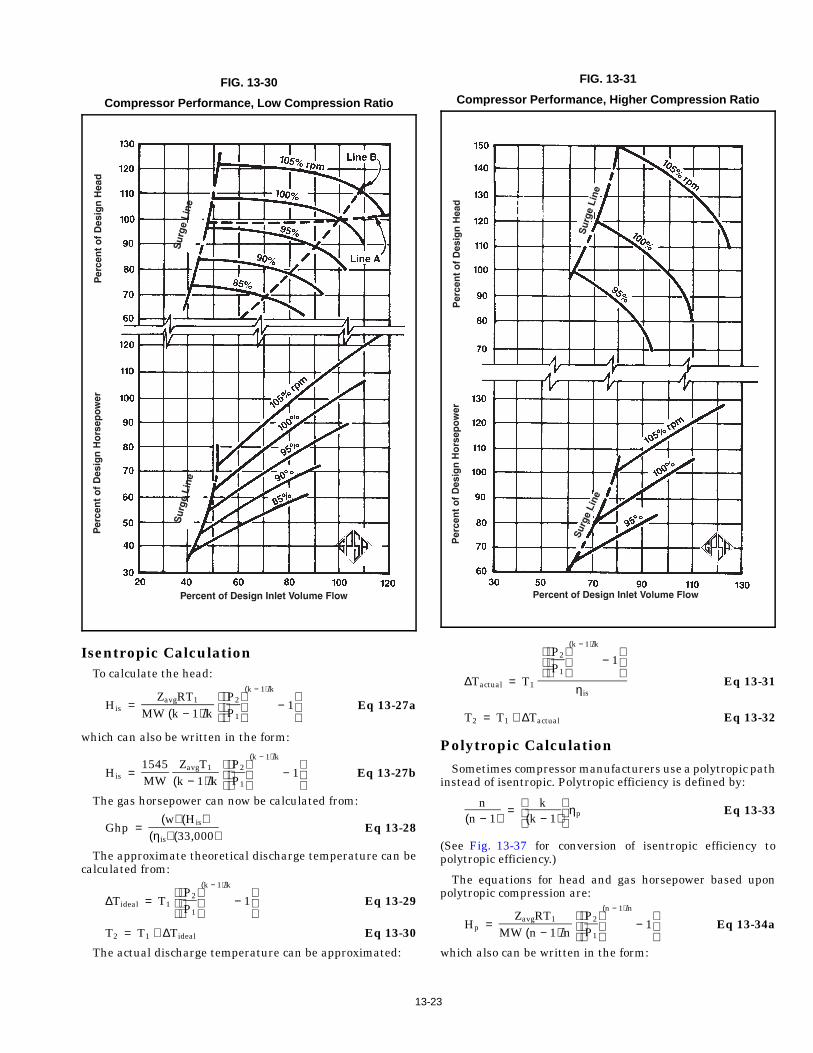
FIG. 13-30
Compressor Performance, Lo w Compression Ratio
FIG. 13-31
Compresso r Performance , Higher Compressi on Ratio
Isentropic CalculationTo calculate the head:
His = ZavgRT1
MW (k − 1)/k
P2
P1
(k − 1)/k
− 1
Eq 13-27a
which can also be written in the form:
His = 1545MW
ZavgT1
(k − 1)/k
P2
P1
(k − 1)/k
− 1
Eq 13-27b
The gas horsepower can now be calculated from:
Ghp = (w) (His)
(ηis) (33,000)Eq 13-28
The approximate theoretical discharge temperature can becalculated from:
∆Tideal = T1
P2
P1
(k − 1)/k
− 1
Eq 13-29
T2 = T1 + ∆Tideal Eq 13-30
The actual discharge temperature can be approximated:
13
∆Tactual = T1
P2
P1
(k − 1)/k
− 1
ηisEq 13-31
T2 = T1 + ∆Tactual Eq 13-32
Polytropic CalculationSometimes compressor manufacturers use a polytropic path
instead of isentropic. Polytropic efficiency is defined by:
n(n − 1)
=
k(k − 1)
ηp Eq 13-33
(See Fig. 13-37 for conversion of isentropic efficiency topolytropic efficiency.)
The equations for head and gas horsepower based uponpolytropic compression are:
Hp = ZavgRT1
MW (n − 1)/n
P2
P1
(n − 1)/n
− 1
Eq 13-34a
which also can be written in the form:
-23
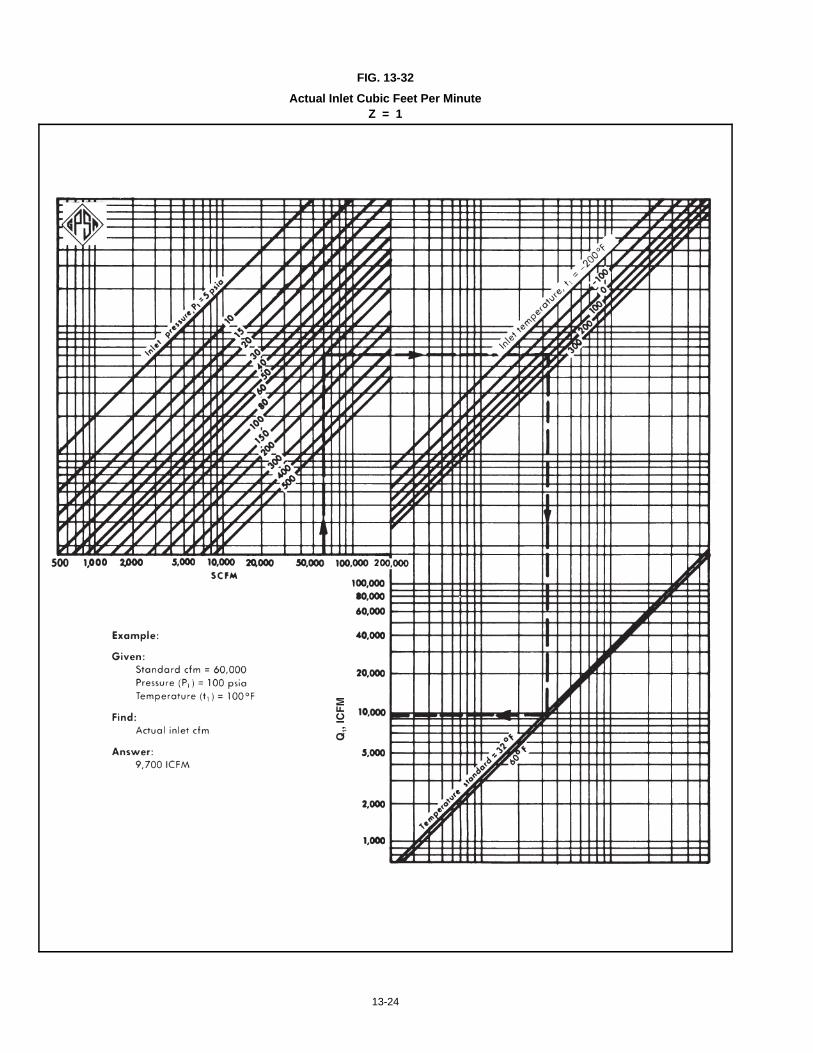
FIG. 13-32
Actual Inlet Cubic Feet Per MinuteZ = 1
13-24
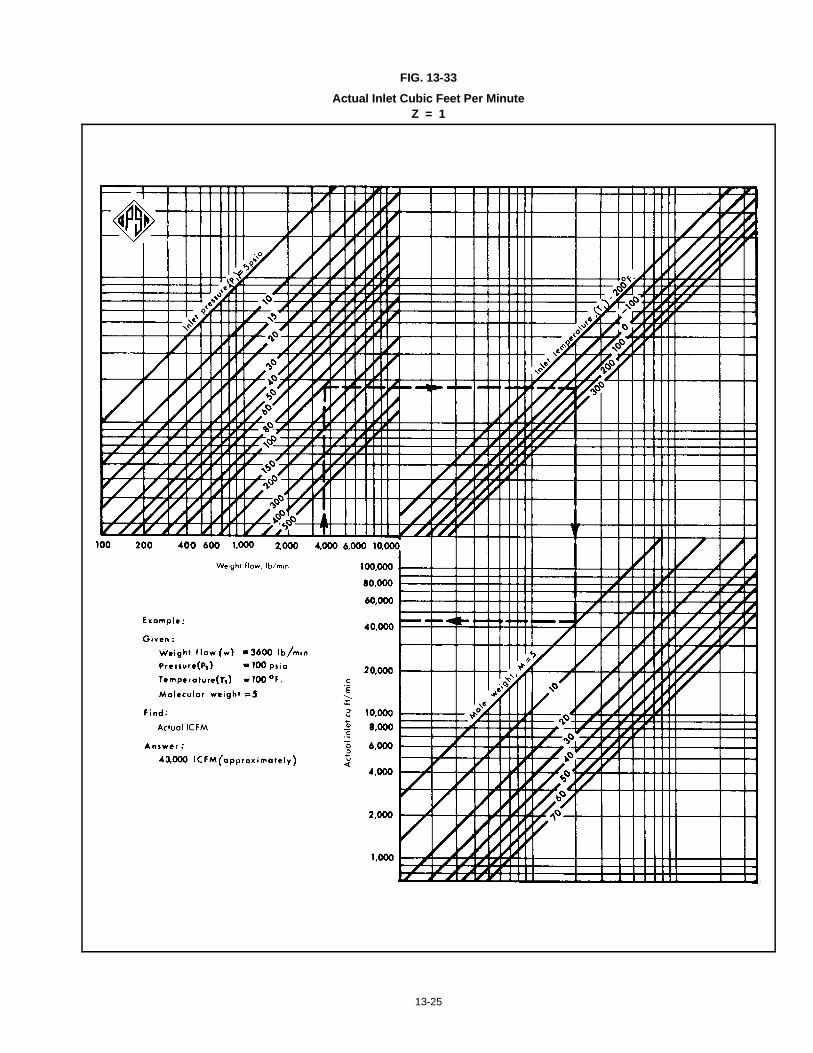
FIG. 13-33
Actual Inlet Cubic Feet Per MinuteZ = 1
13-25
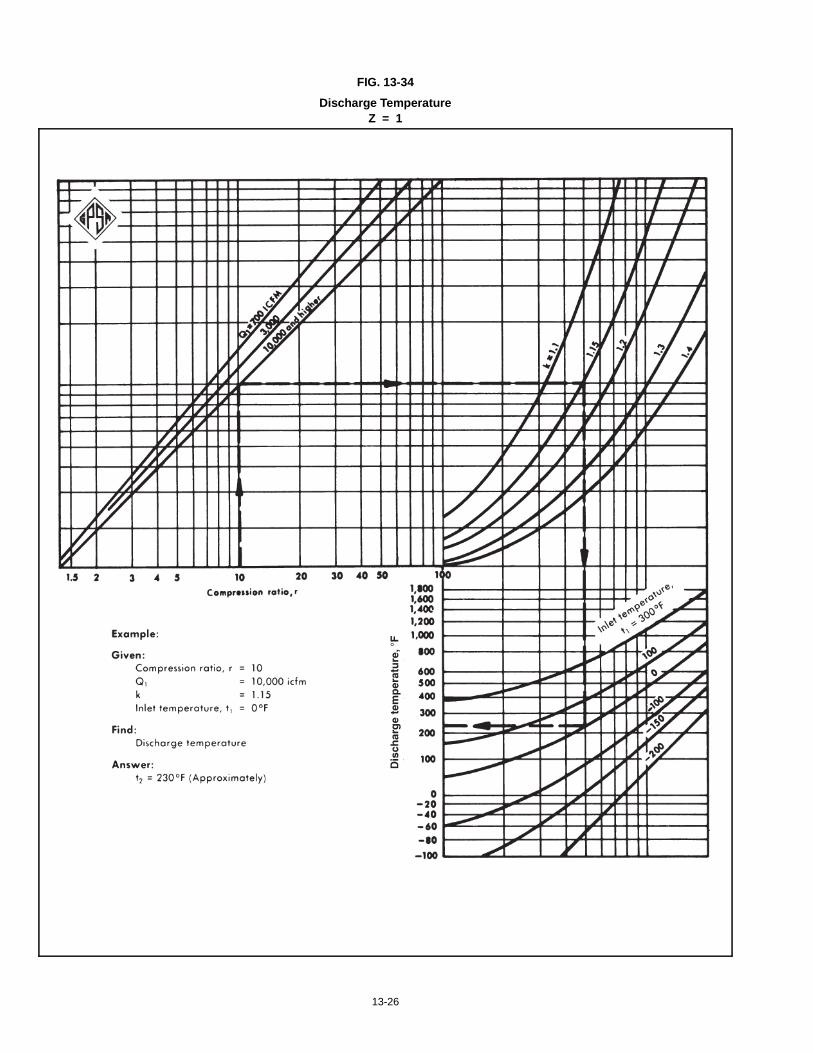
FIG. 13-34
Discharge TemperatureZ = 1
13-26
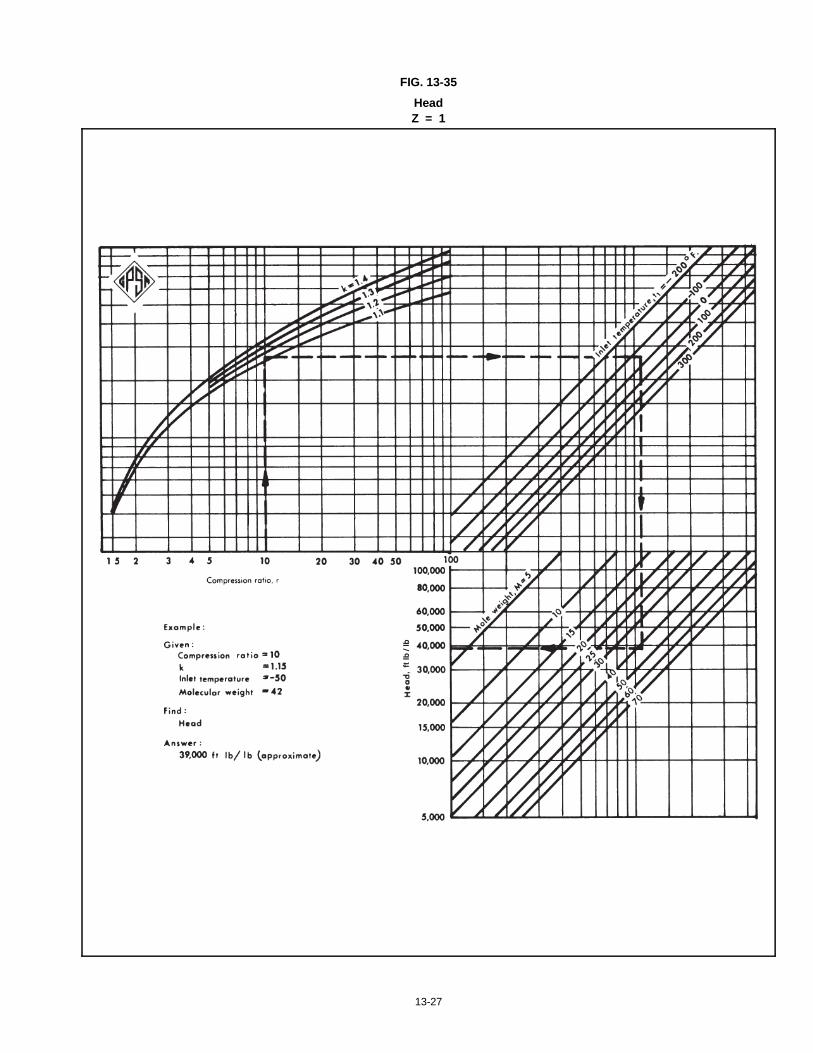
FIG. 13-35
HeadZ = 1
13-27
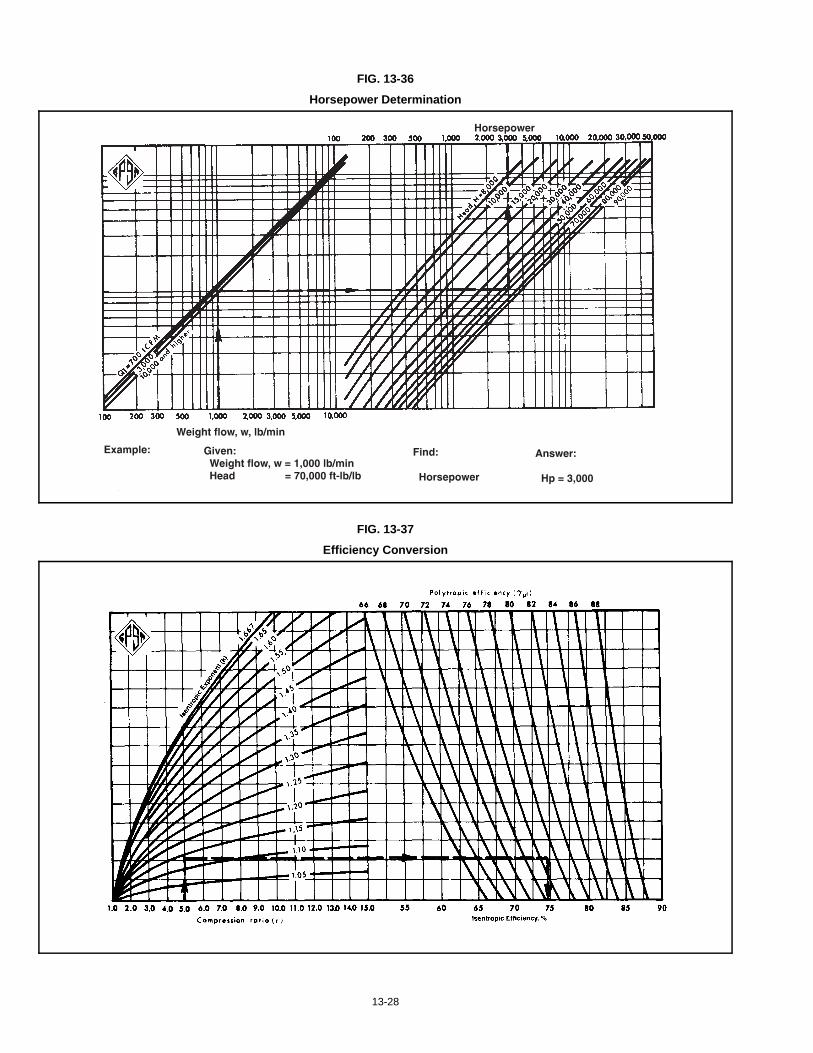
FIG. 13-36
Horsepower Determination
FIG. 13-37
Efficiency Conversion
13-28
1 2 3 4 5 6 8 10 20
Casin
g siz
e, #
6
#5
#4#3
#2 a
nd #
1
80
605040
30
20
10
7
70
Cas
ing
size
, #6
#5
#4
#3#2
and
#1
70
30
4050
20
60
10
71 2 3 4 5 6 8 10 20
Shaft speed, N, thousand rpm
b. Oil-seal horsepower losses
a. Bearing horsepower losses
Shaft speed, N, thousand rpm
Courtesy Chemical Engineering Magazine
Bea
ring
loss
, hp
Oil-
seal
loss
, hp
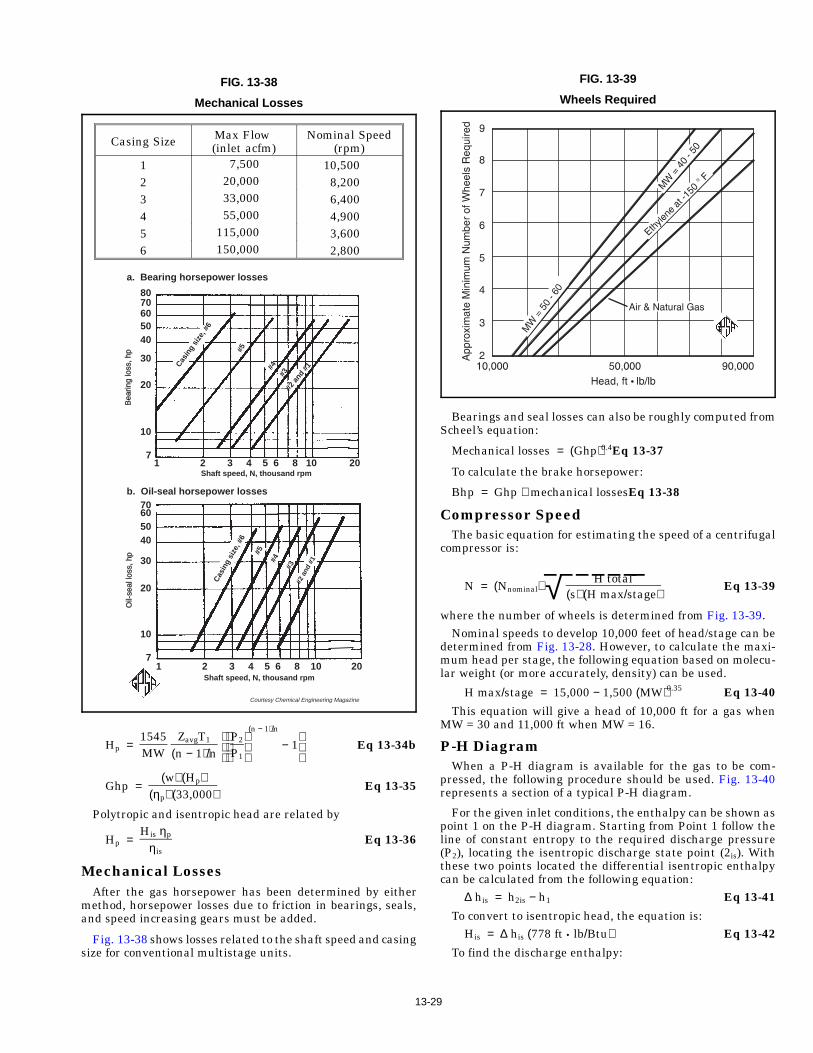
Casing Size Max Flow (inlet acfm)
Nominal Speed(rpm)
1 7,500 10,5002 20,000 8,2003 33,000 6,4004 55,000 4,9005 115,000 3,6006 150,000 2,800
FIG. 13-38
Mechanical Losses
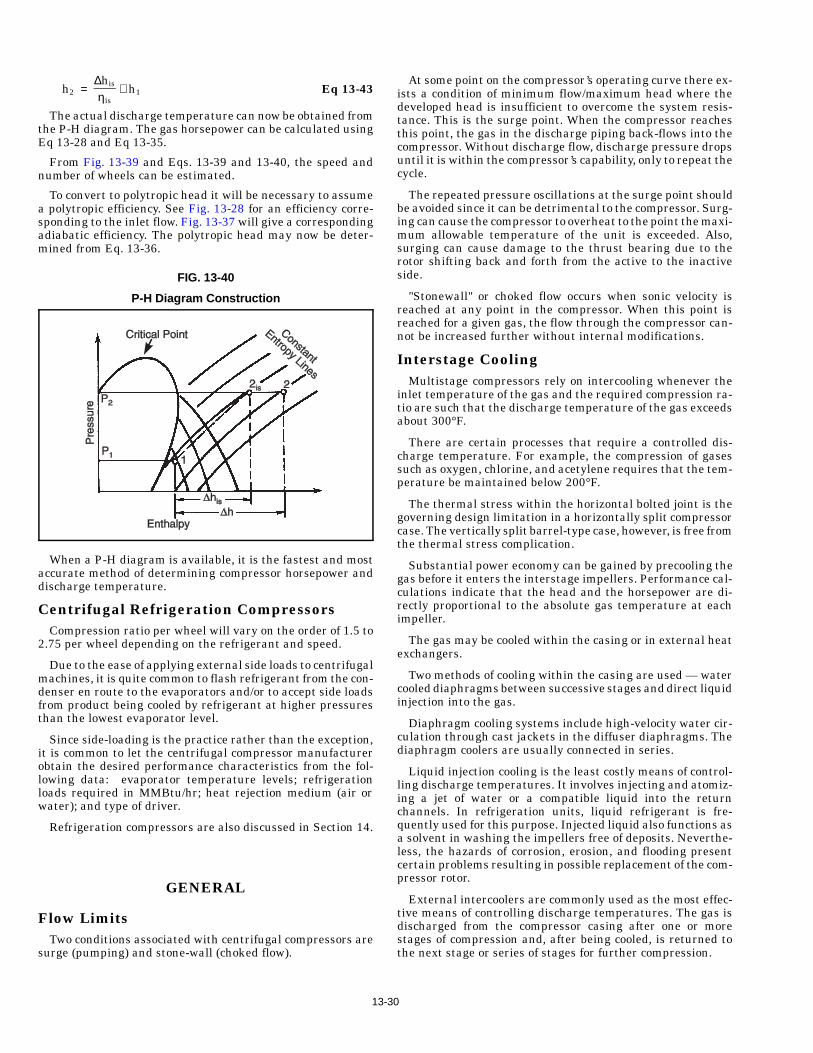
FIG. 13-39
Wheels Required
Hp = 1545MW
ZavgT1
(n − 1)/n
P2
P1
(n − 1)/n
− 1
Eq 13-34b
Ghp = (w) (Hp)
(ηp) (33,000)Eq 13-35
Polytropic and isentropic head are related by
Hp = His ηp
ηisEq 13-36
Mechanical LossesAfter the gas horsepower has been determined by either
method, horsepower losses due to friction in bearings, seals,and speed increasing gears must be added.
Fig. 13-38 shows losses related to the shaft speed and casingsize for conventional multistage units.
13-
Bearings and seal losses can also be roughly computed fromScheel’s equation:
Mechanical losses = (Ghp)0.4Eq 13-37
To calculate the brake horsepower:
Bhp = Ghp + mechanical lossesEq 13-38
Compressor SpeedThe basic equation for estimating the speed of a centrifugal
compressor is:
N = (Nnominal) √ H total
(s) (H max/stage)Eq 13-39
where the number of wheels is determined from Fig. 13-39.Nominal speeds to develop 10,000 feet of head/stage can be
determined from Fig. 13-28. However, to calculate the maxi-mum head per stage, the following equation based on molecu-lar weight (or more accurately, density) can be used.
H max/stage = 15,000 − 1,500 (MW)0.35 Eq 13-40
This equation will give a head of 10,000 ft for a gas whenMW = 30 and 11,000 ft when MW = 16.
P-H DiagramWhen a P-H diagram is available for the gas to be com-
pressed, the following procedure should be used. Fig. 13-40represents a section of a typical P-H diagram.
For the given inlet conditions, the enthalpy can be shown aspoint 1 on the P-H diagram. Starting from Point 1 follow theline of constant entropy to the required discharge pressure(P2), locating the isentropic discharge state point (2is). Withthese two points located the differential isentropic enthalpycan be calculated from the following equation:
∆ his = h2is − h1 Eq 13-41
To convert to isentropic head, the equation is:His = ∆ his (778 ft • lb/Btu) Eq 13-42
To find the discharge enthalpy:
29
h2 = ∆his
ηis + h1 Eq 13-43
The actual discharge temperature can now be obtained fromthe P-H diagram. The gas horsepower can be calculated usingEq 13-28 and Eq 13-35.
From Fig. 13-39 and Eqs. 13-39 and 13-40, the speed andnumber of wheels can be estimated.
To convert to polytropic head it will be necessary to assumea polytropic efficiency. See Fig. 13-28 for an efficiency corre-sponding to the inlet flow. Fig. 13-37 will give a correspondingadiabatic efficiency. The polytropic head may now be deter-mined from Eq. 13-36.
FIG. 13-40
P-H Diagram Co nstr uct ion
When a P-H diagram is available, it is the fastest and mostaccurate method of determining compressor horsepower anddischarge temperature.
Centrifugal Refrigeration CompressorsCompression ratio per wheel will vary on the order of 1.5 to
2.75 per wheel depending on the refrigerant and speed.
Due to the ease of applying external side loads to centrifugalmachines, it is quite common to flash refrigerant from the con-denser en route to the evaporators and/or to accept side loadsfrom product being cooled by refrigerant at higher pressuresthan the lowest evaporator level.
Since side-loading is the practice rather than the exception,it is common to let the centrifugal compressor manufacturerobtain the desired performance characteristics from the fol-lowing data: evaporator temperature levels; refrigerationloads required in MMBtu/hr; heat rejection medium (air orwater); and type of driver.
Refrigeration compressors are also discussed in Section 14.
GENERAL
Flow LimitsTwo conditions associated with centrifugal compressors are
surge (pumping) and stone-wall (choked flow).
13-3
At some point on the compressor’s operating curve there ex-ists a condition of minimum flow/maximum head where thedeveloped head is insufficient to overcome the system resis-tance. This is the surge point. When the compressor reachesthis point, the gas in the discharge piping back-flows into thecompressor. Without discharge flow, discharge pressure dropsuntil it is within the compressor’s capability, only to repeat thecycle.
The repeated pressure oscillations at the surge point shouldbe avoided since it can be detrimental to the compressor. Surg-ing can cause the compressor to overheat to the point the maxi-mum allowable temperature of the unit is exceeded. Also,surging can cause damage to the thrust bearing due to therotor shifting back and forth from the active to the inactiveside.
"Stonewall" or choked flow occurs when sonic velocity isreached at any point in the compressor. When this point isreached for a given gas, the flow through the compressor can-not be increased further without internal modifications.
Interstage CoolingMultistage compressors rely on intercooling whenever the
inlet temperature of the gas and the required compression ra-tio are such that the discharge temperature of the gas exceedsabout 300°F.
There are certain processes that require a controlled dis-charge temperature. For example, the compression of gasessuch as oxygen, chlorine, and acetylene requires that the tem-perature be maintained below 200°F.
The thermal stress within the horizontal bolted joint is thegoverning design limitation in a horizontally split compressorcase. The vertically split barrel-type case, however, is free fromthe thermal stress complication.
Substantial power economy can be gained by precooling thegas before it enters the interstage impellers. Performance cal-culations indicate that the head and the horsepower are di-rectly proportional to the absolute gas temperature at eachimpeller.
The gas may be cooled within the casing or in external heatexchangers.
Two methods of cooling within the casing are used — watercooled diaphragms between successive stages and direct liquidinjection into the gas.
Diaphragm cooling systems include high-velocity water cir-culation through cast jackets in the diffuser diaphragms. Thediaphragm coolers are usually connected in series.
Liquid injection cooling is the least costly means of control-ling discharge temperatures. It involves injecting and atomiz-ing a jet of water or a compatible liquid into the returnchannels. In refrigeration units, liquid refrigerant is fre-quently used for this purpose. Injected liquid also functions asa solvent in washing the impellers free of deposits. Neverthe-less, the hazards of corrosion, erosion, and flooding presentcertain problems resulting in possible replacement of the com-pressor rotor.
External intercoolers are commonly used as the most effec-tive means of controlling discharge temperatures. The gas isdischarged from the compressor casing after one or morestages of compression and, after being cooled, is returned tothe next stage or series of stages for further compression.
0
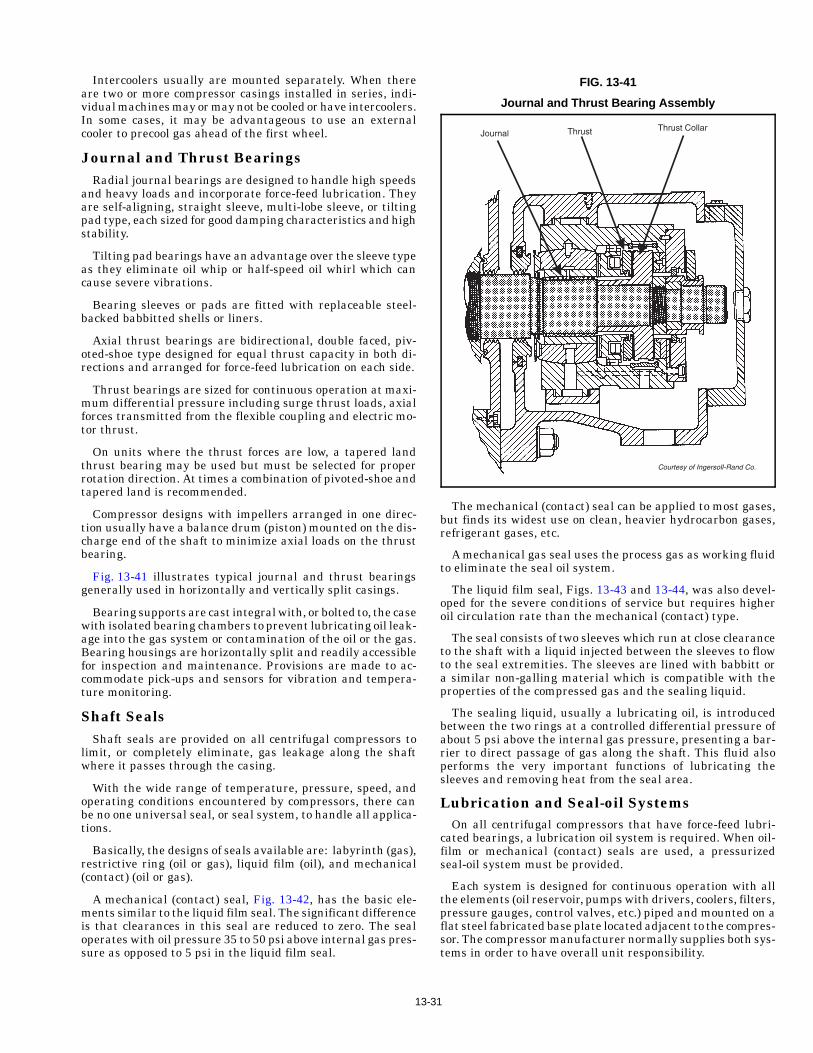
FIG. 13-41
Journal and Thrust B earing Assembly
Intercoolers usually are mounted separately. When thereare two or more compressor casings installed in series, indi-vidual machines may or may not be cooled or have intercoolers.In some cases, it may be advantageous to use an externalcooler to precool gas ahead of the first wheel.
Journal and Thrust BearingsRadial journal bearings are designed to handle high speeds
and heavy loads and incorporate force-feed lubrication. Theyare self-aligning, straight sleeve, multi-lobe sleeve, or tiltingpad type, each sized for good damping characteristics and highstability.
Tilting pad bearings have an advantage over the sleeve typeas they eliminate oil whip or half-speed oil whirl which cancause severe vibrations.
Bearing sleeves or pads are fitted with replaceable steel-backed babbitted shells or liners.
Axial thrust bearings are bidirectional, double faced, piv-oted-shoe type designed for equal thrust capacity in both di-rections and arranged for force-feed lubrication on each side.
Thrust bearings are sized for continuous operation at maxi-mum differential pressure including surge thrust loads, axialforces transmitted from the flexible coupling and electric mo-tor thrust.
On units where the thrust forces are low, a tapered landthrust bearing may be used but must be selected for properrotation direction. At times a combination of pivoted-shoe andtapered land is recommended.
Compressor designs with impellers arranged in one direc-tion usually have a balance drum (piston) mounted on the dis-charge end of the shaft to minimize axial loads on the thrustbearing.
Fig. 13-41 illustrates typical journal and thrust bearingsgenerally used in horizontally and vertically split casings.
Bearing supports are cast integral with, or bolted to, the casewith isolated bearing chambers to prevent lubricating oil leak-age into the gas system or contamination of the oil or the gas.Bearing housings are horizontally split and readily accessiblefor inspection and maintenance. Provisions are made to ac-commodate pick-ups and sensors for vibration and tempera-ture monitoring.
Shaft SealsShaft seals are provided on all centrifugal compressors to
limit, or completely eliminate, gas leakage along the shaftwhere it passes through the casing.
With the wide range of temperature, pressure, speed, andoperating conditions encountered by compressors, there canbe no one universal seal, or seal system, to handle all applica-tions.
Basically, the designs of seals available are: labyrinth (gas),restrictive ring (oil or gas), liquid film (oil), and mechanical(contact) (oil or gas).
A mechanical (contact) seal, Fig. 13-42, has the basic ele-ments similar to the liquid film seal. The significant differenceis that clearances in this seal are reduced to zero. The sealoperates with oil pressure 35 to 50 psi above internal gas pres-sure as opposed to 5 psi in the liquid film seal.
13-
The mechanical (contact) seal can be applied to most gases,but finds its widest use on clean, heavier hydrocarbon gases,refrigerant gases, etc.
A mechanical gas seal uses the process gas as working fluidto eliminate the seal oil system.
The liquid film seal, Figs. 13-43 and 13-44, was also devel-oped for the severe conditions of service but requires higheroil circulation rate than the mechanical (contact) type.
The seal consists of two sleeves which run at close clearanceto the shaft with a liquid injected between the sleeves to flowto the seal extremities. The sleeves are lined with babbitt ora similar non-galling material which is compatible with theproperties of the compressed gas and the sealing liquid.
The sealing liquid, usually a lubricating oil, is introducedbetween the two rings at a controlled differential pressure ofabout 5 psi above the internal gas pressure, presenting a bar-rier to direct passage of gas along the shaft. This fluid alsoperforms the very important functions of lubricating thesleeves and removing heat from the seal area.
Lubrication and Seal-oil SystemsOn all centrifugal compressors that have force-feed lubri-
cated bearings, a lubrication oil system is required. When oil-film or mechanical (contact) seals are used, a pressurizedseal-oil system must be provided.
Each system is designed for continuous operation with allthe elements (oil reservoir, pumps with drivers, coolers, filters,pressure gauges, control valves, etc.) piped and mounted on aflat steel fabricated base plate located adjacent to the compres-sor. The compressor manufacturer normally supplies both sys-tems in order to have overall unit responsibility.
31
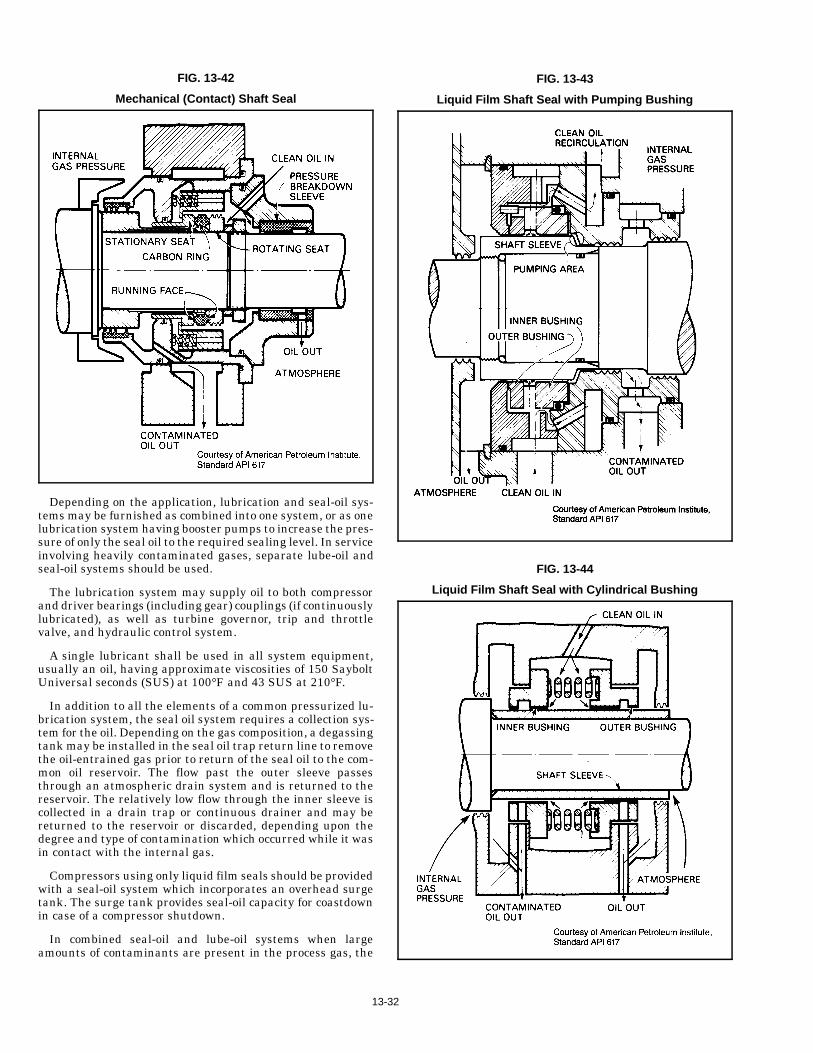
FIG. 13-42
Mechanical (Contact) Shaft Seal
FIG. 13-43
Liquid Film Shaft Seal with Pumping Bushing
FIG. 13-44
Liquid Film Shaft Seal with Cylindrical Bushing
Depending on the application, lubrication and seal-oil sys-tems may be furnished as combined into one system, or as onelubrication system having booster pumps to increase the pres-sure of only the seal oil to the required sealing level. In serviceinvolving heavily contaminated gases, separate lube-oil andseal-oil systems should be used.
The lubrication system may supply oil to both compressorand driver bearings (including gear) couplings (if continuouslylubricated), as well as turbine governor, trip and throttlevalve, and hydraulic control system.
A single lubricant shall be used in all system equipment,usually an oil, having approximate viscosities of 150 SayboltUniversal seconds (SUS) at 100°F and 43 SUS at 210°F.
In addition to all the elements of a common pressurized lu-brication system, the seal oil system requires a collection sys-tem for the oil. Depending on the gas composition, a degassingtank may be installed in the seal oil trap return line to removethe oil-entrained gas prior to return of the seal oil to the com-mon oil reservoir. The flow past the outer sleeve passesthrough an atmospheric drain system and is returned to thereservoir. The relatively low flow through the inner sleeve iscollected in a drain trap or continuous drainer and may bereturned to the reservoir or discarded, depending upon thedegree and type of contamination which occurred while it wasin contact with the internal gas.
Compressors using only liquid film seals should be providedwith a seal-oil system which incorporates an overhead surgetank. The surge tank provides seal-oil capacity for coastdownin case of a compressor shutdown.
In combined seal-oil and lube-oil systems when largeamounts of contaminants are present in the process gas, the
13-32
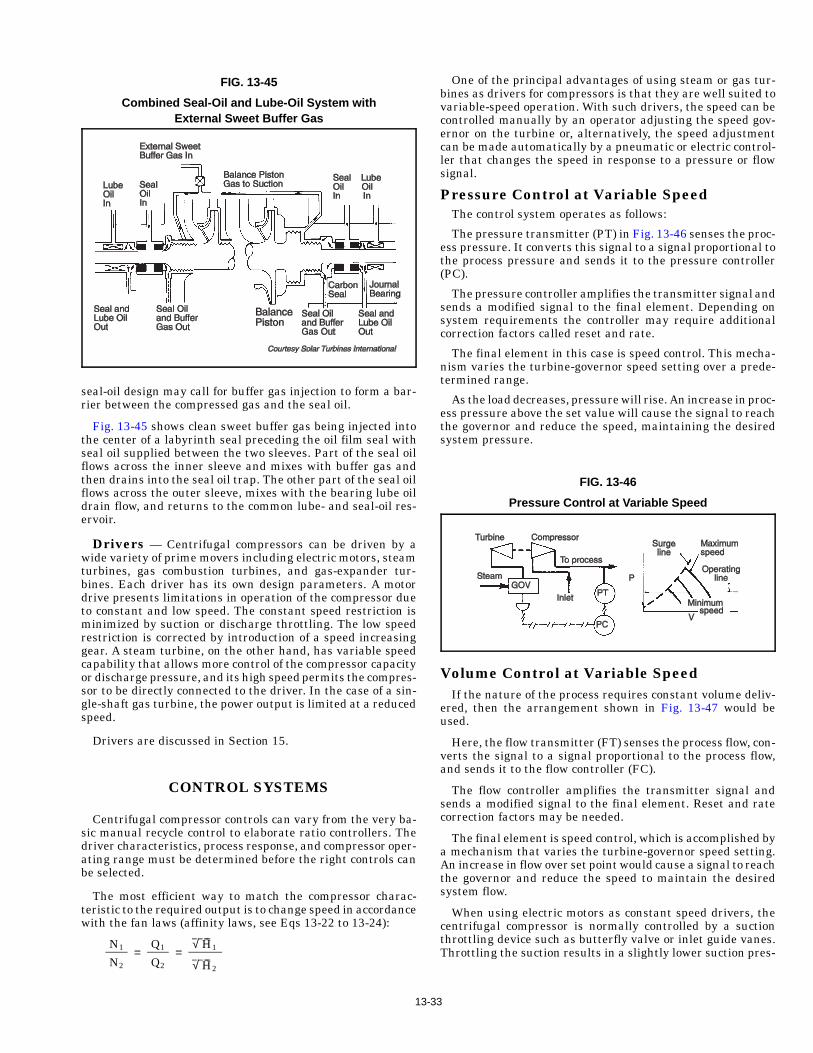
FIG. 13-45
Comb ined Seal-O il and Lube-Oi l System withExter nal Sweet Buffer Gas
FIG. 13-46
Pressure C ontr ol at Variable Speed
seal-oil design may call for buffer gas injection to form a bar-rier between the compressed gas and the seal oil.
Fig. 13-45 shows clean sweet buffer gas being injected intothe center of a labyrinth seal preceding the oil film seal withseal oil supplied between the two sleeves. Part of the seal oilflows across the inner sleeve and mixes with buffer gas andthen drains into the seal oil trap. The other part of the seal oilflows across the outer sleeve, mixes with the bearing lube oildrain flow, and returns to the common lube- and seal-oil res-ervoir.
Drivers — Centrifugal compressors can be driven by awide variety of prime movers including electric motors, steamturbines, gas combustion turbines, and gas-expander tur-bines. Each driver has its own design parameters. A motordrive presents limitations in operation of the compressor dueto constant and low speed. The constant speed restriction isminimized by suction or discharge throttling. The low speedrestriction is corrected by introduction of a speed increasinggear. A steam turbine, on the other hand, has variable speedcapability that allows more control of the compressor capacityor discharge pressure, and its high speed permits the compres-sor to be directly connected to the driver. In the case of a sin-gle-shaft gas turbine, the power output is limited at a reducedspeed.
Drivers are discussed in Section 15.
CONTROL SYSTEMS
Centrifugal compressor controls can vary from the very ba-sic manual recycle control to elaborate ratio controllers. Thedriver characteristics, process response, and compressor oper-ating range must be determined before the right controls canbe selected.
The most efficient way to match the compressor charac-teristic to the required output is to change speed in accordancewith the fan laws (affinity laws, see Eqs 13-22 to 13-24):
N1
N2 =
Q1
Q2 =
√ H1
√ H2
13-
One of the principal advantages of using steam or gas tur-bines as drivers for compressors is that they are well suited tovariable-speed operation. With such drivers, the speed can becontrolled manually by an operator adjusting the speed gov-ernor on the turbine or, alternatively, the speed adjustmentcan be made automatically by a pneumatic or electric control-ler that changes the speed in response to a pressure or flowsignal.
Pressure Control at Variable SpeedThe control system operates as follows:
The pressure transmitter (PT) in Fig. 13-46 senses the proc-ess pressure. It converts this signal to a signal proportional tothe process pressure and sends it to the pressure controller(PC).
The pressure controller amplifies the transmitter signal andsends a modified signal to the final element. Depending onsystem requirements the controller may require additionalcorrection factors called reset and rate.
The final element in this case is speed control. This mecha-nism varies the turbine-governor speed setting over a prede-termined range.
As the load decreases, pressure will rise. An increase in proc-ess pressure above the set value will cause the signal to reachthe governor and reduce the speed, maintaining the desiredsystem pressure.
Volume Control at Variable SpeedIf the nature of the process requires constant volume deliv-
ered, then the arrangement shown in Fig. 13-47 would beused.
Here, the flow transmitter (FT) senses the process flow, con-verts the signal to a signal proportional to the process flow,and sends it to the flow controller (FC).
The flow controller amplifies the transmitter signal andsends a modified signal to the final element. Reset and ratecorrection factors may be needed.
The final element is speed control, which is accomplished bya mechanism that varies the turbine-governor speed setting.An increase in flow over set point would cause a signal to reachthe governor and reduce the speed to maintain the desiredsystem flow.
When using electric motors as constant speed drivers, thecentrifugal compressor is normally controlled by a suctionthrottling device such as butterfly valve or inlet guide vanes.Throttling the suction results in a slightly lower suction pres-
33
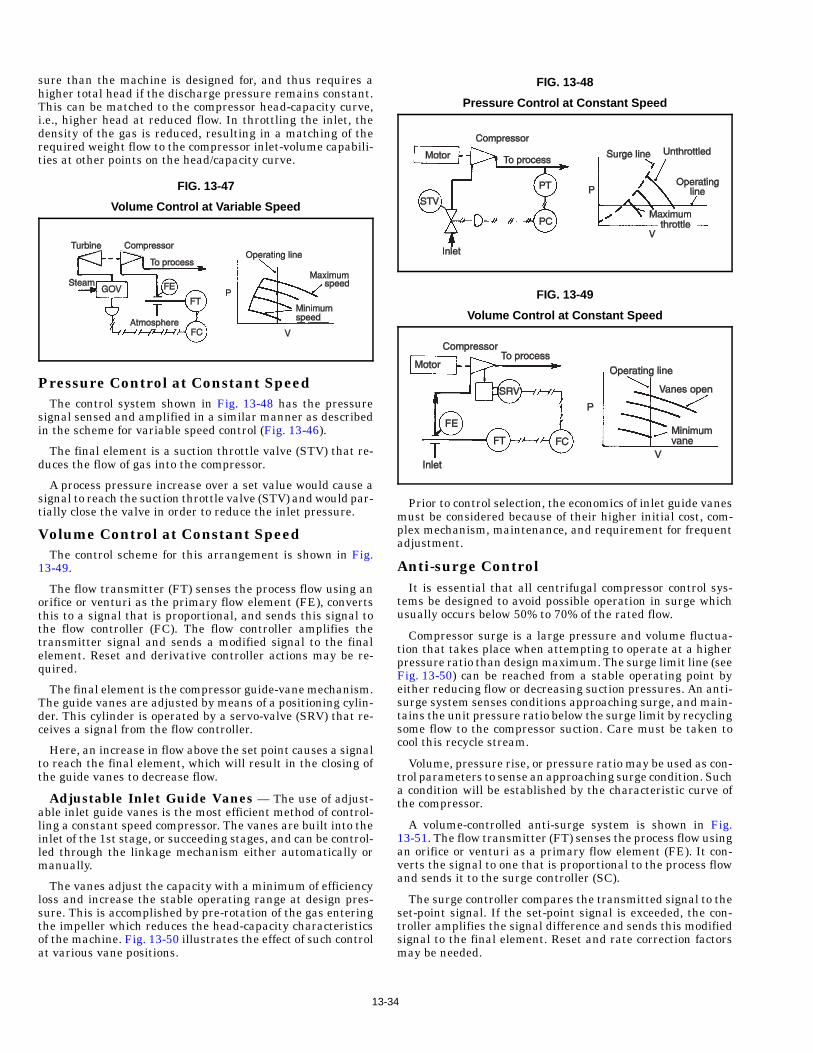
FIG. 13-48
Pressure C ontr ol at Constan t Speed
sure than the machine is designed for, and thus requires ahigher total head if the discharge pressure remains constant.This can be matched to the compressor head-capacity curve,i.e., higher head at reduced flow. In throttling the inlet, thedensity of the gas is reduced, resulting in a matching of therequired weight flow to the compressor inlet-volume capabili-ties at other points on the head/capacity curve.
FIG. 13-47
Volume Contr ol at Variable Speed
FIG. 13-49
Volume Contr ol at Constant Speed
Pressure Control at Constant SpeedThe control system shown in Fig. 13-48 has the pressure
signal sensed and amplified in a similar manner as describedin the scheme for variable speed control (Fig. 13-46).
The final element is a suction throttle valve (STV) that re-duces the flow of gas into the compressor.
A process pressure increase over a set value would cause asignal to reach the suction throttle valve (STV) and would par-tially close the valve in order to reduce the inlet pressure.
Volume Control at Constant SpeedThe control scheme for this arrangement is shown in Fig.
13-49.
The flow transmitter (FT) senses the process flow using anorifice or venturi as the primary flow element (FE), convertsthis to a signal that is proportional, and sends this signal tothe flow controller (FC). The flow controller amplifies thetransmitter signal and sends a modified signal to the finalelement. Reset and derivative controller actions may be re-quired.
The final element is the compressor guide-vane mechanism.The guide vanes are adjusted by means of a positioning cylin-der. This cylinder is operated by a servo-valve (SRV) that re-ceives a signal from the flow controller.
Here, an increase in flow above the set point causes a signalto reach the final element, which will result in the closing ofthe guide vanes to decrease flow.
Adjustable Inlet Guide Vanes — The use of adjust-able inlet guide vanes is the most efficient method of control-ling a constant speed compressor. The vanes are built into theinlet of the 1st stage, or succeeding stages, and can be control-led through the linkage mechanism either automatically ormanually.
The vanes adjust the capacity with a minimum of efficiencyloss and increase the stable operating range at design pres-sure. This is accomplished by pre-rotation of the gas enteringthe impeller which reduces the head-capacity characteristicsof the machine. Fig. 13-50 illustrates the effect of such controlat various vane positions.
13-3
Prior to control selection, the economics of inlet guide vanesmust be considered because of their higher initial cost, com-plex mechanism, maintenance, and requirement for frequentadjustment.
Anti-surge ControlIt is essential that all centrifugal compressor control sys-
tems be designed to avoid possible operation in surge whichusually occurs below 50% to 70% of the rated flow.
Compressor surge is a large pressure and volume fluctua-tion that takes place when attempting to operate at a higherpressure ratio than design maximum. The surge limit line (seeFig. 13-50) can be reached from a stable operating point byeither reducing flow or decreasing suction pressures. An anti-surge system senses conditions approaching surge, and main-tains the unit pressure ratio below the surge limit by recyclingsome flow to the compressor suction. Care must be taken tocool this recycle stream.
Volume, pressure rise, or pressure ratio may be used as con-trol parameters to sense an approaching surge condition. Sucha condition will be established by the characteristic curve ofthe compressor.
A volume-controlled anti-surge system is shown in Fig.13-51. The flow transmitter (FT) senses the process flow usingan orifice or venturi as a primary flow element (FE). It con-verts the signal to one that is proportional to the process flowand sends it to the surge controller (SC).
The surge controller compares the transmitted signal to theset-point signal. If the set-point signal is exceeded, the con-troller amplifies the signal difference and sends this modifiedsignal to the final element. Reset and rate correction factorsmay be needed.
4
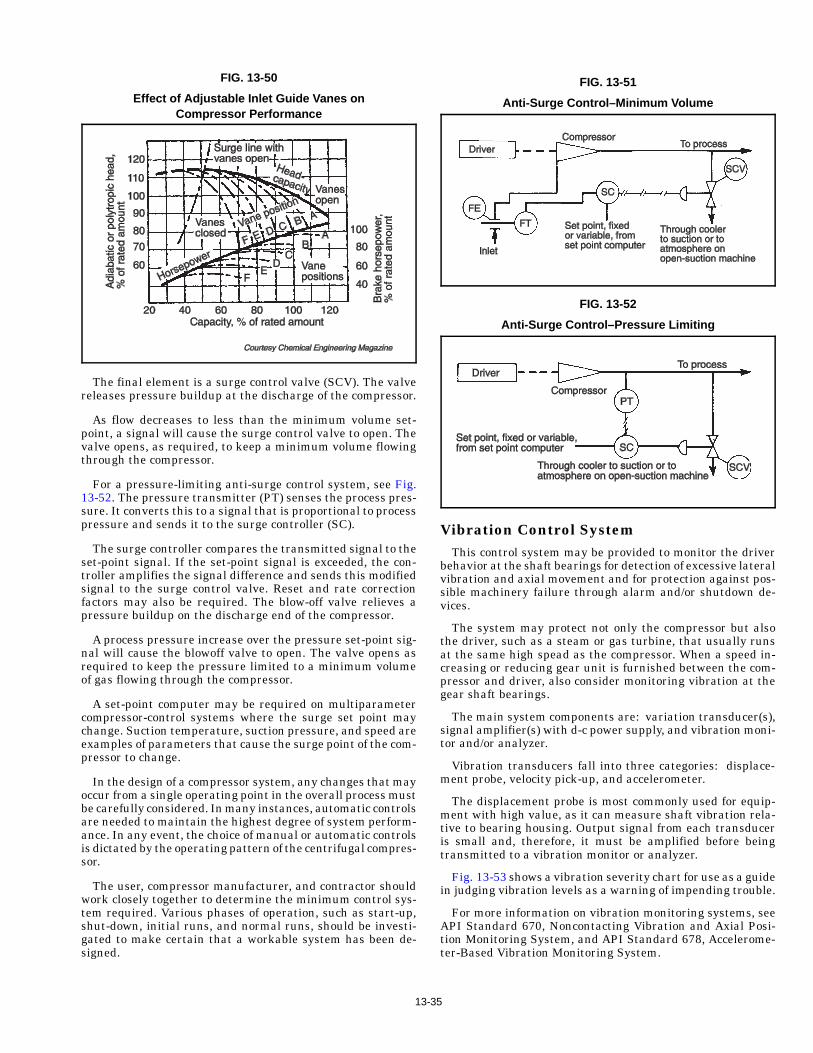
FIG. 13-50
Effect of A djustab le Inlet Guide Vanes onCompressor Performance
FIG. 13-51
Anti-Surge Contr ol–Minimum Volume
FIG. 13-52
Ant i-Surge Contro l–Pressure Limit ing
The final element is a surge control valve (SCV). The valvereleases pressure buildup at the discharge of the compressor.
As flow decreases to less than the minimum volume set-point, a signal will cause the surge control valve to open. Thevalve opens, as required, to keep a minimum volume flowingthrough the compressor.
For a pressure-limiting anti-surge control system, see Fig.13-52. The pressure transmitter (PT) senses the process pres-sure. It converts this to a signal that is proportional to processpressure and sends it to the surge controller (SC).
The surge controller compares the transmitted signal to theset-point signal. If the set-point signal is exceeded, the con-troller amplifies the signal difference and sends this modifiedsignal to the surge control valve. Reset and rate correctionfactors may also be required. The blow-off valve relieves apressure buildup on the discharge end of the compressor.
A process pressure increase over the pressure set-point sig-nal will cause the blowoff valve to open. The valve opens asrequired to keep the pressure limited to a minimum volumeof gas flowing through the compressor.
A set-point computer may be required on multiparametercompressor-control systems where the surge set point maychange. Suction temperature, suction pressure, and speed areexamples of parameters that cause the surge point of the com-pressor to change.
In the design of a compressor system, any changes that mayoccur from a single operating point in the overall process mustbe carefully considered. In many instances, automatic controlsare needed to maintain the highest degree of system perform-ance. In any event, the choice of manual or automatic controlsis dictated by the operating pattern of the centrifugal compres-sor.
The user, compressor manufacturer, and contractor shouldwork closely together to determine the minimum control sys-tem required. Various phases of operation, such as start-up,shut-down, initial runs, and normal runs, should be investi-gated to make certain that a workable system has been de-signed.
13-3
Vibration Control SystemThis control system may be provided to monitor the driver
behavior at the shaft bearings for detection of excessive lateralvibration and axial movement and for protection against pos-sible machinery failure through alarm and/or shutdown de-vices.
The system may protect not only the compressor but alsothe driver, such as a steam or gas turbine, that usually runsat the same high spead as the compressor. When a speed in-creasing or reducing gear unit is furnished between the com-pressor and driver, also consider monitoring vibration at thegear shaft bearings.
The main system components are: variation transducer(s),signal amplifier(s) with d-c power supply, and vibration moni-tor and/or analyzer.
Vibration transducers fall into three categories: displace-ment probe, velocity pick-up, and accelerometer.
The displacement probe is most commonly used for equip-ment with high value, as it can measure shaft vibration rela-tive to bearing housing. Output signal from each transduceris small and, therefore, it must be amplified before beingtransmitted to a vibration monitor or analyzer.
Fig. 13-53 shows a vibration severity chart for use as a guidein judging vibration levels as a warning of impending trouble.
For more information on vibration monitoring systems, seeAPI Standard 670, Noncontacting Vibration and Axial Posi-tion Monitoring System, and API Standard 678, Accelerome-ter-Based Vibration Monitoring System.
5
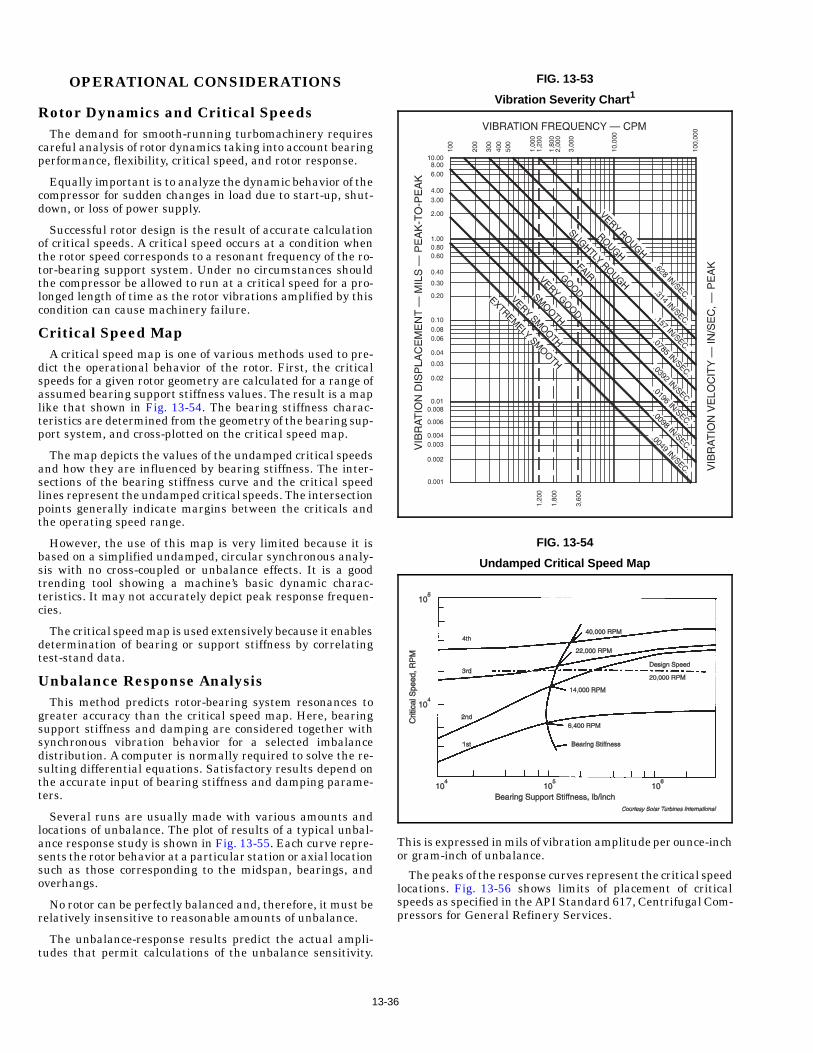
FIG. 13-53
Vibrati on Sever ity Chart 1
FIG. 13-54
Undamped Critical Speed Map
OPERATIONAL CONSIDERATIONS
Rotor Dynamics and Critical SpeedsThe demand for smooth-running turbomachinery requires
careful analysis of rotor dynamics taking into account bearingperformance, flexibility, critical speed, and rotor response.
Equally important is to analyze the dynamic behavior of thecompressor for sudden changes in load due to start-up, shut-down, or loss of power supply.
Successful rotor design is the result of accurate calculationof critical speeds. A critical speed occurs at a condition whenthe rotor speed corresponds to a resonant frequency of the ro-tor-bearing support system. Under no circumstances shouldthe compressor be allowed to run at a critical speed for a pro-longed length of time as the rotor vibrations amplified by thiscondition can cause machinery failure.
Critical Speed MapA critical speed map is one of various methods used to pre-
dict the operational behavior of the rotor. First, the criticalspeeds for a given rotor geometry are calculated for a range ofassumed bearing support stiffness values. The result is a maplike that shown in Fig. 13-54. The bearing stiffness charac-teristics are determined from the geometry of the bearing sup-port system, and cross-plotted on the critical speed map.
The map depicts the values of the undamped critical speedsand how they are influenced by bearing stiffness. The inter-sections of the bearing stiffness curve and the critical speedlines represent the undamped critical speeds. The intersectionpoints generally indicate margins between the criticals andthe operating speed range.
However, the use of this map is very limited because it isbased on a simplified undamped, circular synchronous analy-sis with no cross-coupled or unbalance effects. It is a goodtrending tool showing a machine’s basic dynamic charac-teristics. It may not accurately depict peak response frequen-cies.
The critical speed map is used extensively because it enablesdetermination of bearing or support stiffness by correlatingtest-stand data.
Unbalance Response AnalysisThis method predicts rotor-bearing system resonances to
greater accuracy than the critical speed map. Here, bearingsupport stiffness and damping are considered together withsynchronous vibration behavior for a selected imbalancedistribution. A computer is normally required to solve the re-sulting differential equations. Satisfactory results depend onthe accurate input of bearing stiffness and damping parame-ters.
Several runs are usually made with various amounts andlocations of unbalance. The plot of results of a typical unbal-ance response study is shown in Fig. 13-55. Each curve repre-sents the rotor behavior at a particular station or axial locationsuch as those corresponding to the midspan, bearings, andoverhangs.
No rotor can be perfectly balanced and, therefore, it must berelatively insensitive to reasonable amounts of unbalance.
The unbalance-response results predict the actual ampli-tudes that permit calculations of the unbalance sensitivity.
13-3
This is expressed in mils of vibration amplitude per ounce-inchor gram-inch of unbalance.
The peaks of the response curves represent the critical speedlocations. Fig. 13-56 shows limits of placement of criticalspeeds as specified in the API Standard 617, Centrifugal Com-pressors for General Refinery Services.
6