Embed Size (px)
Citation preview

RESEARCH OVERVIEW
CompTIA Research & Market Intelligence OverviewStudy Summary Booklet 2016 – 2017


3 | Industry Outlook
Table of Contents
04 IT Industry Outlook05 Channel Trends06 Cloud and Mobility07 Information Security08 Internet of Things09 SMB Market10 Tech Buyers11 Smart Cities12 IT Skills13 Cloud Computing14 Emerging Tech15 Managed Services16 Tech Trade17 UK Market18 CompTIA Research19 CompTIA Premier Membership
Available to Premier Members only
Premier Members: Add your firm’s logo to report PDF

4 | Industry Outlook
The future is now. With increasing frequency, this assertion seems to find its way into commentary addressing the state of technology. Recent advances have made the leap from what is typically characterized as interesting or cool to what can only be described as mind-blowing. Pick your science fiction reference – The Jetsons, 2001: A Space Odyssey, or Minority Report, and it’s not hard to see what was once considered futuristic technology is all around us. CompTIA’s scan of the technology landscape points to another year of innovation, growth, and of course, a few surprises.
A notable milestone was recently attained. For the first time, the five most valuable companies in the world were all technology companies. While stock market valuations should be taken with a grain of salt, it did mean technology supplanted the behemoths of the energy, finance, healthcare, and manufacturing sectors.
By just about every measure, technology continues to shape the world around us in evermore interesting and sometimes unsettling ways. With the groundwork of cloud, mobility, data and connectivity laid, the year ahead will see evolutionary advances on many fronts. Digital business transformation remains a driving force for small and large enterprises alike. Those
playing catch-up will face growing and potentially new forms of competitive pressures, while those on the right path will have the opportunity to explore advances in areas such as virtual reality, artificial intelligence, advanced analytics, the internet of things, and inevitably, a few unexpected breakthroughs.
Complementing the innovation pipeline is a sense of optimism heading into 2017. CompTIA’s Q1 IT Industry Business Confidence reached a new high, signaling an economy on solid footing and a positive outlook among IT industry executives.
CompTIA projects global IT industry growth of 4.1 percent in 2017. If this growth materializes, it will push the $3.4 trillion global IT industry past the $3.5 trillion mark by year’s end.
Data for the CompTIA IT Industry Outlook 2017 was collected via an online quantitative survey fielded during December 2016 – January 2017 in the United States (n=310), Canada (n=98), and the United Kingdom (n=122). The complete report is available at no cost to CompTIA premier members and registered users who can access the file at www.CompTIA.org or by contacting [email protected].
IT Industry Outlook and Key Trends for 2017
Tech Trends for 2017
- The Tools of the Cloud Era
Emerge
- Security Gets Worse Before
It Gets Better
- Data Teams Bridge the Gap
Between IT and Business
- IoT Transforms Physical
Environments and Social
Convention
Methodology note: CompTIA utilizes a consensus forecasting methodology, also referred to as a “wisdom of the crowds” approach. IT industry executives in the US, Canada and the UK provide their optimistic and pessimistic projections for the year ahead; these inputs provide the basis for the CompTIA forecast. All figures are presented in current dollars, which do not take factors such as inflation or currency exchange rates into consideration.
CompTIA 2017 IT INDUSTRY CONSENSUS GROWTH FORECAST
Global Revenue Growth Forecast2017 Optimistic forecast: 6.2%2017 Midpoint forecast: 4.1%2017 Pessimistic forecast: 1.9%
U.S. Revenue Growth Forecast2017 Optimistic forecast: 6.2%2017 Midpoint forecast: 4.1%2017 Pessimistic forecast: 1.9%
Gro
wth
Rat
e R
ange
8.0
7.0
6.0
5.0
4.0
3.0
2.0
1.0
0.02010 2011 2012 2013 2014 2015 2016 2017 2010 2011 2012 2013 2014 2015 2016 2017
Gro
wth
Rat
e R
ange
8.0
7.0
6.0
5.0
4.0
3.0
2.0
1.0
0.0
Source: CompTIA IT Industry Outlook 2017Base: 530 executives at IT firms in the US, Canada, and the UK
CompTIA.ORG AREA: Insight & Tools > Business
DIRECT LINK TO REPORT: www.comptia.org/resources/it-industry- trends-analysis-2017

5 | Channel Trends
State of the Channel: Vendor-Partner RelationsIndirect channel firms and technology vendors have long been synergistic. Vendors innovate and develop solutions to take to market. Channel firms add value and customization to those solutions and provide vendors with a larger sales footprint, closer customer touch, and in some cases vertical skills.
It’s a model that has remained in place for decades.
However, the market is changing. Think of cloud computing’s impact on how technology is sold and consumed or the IT skills gap problem that has left many channel firms struggling to get up to speed with emerging technologies. And then there’s the changing end customer, now equipped with more leverage and insight into IT-buying decisions and choices than ever before. There’s also the challenge of new competition from “non-traditional” channel entrants such as digital marketing agencies and cloud-based ISVs that are cultivating an ecosystem of SaaS resellers.
Amidst this shifting landscape, today’s channel population remains mostly positive about their current vendor relationships, though the numbers have skewed slightly down from the favorability ratings found in the CompTIA study done one year ago. Thirty-nine percent of respondents described themselves as “very satisfied” with their vendors in the last year, mostly on par with the 41% that did so in 2015. This change is within the margin of error.
What might be most telling – and indicative of some unrest within the channel – is the number of firms expressing partial dissatisfaction with their vendor relationships this year. That subset more
than doubled to 15% of respondents this year, compared to 7% that said they felt that way in 2015. Among another group of respondents – those that said they were generally pessimistic about the future of the channel – the degree of vendor dissatisfaction jumps even higher, to 23% of those respondents. To top that off, just 10% of the pessimistic group said they were very satisfied with their vendor relationships today.
And yet, despite a rise in vendor discontent in some corners of the channel, most continue to do business with their same vendor partners, which might seem counterintuitive. In fact, the number of channel firms that characterize their vendor relationships as stable and unchanged rose from 52% in 2015 to 57% this year. Another third said they are exploring other vendors to work with but continue to maintain relationships with existing partners, a percentage consistent with last year’s findings. And finally, there was a slight drop this year (8% down from 11%) in channel firms that described the mix of their vendors as shifting in a significant fashion.
The quantitative portion of CompTIA’s 6th Annual State of the Channel consisted primarily of an online survey fielded to 350 IT channel firm executives and professionals in the US during August 2016. The qualitative
portion consisted of a series of in-depth one-on-one interviews conducted among senior-level IT channel executives and vendors. The complete report is available at no cost to CompTIA premier members who can access the file at www.CompTIA.org or by contacting [email protected].
“If you're going to
specialize and focus in
certain business areas,
and you can prove you can
do that, I will bring you
business.”
– SaaS Vendor
CompTIA.ORG AREA: Insight & Tools > Channel > Trends
DIRECT LINK TO REPORT: CompTIA.org/ 6thannualstatechannel
Source: CompTIA 6th Annual State of the ChannelBase: 350 US channel firms
ASSESSING THE VENDOR MIX AMONG CHANNEL FIRMS 57%
8%
35%
Unchanged Line Card
Exploring New Vendors
Shifting to New Vendors

6 | Cloud and Mobility
CompTIA’s study explores the different aspects of this corporate evolution. As com-panies seek success with new products and new customers, there are many additional areas that must be addressed in order to become a digital organization.
KEY POINTS
Digital transformation is defining the business of the future
Companies today are blending the tradi-tional view of IT as a tactical function with the perspective of technology as a strategic driver. While 43% of companies indicate that technology is an enabler for business process, 39% feel that they are using technology to drive business goals, such as enhancing effi-ciency or innovation.
The decision process for new technology is experiencing major disruption
Digital organizations are not just adopting new technology; they are modifying process-es to optimize available tools and models. The decision process for new technology is becoming much more collaborative, though that does not mean IT is fading. Fifty-nine percent of companies say that IT still plays a primary role in making new technology decisions.
IT professionals in digital organizations have a lot on their plate
As IT teams take on dual responsibility for tactics and strategy, they must balance four areas: Infrastructure, Innovation, Integration, and Intelligence. Along with the changes to decision process, this balancing act will bring them closer to business functions and require a better understanding of business demands.
Business units in digital organizations still want to partner with IT
Although rogue IT has received tremendous focus in recent years, most businesses are shifting to models that keep IT in the loop. Business units see most technical areas as shared responsibilities, with security and technology discovery being areas where IT is still seen as a primary owner.
Data for the quantitative portion of CompTIA’s Building Digital Organizations was collected via an online survey fielded to 350 US work-force professionals during October 2016. The qualitative portion of this study consisted of a series of in-depth interviews with 10 IT and business professionals. The complete report is available at no cost to CompTIA premier members and registered users who can access the file at www.CompTIA.org or by contacting [email protected].
Building Digital OrganizationsDigital transformation has become a watchword for many businesses. In a new era defined by cloud computing and mobile strategies, companies are pursuing new IT tools, and the best use of tools requires a disruption to operational procedures.
Source: CompTIA Building Digital OrganizationsBase: 350 IT & business professionals in the US
CHALLENGES WITH DATA
Need to fully utilize existing data
Want to perform analytics faster
Need better ways to present data
Data is highly segmented
Want to utilize new data sources
Need to improve storage/recovery
44%
43%
37%
35%
33%
31%
“There's strategy, then
there's execution, then
there's management.
The business lead drives
through all three, owns it
top to bottom. Everybody
in the matrix or in different
departments that's
assigned to the project
is ultimately responsible
and accountable to the
business owner.”
CompTIA.ORG AREA: Insight & Tools > Technology > Cloud
DIRECT LINK TO REPORT: CompTIA.org/buildingdigitalorgs17
7 | Information Security
The Domain of CybersecurityThere’s nothing new about the concept of securing digital assets. As early as the 1950s, organizations (especially government agencies) recognized the potential risks involved in the use of computers. The National Security Agency’s TEMPEST specification and the United States Communications Security (COMSEC) Board are examples of early initiatives born out of this awareness.
In the 1960s, it became quickly apparent that computers would become a mass market phenomenon rather than remaining relegated to those companies with the deepest pockets. Systems evolved to meet growing demands, but this evolution led to design flaws that were uncovered by a growing army of computer science researchers. While early discoveries were academic, flaws were soon exploited by those with less noble intentions. The game was afoot.
Today, security is top of mind for nearly every business. New security breaches hit the headlines on a regular basis, and while the impact so far has stopped short of being truly catastrophic, the stakes are getting higher. Thirty-three percent of companies in CompTIA’s survey indicate that security is a significantly higher priority for them today than it was two years ago, but 49% expect that security will be a significantly higher priority in two years than it is today.
Modern technology trends are changing the nature of the security domain, though. Where the goal used to be a secure perimeter, movement to the cloud
has emphasized the need for security in discrete systems and data sets. Cloud implementations are getting heavy attention, but employee systems (such as CRM or HR) and payment systems are also getting focus, even if those systems are not immediately targeted for a cloud migration.
As the technology stack for security becomes more complex, going beyond firewalls and antivirus programs, the domain is also growing to include other disciplines. The creation of secure processes and policies—such as risk analysis or compliance management—ensures safe operation in digital environments. In addition, end user education is needed to raise security literacy as more and more workers use technology for their jobs.
CompTIA’s The Evolution of Security Skills quantitative study consisted of an online survey fielded during October 2016. A total of 400 IT managers based in the US participated in the survey. The complete report is available at no cost to CompTIA premier members and registered users who can access the file at www.CompTIA.org or by contacting [email protected].
Top 5 Topics Needed in Security Training
59% Password practices
57% Risk management / analysis
55% Types of attacks
51% Threat analytics
45% Proper response for security issues
CompTIA.ORG AREA: Insight & Tools > Technology > Security
DIRECT LINK TO REPORT: CompTIA.org/securityskills
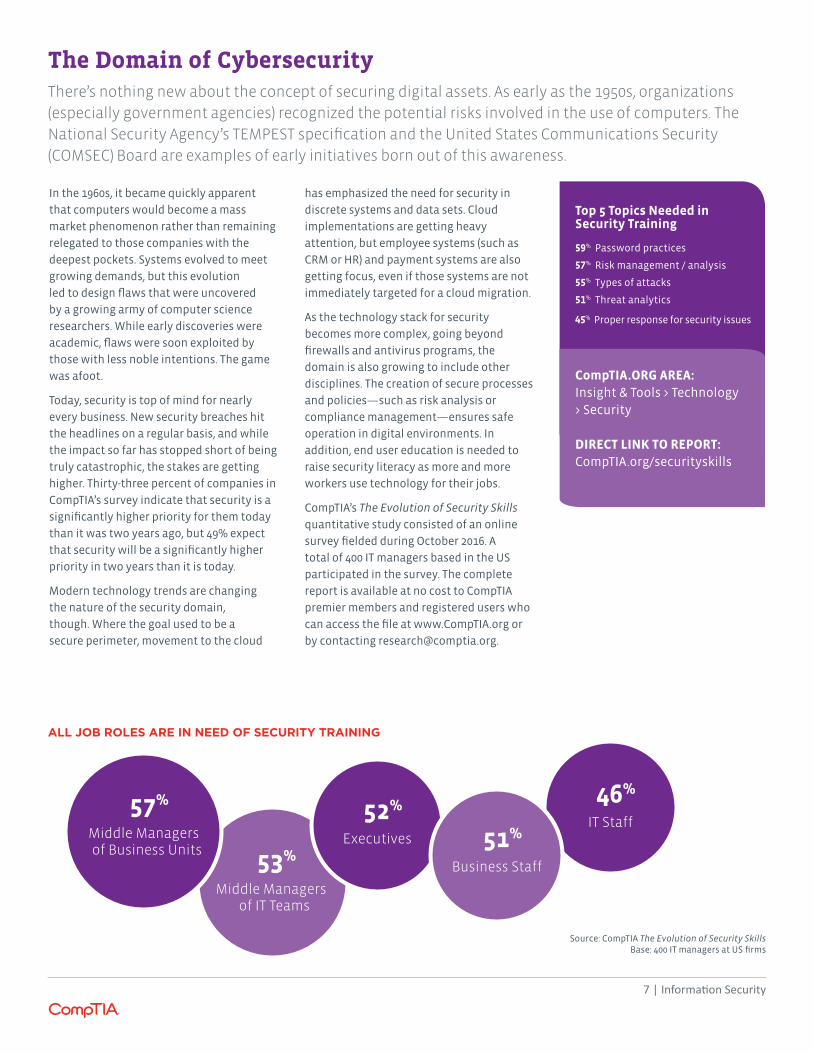
ALL JOB ROLES ARE IN NEED OF SECURITY TRAINING
Source: CompTIA The Evolution of Security SkillsBase: 400 IT managers at US firms
57%
Middle Managers of Business Units 53%
Middle Managers of IT Teams
52%
Executives 51%
Business Staff
46%
IT Staff

8 | Internet of Things
Barriers to IoT Adoption and Areas of ConcernLike most technology progressions, Internet of Things (IoT) will not be a smooth hockey stick curve, but rather a more step-like pattern. Inevitably there will be periods where forward momentum stalls and expectations are recalibrated. This may stem from technical hurdles to regulatory hurdles, or even general economic weakness leading to a pullback in spending.
Source: CompTIA Internet of Things Insights and OpportunitiesBase: 512 business & IT executives at US end user firms
Ranking of Factors Most Likely to Inhibit IoT Adoption:
1. Upfront cost
2. Lack of skilled workers with necessary IoT expertise
3. Ongoing fees / maintenance costs
4. New cybersecurity risks
5. Interoperability with existing systems / devices
6. Complexity
7. Difficulty in quantifying the return on investment (ROI)
A number of these factors – cost, interoperability, complexity, and security, are routinely covered in news stories and tech blogs covering IoT. Receiving less attention, but equally important, are issues such as the need for a skilled IoT workforce and the resources required for ongoing maintenance. Executives in the study astutely cited these factors as significant potential challenges. The workforce issues are especially critical. CompTIA’s extensive body of workforce research shows employer demand for many IT skills frequently exceeding the supply of workers. IoT and related emerging technologies will likely exacerbate the problem – at least in the near-term, as industry sectors across the economy pursue
tech talent. Training and development programs will help in addressing skills gaps among existing workers or retraining workers in obsolete fields, but it takes time for these programs to ramp up.
The issue of cybersecurity also warrants special attention. As detailed in countless studies, no organization is 100% protected from security assaults and/or breakdowns. With IoT pushing ever-greater levels of interconnectivity, new risks and vulnerabilities will be exposed. When asked about security and IoT, 57% of respondents believe their organization is very well equipped or mostly well equipped to manage the security component of IoT. Given the number of security unknowns with IoT, especially in areas that may be beyond the control of the operator, this confidence may be misplaced
CompTIA’s Internet of Things Insights and Opportunities quantitative study was conducted via two separate online surveys. Data was collected during May – June 2016. A total of 512 US end users and 350 US IT companies participated in the survey. The complete report is available at no cost to CompTIA premier members and registered users who can access the file at www.CompTIA.org or by contacting [email protected].
Internet of Things: a
proposed development
of the Internet in which
everyday objects have
network connectivity,
allowing them to send,
receive and act on data.
CompTIA.ORG AREA: Insight & Tools > Technology > Cloud
DIRECT LINK TO REPORT: CompTIA.org/iotinsights
IOT REGULATORY / POLICY CONCERNS RAMP UP
Overwhelming, respondents believe IoT cybersecurity safeguards should supersede IoT innovation. And yet, con-cern over IoT compliance cost and new regulations is high, a sign of a likely disconnect.
Cost of compliance
Concern over "questionable" new regulations taking hold
Liability uncertainties
Challenge of finding necessary legal expertise to navigate IoT regulations
Possibility of having to manage a patchwork of state or international regulations
Tax implication uncertainties
51%
42%
41%
36%
32%
23%
9 | SMB Market
KEY POINTS
SMBs place a high priority on technology
Two-thirds of SMBs indicate technology is a primary factor in pursuing their business objectives, while 31% rate it as a secondary factor. Top SMB priorities for the year ahead – customer retention, expansion into new markets, business process improvements, innovation, and workforce development, will require the right mix of people, process, and technology to ensure optimal results.
Many firms want to increase their investment in technology, but barriers exist
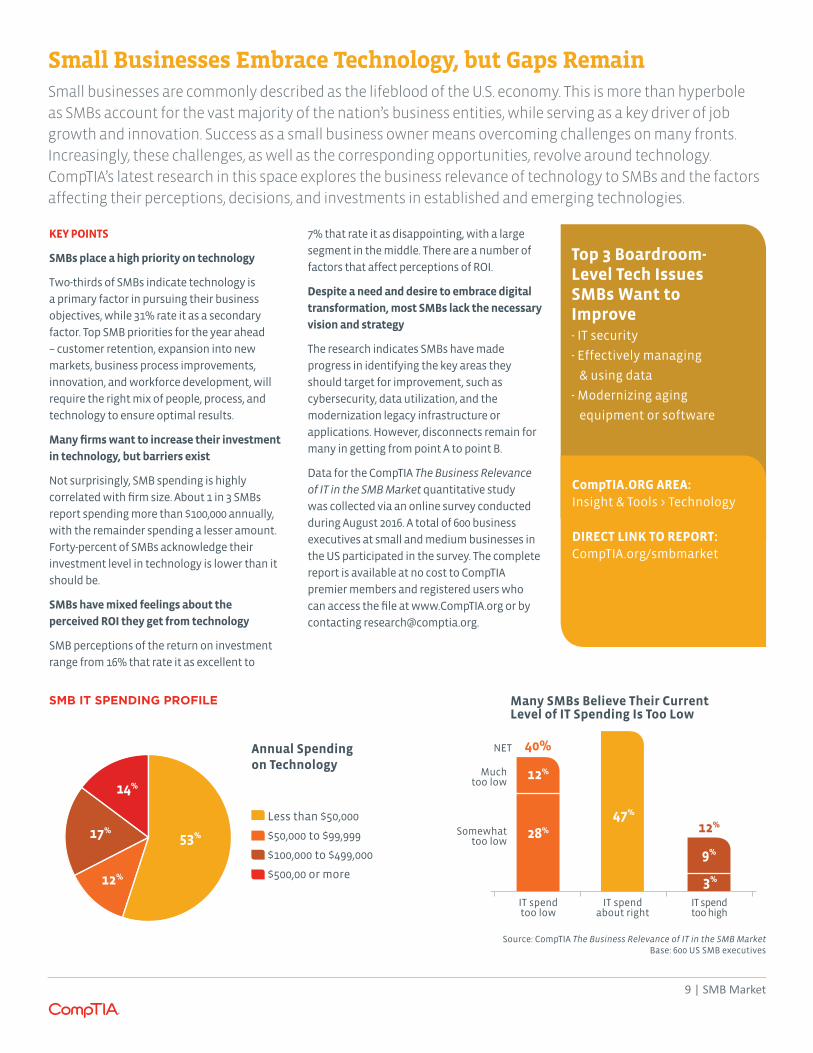
Not surprisingly, SMB spending is highly correlated with firm size. About 1 in 3 SMBs report spending more than $100,000 annually, with the remainder spending a lesser amount. Forty-percent of SMBs acknowledge their investment level in technology is lower than it should be.
SMBs have mixed feelings about the perceived ROI they get from technology
SMB perceptions of the return on investment range from 16% that rate it as excellent to
7% that rate it as disappointing, with a large segment in the middle. There are a number of factors that affect perceptions of ROI.
Despite a need and desire to embrace digital transformation, most SMBs lack the necessary vision and strategy
The research indicates SMBs have made progress in identifying the key areas they should target for improvement, such as cybersecurity, data utilization, and the modernization legacy infrastructure or applications. However, disconnects remain for many in getting from point A to point B.
Data for the CompTIA The Business Relevance of IT in the SMB Market quantitative study was collected via an online survey conducted during August 2016. A total of 600 business executives at small and medium businesses in the US participated in the survey. The complete report is available at no cost to CompTIA premier members and registered users who can access the file at www.CompTIA.org or by contacting [email protected].
Small Businesses Embrace Technology, but Gaps RemainSmall businesses are commonly described as the lifeblood of the U.S. economy. This is more than hyperbole as SMBs account for the vast majority of the nation’s business entities, while serving as a key driver of job growth and innovation. Success as a small business owner means overcoming challenges on many fronts. Increasingly, these challenges, as well as the corresponding opportunities, revolve around technology. CompTIA’s latest research in this space explores the business relevance of technology to SMBs and the factors affecting their perceptions, decisions, and investments in established and emerging technologies.
Top 3 Boardroom-Level Tech Issues SMBs Want to Improve
- IT security
- Effectively managing
& using data
- Modernizing aging
equipment or software
CompTIA.ORG AREA: Insight & Tools > Technology
DIRECT LINK TO REPORT: CompTIA.org/smbmarket
SMB IT SPENDING PROFILE
Source: CompTIA The Business Relevance of IT in the SMB MarketBase: 600 US SMB executives
Annual Spending on Technology
Many SMBs Believe Their Current Level of IT Spending Is Too Low
17%53%
14%
Less than $50,000
$50,000 to $99,999
$100,000 to $499,000
$500,00 or more12%
IT spend too low
NET
Much too low
Somewhat too low
IT spend about right
IT spend too high
3%
9%
12%47%
12%
28%
40%

10 | Tech Buyers
In fact, 4 in 10 LOB respondents said that their department works jointly with IT to determine which hardware, software, services and other tech solutions they will deploy. Just 19% said IT handles all such decisions; with even fewer (14%) saying that their individual business unit pulls all the strings. Additionally, another quarter of respondents demonstrate just how fluid things can be, reporting that their tech purchase process can present in a combination of ways: IT only, business unit only, or collaboration between both groups.
That said, all signs indicate that the role non-IT business units will play in both strategic and tactical decision-making for technology will only increase as businesses march toward the cloud and all things digital. That reality is going to trigger other organizational considerations. Chief among them? Who’s is paying for what.
It stands to reason that the business unit itself would maintain a budget to handle IT-related purchases made independently of the IT department. But that is not always the case, especially in these early days of tech-buyer diversification. While nearly 4 in 10 respondents said their business unit foots its own IT bill, another 46% reported that the identity of the party that picks up the tab – business unit vs IT department – is dependent upon the type of technology that is being purchased.
CompTIA’s Considering the New IT Buyer quantitative study consisted of an online survey fielded to US workforce professionals during February 2017. A total of 675 businesses based in the US participated in the survey. The complete report is available at no cost to CompTIA premier members who can access the file at www.CompTIA.org or by contacting [email protected].
The Delicate Dance Between Business Units and IT DepartmentsWhile business units in functional areas outside of the IT department are increasingly involved in technology purchase decisions, it is not to the exclusion of IT staff in most cases. More often than not, it appears that business units and IT staff collaborate around tech choices, a dynamic that seems to suggest that the incidence of purely “rogue” IT behavior by line of business (LOB) managers may have diminished.
PRIMARY DECISION-MAKERS FOR IT PURCHASES
Source: CompTIA Considering the New IT BuyerBase: 600 business executives at US firms
Top reasons why line of
business units make their
own tech decisions include
their staff are tech-savvy/
innovation-focused (50%)
and/or cloud computing
made it easier for their unit
to provision its own tech
(38%).
CompTIA.ORG AREA: Insight & Tools
DIRECT LINK TO REPORT: CompTIA.org/newitbuyer
Business unit working jointly with IT
Combo of all depending on circumstance
Non-IT business unit
IT department
40%
25%
14%
19%

11 | Smart Cities
Applying CompTIA’s IoT ecosystem framework to the smart cities concept provides a mechanism for reducing the scope to more manageable sub-components. The four dimensions of the framework are: Hardware, Software, Service, and Rules.
City managers, city IT staff, and elected officials will require, at a minimum, a basic understanding of the framework and its interdependencies. Realistically, though, decisions regarding whether to invest or how to proceed with smart cities initiatives will be contingent on outputs rather than inputs. Smart city investments will be judged by metrics such as improvements to livability, cost savings, citizen engagement, business community support, and votes at the ballot box.
From the research, government respondents have high expectations for the value smart cities’ solutions will deliver. Again, using IoT as a proxy for smart cities, 50% of respondents definitely see value, while 39% indicate probable value. Among perceived benefits, improved decision-making through new or better streams of data ranks highest. Given the many layers of bureaucracy, agencies, jurisdictions,
and constituencies, the interest in data-driven decision-making is not surprising. Even small improvements in empowering government workers with the right data at the right time can pay dividends.
Staff productivity and cost savings from operational efficiencies, both closely related to data-driven decision-making, rank second and third as smart city value proposition factors. With the number of public sector employees remaining essentially flat despite a growing population (+38 million since 2000), finding ways to improve staff productivity is critically important to governments and constituents.
The data for CompTIA’s Building Smarter Cities research brief was collected via an online survey conducted during June – July 2016. A total of 172 US federal, state, or local government personnel with some degree of technology decision-making responsibility participated in the survey. The complete report is available at no cost to CompTIA premier members and registered users who can access the file at www.CompTIA.org or by contacting [email protected].
The Path to Smarter CitiesThe path to smarter cities will not be a straight line from point A to point B. There will be starts and stops, twists and turns as the many factors at play respond to market and political forces. While there are examples of where smart city solutions can be thought of as discrete products or services, that is more the exception than the rule. For the same reason the smart cities movement is so fascinating – the seemingly limitless number of ideas for making cities smarter – its vastness can be quite daunting.
Source: CompTIA Building Smarter CitiesBase: 172 US government respondents
Top 3 Adoption Inhibitors / Concerns
- New cybersecurity risks
- Lack of skilled workers
with IoT expertise
- Upfront investment cost
CompTIA.ORG AREA:Insight & Tools > Technology > Cloud
DIRECT LINK TO REPORT: CompTIA.org/smartcities
GOVERNMENT EXPECTATIONS FOR SMART CITY / IOT IMPACT
Waste mgt., power grid or
utilities
Public Safety Transportation Transparency and open data
Parks, rec. and environment
30% 30%
25%23%
10%
72% 74% 74%
66% 67%
Already Starting to Have an Impact
Impact Expected Over Next 2-4 Years
12 | IT Skills
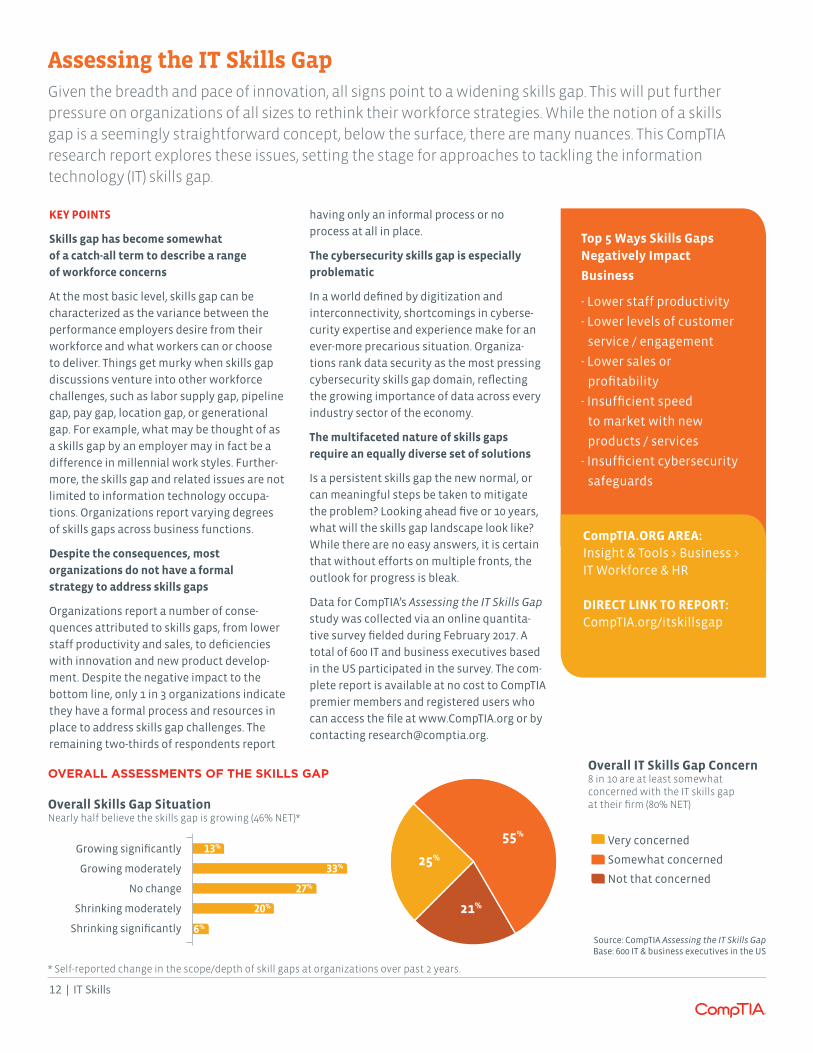
Source: CompTIA Assessing the IT Skills GapBase: 600 IT & business executives in the US
KEY POINTS
Skills gap has become somewhat of a catch-all term to describe a range of workforce concerns
At the most basic level, skills gap can be characterized as the variance between the performance employers desire from their workforce and what workers can or choose to deliver. Things get murky when skills gap discussions venture into other workforce challenges, such as labor supply gap, pipeline gap, pay gap, location gap, or generational gap. For example, what may be thought of as a skills gap by an employer may in fact be a difference in millennial work styles. Further-more, the skills gap and related issues are not limited to information technology occupa-tions. Organizations report varying degrees of skills gaps across business functions.
Despite the consequences, most organizations do not have a formal strategy to address skills gaps
Organizations report a number of conse-quences attributed to skills gaps, from lower staff productivity and sales, to deficiencies with innovation and new product develop-ment. Despite the negative impact to the bottom line, only 1 in 3 organizations indicate they have a formal process and resources in place to address skills gap challenges. The remaining two-thirds of respondents report
having only an informal process or no process at all in place.
The cybersecurity skills gap is especially problematic
In a world defined by digitization and interconnectivity, shortcomings in cyberse-curity expertise and experience make for an ever-more precarious situation. Organiza-tions rank data security as the most pressing cybersecurity skills gap domain, reflecting the growing importance of data across every industry sector of the economy.
The multifaceted nature of skills gaps require an equally diverse set of solutions
Is a persistent skills gap the new normal, or can meaningful steps be taken to mitigate the problem? Looking ahead five or 10 years, what will the skills gap landscape look like? While there are no easy answers, it is certain that without efforts on multiple fronts, the outlook for progress is bleak.
Data for CompTIA’s Assessing the IT Skills Gap study was collected via an online quantita-tive survey fielded during February 2017. A total of 600 IT and business executives based in the US participated in the survey. The com-plete report is available at no cost to CompTIA premier members and registered users who can access the file at www.CompTIA.org or by contacting [email protected].
Assessing the IT Skills GapGiven the breadth and pace of innovation, all signs point to a widening skills gap. This will put further pressure on organizations of all sizes to rethink their workforce strategies. While the notion of a skills gap is a seemingly straightforward concept, below the surface, there are many nuances. This CompTIA research report explores these issues, setting the stage for approaches to tackling the information technology (IT) skills gap.
Top 5 Ways Skills Gaps Negatively Impact
Business
- Lower staff productivity
- Lower levels of customer
service / engagement
- Lower sales or
profitability
- Insufficient speed
to market with new
products / services
- Insufficient cybersecurity
safeguards
CompTIA.ORG AREA: Insight & Tools > Business > IT Workforce & HR
DIRECT LINK TO REPORT: CompTIA.org/itskillsgap
OVERALL ASSESSMENTS OF THE SKILLS GAP Overall IT Skills Gap Concern8 in 10 are at least somewhat concerned with the IT skills gap at their firm (80% NET)Overall Skills Gap Situation
Nearly half believe the skills gap is growing (46% NET)*
* Self-reported change in the scope/depth of skill gaps at organizations over past 2 years.
25%
21%
55%Very concerned
Somewhat concerned
Not that concerned
Growing significantly
Growing moderately
No change
Shrinking moderately
Shrinking significantly
13%
33%
27%
20%
6%

13 | Cloud Computing
The vast majority of companies have been using cloud solutions between one and five years. Half of the sample has been using cloud for one to three years, and another 21% have been using cloud for three to five years. Just 6% claim to have been using cloud solutions for more than five years. These time periods match well with company placement in the four stages of adoption—five years is not enough time to begin rebuilding systems and processes to take full advantage of cloud resources.
The remaining 23% of companies have been using cloud for less than one year. This is a good reminder that although many companies are focusing on cutting-edge aspects of cloud computing, a significant number of businesses are still getting education on concepts and performing experiments or initial migrations. Seeing how clarification is causing people to re-evaluate their IT architecture, it is important to get these first steps right.
Lingering confusion may still exist in the different models that are being used, particularly around private cloud. Many people still use the term “private cloud” when referring to resources that are managed externally and reserved exclusively for their company rather than being multi-tenant. Even though this model does not provide cloud characteristics such as on-demand self-service or rapid elasticity, the term has become widely favored over “hosted datacenter.”
Aside from debates over the interpretation of private cloud, there is healthy adoption of the different deployment models and service models. Over time, the segment utilizing a hybrid cloud model will likely grow. Companies will gravitate towards SaaS applications rather than packaged software, and infrastructure will be built in different ways according to different specifications.
Ultimately, what drives cloud adoption will be the benefits that companies derive. After several years of companies citing that cloud solutions were simply better for a variety of reasons, cost cutting has returned to the top spot, driven mostly by large companies (500+ employees). These enterprises are the most likely to be moving into later stages of adoption, and they are fine-tuning their cloud solutions. In addition, they are now more apt to account for any cloud transition costs that may have been hidden during initial stages, such as network upgrades.
Data for the CompTIA Trends in Cloud Computing study was collected via an online quantitative survey conducted during July 2016. A total of 500 business and IT executives (aka customers or end users) participated in the survey. The complete report is available at no cost to CompTIA premier members and registered users who can access the file at www.CompTIA.org or by contacting [email protected].
The State of CloudWith the data shifting as companies refine their perception and understanding of cloud systems, there is little opportunity to analyze the rate of change among different cloud trends. Some slowdown is to be expected as companies reach later stages of adoption, but changes in definition can muddy the waters. This report, then, primarily examines the trends as they stand today; these trends generally match findings from previous research.
Source: CompTIA Trends in Cloud ComputingBase: 495 business & IT executives at US firms with cloud adoption
MOST CLOUD MODELS SEEING HEALTHY ADOPTION
CompTIA.ORG AREA: Insight & Tools > Technology > Cloud
DIRECT LINK TO REPORT: CompTIA.org/trendsincloud
46%
28%
26%Private only
Public only
Hybrid
Top 4 Benefits Realized from Using Cloud
Solutions
- Ability to cut costs
- Cloud solution was simply
better option
- Reduce capital
expenditures
- Reduce operational
complexity
SaaS IaaS PaaS
33%
42%
74%

14 | Emerging Tech
What about other emerging technologies though? Lower barriers for entry and broader integration of technology in daily life are leading to rapid introduction of not only new products but also new macro trends. While the pace of new introductions may be increasing, this may not necessarily mean that the pace of business adoption is increasing. A wider variety of options may simply mean that more technologies fall by the wayside.
This churn leaves many businesses in a state of uncertainty. Without much precedent for determining long-term viability, many technologies appear promising at the outset. Without the proper skills to fully understand the new technology stack, imagining architectures with new components is challenging.
This research brief acts as a companion to the Internet of Things Insights and Opportunities study, exploring a variety of up-and-coming trends to determine which ones might have some staying power and when any impact might be felt
Across the topics in CompTIA’s study, awareness among end users is generally healthy. Aside from biometrics, augmented reality, and chatbots, over half the sample had some knowledge of future trends either from direct experience or from reading news
stories and conducting research. (Note: this study was conducting before the release of Pokémon Go, a game that thrust the concept of augmented reality into the headlines.) The high level of awareness is a testament to the way that technology—especially consumer technology—has become integrated into society. A decade ago, drones and artificial intelligence would have been reserved for trade publications; today, they make headlines in mass media.
End users have a more bullish outlook when it comes to the potential business impact of future technology. Channel firms are likely more cautious based on experience integrating technology and making it enterprise grade, but they will have to find the middle ground between previous practices and experimentation, including the exploration of new vendors.
The data for CompTIA’s Tech on the Horizon: From VR to Bots research brief was collected two separate online surveys during May – June 2016. A total of 512 US end users and 350 US IT companies participated in the survey. The complete report is available at no cost to CompTIA premier members and registered users who can access the file at www.CompTIA.org or by contacting [email protected].
Tech on the Horizon: From VR to BotsCompTIA’s recent Internet of Things Insights and Opportunities study took a look at the emerging potential of the Internet of Things (IoT), a topic that has gained strong momentum over the past year. The study found that both channel firms and end users are well aware of IoT and beginning to pursue real business applications, pushing the trend past the hype into real utility.
TOP LEVEL AWARENESS OF EMERGING TECHNOLOGIES
Source: CompTIA Tech on the Horizon: From VR to BotsBase: 512 business & IT executives at US end user firms
*NET gain = significant gain + modest gain
Will IoT, AI, robotics & related
technologies result in NET
job gains or losses? Most
believe that emerging tech
will result in a net gain*
in available jobs.
Views by Age:
- 20-somethings:
70% NET gain
- 30-somethings:
73% NET gain
- 40-somethings:
64% NET gain
CompTIA.ORG AREA: Insight & Tools > Technology > Cloud
DIRECT LINK TO REPORT: CompTIA.org/techonhorizon
3-D printing
Drones
Virtual Reality (VR)
Internet of Things (IoT)
Self-driving vehicles
Robotics
Artificial Intelligence
Biometrics
Augmented reality (AR)
Chatbots
78%
71%
71%
68%
63%
61%
54%
46%
27%
22%
Among end-user customers in the manufacturing, retail, government, hospitality, healthcare, or AMTUC sectors

15 | Managed Services
MSPs seem to be getting the message about the benefits of growing share of wallet with existing customers, as 58% expressed that as a major strategic priority for the next two years. And another 57% said they are focusing on expanding into new, emerging services such as Internet of Things.
A combination of net-new customer growth and existing customer scale is the right balance to strike to help ensure steady revenue increases.
Two other strategic priorities look outward and indicate evolution. More than half of respondents plan to focus on specializing in one or more vertical industries. Targeting a particular vertical, whether it’s healthcare, retail, professional services or another, is a keen way for an MSP to differentiate in the market with a set of skills not universally held by their broader set of competitors. The most popular vertical industries that today’s MSPs are working with are information technology, professional services, manufacturing, finance/banking, and retail.
Additionally, another half of respondents plan to align with a new set of vendors. This most likely suggests they are taking a look at cloud-based vendors, chiefly SaaS
providers. From a vendor perspective, this is a key development. In CompTIA’s 5th Annual State of the Channel study, published in September 2015, a majority of respondents said a main reason they would drop a vendor from their line card is because the vendor’s products and/or services no longer fit their customers’ needs or their own business model. This reality should prompt vendors to take a hard look at what does appeal to both of these constituents, both in terms of what they sell, but also how they construct their partner programs, benefits and channel compensation models.
Many partners today, especially MSPs and cloud-focused firms, will tell you that they are no longer so vendor-reliant, and instead market to the customer strongly under their own brand and reputation.
Data for CompTIA’s 5th Annual Trends in Managed Services was collected via multiple online quantitative surveys fielded during March 2016 among 400 managed services providers (MSPs). The complete report is available at no cost to CompTIA premier members who can access the file at www.CompTIA.org or by contacting [email protected].
MSP Strategic Priorities and Business PlanningIndustry concerns and worries aside, managed services providers (MSPs) have strategic priorities in play for the next two years. No. 1 on the list? Acquiring net-new customers, a goal cited as major by nearly two thirds of respondents. Historically, the customer numbers game was the key to growth in a managed services space that depends upon volume. And it’s still integral to success. But today that’s changing as the real source of growth lies with existing customers and the ability to grow share of wallet there by taking them beyond service catalog basics to the expanding number of new, complex technologies.
EXPECTATIONS FOR MANAGED SERVICES BUSINESS NEXT TWO YEARS
Source: CompTIA 5th Annual Trends in Managed ServicesBase: 400 US MSPs
Top 3 Immediate Strategic Goals for MSPs
- Increasing volume
net-new customers
- Expand business
with existing base
- Expand into new
services (e.g. IoT)
CompTIA.ORG AREA: Insight & Tools > Technology > Managed Services DIRECT LINK TO REPORT: CompTIA.org/ 5thtrendsinmanagedservices
52%
44%
4%
47%
52%
1%
61%
36%
4%
High GrowthComprising majority of revenue (75% or more)
Medium GrowthComprising increasing part
of revenue (50% or more)
Flat GrowthRemains at current levels
Large
Medium
Small

16 | Tech Trade
Tech Trade SnapshotU.S. exports of tech products and services were an estimated $309 billion in 2016, a slight decrease from the previous year. Tech is one of the largest sectors for exports in the U.S. economy.
TOP SECTORS FOR MANUFACTURED GOODS
Source: CompTIA CompTIA Tech Trade Snapshot 2017[Analysis of data from the U.S. International Trade Administration and Bureau of Economic Analysis]
Manufactured goods export data covers 2016; services export data covers 2015.
Exports account for approximately $1 out of every $4 generated in the U.S. tech industry. For many tech bellwethers, exports account for an even higher percentage of sales, with some generating more than half of their revenue overseas.
Tech products exports, also referred to as manufactured goods, fell 1.3 percent to $202 billion. The bright spots in this category include semiconductors, which added $2.2 billion (+3.1 percent) and communications equipment, up $1.9 billion (+1.7 percent).
Tech services exports were flat for the most recently available data compiled for 2015. Growth did occur in IT services, which added $1.8 billion (+12.7 percent), and R&D services, which added $1.6 billion (+4.8 percent).
Tech services exports continue to capture a larger share of total U.S. tech exports. Since 2005, its share has more than doubled and now exceeds 34 percent of total tech exports.
According to the U.S. International Trade Administration’s Office of Trade and Economic Analysis, exports of tech products directly supported an estimated 425,465
industry jobs in 2014, the most recent year of analysis. This translates to approximately 4 in 10 tech manufacturing industry jobs supported by exports.
The leading markets for U.S. tech products exports remained largely unchanged from the previous year. The top ten markets account for 68 percent of total tech goods exports. The top ten countries for tech products imports into the U.S. account for 89 percent of all imports in this category.
The CompTIA Tech Trade Snapshot is based on an analysis of import and export data from the U.S. Office of Trade Policy and Analysis, U.S. International Trade Administration and Bureau of Economic Analysis. The complete report is available at no cost to CompTIA premier members and registered users who can access the file at www.CompTIA.org or by contacting [email protected]
“Exports account for approximately $1 out of every $4 generated in the U.S. tech industry.Exports directly support 4 in 10 U.S. tech manufacturing sector jobs.”
CompTIA.ORG AREA: Insight & Tools > Business
DIRECT LINK TO REPORT: CompTIA.org/techtradesnapshot2017
Top 5 U.S. Sectors for Services Exports
$ Billions % of Total1. Travel services $205 27%2. Tech services $107 14%3. Financial services $102 14%4. Transport (freight, shipping) $87 12%5. Professional and mgt. consulting $65 9%
Top 5 U.S. Sectors for Manufactured Exports
$ Billions % of Total1. Transportation/motor vehicles $276 19%2. Tech products $202 14%3. Chemicals $185 13%4. Agriculture, food & beverage $138 9%5. Machinery $125 9%

17 | UK Market
IT Industry Outlook for the United KingdomThe global IT industry surpassed $3.4 trillion in 2016, according to the research consultancy IDC. If growth expectations materialise, the industry will push past the $3.5 trillion mark in the year ahead.
Source: CompTIA IT Industry Outlook 2017: UK SummaryBase: 122 executives at IT firms in the UK
CompTIA uses a consensus forecasting approach. This “wisdom of the crowds” model attempts to balance the opinions of large IT firms with
small IT firms, as well as optimistic opinions with pessimistic opinions. The results attempt a best-fit
forecast that reflects industry sentiment.
Given the IMF’s recent bump to global GDP growth estimates – now at 3.4 percent, the economic climate seems conducive to IT industry growth hitting its mark. For the UK market, the IMF expects GDP growth of 1.5 percent, a slight improvement over their previous forecast. The IMF attributed the improved outlook to the UK economy holding up better than expected in the aftermath of the Brexit vote.
Breaking the UK IT market down into its core components, the hardware, software and services categories account for 70 percent of the UK market. The fourth element, telecom services, accounts for the remaining 30 percent.
IT services is the largest category in the UK market, accounting for 33 percent of revenue generated. In comparison, IT services account for 19 percent of the global market, and 25 percent of the US market.
The already dominant IT services and custom software solutions category is poised to reach ever-greater heights, according to UK IT industry executives. A trend that began many years ago, the everything-as-a-service phenomena has maintained its momentum. While certain facets of technology are becoming easier to manage, the overall complexity of managing technology ecosystems often exceeds the capabilities of many customer segments, especially small businesses. With traditional
managed services providers embracing new opportunities in areas such as managed security, data, and IoT, hitting the upside of the forecast is not unrealistic.
Straddling the hardware, software, IT services, and telecom categories is cloud computing. Expectations are high for another year of robust growth for cloud applications and cloud infrastructure. This sentiment is corroborated by other CompTIA research of end users and channel partners. Customer demand for IaaS and SaaS cloud components will accelerate as they pursue digital business strategies.
Another category well positioned for upside potential is the umbrella category of security. This category is no longer narrowly defined in the traditional sense of firewalls or antivirus, but rather, a broad suite of tools and safeguards designed to combat the ever-expanding universe of security threats.
Data for the CompTIA IT Industry Outlook 2017: UK Summary was collected via an online quantitative survey fielded during December 2016 – January 2017 in the United Kingdom (n=122). The complete report is available at no cost to CompTIA premier members and registered users who can access the file at www.CompTIA.org or by contacting [email protected].
Expected 2017 Impact of
Emerging Technologies
on Bottom Line of UK IT
Companies
- 10% Significant impact
- 44% Modest impact
- 16% Minor impact
- 23% No impact or don’t know
CompTIA.ORG AREA: Insight & Tools > Business
DIRECT LINK TO REPORT: CompTIA.org/ukindustryoutlook
UK GROWTH FORECAST
Gro
wth
Rat
e R
ange
6.0
5.0
4.0
3.0
2.0
1.0
0.0Hardware Software IT Services Telecom Emerging
Tech

18 | CompTIA Research
CompTIA Research and Market Intelligence provides timely, relevant data and insights aimed at informing and driving the IT industry. CompTIA has a library of over 100 research reports, whitepapers, briefs, podcasts, videos and webinars, with new material produced each month. Using rigorous research techniques, CompTIA collects data from tens of thousands of end users and IT companies on a wide range of issues covering tech trends, channel dynamics and the IT workforce.
Premier members cannot get access to this amount of independent and vendor-neutral data for the money anywhere else. Our studies are uniquely designed to address the informational needs of the IT industry. CompTIA analysts are dedicated to measuring, tracking, exploring and explaining technology adoption, business attitudes and workforce issues in order to forecast new industry opportunities and growth.
CompTIA Premier members enjoy full access to the library covering various topics such as:
Technology Focused Research
-Cloud Computing- Internet of Things- Security- Emerging Tech
Channel Focused Research
- State of Channel - Managed IT Services- Channel Security- SaaS Market
Market Vertical Focused Research
- Professional Services- Government Sector- SMB Market- UK Market
Workforce, Policy and Business Research
- Cyberstates- IT Industry Outlook- IT Skills, Training and Certification- Quarterly Business Confidence Index
CompTIA members and registered users incorporate our research findings into their business and marketing plans, education and sales strategies. In conjunction with CompTIA IT Channel Training offerings, you can turn to one comprehensive source for industry trends, educational content and training resources to take market intelligence a step further with practical implementation strategies. Whether you need a quick data point for a presentation or article, industry trends for a new product/service offering business plan, or end user insights to increase sales, CompTIA has answers.
For more information about CompTIA Research and Market Intelligence visit www.CompTIA.org/insight-tools or contact [email protected].
CompTIA Research and Market Intelligence
New benefit for Premier Members! Add your firm’s logo to a selection of CompTIA research report PDFs.
Building Digital Organizations
RESEARCH REPORT
PROVIDED COURTESY OF
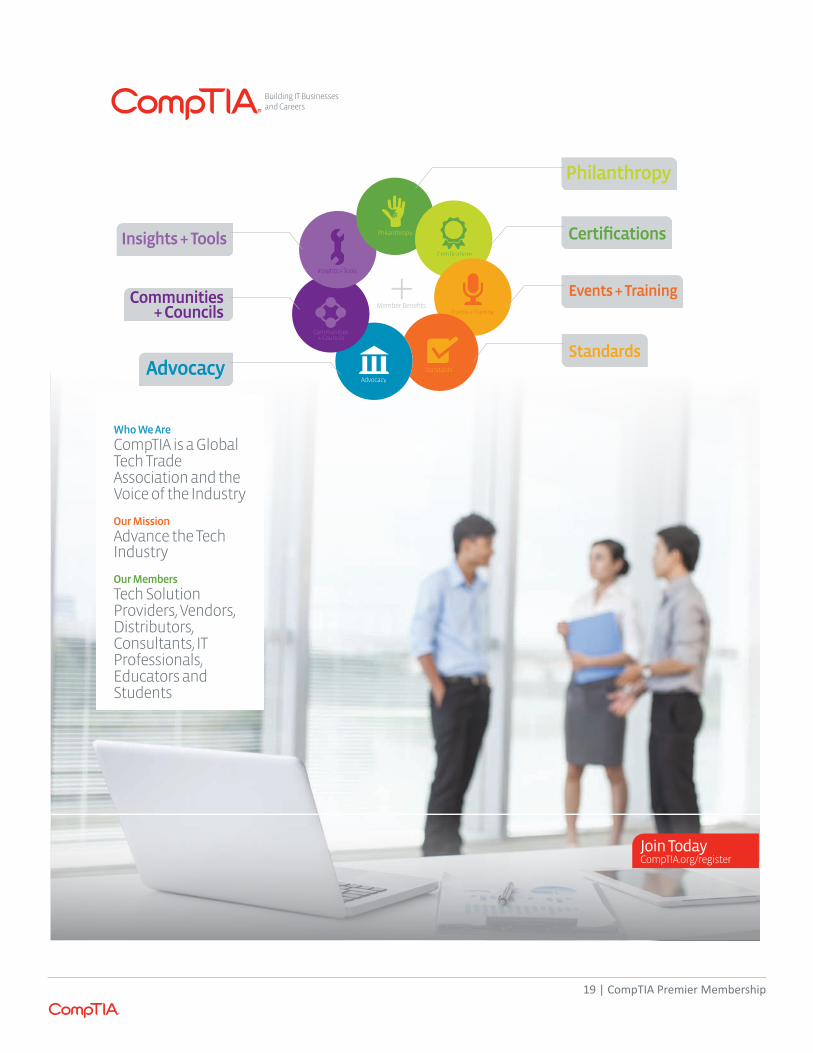
Who We Are
CompTIA is a Global Tech Trade Association and the Voice of the Industry
Our Mission
Advance the Tech Industry
Our Members
Tech Solution Providers, Vendors, Distributors, Consultants, IT Professionals, Educators and Students
Communities + Councils
Communities+ Councils
Join TodayCompTIA.org/register
Member Benefits
Building IT Businesses and Careers
19 | CompTIA Premier Membership
About CompTIA
CompTIA® is the voice of the world’s information technology (IT) industry. As a non-profit trade association advancing the global interests of IT professionals and companies, we focus our programs on four main areas: education, certification, advocacy and philanthropy. Association members are at the forefront of innovation and represent businesses that maximize the value their clients receive from their technology investments. CompTIA member communities allow IT professionals to collaborate on industry issues and develop the resources needed to grow the industry. For more information, visit CompTIA.org or follow CompTIA on Twitter at Twitter.com/CompTIA.
© 2017 CompTIA Properties, LLC, used under license by CompTIA Member Services, LLC. All rights reserved. All membership activities and offerings to members of CompTIA, Inc. are operated exclusively by CompTIA Member Services, LLC. Reproduction or dissemination prohibited without written consent of CompTIA Properties, LLC. Printed in the U.S. 03709-Jul2017