Embed Size (px)
Citation preview

Rad. and Environm. Biophys. 14, 123--136 (1977) Radiation and Environmental Biophysics © Springer-Verlag 1977
Computation of Microdosimetric Distributions for Small Sites*
D. Chmelevsky and A. M. Kellerer
Institut fiir Medizinische Strahlenkunde der Universifiit Wiirzburg, Versbacher LandstraBe 5, D-8700 Wlirzburg, Federal Republic of Germany
Summary. Object of this study is the computation of microdosimetric functions for sites which are too small to permit experimental determination of the distri- butions by Rossi-counters. The calculations are performed on simulated tracks generated by Monte-Carlo techniques.
The first part of the article deals with the computational procedure. The second part presents numerical results for protons of energies 0.5, 5, 20 MeV and for site diameters of 5, 10, 100 nm.
Introduction
Topic of this article is the calculation of microdosimetric distributions. The calcula- tions are performed for heavy charged particles and for spherical regions whose diameter is between 1 and 100 nm. The input data on which the calculations are based are simulated tracks of heavy charged particles. The simulated tracks have been generated by Paretzke [12, 13] on the basis of known and interpolated cross- sections of charged particles in low atomic weight media 1.
The general properties of microdosimetric quantities and their distributions have been considered earlier [7, 8]. The theoretical background need therefore not be repeated. The microdosimetric variable which will be used in the following is the lineal energy, y. This facilitates comparison with the familiar concept of LET. The connection to the other microdosimetric variables energy imparted, E, and specific energy, z, is straightforward. Numerical results will only be given for the single event distributions. This is sufficient since the dose dependent distributions can be derived from the single event distributions.
* This investigation was supported by Public Service Research Grants No. CA 12536 and CA 15307 from the National Cancer Institute and by Research Contract 208-76-7 BIO D of Eur- atom
1 A recent survey of the subject of collision cross-sections is found in the Proceedings of the Symposium on the Distributions of Secondary Electrons from Ionizing Collisions [Radiat. Res. 63 (1975)]. Valuable information is given in earlier work [2, 3, 6, 10]

124 D. Chmelevsky and A. M. Kellerer
The first part of this article deals with the computational procedures. The second part contains numerical results. These are mainly restricted to single event distribu- tions for protons of energy between 500 keV and 20 MeV.
Computational Procedure
Principle of the Approach
The computations are based on simulated particle tracks. Each simulated particle track is represented by the so-called inchoate distribution. As pointed out earlier [7] the inchoate distribution is given by the coordinates of the transfer points, i.e. of those points where the primary or secondary ionizing particles transfer energy to the medium. The simulated charged particle tracks are those obtained by Monte Carlo simulation [12, 13]. In principle such particle tracks might also be derived from experimental observations for example in cloud chambers [4]. The computational procedures are applicable regardless of the origin of the input data.
In the experiment one exposes one spherical cavity, the Rossi counter, to a sufficiently large fluence of charged particles. This is natural, since the instrumenta- tion is costly while tracks can be generated abundantly. In the computations the situation is reversed, since it is wasteful to generate a great number of tracks. It is therefore important that the information in each simulated track be fully exhausted. An essential point is accordingly the development of efficient sampling routines. The topic will be treated in some detail, since it is of interest even beyond the particular application presented in this study.
It will be found sufficient to use short segments of the tracks of heavy charged particles which contain one or a few thousand ionizations. As in the earlier discus- sion [9] the term short segment implies that the LET of the particle does not change significantly along this segment and that the segment is straight. The numerical procedure will, however, be applicable regardless of these conditions.
Method of Sampling
The following discussion will make use of an important simplification. Only the ionizations in the simulated particle tracks are accounted for, while the excitations are disregarded. This means that the particle track is reduced to those transfer points which stand for ionizations. Furthermore the energy transfer belonging to each of the remaining transfer points is set equal to W, the mean energy expended per ionization. This is a drastic simplification which may not always be acceptable. However it is advantageous insofar as numerical results obtained in this way are comparable to experimental data based on ion collection in gas. A second advantage is a substantial reduction of the input data and a simplification of the numerical calculations. The discussion of the sampling procedures will make use of the same simplification. The formalism can however be readily adapted to the more rigorous analysis where charged particle tracks are evaluated in their precise form with all

Computation of Microdosimetric Distributions 125
transfer points and with all the proper energy transfers assigned to these transfer points.
If one considers a spherical site of radius r, the associated volume of the charged particle track is that volume which results if each transfer point, i.e. each ionization, is made the center of a sphere of radius r. The individual spheres will, for the purpose of the present discussion, be called associated spheres; this will help to avoid confu- sion of these spheres with the sphere which is the reference site for the determination of the microdosimetric variable y. If one selects a point inside the associated volume and considers a sphere of radius r centered at this point, then this sphere will always contain at least one transfer point. If one considers a point outside the associated volume and a sphere of radius r centered at this point, then this sphere will never contain a transfer point. It is therefore sufficient to consider only those spheres whose centers are inside the associated volume, i.e. it is sufficient to sample points inside the associated volume.
The associated volume is made up of the associated spheres, and these may partially overlap. The microdosimetric variables y, E, or z are largest at those points where the degree of overlap is largest. If, at a certain sampling point, n associated spheres overlap then the value of y is:
3mW y = - - (1)
4r
The equation is based on the simplification which has been mentioned above, i.e. it results if each transfer point is assumed to be an ionization which corresponds to an energy transfer W.
According to these considerations it is sufficient to calculate the fractions of the associated volume which correspond to different degrees of overlap of the associated spheres. This would seem to be an elementary geometrical problem once the coordi- nates of the transfer points are known. Upon further reflection one finds however that a rigorous solution of the problem is far too complicated to be feasible.
One is therefore forced to use sampling procedures. The straightforward method is the random choice of a sufficient number of sampling points inside the associated volume. This method will not actually be used since a procedure exists which is far more efficient for straight particle tracks. It is nevertheless of interest to note that the selection of points in the associated volume need not be uniform, and that, in fact, a uniform selection would be difficult due to the generally complicated shape of the associated volume. However one can use the method that has been designated as sampling over individual tranfers [8]. This is a two-step method. First one selects randomly a transfer point, then one selects randomly a point within the associated sphere, i.e. within the sphere centered at this transfer point. The resulting point is used as sampling point at which the microdosimetric variable y is determined, and the procedure is repeated until a sufficient number of points has been sampled. The method is practicable; it may indeed be the method of choice in the case of electron tracks which, due to their curvature, are more complicated than the tracks of heavy charged particles. For heavy charged particles however one reduces the computa- tional work greatly if one samples the microdosimetric variables not on individual points but on straight lines which are parallel to the particle track. The procedure will be described in the following.

126 D. Chmelevsky and A. M. Kellerer
Sampling Procedure Applicable to Straight Particle Tracks
As pointed out in the preceding section it would be difficult to calculate analytically the fractions of the associated volume which correspond to different multiplicities of overlap, i.e. to the different values of the microdosimetric variable y. On the other hand, it is rather inefficient to use the simple alternative of determining the multipli- city of overlap, i.e. the value of y, at individual sampling points. There is however the possibility of an intermediate approach. Such an intermediate approach is to calcu- late the distribution of the microdosimetric variable in randomly selected linear sub- spaces, such as planes or straight lines, If planes were to be used, one would have to calculate the areas of overlap in a cluster of circles which result when the associated spheres are intersected by the plane. The problem is still too complicated for numeri- cal evaluation. For straight lines, on the other hand, the situation is acceptable; here one deals with the problem of determining distances of overlap of a cluster of inter- vals which result from the intersection of the straight line with the associated spheres. Accordingly the calculations are done by selecting randomly straight fines and by calculating the distribution of y on these sampling lines.
The sampling of the microdosimetric variable y on straight lines instead of indivi- dual points has the advantage of generating considerably more information per sampling operation. The method represents an efficient combination of the analytical and the Monte Carlo approach; it is particularly useful if one deals with simulated segments of heavy charged particle tracks. The reason is that these track segments are straight or approximately straight, and that one can therefore use sampling lines parallel to the track core; in this way one obtains a considerable intersection of each such line with the associated volume.
In each calculation one chooses successively a large number, N, of sampling lines. Typically the number will be 1000 or 2000. For each line one obtains a distribution, f~(y), (v = 1, 2 . . . N), of the values of lineal energy y. This is the distribution of values y for all the spheres of radius r which have their center on the v-th sampling line. The overall distribution of y for the track segment is then ob- tained by superposition of the N distributions f,(y). The following sections will deal with the selection of sampling lines, with the proper weight factors in the superposi- tion of the individual distributions, and with the calculation of these individual distri- butions f~@).
Selection of Sampling Lines
Each sampling line has a certain length of intersection with the associated volume. Let I, be this length of intersection for the v-th sampling fine. This is the proper statistical weight of the function f,(y) in its contribution to the overall distribution
f(y). If the selection probability of the v-th sampling line is not proportional to its
statistical weight, l v, then appropriate compensation factors, G, must be used in the superposition which leads to f(y):
N
f(Y) = ~ Gf,(Y). (2) vml

Computation of Microdosimetric Distributions 127
It has been pointed out earlier (see p. 209 of Ref. 8) that the compensation factor, c~, must be equal to the ratio of the statistical weight, i.e. l~, and the selection probability p,. In order to derive the proper factors e, one must therefore determine the probabilities, p~, which belong to the selection procedure which is used.
An efficient method to select sampling lines is closely connected to the sampl ing over individual transfers . In the procedure one first selects randomly a transfer point. Then one selects randomly a point in the associated sphere. A line through this point which is parallel to the track segment is then taken as the sampling line.
One can readily see that the selection probability, p~, of a sampling line is, in this case, proportional not to l~ but to the total length, L~, which is obtained if one sums the intersections of the line with the individual associated spheres separately. The length L~ is always equal or larger than Iv; it is in fact equal to l~ multiplied by the mean multiplicity of overlap on the intersection.
In order to obtain the proper statistical weights one must therefore average the functions f~(y) for the individual sampling lines according to the following formu- la:
N N Iv
f ( Y ) = ~ _l~ f , ( y ) / ~ - - . (3) v=l L, v=l L~
It will be seen that this expression reduces to a simple form in the actual numerical evaluation.
In practice the selection procedure for the sampling lines is slightly modified in order to reduce the Monte Carlo component of the approach. Typical track seg- ments which are used for the calculations consist of 1000 or 2000 transfer points which represent ionizations. In the sampling procedure these transfer points are not randomly selected but are selected consecutively, and one sampling line is estab- fished for each of the transfer points by choosing a point in the associated sphere belonging to the transfer point. This leads usually to sufficient accuracy. The formu- la for the selection of a sampling line which traverses the associated sphere of a transfer point is given in the appendix.
The next section deals with the calculation of the distributions f~(y) on the indi- vidual sampling lines.
Computa t ion o f the Dis t r ibu t ions
Consider a Cartesian coordinate system with the z-axis on the core of the track segment. The sampling line is parallel to the z-axis and can therefore be character- ized by its coordinates x 0 and Yo. The coordinates of the transfer point T~ (i = 1 . . . . K) are designated by x;, y~, and z t. For each transfer point which is at a distance less than r from the sampling line one can compute the interval where the sampling line intersects the associated sphere of that transfer point. The z-coordi- nates, z s and zt, of the starting point and the terminating point of the interval are obtained by the formula:
z s, z t = z i + Vr 2 - (xi - Xo) 2 - (y~ - y o ) 2_ (4)

128 D. Chmelevsky and A. M. Kellerer
S t a r t i n g p o i n t s sj ~__
I 1 I I I I II1 ii i i i I I
T e r m i n o t i n g p o i n t s tl =_
I II I I I I I il I I I II
P r o f i l e o f l i n e a l e n e r g y o n l i n e s e g m e n t
Fig. 1. Two-dimensional diagram to illustrate the computation of the functions f~(y) from track seg- ments of heavy particles. The upper part is a schematic diagram of a track segment with its associated volume. The heavy line segments are those parts of the sampling line wherey is not zero. The two lower parts of the figure illustrate the two steps in the computation as they are discussed in the text
For a given sampling line one calculates all the coordinates zs and z t of the starting and the terminating points. The situation is represented schematically in Figure 1. I f n is the number of intervals of intersection one obtains 2n points. After these points are computed they are ordered into one common array so that their z-coordinates are in increasing order. One thus obtains a new array z~, (i = 1, 2 . . . . 2n). Its components z~ are the z-coordinates of the 2n points. A second array, m~, (i = 1, 2 , . . . 2n), has the values m i = 1 or m~ --- - 1 depending on whether the i-th point is the starting point or the terminating point of an interval.
The multiplicity of overlap in the interval from z~ to z~ + 1 is equal to i
M, = Y mr. (5) j = l
This quantity corresponds to the function represented on the bot tom of Figure I. It is now easy to obtain that length, s~(M), on the sampling line which corre-
sponds to the multiplicity M of overlap. One merely has to sum the lengths of those segments for which M i = M. The normalized distribution of multiplicities on the line is obtained as
Mmzx
f ~ ( M ) = s ~ ( M ) / ~ s~(M') = s~(M)/lo. (6) M ' = I

Computation of Microdosimetric Distributions 129
The multiplicity M is proportional to the lineal energy y, and is used here since it is the quantity actually appearing in the computation. However the change to y [see Eq. (1)] is trivial, and one can therefore write the corresponding equation in terms of y:
f , ( v ) = sv(y)/ l ~ . (7)
Inserting this into Equation (3) one obtains a simple relation which is the basis of the numerical computations:
N
f ( Y ) "~ ~ . s , ( y ) / L v . (8) v=l
The term s.(y) is that length on the v-th sampling line which belongs to the value y of the lineal energy.
In order to avoid errors due to wrong values of y near the end of the track segments one disregards in the analysis those parts of the sampling lines which are within the length r of the endpoints of the segment. The resulting change in some of the formulae is elementary.
Numerical Results
As stated earlier, the computations use as input data track segments which are the result of Monte-Carlo simulation 2 [12, 13]. The present status of the method of generating simulated charged particle tracks is, at least partly, documented in the literature [ 12-14, 20]. The validity of the data and the remaining uncertainty due to incomplete knowledge of the differential cross sections for electronic collisions are not the topic of this article; the procedures described in the preceding sections will remain valid regardless of future changes in the input data.
Even in the presence of systematic uncertainties a survey of numerical data will be useful to the radiobiologist. The results will illustrate correctly the characteristic dependence of the microdosimetric distributions on site diameters and stopping powers.
The simulated tracks which have been utilized are short segments containing a minimum of 1000 ionizations. This corresponds to a length of about 0.7 o,m for 500 keV protons and about 12 vm for 20 MeV protons. Only sites with radius up to 100 nm are considered and the change of LET of a particle traversing such sites is insignificant. The LET is therefore taken to be constant on all track segments. Due to statistical fluctuations the track segments do not correspond exactly to the un- derlying LET values. All track segments have, however, been adjusted to the LET values for water [5].
Adjustment of the LET for a given track segment is a relatively simple opera- tion. One merely rearranges the individual deltas along the z-axis; the term del ta is used to designate, in the present context, individual ionizations, groups of ioniza-
2 A more complete compilation of numerical results is to be found in [1]. Some results for considera- bly larger sites have been obtained in an earlier study of Wilson [21] which is also based on simulated particle tracks

130 D. Chmelevsky and A. M. Kellerer
I
~ . ~ PROTONS D(y) -~,~"~"~ ~.~ 0.5 MeV
.6 " ~ ' ~ " ~ o LET:43.8 keV/~m
",,~ '- 'o"- . . \
0 t i I
0 20 6'0 100 Y (keY/lain)
Fig. 2. Sum distribution, D(y), of absorbed dose in lineal energy for protons of 0.5 MeV in spheres of diameter 5, 10 and 100 nm. The broken line represents the function which corresponds to the approxi- mation in terms of the LET-concept
tions, or delta rays resulting from one electronic collision of the primary particle. The procedure is of practical importance not only because it permits minor adjust- ments of LET. It also makes it possible to transform a simulated proton track into the track of a heavier ion of the same velocity. Results for heavier ions are however not the topic of the present article.
The results are subject to two types of statistical uncertainty. The first is due to the fact that each track contains only a limited number of deltas. This error is most significant for the 20 MeV protons where delta rays up to about 40 keV can be generated, but occur with only small frequency. It has however been found that occurrence or non-occurrence of such high energy delta rays is of only moderate influence on the results. The reason is that the distributions o fy produced by the fast protons and by relatively fast electrons are similar for the small regions which are here considered.
The second error is due to the use of only a limited number of sampling lines. This error is small and can be quantitatively assessed by comparing the mean value -VD of the explicit distributionf(y) with the value YD which is calculated directly from the simulated track according to a formula derived in an earlier article [9]. The difference was in all cases less than 1%. This error is much smaller than the sys- tematic uncertainty in the simulated tracks. A high precision is nevertheless desirable in order to make results for different site diameters comparable.
Figures 2 - 4 represent the dose distribution, D(y), of the lineal energy for proton energies of 0.5, 5, and 20 MeV. In each figure the distributions are given for sites of diameter 5, 10 and 100 nm. The dose distribution Dry) is here defined as (see also [8]).
D(y) = f d(y') dy' =--1 f-y, y(y,) dy'. (9) yF y
Y
D(y) is equal to the fraction of energy which is delivered in events of lineal energy exceeding y. One track segment for each of the proton energies is used in the compu- tations.
Computation of Microdosimetric Distributions 131
D(y) ~ ,
.6
.2
0
\ LET= 8.4 keV/pm
I f I I
0 20 60 100 y (keY/pro)
Fig. 3. Sum distribution, Dry), of absorbed dose in lineal energy for protons of 5 MeV in spheres of diameter 5, 10 and 100 nm. The broken fine represents the function which corresponds to the approxi- mation in terms of the LET-concept
1 \ \ PROTONS D(y) \ \ 20
o , 20 60 100
y (keV/~m) Fig. 4. Sum distribution, DO;), of absorbed dose in lineal energy for protons of 20 MeV in spheres of diameter 5, 10, and 100 rim. The broken line represents the function which corresponds to the approxi- mation in terms of the LET-concept
The distributions should be drawn as step functions, since according to Equat ion (1) the quant i ty linear energy is linked to the number, n, of ionizations and is there- fore a discrete variable. In the interest of clearer representat ion the functions have however been approximated by continuous lines. Similar functions would result if, in the computat ions , actual energy transfers and not the average value W were as- signed to the transfer points.
The broken lines in Figures 2--4 indicate the distributions which would result f rom the simple LET concept, i.e. f rom the assumption, that the particle t racks are straight lines with continuous energy transfer and with no radial extension. One can readily see that the LET concept is only a crude approximat ion even for the protons of lowest energy and for the largest sites which are here considered. Fo r the protons

132 D. Chmelevsky and A. M. Kellerer
I
Dry)
.6
.2
0
z (rod) 107 2.107
I I I I
P R O T O N S
I I I I
20 60 100
y (keWum) Fig. 5. Sum distribution, D(y), of absorbed dose in lineal energy in a sphere of 10 nm diameter for protons of 0.5, 5, and 20 MeV. The broken line corresponds to electrons of minimum stopping power
z (rad) 0 10 s 2-10 5
Dly) i/ \ ""~# .6 i / ~ " ~ d=lOOnm
',, \
0 I I I I
0 20 60 100
y (keV/tJm) Fig. 6. Sum distribution, D(y), of absorbed dose in lineal energy in a sphere of 100 nm diameter for protons of 0.5, 5, and 20 MeV. The broken line corresponds to electrons of minimum stopping power
of 20 MeV, and 5 MeV one realizes that energy concentrations in small sites are much larger than expected on the basis even of the unrestricted stopping power. These energy concentrations are mainly due to the occurrence of individual delta
rays in the site. The dependence of the distributions on the stopping power of the proton is
brought out more clearly in Figures 5 and 6. The distributions shown in Figures 2 - 4 have here been rearranged into two groups belonging to the site diameters 10 nm and 100 nm. It is of particular interest to observe that a threefold change of LET
Computation of Microdosimetric Distributions 133
IO0
YF
keV/p.m
I0
i i I i i i i i
protons 0.5 MeV -
20MeV
I I I I I I I I
I0 I00 I000
s i te diameter {nm)
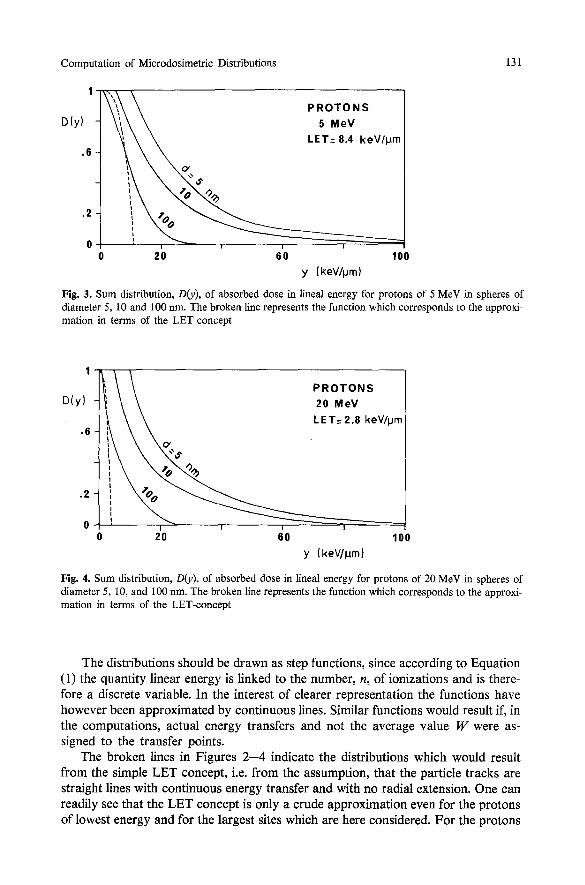
Fig. 7. Frequency mean, ~ , as a function of site diameters for protons of energy 0.5, 1, 5, and 20 MeV. The values for site diameters exceeding 100 nm are extrapolated
Table 1. Values of 23D in keV/~m and of g in rad (lower numbers, in brackets) for protons of different energies and for spherical sites of different diameters. The stopping power is for water [5]; its values are indicated in Figures 2--4
Site diameter Proton energy (MeV) (nm)
0.5 5 20
5 50 26.7 23.8 (40.7 x 10⁷) (2.17 × 10⁷) (1.94 x 10⁷)
10 50 20.3 17.4 (1.02 x 10⁷) (4.13 x 10⁶) (3.54 x l0 s)
100 52 10.3 7 (1.06 x 10 ~) (2.10 x 10⁴) (1.43 x 10⁴)
from the 5 MeV proton to the 20 MeV proton leads to only a moderate shift in the microdosimetric distributions.
The broken lines in Figures 5 and 6 are approximations of the distributions for fast electrons. Since no tracks of fast electrons were available, these have been simulated by transforming the track of the 20 MeV proton to a stopping power of 0.2 keV/~m. Inspite of the change of stopping power by a factor of 14 the resulting distribution is, in the case of the smaller site, almost identical to that for the fast protons.
In Figures 5 and 6 the quantity specific energy, z, is plotted on the upper ordi- nate. This is useful as it illustrates the extremely large values of the specific energy produced in small sites by particles even of low stopping power.

134 D. Chmelevsky and A. M. Kellerer
Finally the mean values, YF, corresponding to the distributions are given in Figure 7.
On the basis of the ideas of Rossi and coworkers [15-17, 19] microdosimetry has in recent years developed into a separate field of growing importance. Now, as the study of small sites finds increasing attention [18], the connections to earlier work by Lea [ 11 ] become more apparent. A certain comparison is given in Figure 7. The dotted lines in this figure are obtained from values of the associated volumes given by Lea. These data are close to the present results.
The important mean values YD are given only in tabular form for the distribu- tions D(y) in Figures 2--6. A detailed discussion of the quantity ~ and the socalled distance distribution for protons and heavier ions will be found in a subsequent article.
Acknowledgements. Part of this study has been performed at the Radiological Research Labora- tory of Columbia University, New York. We are grateful to Prof. H. H. Rossi whose contribution to the work has been essential. We are also indebted to Dr. N. Parmentier and M. M. Dousset for their active interest, and to Dr. H. Paretzke for providing the simulated particle tracks.
Appendix
Random Selection of Coordinates
Selection o f a Variable Which Follows a Specified Distribution
Algorithms for the generation of pseudo-random numbers generally produce a ran- dom variable, u, which is uniformly distributed in the interval [0, 1]. The problem then arises how to obtain a suitable function x(u) which follows a specified non- uniform distribution. An answer can best be found if one considers the general case.
If G(u) is the sum distribution of u and F(x) is the sum distribution of x, and if x is a monotoneously increasing function of u, the following relation holds:
G(u) = P(u_ <. u) -= P(x(u) <. x(u)) = P(x_ ~ x) = F(x) . (A.1)
Therefore:
x = F-I(G(u)) . (A.2)
If u is distributed uniformly in [0, 1] one has:
G(u) = u and x = F-l(u). (A.3)
This is the general rule which is used to obtain a random variable, x, which follows a specified sum distribution F(x).
Application to the Selection o f Sampling Lines
The definition of a sampling line requires the selection of a point P in the associated sphere of a transfer point. The sampling line is then the line parallel to the z-axis through P.

Computation of Microdosimetric Distributions 135
The selection of a point in a sphere of radius r, whose center is taken as the origin amounts to the random selection of three independent polar coordinates ~, 0, ¢ with the following densities:
pl(O) = 1/2er ; P2(O) = ( s i n e ) / 2 ; P3(Q) = 3~ 2/r3" (A.4)
In'the present appfication it is hoWever sufficient to select only the two coordinates of the projection of P into a plane orthogonal to the z-axis. If the coordinates, (s, 0) are again in a polar system one has the following densities
pl(O) = 1/27r
p2(s) = 3s ~ / ~ - s21r 3 (A.5)
and the corresponding sum distributions:
Pl(0) = 0/27r
P2(s) = 1 -- (1-- 82//'2) 3/2 (A.6)
accordingly 0 and s are obtained in the following way from a random variable, u, which is uniformly distributed:
0 = 2zru
s = r l / 1 - - u 2/3. (A.7)
References
1. Chmelevsky, D.: Distributions et moyennes des grandeurs microdosim&riques /t l'6chelle du nanom~tre. - M&hodes de Calcul et r+sultats. Rapport CEA-R-4785, Service de Documentation- CEN-Saclay, B.P. no. 2, 91190 Gif sur Yvette, France 1976
2. Fano, U.: Platzman's analysis of the delivery of radiation energy to molecules. Radiat. Res. 64, 217-232 (1975)
3. Glass, W. A., Toburen, L. H., Wilson, W. E., Roesch, W. D.: Energy ejected in fast proton collisions. In: Microdosimetry, Proc. 3rd Symposium on Microdosimetry, pp. 71-88 (Ebert, H. G., Ed.). Euratom, 4810 d-f-e, Brussels 1971
4. Hodges, D. C., Delatield, H. J., Dennis, J. A.: Preliminary measurements using a low pressure cloud chamber of the ranges of low energy electrons. In: Microdosimetry, Proc. 3rd Symposium on Microdosimetry, pp. 455--467 (Ebert, H. G., Ed.). Euratom, 4810 d-f-e, Brussels 1971
5. ICRU: Linear Energy Transfer, Report 16. Washington, D.C.: International Commission of Ra- diation Units and Measurements 1970
6. Inokuti, M.: Inelastic collisions of fast charged particles with atoms and molecules. -- The Bethe theory revisited. Rev. Mod. Phys. 43, 297-347 (1971)
7. Kellerer, A. M., Chmelevsky, D.: Concepts of microdosimetry. I. Quantities. Rad. and Environm. Biophys. 12, 61-69 (1975)
8. Kellerer, A. M., Chmelevsky, D.: Concepts of microdosimetry. II. Probability distributions of the microdosimetrie variables. Rad. and Environm. Biophys. 12, 1-12 (1975)
9. Kellerer, A. M., Chmelevsky, D.: Concepts of microdosimetry. III. Mean values of the microdo- simetric distributions. Rad. and Environm. Biophys. 12, 321-335 (1975)
10. Kim, Y. K.: Energy distribution of secondary electrons. I. Consistency of experimental data. Radiat. Res. 61, 21--35 (1975)
11. Lea, D. E.: Actions of radiation of living cells. Cambridge: Cambridge University Press 1946

136 D. Chmelevsky and A. M. Kellerer
12. Paretzke, H. G.: Comparison of track structure calculations with experimental results. In: Micro- dosimetry. Proe. 4th Symposium on Microdosimetry, pp. 141-164 (Ebert, H. G., Ed.). Euratom, 5122 d-e-f, Brussels 1974
13. Paretzke, H. G., Leuthold, G., Burger, G., Jacobi, W.: Approaches to physical track structure calculations. In: Microdosimetry. Proc. 4th Symposium on Microdosimetry, pp. 123-138 (Ebert, H. G., Ed.). Euratom, 5122 d-e-f, Brussels 1974
14. Patau, J. P., Malbert, M., Terrissol, M., Commanay, L.: Etudes dosim+triques dans des cavit~s sphtriques situtes en milieu semi-infini, irradi6 par des 61ectrons de 2 MeV. In: Microdosimetry, Proc. 4th Symposium on Microdosimetry, pp. 755-775 (Ebert, H. G., Ed.). Euratom, 5122 d-e-f, Brussels 1974
15. Rossi, H. H.: Specification of radiation quality. Radiat. Res. 10, 522--531 (1959) 16. Rossi, H. H.: Distribution of radiation energy in the cell. Radiology 78, 530--535 (1962) 17. Rossi, H. H.: Energy distribution in the absorption of radiation. In: Advances in biological and
medical physics, Vol. 11, pp. 27-85. London: Academic Press 1967 18. Rossi, H. H.: Biophysical implications of radiation quality. Radiat. Res. 59, 994-997 (1974) 19. Rossi, H. H., Biavati, M. H., Gross, W.: Local energy density in irradiated tissues. I. Radiobiologi-
cal significance. Radiat. Res. 15, 431-439 (1961) 20. Terrissol, M., Patau, J. P.: Simulation du transport d'61ectrons d'tnergie inftrieure/t un keV par
une m~thode de Monte-Carlo. In: Microdosimetry, Proc. 4th Symposium on Microdosimetry, pp. 717-730 (Ebert, H. G., Ed.). Euratom, 5122 d-e-f, Brussels 1973
21. Wilson, W. E.: Proton energy deposition distributions for small sites. Radiat. Res. 59, 117 abstract (1974)
Received March 21, 1977


![Computation of Molecular Weight Distributions for Free ... · The Staudinger inde[77xis] connecte d with the viscosity average molecular weight Mv by the Mark-Houwink-Equation [TI]](https://img.pdfslide.net/doc/110x75/60b929f823651c22a5281531/computation-of-molecular-weight-distributions-for-free-the-staudinger-inde77xis.jpg)