Embed Size (px)
Citation preview
Computational analysis of Computational analysis of genome-wide expression datagenome-wide expression data
Paul Pavlidis
Columbia Genome Center
Lecture overviewLecture overview
1. Microarray technology and applications
2. How the data is collected and what you get.
3. “High level” analysis methods: applied to the study of human sarcoma.
1. Supervised and unsupervised learning.
2. Feature selection.
4. Method for applying biological prior knowledge.
5. (If there is time) Further applications of the technology.
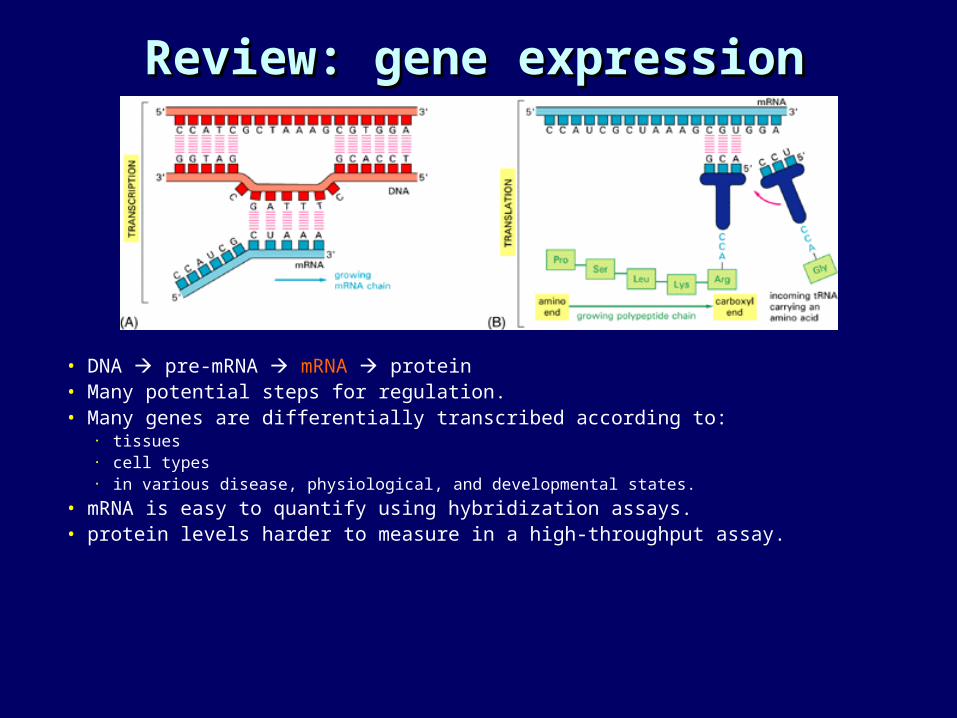
Review: gene expressionReview: gene expression
• DNA pre-mRNA mRNA protein• Many potential steps for regulation.• Many genes are differentially transcribed according to:
• tissues• cell types• in various disease, physiological, and developmental states.
• mRNA is easy to quantify using hybridization assays.• protein levels harder to measure in a high-throughput assay.
MicroarraysMicroarrays• Thousands of small (20-200) spots of DNA
probes on a glass slide.• Use to measure gene expression (RNA) levels of
10,000-20,000+ genes in parallel.• Old way: Northern blots etc. let you measure one gene
at a time.
• Generally give only relative expression information.
• Methods exist for getting absolute measurements (SAGE, calibrated arrays)
• Yields a type of snapshot of the molecular state of the sample.

Applications for microarraysApplications for microarrays• Diagnosis: molecular ‘portraits’ of disease
• Preventative medicine - early detection.• Personalized treatment.• Refined diagnosis and prognosis.
• Disease/phenotype characterization: What genes are affected by condition X? (esp. complex traits)
• Gene expression regulation network elucidation: what happens to the expression of gene Y if you knock out gene X?
• Mutation and polymorphism detection• Genome analysis: gene finding/structure determination• Sets a model for high-throughput technologies:
• Protein arrays• Post-translational modification assay arrays• Protein interaction arrays
Why microarrays are of Why microarrays are of interest to computational interest to computational
biologistsbiologists• Can generate a lot of data very quickly
(compared to what biologists usually deal with). • Many studies include 50 samples or more =
~1,000,000 data points.
• Messier than sequence data (in interesting ways)• Continuous rather than discrete• Many more sources of variability, including biological.
• Can ask questions you can’t ask of sequence data.
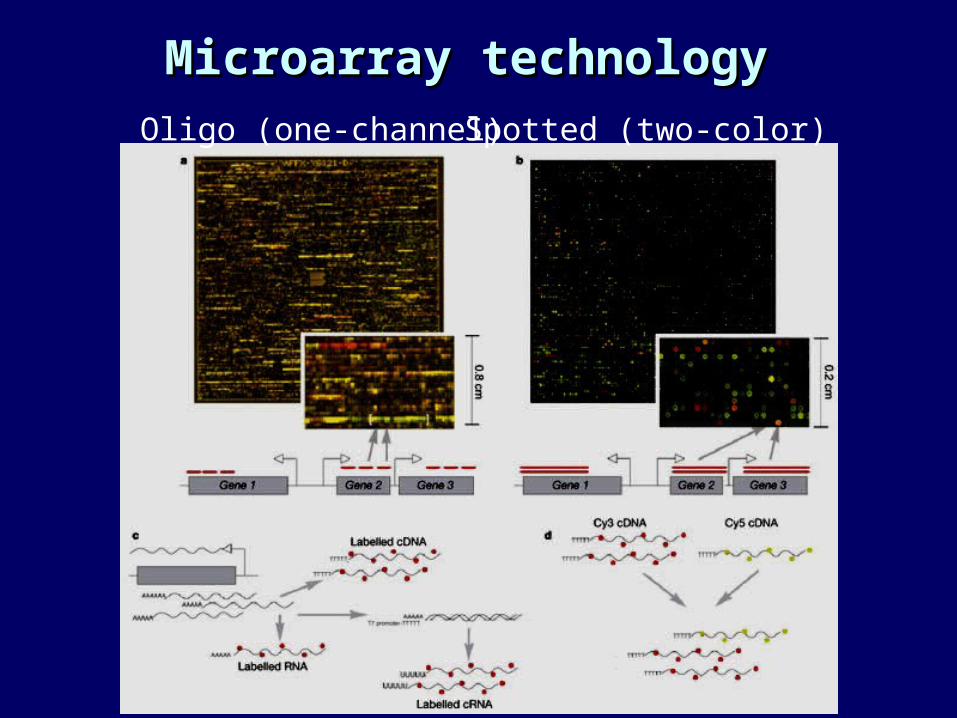
Microarray technologyMicroarray technologyOligo (one-channel) Spotted (two-color)
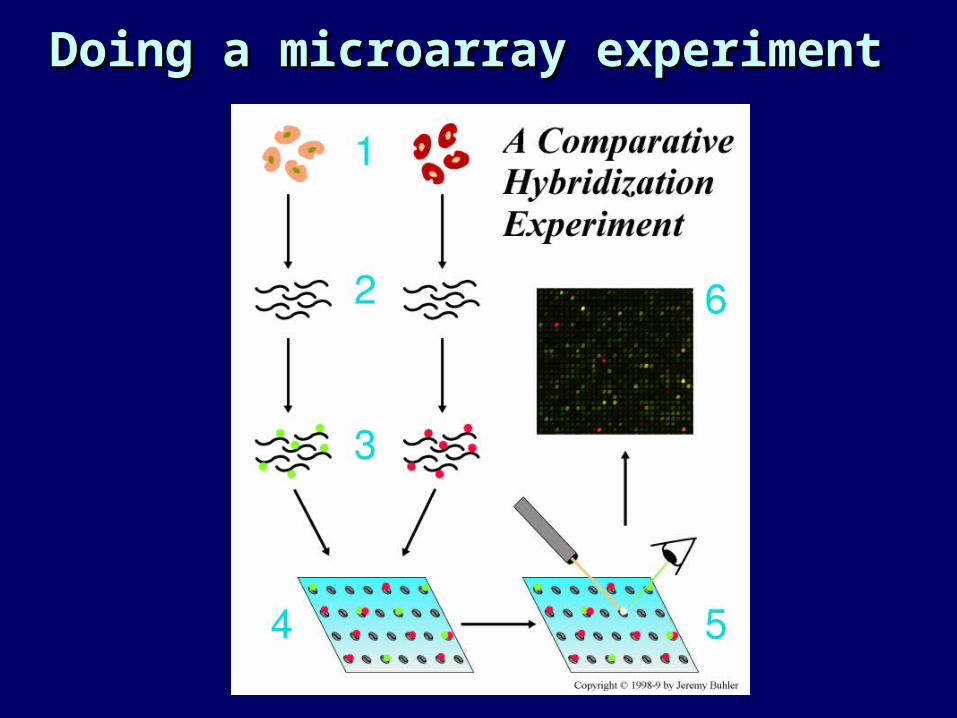
Doing a microarray experimentDoing a microarray experiment

Common experimental designsCommon experimental designs
• Compare an experimental condition to a control condition (hopefully with replication).
• mutant vs. wild type.• diseased vs. normal.
• Assemble a compendium of sample/conditions or time points.
• Stages of the cell cycle.• Different tumor samples.
Computation and microarrays Computation and microarrays II: : Data acquisition and Data acquisition and
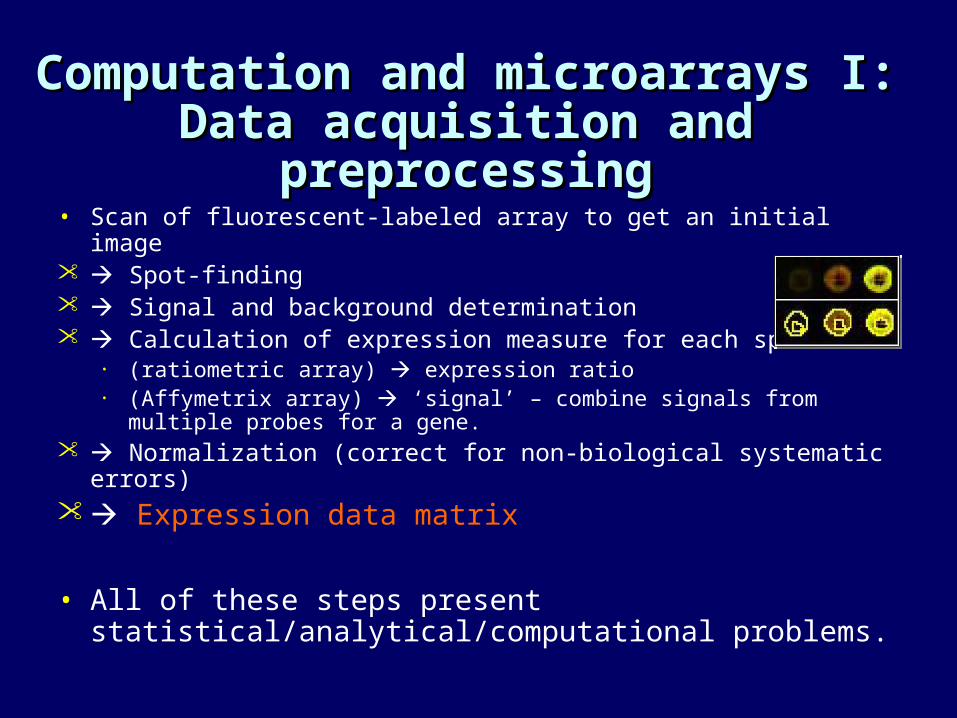
preprocessingpreprocessing• Scan of fluorescent-labeled array to get an initial image Spot-finding Signal and background determination Calculation of expression measure for each spot
• (ratiometric array) expression ratio• (Affymetrix array) ‘signal’ – combine signals from multiple probes for a
gene. Normalization (correct for non-biological systematic errors) Expression data matrix
• All of these steps present statistical/analytical/computational problems.

Values for genes on one arrayValues for genes on one array
• Two color arrays: ratio of “red” to “green” intensities. Usually expressed as log(R/G).
• One-color arrays (Affymetrix): “signal” – just a relative measure of expression of the gene.
• Either way we have a number that represents the expression level of the gene.
• To keep things simple, for two-color arrays a common reference sample R is often used for all arrays.
A/R B/R C/R D/R E/R etc.• Equivalent for one color arrays: A B C D E

False color images of spotted False color images of spotted arrayarray
• Overlay of two scans of the slide• Compares the two samples• Green = less relative expression• Red = more relative expresion• Yellow = equal expression• Dimmer colors = lower expression levels.
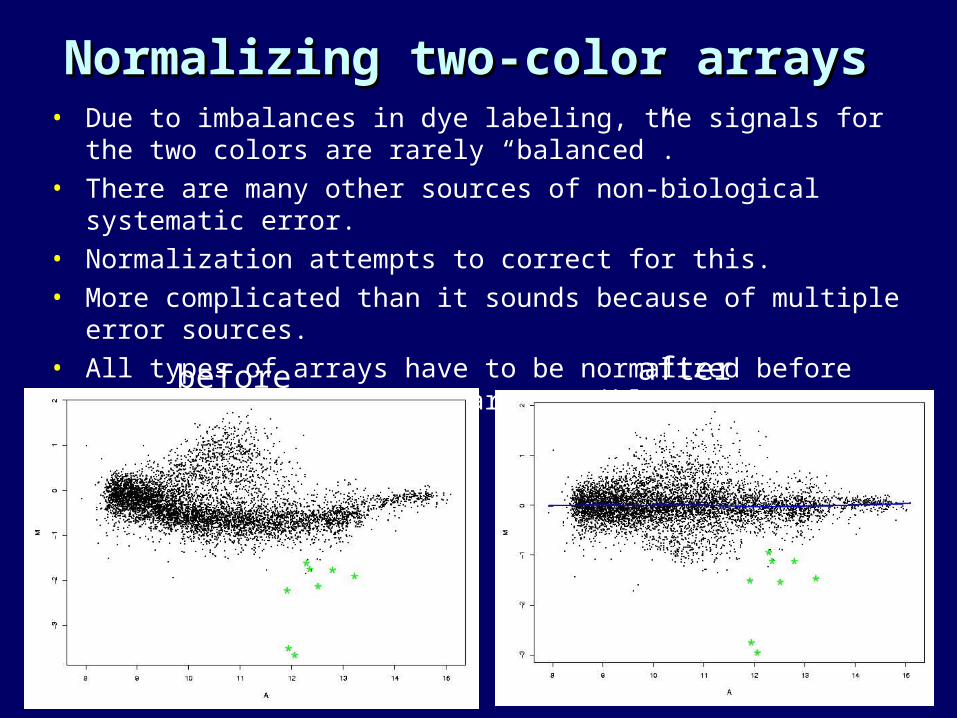
Normalizing two-color arraysNormalizing two-color arrays• Due to imbalances in dye labeling, the signals for the two colors are
rarely “balanced”.• There are many other sources of non-biological systematic error.• Normalization attempts to correct for this.• More complicated than it sounds because of multiple error sources.• All types of arrays have to be normalized before array-array
comparisons are possible
before after
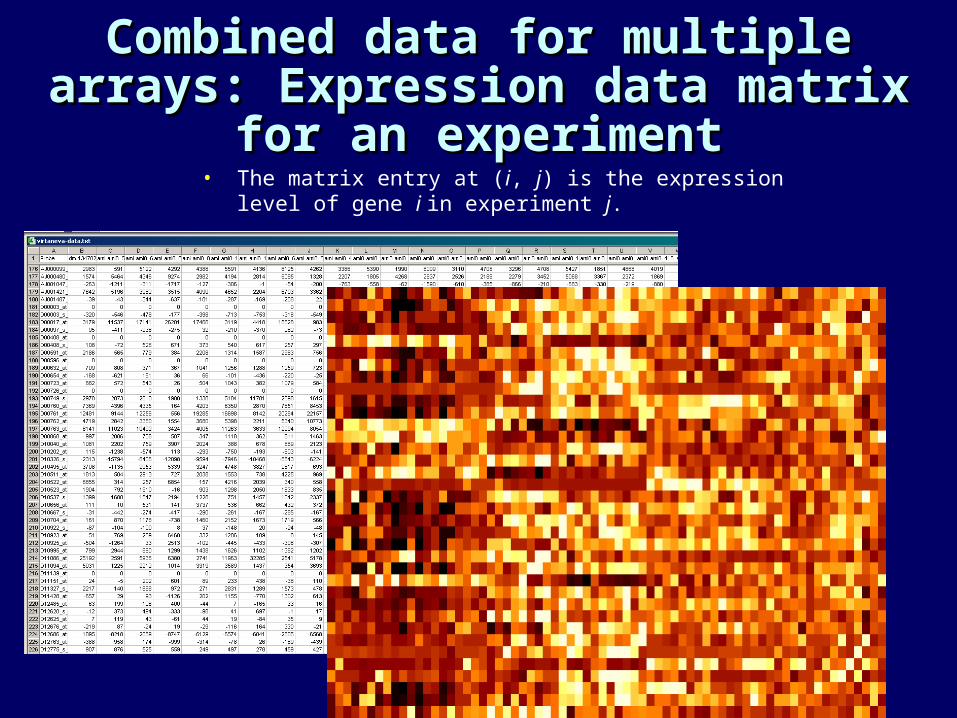
Combined data for multiple Combined data for multiple arrays: Expression data matrix arrays: Expression data matrix
for an experimentfor an experiment• The matrix entry at (i, j) is the expression level of gene i in
experiment j.
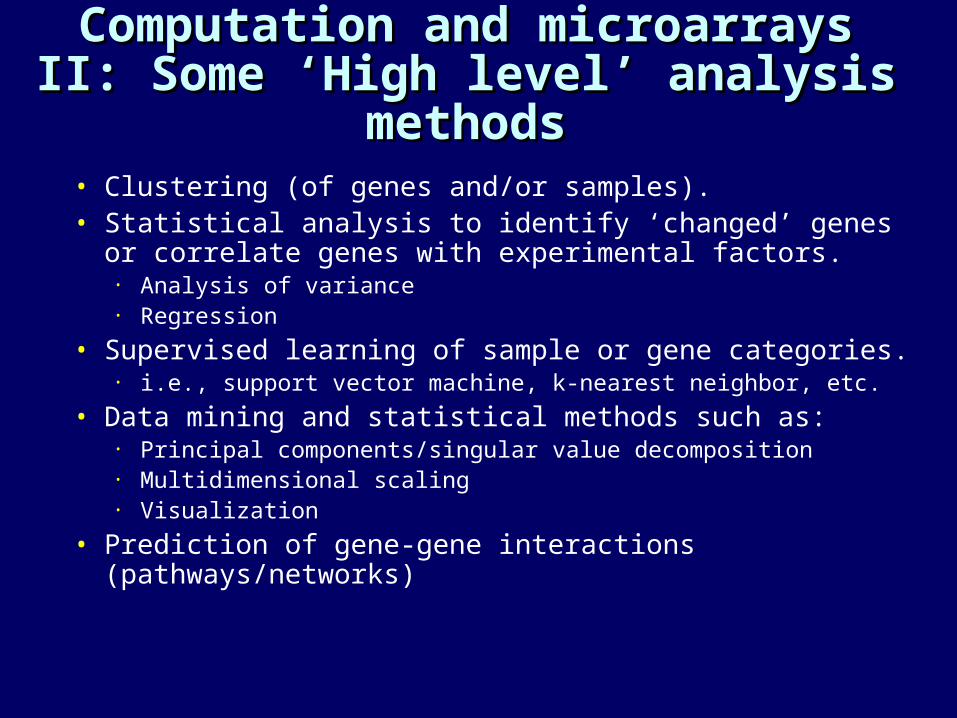
Computation and microarrays Computation and microarrays II: II: Some ‘High level’ analysis Some ‘High level’ analysis
methodsmethods• Clustering (of genes and/or samples).• Statistical analysis to identify ‘changed’ genes or correlate
genes with experimental factors.• Analysis of variance• Regression
• Supervised learning of sample or gene categories.• i.e., support vector machine, k-nearest neighbor, etc.
• Data mining and statistical methods such as:• Principal components/singular value decomposition• Multidimensional scaling• Visualization
• Prediction of gene-gene interactions (pathways/networks)

An extended example: An extended example: Microarray Analysis of Human Microarray Analysis of Human
SarcomaSarcoma
Collaboration with
Memorial Sloan Kettering Cancer Center
What is sarcoma?What is sarcoma?
• Sarcoma = “fleshy growth”• Tumors of connective tissues, nerves, fat,
muscle, etc. i.e. mesoderm, neuroectoderm.• 1% of new cancer cases.• Many cases (30%?) are referred to MSKCC• Other major types of cancer:
• carcinoma, which come from epithelial cell lineages.• leukemia and lymphoma (blood and lymph derived)

Nine types of sarcoma studied - Nine types of sarcoma studied - as delinieated by histology and (*) molecular markersas delinieated by histology and (*) molecular markers
• liposarcoma (lipo) - fat• dedifferentiated liposarcoma (lipodediff)• pleomorphic liposarcoma (lipopleo)• round cell liposarcoma (roundcell)*• fibrosarcoma (fibro) - fibroblast• leiomyosarcoma (leio) - smooth muscle• malignant fibrous histiocytoma (MFH) - pleomorphic• synovial sarcoma (synovial) - joint-cell like*• gastrointestinal stromal tumor (GIST) * - c-kit: Gleevec• clear cell sarcoma (clearcell) - pigmented *
Are these types distinguishable at the level of RNA expression?

Stripped-down version of the Stripped-down version of the approachapproach
• Affymetrix genechips (12500 genes/ESTs) run on RNA from each sample.
• Final data set has 52 samples.• Clustering - Which types of tumor cluster
together well?• Feature selection + SVM - Which types are
learnable? Which samples are misclassified? What genes distinguish each class?

ClusteringClustering
• Unsupervised learning• Goal: identify groupings
in the data.• Based on some notion
of similarity of the profiles being clustered
• Euclidean distance• Correlation• Manhattan distance• many others…
• Algorithms:• Hierarchical• k-means• self-organizing maps

Clustering genesClustering genes
• Hypothesis: genes with related functions will cluster together (are “coexpressed”).
• True for some classes of genes, but not generally true.
• “Function” is too broad a term, and we don’t always expect genes with related functions to be coexpressed.
• Seems to apply most often to ‘housekeeping’ functions.
• Probably the most overapplied method in microarray analysis.
• Genes which are coexpressed are potentially coregulated, but not generally.
Clustering samplesClustering samples
• When the samples are ‘pseudoreplicates’ (i.e, samples from individual patients), clustering may reveal known or unknown classes.
• In the context of the sarcoma data, we can see:• If histologically defined classes cluster on the basis of
gene expression.• Which classes are most similar to other classes.• If there are previously unrecognized subtypes within a
histologically defined class.
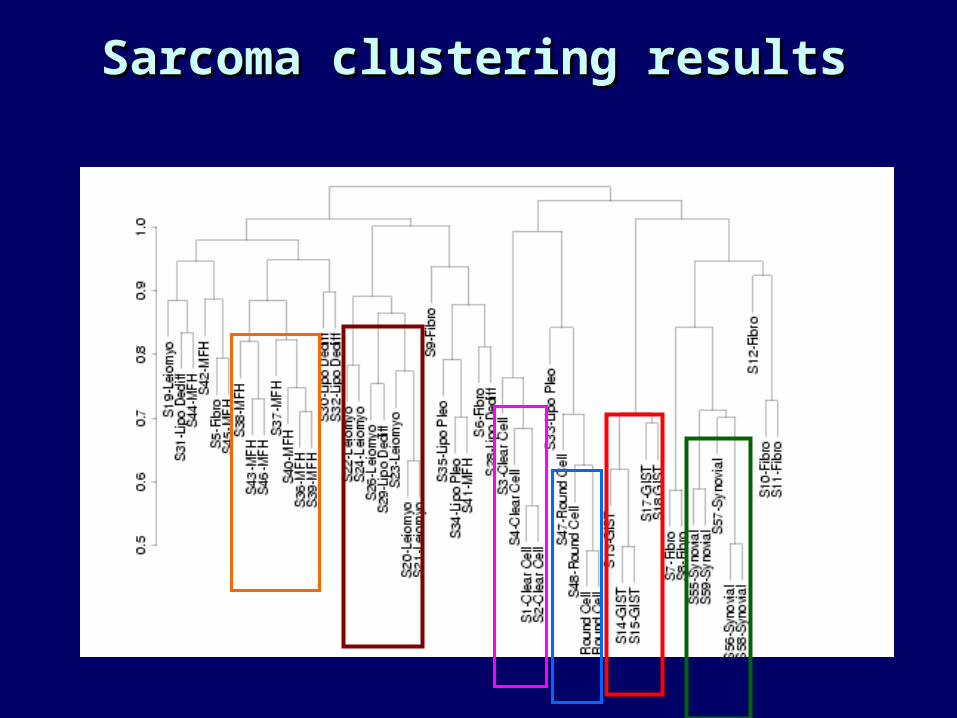
Sarcoma clustering resultsSarcoma clustering results
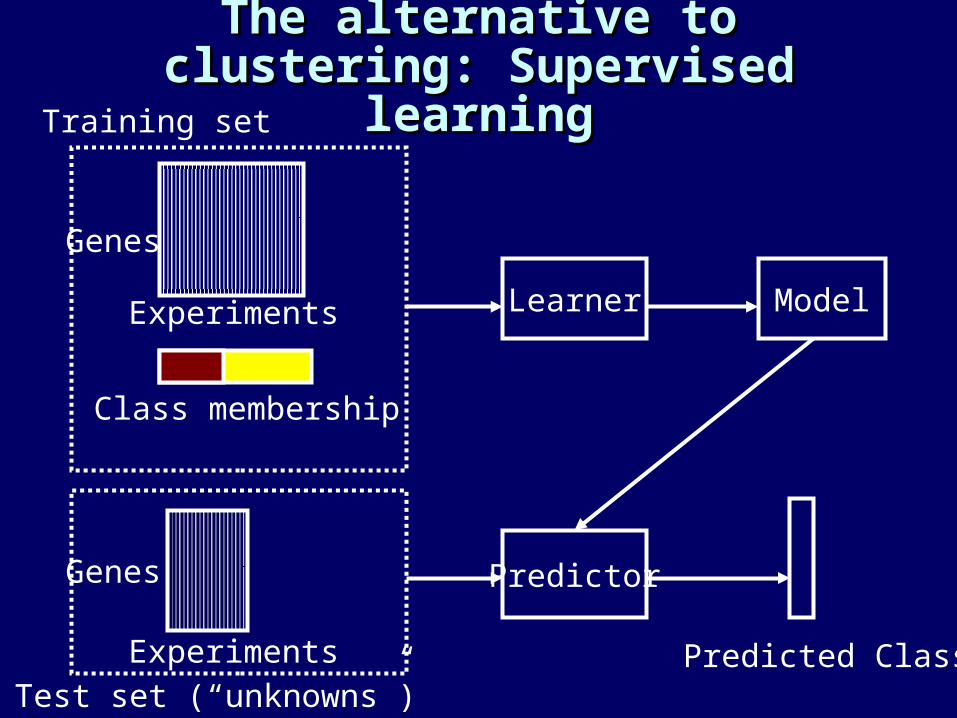
The alternative to clustering: The alternative to clustering: Supervised learningSupervised learning
Predictor
Learner Model
Predicted Class
Class membership
Experiments
Experiments
Genes
Genes
Training set
Test set (“unknowns”)
With supervised learning, can With supervised learning, can ask:ask:
• Which classes are recognizable as such (“learnable”).
• When classification errors are made, are they telling us something about the label on the test sample?
• We can identify ‘mislabeled samples’ this way.
• Potentially allow us to make diagnoses and predictions for new samples.
• Obviously we need to have classes defined first.
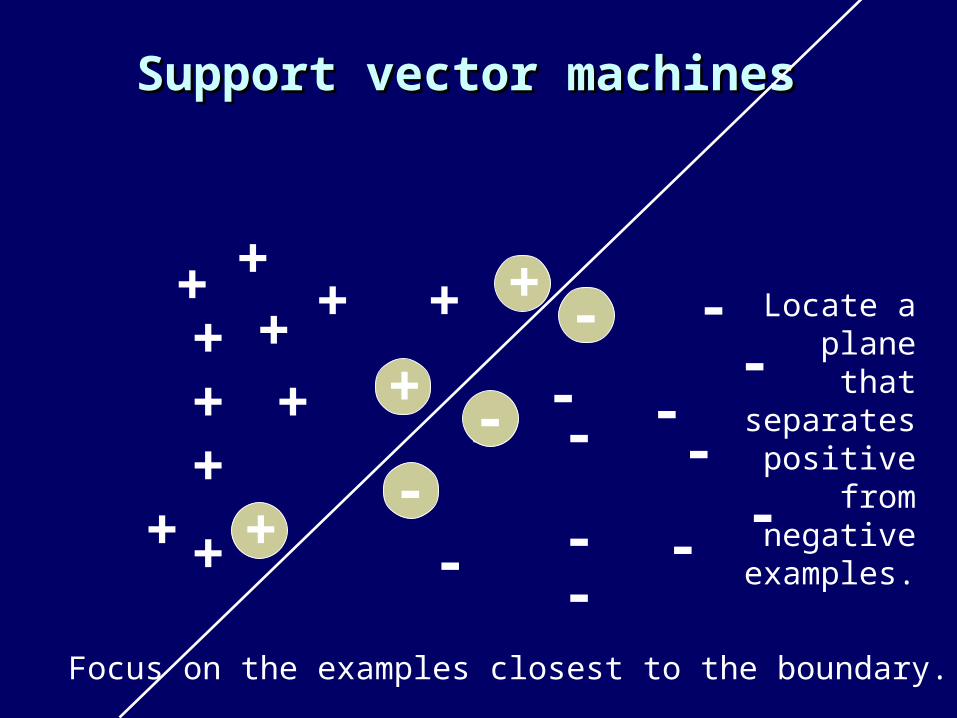
Support vector machinesSupport vector machines
++
+
+ +
+
+
+ +
+ +
+-- -
-
-
-
-
--
-
--
-+
+
-
--
Locate a plane that separates
positive from negative
examples.
Focus on the examples closest to the boundary.
Feature selectionFeature selection
• For tissue classification, each gene is a feature.• Most genes are not informative about the classes we are
learning – they aren’t relevant.• Many genes are not evenexpressed in the tissue assayed.• Including too many ‘noisy’ features degrades learning
performance.• It is common to attempt to identify features that will be most
useful for learning.
• Those features (genes) are also the ones which are most associated with the particular tumor type.
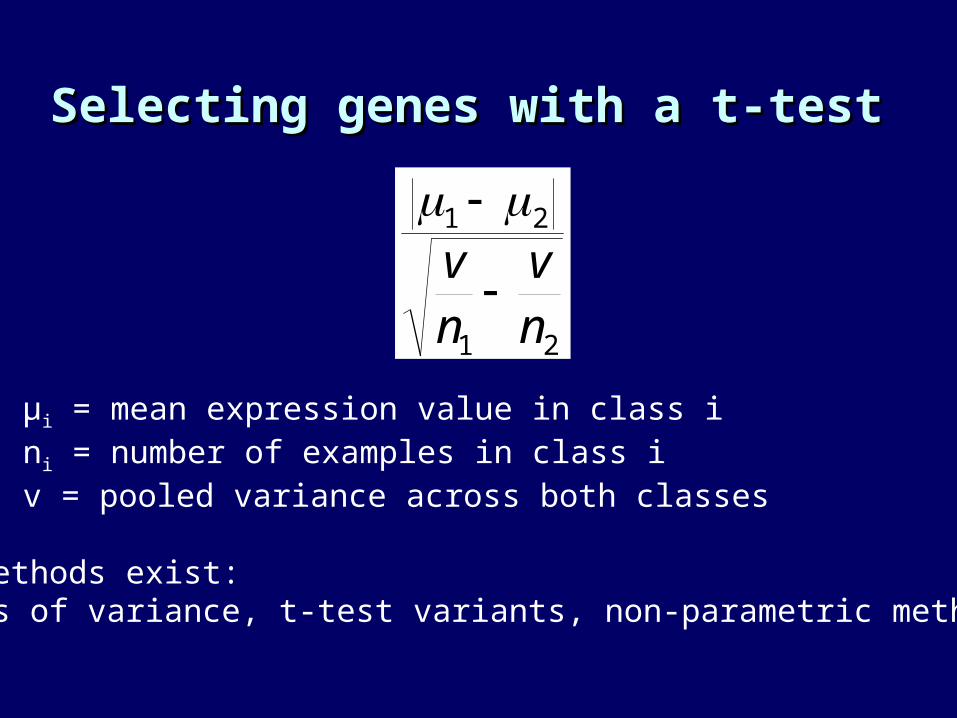
Selecting genes with a t-testSelecting genes with a t-test
21
21
nv
nv
μi = mean expression value in class ini = number of examples in class iv = pooled variance across both classes
Other methods exist:Analysis of variance, t-test variants, non-parametric methods, etc.
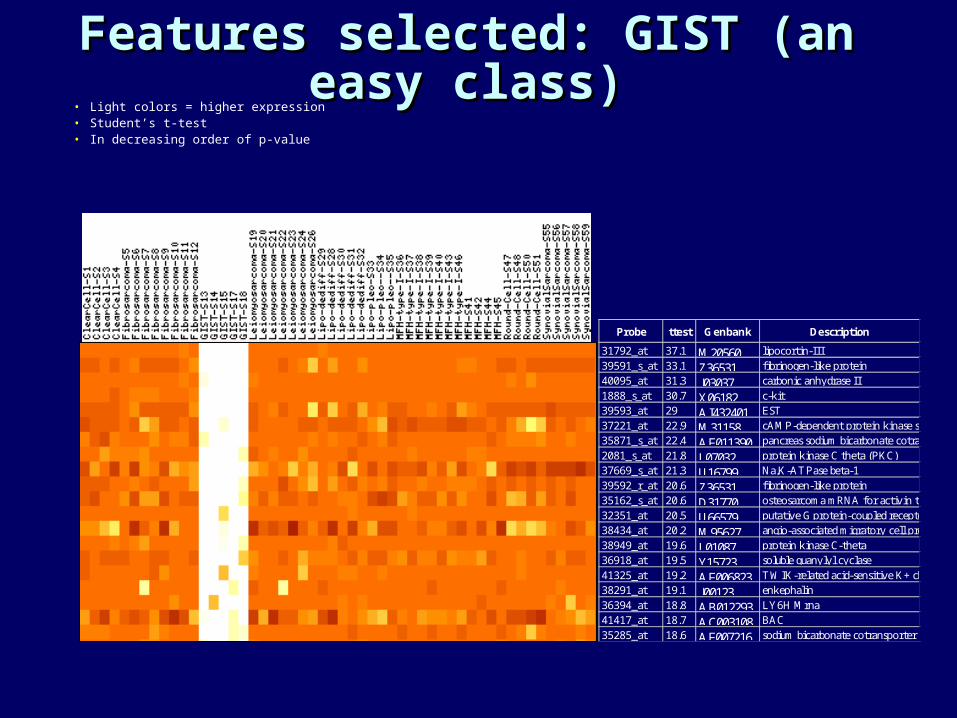
Features selected: GIST (an Features selected: GIST (an easy class)easy class)
• Light colors = higher expression• Student’s t-test• In decreasing order of p-value
Probe ttest Genbank Description
31792_at 37.1 M20560 lipocortin-III39591_s_at 33.1 Z36531 fibrinogen-like protein 40095_at 31.3 J03037 carbonic anhydrase II 1888_s_at 30.7 X06182 c-kit39593_at 29 AI432401 EST37221_at 22.9 M31158 cAMP-dependent protein kinase subunit RII-beta 35871_s_at 22.4 AF011390 pancreas sodium bicarbonate cotransporter 2081_s_at 21.8 L07032 protein kinase C theta (PKC) 37669_s_at 21.3 U16799 Na,K-ATPase beta-139592_r_at 20.6 Z36531 fibrinogen-like protein 35162_s_at 20.6 D31770 osteosarcoma mRNA for activin typeII A receptor32351_at 20.5 U66579 putative G protein-coupled receptor (GPR20) 38434_at 20.2 M95627 angio-associated migratory cell protein (AAMP) 38949_at 19.6 L01087 protein kinase C-theta 36918_at 19.5 Y15723 soluble guanylyl cyclase41325_at 19.2 AF006823 TWIK-related acid-sensitive K+ channel (TASK)38291_at 19.1 J00123 enkephalin36394_at 18.8 AB012293 LY6H Mrna41417_at 18.7 AC003108 BAC35285_at 18.6 AF007216 sodium bicarbonate cotransporter (HNBC1)
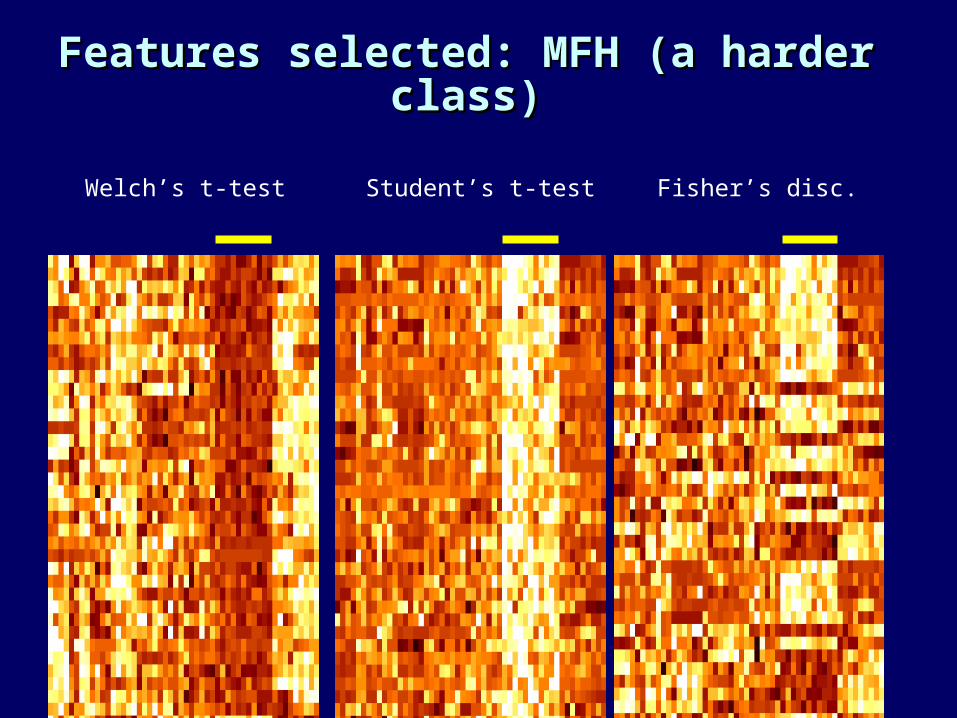
Features selected: MFH (a harder Features selected: MFH (a harder class)class)
Welch’s t-test Student’s t-test Fisher’s disc.

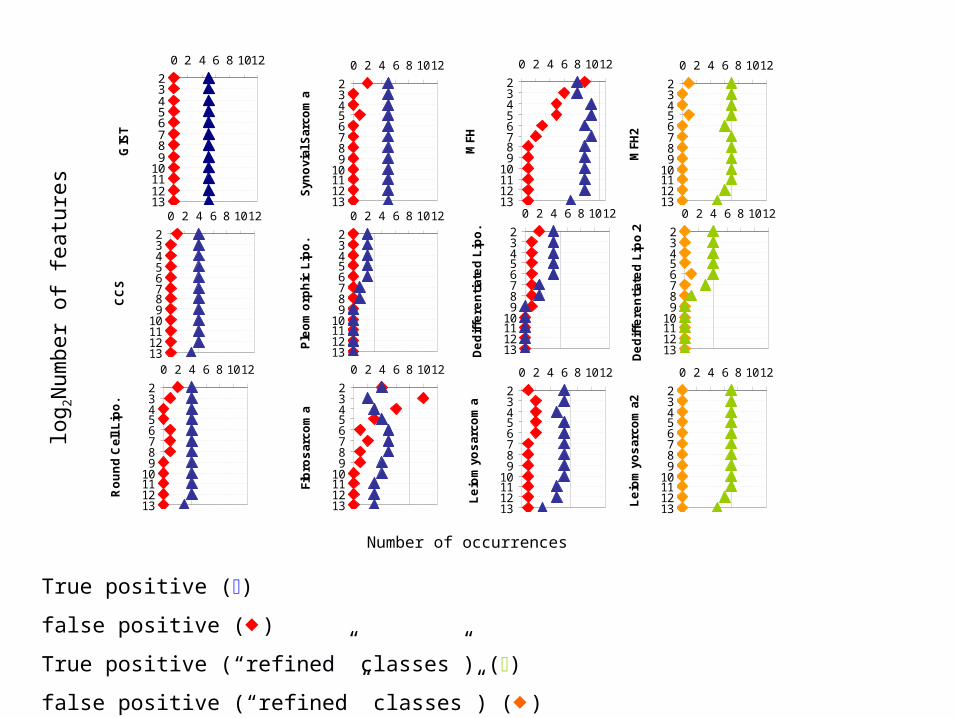
Hold-one-out cross-Hold-one-out cross-validation of SVM with validation of SVM with
feature selectionfeature selection
1: hold out one sample
2: select features
3: train SVM
4: classify held-out sample
1...52
22, 4,..,13 apply to test data
23456789
10111213
0 2 4 6 8 1012
De
dif
fere
nti
ate
d L
ipo
.2
23456789
10111213
0 2 4 6 8 1012
De
dif
fere
nti
ate
d L
ipo
.
23456789
10111213
0 2 4 6 8 1012
MFH
23456789
10111213
0 2 4 6 8 1012
CC
S
23456789
10111213
0 2 4 6 8 1012
Fib
ros
arco
ma
23456789
10111213
0 2 4 6 8 1012
Le
iom
yos
arco
ma
23456789
10111213
0 2 4 6 8 1012
Ple
om
orp
hic
Lip
o.
23456789
10111213
0 2 4 6 8 1012
Ro
un
d C
ell L
ipo
.
23456789
10111213
0 2 4 6 8 1012
Syn
ovi
al S
arco
ma
23456789
10111213
0 2 4 6 8 1012
MFH
2
23456789
10111213
0 2 4 6 8 1012
Le
iom
yos
arco
ma2
23456789
10111213
0 2 4 6 8 1012
GIS
T
Number of occurrences
log 2
Num
ber
of fe
atur
es
True positive ()
false positive ()
True positive (“refined” classes”) ()
false positive (“refined” classes”) ()
SVM resultsSVM results
What about all those genes we What about all those genes we selected?selected?
• What can we say about the genes which distinguish particular classes?
• They are presumably telling us something about the biology of the tumors:
• Hints about causes?• Drug targets?• Provide markers for diagnosis or targeting drugs?
• An expert can look at the results and come up with a story about each gene, for each class.
• Can we do this computationally?
Making use of biological prior Making use of biological prior knowledgeknowledge
• There is a huge biological knowledge base - we know a lot about many genes.
• How can we layer this information on the gene expression data?
• Would like to make seamless, optimal use of:• Gene function knowledge• Genetic mapping information• Sequence data – from other species too.• etc., etc., etc.
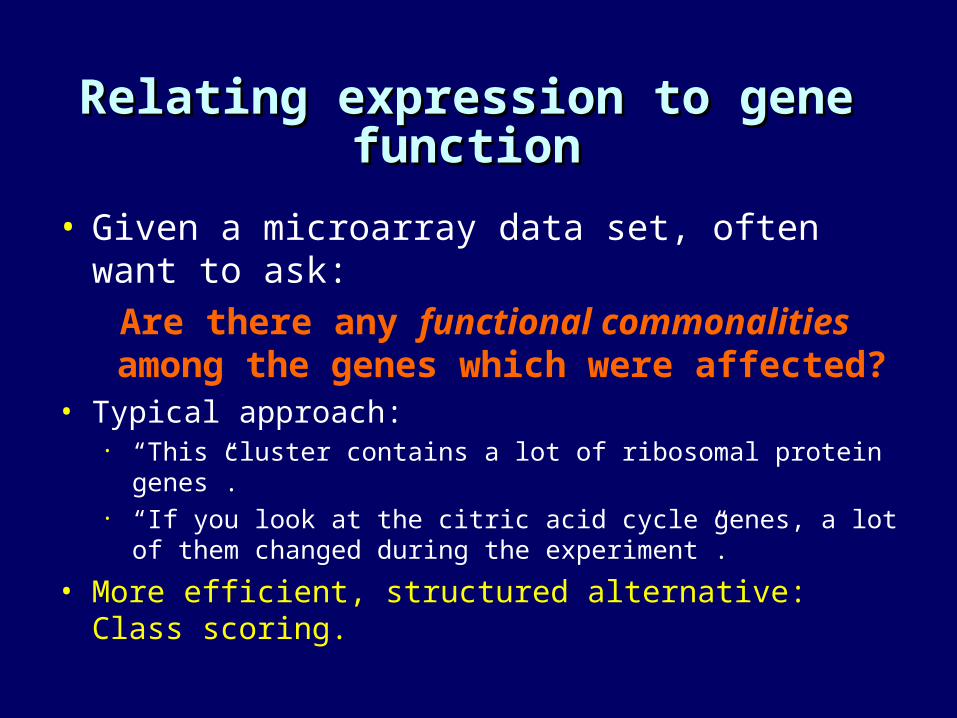
Relating expression to gene Relating expression to gene functionfunction
• Given a microarray data set, often want to ask:
Are there any functional commonalities among the genes which were affected?
• Typical approach:• “This cluster contains a lot of ribosomal protein genes”.• “If you look at the citric acid cycle genes, a lot of them changed
during the experiment”.
• More efficient, structured alternative: Class scoring.

Class scoring: basic ideaClass scoring: basic idea
• “Class” is any biologically meaningful set of genes.
• “Semi-supervised”
• Scores can be generated in multiple ways.
Given: Expression data and functional annotations (class labels) for the genes.Task: Find the interesting gene classes.Solution: Give each class a score.

Sources of annotationsSources of annotations
• Gene Ontology: a controlled vocabulary for describing gene function
• http://www.geneontology.org• Most of the major species genome databases are adopting it for
annotation.
• MIPS catalog of yeast genes (likely to be superceded by GO)
• http://mips.gsf.de/
• Both are hierarchys of terms.• Unfortunately, currently not all genes are annotated well
(or at all).

GO exampleGO example
(Browser at http://www.godatabase.org/cgi-bin/go.cgi)
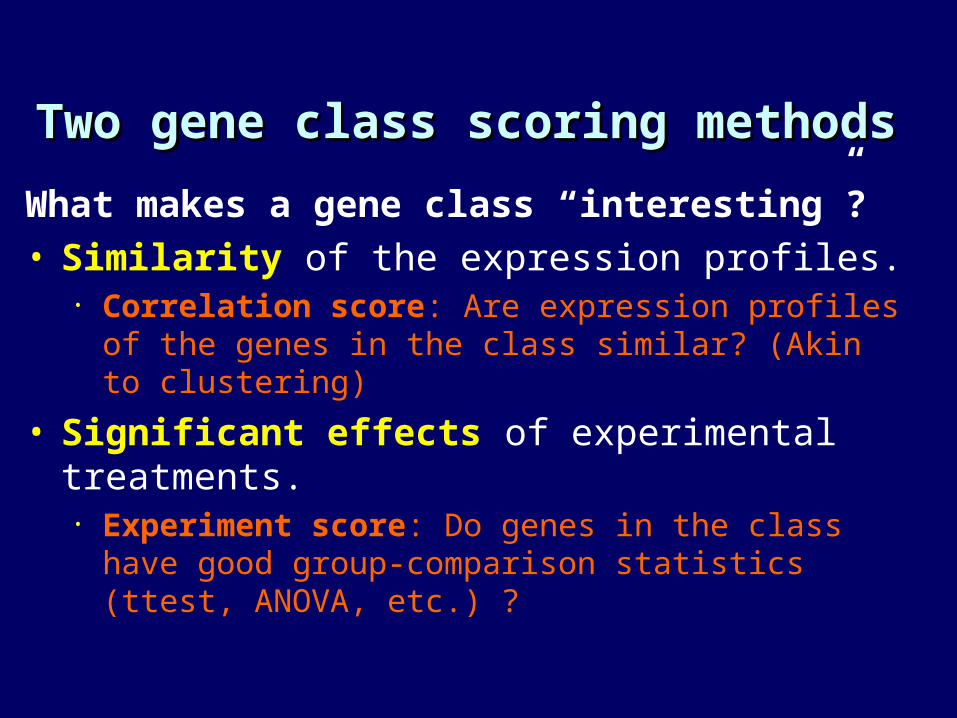
Two gene class scoring methodsTwo gene class scoring methods
What makes a gene class “interesting”?• Similarity of the expression profiles.
• Correlation score: Are expression profiles of the genes in the class similar? (Akin to clustering)
• Significant effects of experimental treatments.• Experiment score: Do genes in the class have good
group-comparison statistics (ttest, ANOVA, etc.) ?

Correlation score: detailsCorrelation score: details1. Get the data for one class.2. Measure the correlations between genes in the class. (Pearson correlation coefficient)3. Take the average of the correlations as the score for the class.4. Calculate p-value for the class5. Repeat steps 1-4 for many classes.6. Classes with best p-values are ‘most interesting’.
average
n*(n-1)/2 pairwisecorrelations
Classdata
Data
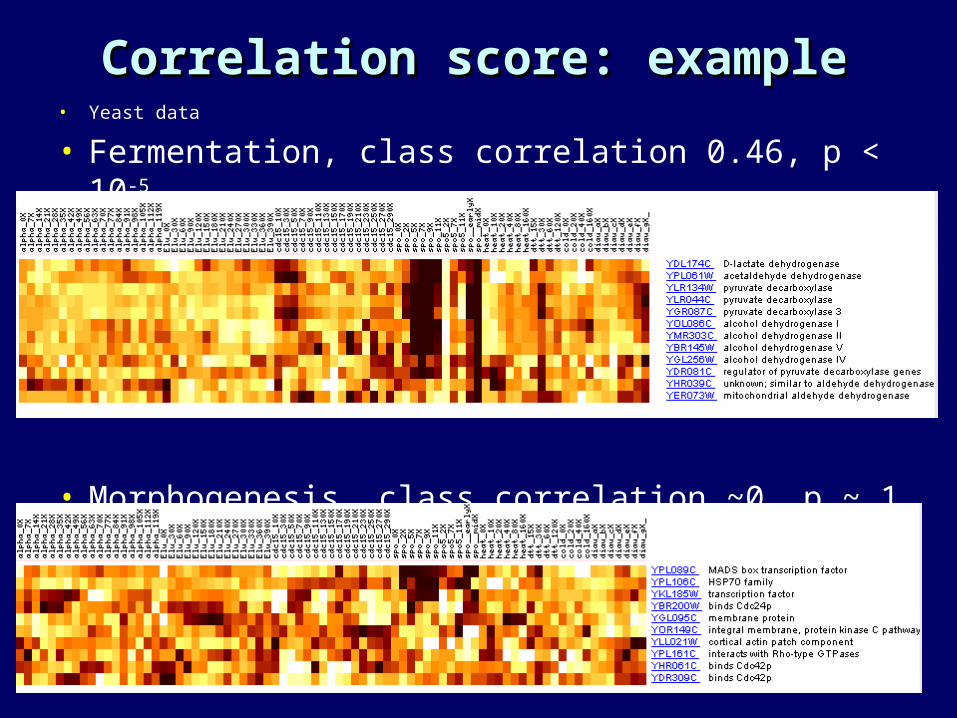
Correlation score: exampleCorrelation score: example• Yeast data
• Fermentation, class correlation 0.46, p < 10-5
• Morphogenesis, class correlation ~0, p ~ 1
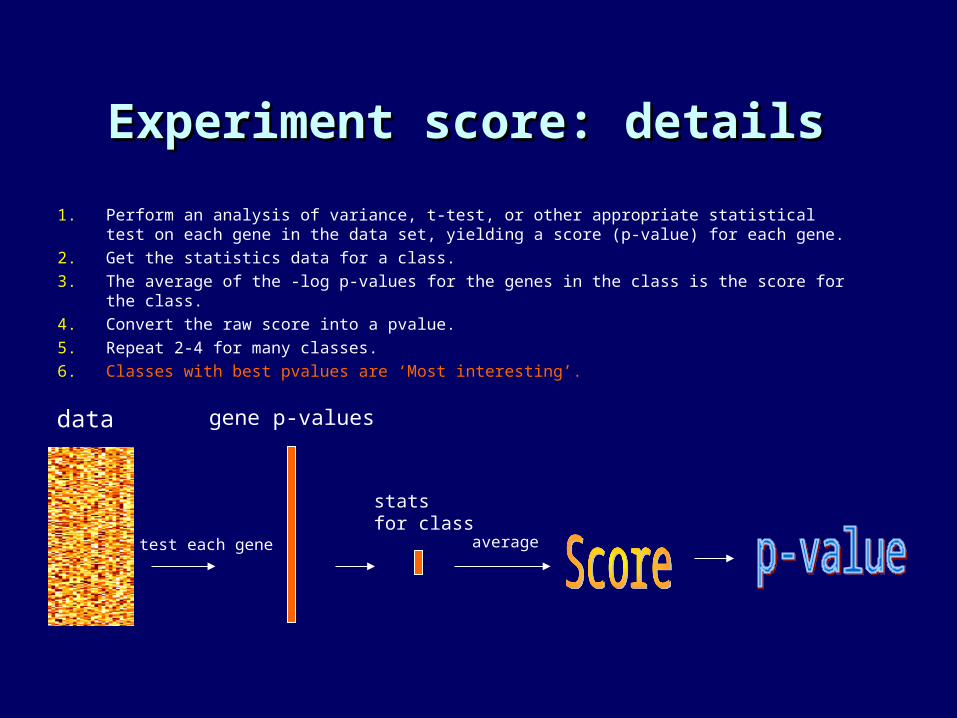
Experiment score: detailsExperiment score: details
1. Perform an analysis of variance, t-test, or other appropriate statistical test on each gene in the data set, yielding a score (p-value) for each gene.
2. Get the statistics data for a class.
3. The average of the -log p-values for the genes in the class is the score for the class.
4. Convert the raw score into a pvalue.
5. Repeat 2-4 for many classes.
6. Classes with best pvalues are ‘Most interesting’.
average
statsfor class
test each gene
data gene p-values
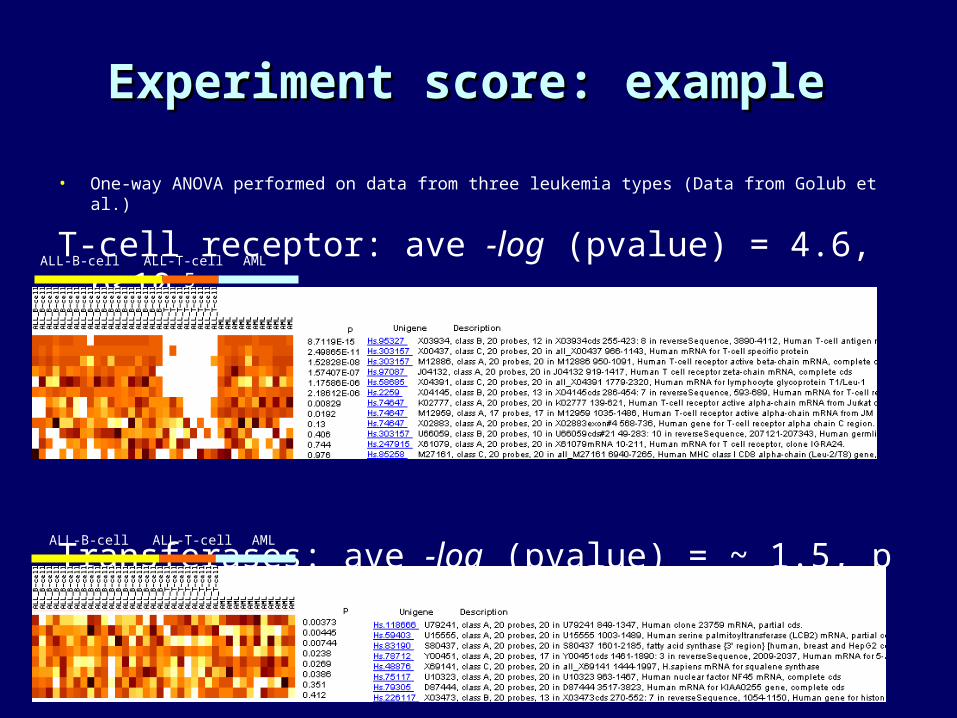
• One-way ANOVA performed on data from three leukemia types (Data from Golub et al.)
T-cell receptor: ave -log (pvalue) = 4.6, p<10-5
Transferases: ave -log (pvalue) = ~ 1.5, p ~1
Experiment score: exampleExperiment score: example
ALL-B-cell ALL-T-cell AML
ALL-B-cell ALL-T-cell AML
0
1000
2000
3000
4000
5000
6000
7000
8000
9000
10000
0 1 2 3 4 5 6
Class score
Cou
nts
Class size 30
Class size 2
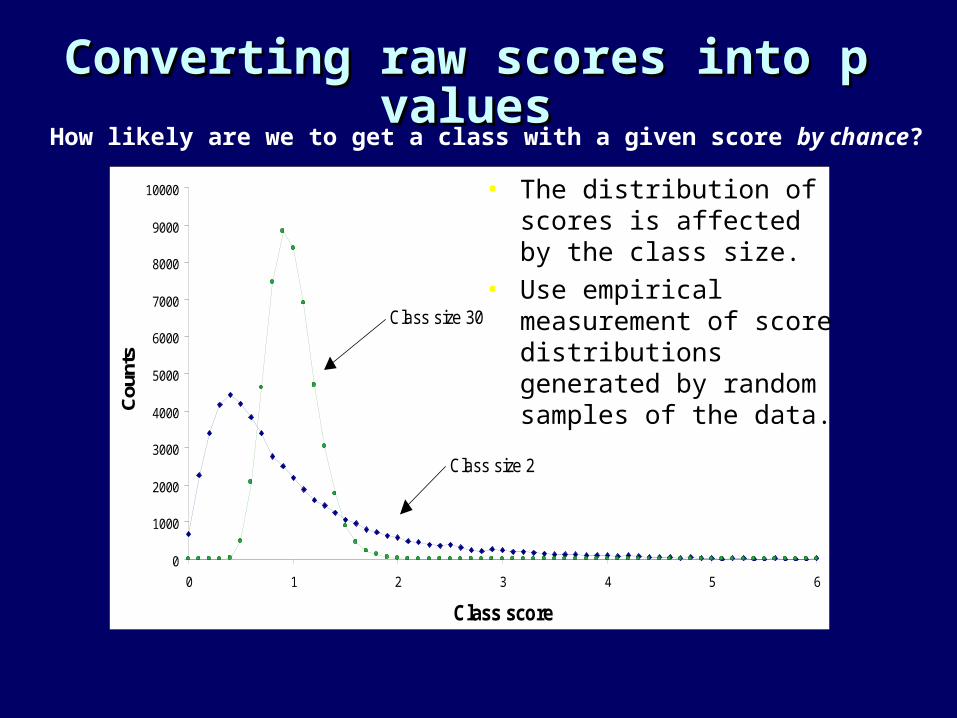
Converting raw scores into p Converting raw scores into p valuesvalues
• The distribution of scores is affected by the class size.
• Use empirical measurement of score distributions generated by random samples of the data.
How likely are we to get a class with a given score by chance?
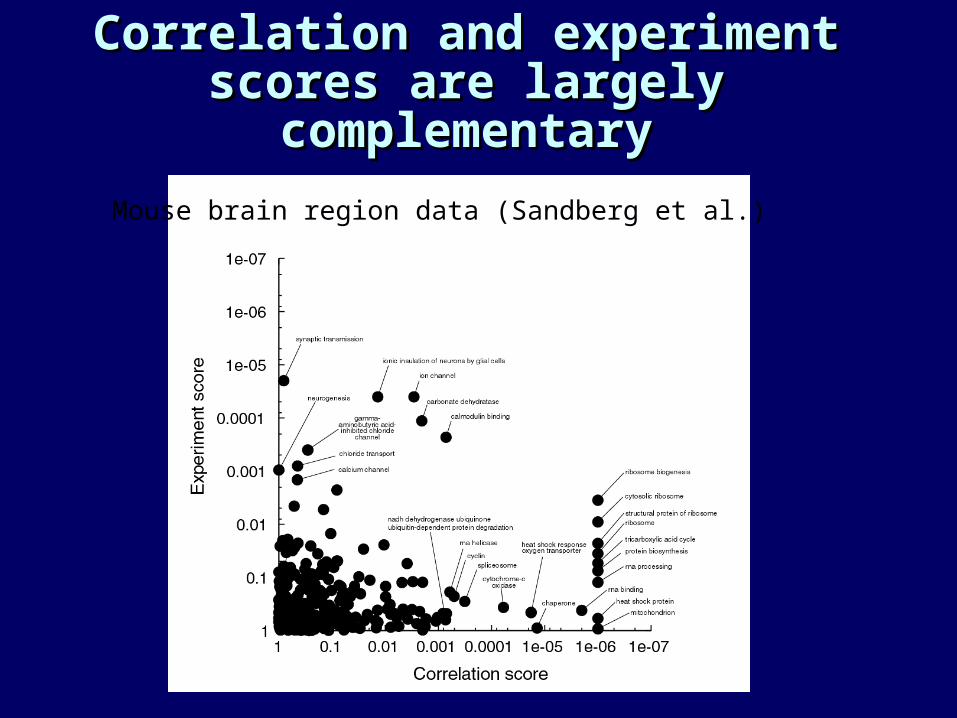
Correlation and experiment Correlation and experiment scores are largely scores are largely complementarycomplementary
Mouse brain region data (Sandberg et al.)
Correlation score method tends Correlation score method tends to select ‘housekeeping’ classesto select ‘housekeeping’ classes
• Across different experimental designs, organisms, and tissues:
• Ribosomal proteins/protein synthesis• Mitochondrial energy production/TCA cycle• RNA processing/spliceosome• Protein degradation/proteasome
• Suggests that:• These genes are always tightly coregulated. • Results of correlation score are not specific to the
experiment at hand – “biological noise”.
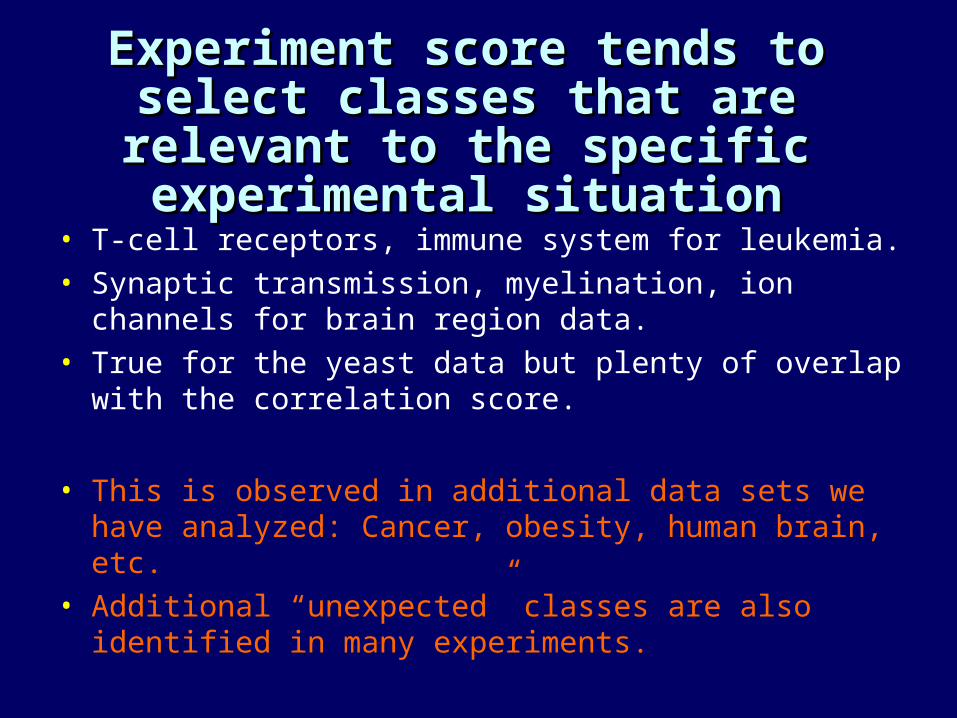
Experiment score tends to Experiment score tends to select classes that are relevant select classes that are relevant
to the specific experimental to the specific experimental situationsituation
• T-cell receptors, immune system for leukemia.• Synaptic transmission, myelination, ion channels for brain
region data.• True for the yeast data but plenty of overlap with the
correlation score.
• This is observed in additional data sets we have analyzed: Cancer, obesity, human brain, etc.
• Additional “unexpected” classes are also identified in many experiments.
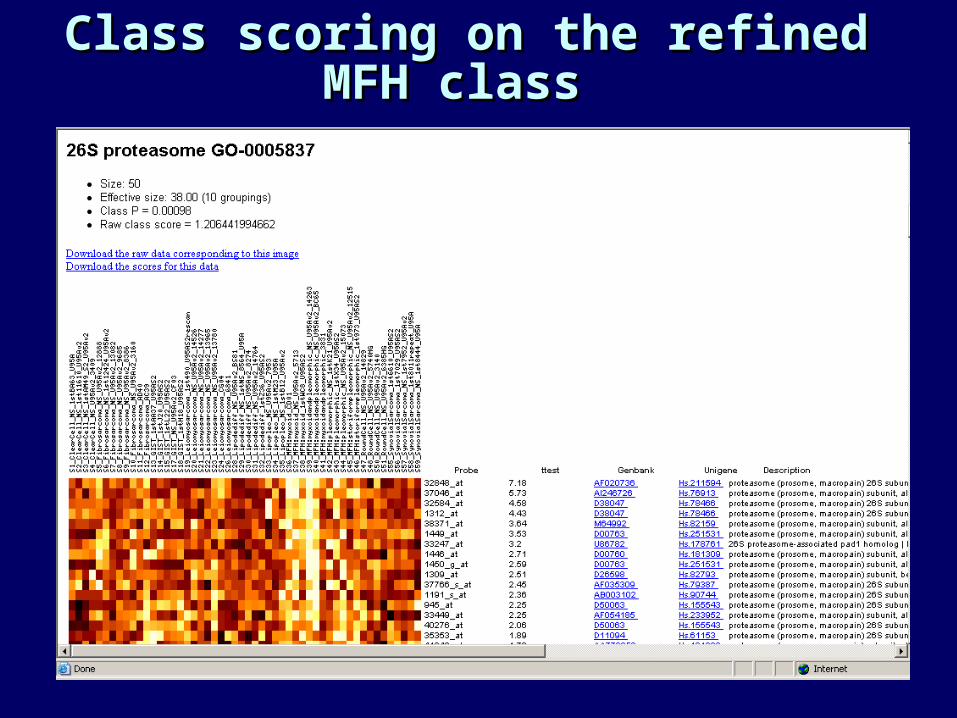
Class scoring on the refined Class scoring on the refined MFH class MFH class
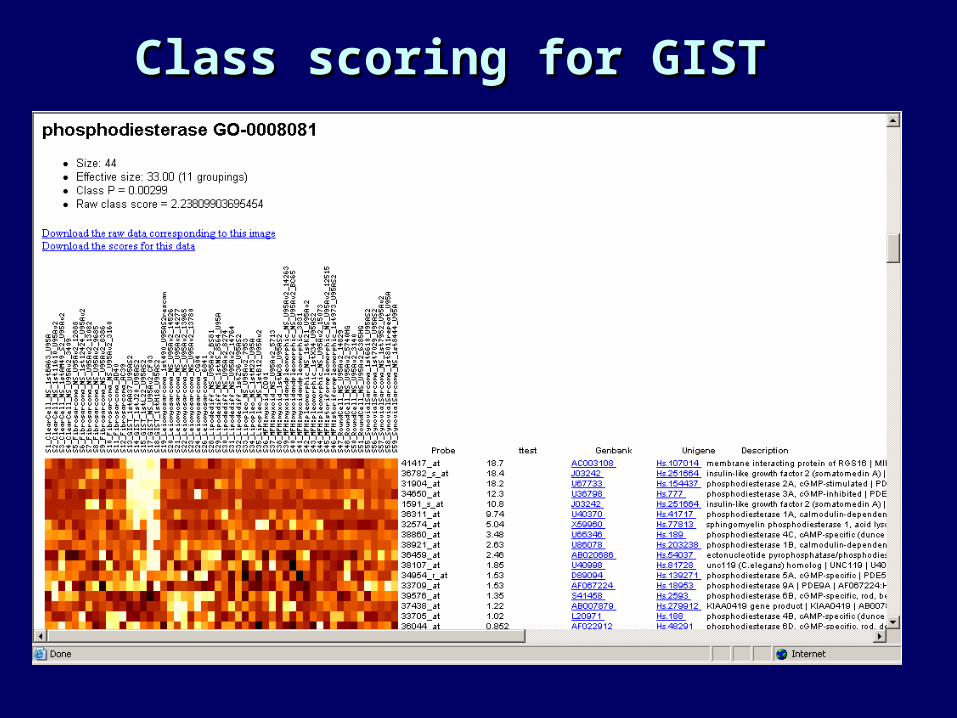
Class scoring for GISTClass scoring for GIST
Issues for the futureIssues for the future
• Using biological prior knowledge to make the most of microarray data.
• How to combine and interrelate various genome-wide data types, including microarrays.
• Extracting information about genetic networks from the data.
• Need more data!
• Can microarray data be used the way sequence data is used, or is it too messy?
• Comparing data between labs, platforms, and organisms.
• How will protein arrays and other developing technologies fit in?

A few resourcesA few resources
• Stanford Microarray Database• http://genome-www5.stanford.edu/MicroArray/SMD/
• Whitehead Institute: Cancer Genome Research• http://www-genome.wi.mit.edu/cancer/
• NCBI gene expression omnibus• http://www.ncbi.nlm.nih.gov/geo/
• Some software is available from my website:• http://rbp1sun.cpmc.columbia.edu/
• Gene Ontology:• http://www.geneontology.org
Further applications and Further applications and methods:methods:
examples from the literatureexamples from the literature• Determination of gene structure• Finding genetic regulatory pathways
Using arrays to determine gene Using arrays to determine gene structurestructure
• Computational approaches are currently inadequate.
• First/last exons often incorrectly predicted.• Alternate splicing very difficult to detect.
• Experimental approaches can be very effective, but the genome is very large...
• One answer: genome-scanning and tiling arrays.see Shoemaker, et al., Nature 2001 (genome issue)
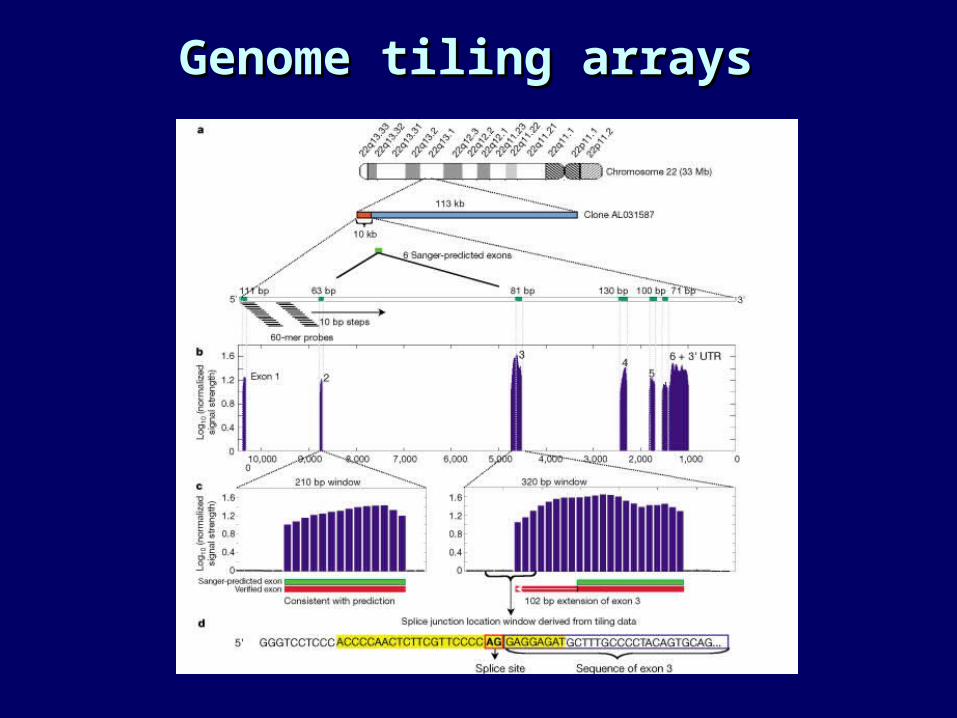
Genome tiling arraysGenome tiling arrays
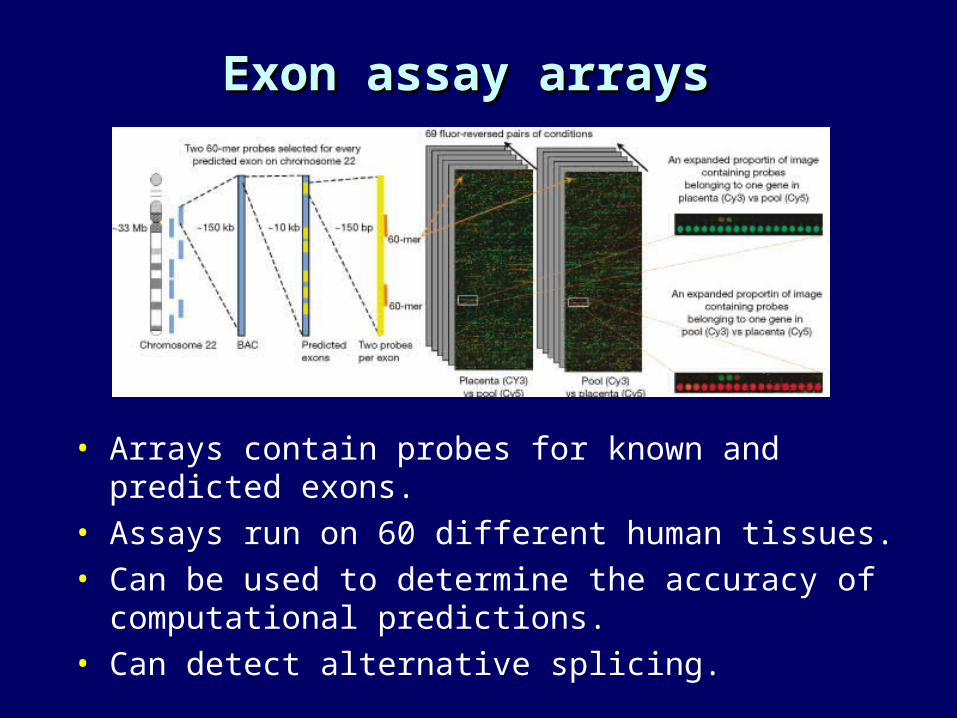
Exon assay arraysExon assay arrays
• Arrays contain probes for known and predicted exons.• Assays run on 60 different human tissues.• Can be used to determine the accuracy of computational
predictions.• Can detect alternative splicing.

Finding pathways (or pieces of Finding pathways (or pieces of them)them)
• Popular data set: Mutations in 300 known yeast genes (not all of known function)
• Microarray analysis of each of the 300 strains• We can ask, which genes are affected by
knocking out gene X?
• One example: Pe’er et al., ISMB 2001 (using data from Hughes et al., Cell 2000)

Overview of dataOverview of data
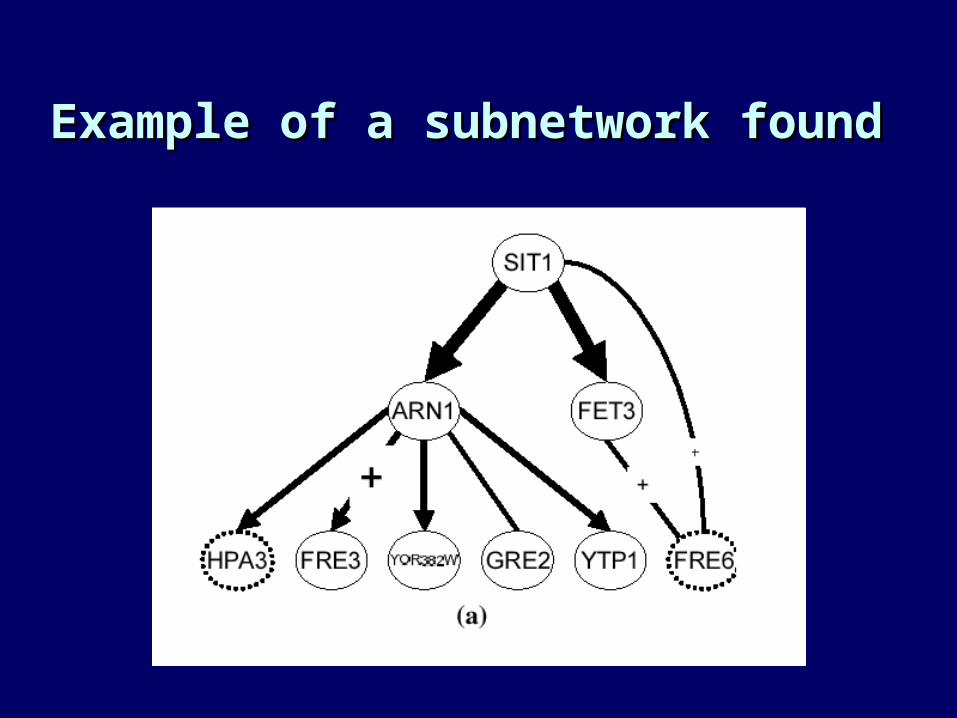
Example of a subnetwork foundExample of a subnetwork found
A few resourcesA few resources
• Stanford Microarray Database• http://genome-www5.stanford.edu/MicroArray/SMD/
• Whitehead Institute: Cancer Genome Research• http://www-genome.wi.mit.edu/cancer/
• NCBI gene expression omnibus• http://www.ncbi.nlm.nih.gov/geo/
• Some software is available from my website:• http://rbp1sun.cpmc.columbia.edu/
• Gene Ontology:• http://www.geneontology.org