Embed Size (px)
Citation preview

Computational Chemistry Lab: Hunt Research Goup, Imperial College London
http://www.huntresearchgroup.org.uk/teaching/year1_lab_start.html[13/11/2013 19:57:23]
Home Contacts Profile Papers Research Group Openings Teaching Links
Comp. Chem. Lab
Hunt Group main page
Outline
Computational Chemistry Lab
Introduction
Why do computational (inorganic) chemistry? Computational chemistry gives us insight into the structure and bonding of complexes. While bonding in organic systems is (for the most part) straight forward this is not the case for inorganic compounds and complexes!
Computational studies allow us to investigate and study the "invisible" aspects of a chemical reaction, the transitions states and intermediates that cannot be observed by experimental means. We use computational studies to establish the real mechanism for a chemical reaction. A mechanism is proposed using arrow hopping or MO theory and then computational chemistry is used to establish the energy and structures of the proposed species. The highest energy transition state gives us the rate determining step, and the lowest energy product gives us the thermodynamic end state of the reaction. Very often the proposed mechanism needs to be "adjusted" in light of the computational study.
Computational studies can also differentiate between the energy of stable conformers, but more important is the location of transition states and activated complexes that may be difficult or impossible to characterise experimentally. We obtain energies and structures for these species. Thermodynamic information is obtained from the energy of stable states, and from barrier heights (energy of a transition state) we can also obtain kinetic data. An increasing number of properties can be usefully evaluated, for example IR and Raman spectra, NMR spectra and dipole moments. Analysis of the electron density gives us information on the bonding and local interactions between atoms.
For example:
an article in Chemistry World (05 June 2008) demonstrates one important use of calculations in the design of better catalysts, Cheaper catalysts designed by computerin 2009 Prof. Eisenstein a theoretical chemist recieved the American Chemical Society award for organometallic chemisty Interview with Prof Eisensteinthe nobel prize in chemisty 2013 went to Martin Karplus, Michael Levitt and Arieh Warshell for "for the development of multiscale models for complex chemical systems", that is, for building methods and codes in computational chemistry.
REALLY important In the first part of the lab you are learning new things and it is easy to make a mistake, but not so easy to spot it. The computational workshop is a bit different from labs: we expect you to ASK FOR HELP, don't just keep repeating calculations. If you cannot see, or don't understand why your job has failed there is no point in repeating it. Learning happens through trying something, making mistakes and fixing it, in this workshop, this is not a failure, it is a valid learning process.
During this workshop you will receive rapid feedback as part of the process, this will be via the demonstrators when they answer your questions, and through a small amount of information you should record as you progress through the workshop, your mini report . In the last 30min of the workshop the demonstrators will check your "report" and provide direct feedback on how well you have progressed. You are welcome to complete the workshop at home, and to contact Dr Hunt for feedback before the end of term.

Computational Chemistry Lab: Hunt Research Goup, Imperial College London
http://www.huntresearchgroup.org.uk/teaching/year1_lab_start.html[13/11/2013 19:57:23]
Part1: optimisation (60 min)creating a moleculewhat is an optimisation?running an optimisationlooking at the outputviewing the optimisation process
Part2: vibrations and charges (30 min)vibrational analysis theoryanimating molecular vibrationsatomic charges
Part3: reactions and orbitals (30 min)reaction energymolecular orbitals of N2
Part4: optional (30 min)this time is for you to try a calculation of your choice!optimise your molecule and look at the MOsif you choose a charged molecule ask a demonstrator how to enter charge in the calculation, it is very easy!for example, how do the MOs of one of O2, NO+, CO, or CN- OR HF differ from those of N2?alternatively look at the MOs of one other small molecule, such as H2O, H2S, BH3, CH4, SiH4 or PH5
Part5: Rapid feedback (30 min)ask a demonstrator for feedback on your workask a demonstrator any questions you have about the calculations
Top

Computational Inorganic Chemistry: Hunt Research Goup, Imperial College London
http://www.huntresearchgroup.org.uk/teaching/teaching_comp_lab_year1/1_creating_nh3.html[13/11/2013 19:58:55]
Home Contacts Profile Papers Research Group Openings Teaching Links
Comp. Chem. Lab
Lab main page
creating a molecule
understanding optimisation
running an optimisation
informaton from the output
viewing an optimisation
frequency analysis
animating vibrations
atomic charges
reaction energies
molecular orbitals
a molecule of your choice
Hunt Group main page
Creating a Molecule of NH3
The following are detailed instructions on how to set up a calculation, it is important you take the time to read the instructions and follow them precisely.
Create a new folder called "1styearlab" where you will save all your files
Launch gaussview two palettes or windows will appear one with buttons, which has all the controls in it and one that is blank, which will have your molecule in it
on the controls palette click on the button that has a grey periodic table (or element fragment) on it:
when the periodic table comes up choose N for nitrogen (1.), then when the nitrogen options appear along the bottom of this window choose the pyramidal fragment (2.):
now move the mouse to the molecule window and click once inside this window, a molecule of NH3 will appear:

Computational Inorganic Chemistry: Hunt Research Goup, Imperial College London
http://www.huntresearchgroup.org.uk/teaching/teaching_comp_lab_year1/1_creating_nh3.html[13/11/2013 19:58:55]
on the controls palette click on the button with a question-mark in front of a ruler. This is the inquiry button and we will use it later, however once in inquiry mode the other buttons deactivate and this will stop you accidentally making changes to your molecule.
Options for labelling and manipulating your moleculenow put the mouse on one of the atoms and move it across the screen, the molecule will rotate. Spend a few minutes getting comfortable with manipulating your molecule. Make sure you can
rotate the moleculemagnify and shrink the moleculetranslate the molecule
I took this image from the gaussview help menu. If at any point you want to find out more about manipulating molecules in gaussview the help section should be your first port of call.

Computational Inorganic Chemistry: Hunt Research Goup, Imperial College London
http://www.huntresearchgroup.org.uk/teaching/teaching_comp_lab_year1/1_creating_nh3.html[13/11/2013 19:58:55]
you should also look at the options in the view menu, for example you can put the letters for each atom on the ball-and-stick diagram
Controlling bond distance parametersAlong the top of the controls palette the next three buttons allow you to change the bond distances, angles and torsion angles of a molecule
Return to your window with NH3, click on the bond distance "button"Then click on the N-atom and one H-atom, they should now be highlighted and a new window will appearWhen we set the new bond distance, we don't want the N to move, only the H, so set the N atom to be "Fixed" (1.), this will be either atom 1 or atom 2 depending on whether you clicked on the N atom first (atom 1) or second (atom 2)Then we want to make the bond longer, enter 1.3 in the text box (2.), you will see the chosen bond elongate (3.) Then press the "OK" button, if you don't press ok the change will not be effected.Set all three N-H bonds to 1.3 angstrom.

Computational Inorganic Chemistry: Hunt Research Goup, Imperial College London
http://www.huntresearchgroup.org.uk/teaching/teaching_comp_lab_year1/1_creating_nh3.html[13/11/2013 19:58:55]
The angle and torsion angle controls work similarly, if you want to try them out make a new molecule and explore how these controls work, leave this NH3 molecule alone as it has been set up for the next part of the exercise
Check the symmetry of your molecule
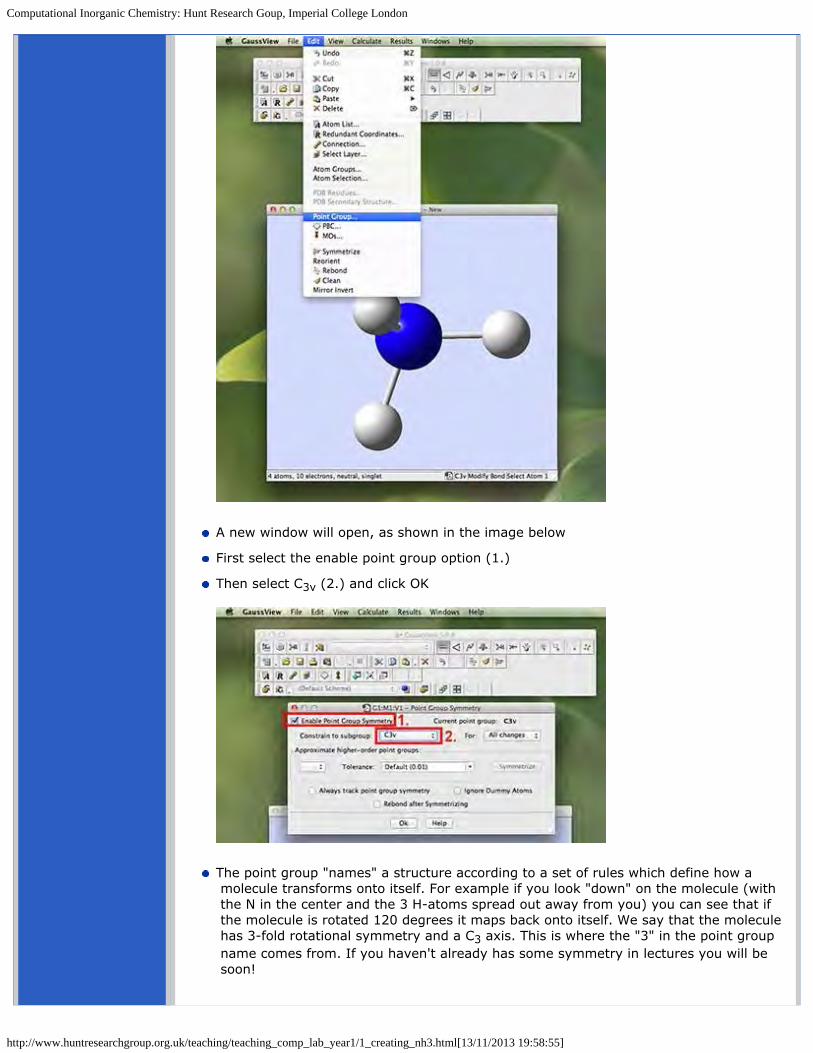
We need to ensure your molecule has the right symmetry. The model builder does not always get this right, and so for each molecule you need to manually check it. In the edit menu choose "Point group"
Computational Inorganic Chemistry: Hunt Research Goup, Imperial College London
http://www.huntresearchgroup.org.uk/teaching/teaching_comp_lab_year1/1_creating_nh3.html[13/11/2013 19:58:55]
A new window will open, as shown in the image below
First select the enable point group option (1.)
Then select C3v (2.) and click OK
The point group "names" a structure according to a set of rules which define how a molecule transforms onto itself. For example if you look "down" on the molecule (with the N in the center and the 3 H-atoms spread out away from you) you can see that if the molecule is rotated 120 degrees it maps back onto itself. We say that the molecule has 3-fold rotational symmetry and a C3 axis. This is where the "3" in the point group name comes from. If you haven't already has some symmetry in lectures you will be soon!

Computational Inorganic Chemistry: Hunt Research Goup, Imperial College London
http://www.huntresearchgroup.org.uk/teaching/teaching_comp_lab_year1/1_creating_nh3.html[13/11/2013 19:58:55]
you have now created and manipulated your first molecule!
When you are ready move onto the next step
Top

Computational Inorganic Chemistry: Hunt Research Goup, Imperial College London
http://www.huntresearchgroup.org.uk/teaching/teaching_comp_lab_year1/2_understand_opt_nh3.html[13/11/2013 20:00:40]
Home Contacts Profile Papers Research Group Openings Teaching Links
Comp. Chem. Lab
Lab main page
creating a molecule
understanding optimisation
running an optimisation
informaton from the output
viewing an optimisation
frequency analysis
animating vibrations
atomic charges
reaction energies
molecular orbitals
a molecule of your choice
Hunt Group main page
Understanding the Optimisation Process
Next you are going to optimise your NH3 molecule, but first I want to explain what the computer is doing for you and then we will set the job running.
Let us start by considering the energy E of a molecule. When we solve the Schrödinger equation (EΦ=HΦ) under the Born-Oppenheimer approximation we assume the nuclei are fixed, and we solve for the electrons (the wavefunction Φ) and energy (E). You will learn more about this in your "Chemical Bonding" course in 2nd year.
In fact, you are already familiar with this concept! The dissociation curve of a diatomic represents a potential energy curve E(R), that is, E dependent on R (the distance between the two atoms), see the figure below.
As the nuclei get close together, they repel each other (two positive charges repel) and the energy goes up. As the nuclei become stretched and the electrons no longer form a bond, the electron-nuclear attraction decreases, the energy goes up and the molecule dissociates.
Somewhere in the middle the electrons and nuclei are able to arrange themselves so that they are stable, we say that the system is in equilibrium. When something is in equilibrium we say there are no net forces on the atoms within a molecule (nothing pushing on them to make them want to move).
When carrying out calculations, the first thing we do is choose the position of the nuclei, this is the information you have provided in building your molecule. Rather than specify each position independently I'm going to define R as a collective coordinate which represents all the atomic positions.
We then solve the Schrödinger equation for the fixed nuclear positions, and obtain an energy E and wavefunction Φ which are dependent on the frozen position of the nuclei, we write this as: E(R) and Φ(R1). This process is called a self consistent field (SCF) calculation. During the SCF calculation we are finding the electronic wavefunction (Φ) that gives the lowest energy (for the fixed nuclei). This is also sometimes called a "single point" calculation.
If I move the nuclei slightly I will get a different energy E(R') because the interactions inside of H will be slightly different. For example the electrostatic interaction between the various nuclei will be different because the distance between them has changed.
The nuclear postitions we have choosen when building our molecle are unlikely to be the correct ones, and so we must optimise the structure to find the position of the nuclei that gives the lowest energy E(Ropt). That is we need to find the equilibrium or lowest energy geometry (represented by Ropt) as shown on the figure above.
Computational Inorganic Chemistry: Hunt Research Goup, Imperial College London
http://www.huntresearchgroup.org.uk/teaching/teaching_comp_lab_year1/2_understand_opt_nh3.html[13/11/2013 20:00:40]
First the nuclear positions (R1) are set and an SCF cycle is run to find the energy E(R1) and wavefuntion Φ(R1). Then we move the nuclei a small amount to positions represented by R2 and the SCF cycle gives us E(R2) and Φ(R2). Then we choose the positions, R1 or R2 that give us the lowest energy, thus if E(R2) < E(R1) we choose R2
Normally we need many more than 2 steps, and there are "tricks" for directing the search so that we can achieve a fully optimised structure very quickly.
Thus we compare the energies E(R2) and E(R1) if the new energy is lower we "move" in that direction. Then we start our search again from this new nuclear configuration. In this way we gradually move toward the lowest energy structure.
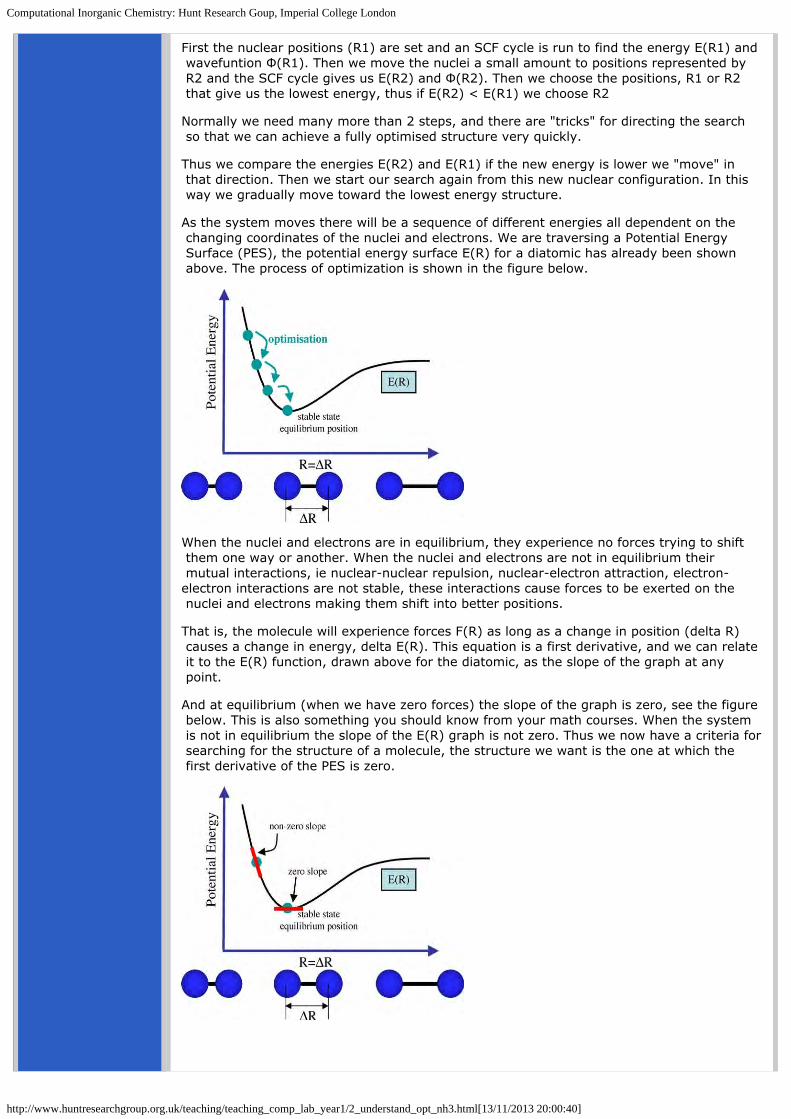
As the system moves there will be a sequence of different energies all dependent on the changing coordinates of the nuclei and electrons. We are traversing a Potential Energy Surface (PES), the potential energy surface E(R) for a diatomic has already been shown above. The process of optimization is shown in the figure below.
When the nuclei and electrons are in equilibrium, they experience no forces trying to shift them one way or another. When the nuclei and electrons are not in equilibrium their mutual interactions, ie nuclear-nuclear repulsion, nuclear-electron attraction, electron-electron interactions are not stable, these interactions cause forces to be exerted on the nuclei and electrons making them shift into better positions.
That is, the molecule will experience forces F(R) as long as a change in position (delta R) causes a change in energy, delta E(R). This equation is a first derivative, and we can relate it to the E(R) function, drawn above for the diatomic, as the slope of the graph at any point.
And at equilibrium (when we have zero forces) the slope of the graph is zero, see the figure below. This is also something you should know from your math courses. When the system is not in equilibrium the slope of the E(R) graph is not zero. Thus we now have a criteria for searching for the structure of a molecule, the structure we want is the one at which the first derivative of the PES is zero.

Computational Inorganic Chemistry: Hunt Research Goup, Imperial College London
http://www.huntresearchgroup.org.uk/teaching/teaching_comp_lab_year1/2_understand_opt_nh3.html[13/11/2013 20:00:40]
This is the process the computer carries out for us when we perform an optimisation
When you are ready move onto the next step
Top

Computational Inorganic Chemistry: Hunt Research Goup, Imperial College London
http://www.huntresearchgroup.org.uk/teaching/teaching_comp_lab_year1/3_optimising_nh3.html[13/11/2013 21:12:22]
Home Contacts Profile Papers Research Group Openings Teaching Links
Comp. Chem. Lab
Lab main page
creating a molecule
understanding optimisation
running an optimisation
informaton from the output
viewing an optimisation
frequency analysis
animating vibrations
atomic charges
reaction energies
molecular orbitals
a molecule of your choice
Hunt Group main page
Optimising a Molecule of NH3
if it is not already the front window, bring the window with your NH3 molecule to the front.
now we are ready to set up the commands that tell the program how to do the calculation, we tell it
the method: B3LYPthe basis set: 6-31G(d,p)and what type of calculation to do: OPTF (optimise and frequency analysis)
The method B3LYP determines the type of approximations that are made in solving the Schrödinger equation.
The basis set determines the accuracy, 6-31G(d,p) has a medium level accuracy, using this basis set means the calculations should be quick.
In carrying out an optimization we are determining the optimum position of the nuclei for a given electronic configuration, this is the first step for any quantum chemical calculation.
We are going to add a few extra commands as well to allow us to investigate the vibrational modes and electronic structure of the optimised molecule.
From the main menu along the top of the screen (in gaussview) choose "Calculation" and then choose "Gaussian Calculation Setup...":
a new palette will appear the calculation palette. It opens with the "job type" tab open. Use the pull down menu under "energy" to choose "opt+freq" (ignore the other stuff that appears)

Computational Inorganic Chemistry: Hunt Research Goup, Imperial College London
http://www.huntresearchgroup.org.uk/teaching/teaching_comp_lab_year1/3_optimising_nh3.html[13/11/2013 21:12:22]
then click on the "method" tab to open it,use the pull down menu under "Hartree-Fock" to pick "DFT"find the pull-down menu "LSDA" and choose "B3LYP"in basis set choose 6-31G in the first buttonin basis set leave the 2nd button, but in the 3rd button choose "d" and in the 4th button choose "p"type into the "additional keywords" section: pop=(full,nbo)don't change anything else!
pop stands for population analysis, and these extra keywords turn on some options for examining the electronic structure
you should also add a title for your job, so under the "title" tab type in something descriptive about the job I used "nh3 optimisation".
Now you are ready to go! Press submit (button is in the bottom left of the palette)
a new window will pop-up and telling you that you must save the file first, press "save":

Computational Inorganic Chemistry: Hunt Research Goup, Imperial College London
http://www.huntresearchgroup.org.uk/teaching/teaching_comp_lab_year1/3_optimising_nh3.html[13/11/2013 21:12:22]
a new window will then pop-up and ask you for a file name, navigate to the folder (1styearlab) you created at the beginning and save your input file. It is important to give your file a descriptive name otherwise after running a few jobs you will forget which one is which. I called mine "nh3_optf_pop.gjf" which identifies the molecule, and then what kind of job it is. I use "underscore" instead of spaces because I normally use unix and spaces have a special meaning in unix. It is a good habit to get into of not using spaces in filenames.
a new window will then pop-up and ask you if you want to submit the job, press submit!
close the molecule window, this is important as the "finished" molecule will look very similar to your starting one and many students accidentally take the wrong molecule in subsequent sections!
after a small amount of time a window should pop-up saying the job is completed, you want to open the *.log file. (This time will vary depending on how efficient your computer and network are, if you are waiting any more than 5min ask a demonstrator!) You should also select the "Read Intermediate Geometries" box as well.
the log (*.log) file contains information that is directly human readable, the checkpoint file (*.chk) contains information in binary that is only computer readable. Gausview reads these files and then graphically represents the information in them.
When using gaussview it can matter which one you look at, use the *.log file normally, but when you want to visualise molecular orbitals use the *.chk file (more about this shortly!)
This is your optimised NH3 molecule!
Now move onto the next step which covers finding key information about your optimised molecule

Computational Inorganic Chemistry: Hunt Research Goup, Imperial College London
http://www.huntresearchgroup.org.uk/teaching/teaching_comp_lab_year1/4_output_nh3.html[13/11/2013 21:13:39]
Home Contacts Profile Papers Research Group Openings Teaching Links
Comp. Chem. Lab
Lab main page
creating a molecule
understanding optimisation
running an optimisation
informaton from the output
viewing an optimisation
frequency analysis
animating vibrations
atomic charges
reaction energies
molecular orbitals
a molecule of your choice
Hunt Group main page
Viewing and Understanding your Optimised NH3 outputYour *.log file should be open, but if you have closed it you can open it again by choosing "File and open" in gaussview. Navigate to your 1styearlab folder and open your log file.
What if you cannot find the *.log file from inside gaussview? The file should be there however, sometimes silly microsoft does not give the .log extension. So navigate from the desktop of your PC to find the file you think is the *.log file (in your folder) and click on it choosing open in gaussview. If this doesn't work or you cannot find the file ask the demonstrator they will help you!
Find out some geometric informationon the commands palette click on the button with a question-mark in front of a ruler. This is the inquiry button and will tell you bond distances if you click on two atoms, and bond angles if you click on three atomsuse the inquiry button to determine the optimised N-H bond distance and the optimised H-N-H bond angle, record this information for your mini-report
To obtain general information about the job click on the results tab at the top and choose "Summary". This will open a window that lists important information about your calculation.

Computational Inorganic Chemistry: Hunt Research Goup, Imperial College London
http://www.huntresearchgroup.org.uk/teaching/teaching_comp_lab_year1/4_output_nh3.html[13/11/2013 21:13:39]
The summary contains information which is important when writing reports or papers that include theoretical results. This kind of information is equivalent to recording the concentration of your reactants or the temperature of your reflux etc. For every molecule you study, the following key information should be in your mini-report (other items in the table are not necessary):
What is the molecule?What is the calculation method?What is the basis set?What is the final energy E(RB3LYP) in atomic units (au)?What is the RMS gradient?What is the point group of your molecule?
some important conceptual things to know about how the various programs integrate.Gaussian "runs" the jobs (ie does all the number crunching)Gaussview is a separate program which is used to create and edit files used by Gaussian.When you submit a job you or Gaussview makes a *.gjf file and when you look at the output you or Gaussview is looking at a *.log fileGaussian also makes a third file, where it stores information in a "machine only readable format" these are called checkpoint files and have the file extension *.chk file. Sometimes we will also use Gaussview to process information in the *.chk file for us to view graphically, like the molecular orbitals.
Gaussian is a sophisticated program, not for general use, it has to carry out some very complex procedures, and this means it does not do a robust "check" of your input, if you make a mistake in the input Gaussian will not always "catch" the error. You should always check and check again your input if a job fails or even if a job seems to complete normally there may still be a problem!
Thus, it is very important for us to check that you have actually optimised the molecule, one way of doing this is to check the gradient. The gradient should be close to zero, ie is it less than 0.0005? A number larger than this means the optimisation is not complete, and you should ask a demonstrator to help you.
Now we are going to look at the "real" output, the file that Gaussian generates. This is a purely text based file, Gaussview is an interface that takes information from this file and presents it to you graphically. Sometimes we want information that Gaussview cannot process and so we must look directly at the file output by the program Gaussian. This also allows us to double check the job has optimised successfully

Computational Inorganic Chemistry: Hunt Research Goup, Imperial College London
http://www.huntresearchgroup.org.uk/teaching/teaching_comp_lab_year1/4_output_nh3.html[13/11/2013 21:13:39]
There is more than one way to access this file, you can click on the "view file" button in the summary (see above), or you can click on the results tab at the top and choose "View File ..."
In both cases a separate window should open, this is the "real" text based *.log file. Scroll through the file, if you are interested get a demonstrator to tell you more about the contents.
Now check that your job has really converged, go to the end of the file and move backwards until you find the final set of forces and displacements, it should look something like this:
Item Value Threshold Converged? Maximum Force 0.000005 0.000450 YES RMS Force 0.000003 0.000300 YES Maximum Displacement 0.000012 0.001800 YES RMS Displacement 0.000008 0.001200 YES Predicted change in Energy=-9.075171D-11 Optimization completed. -- Stationary point found. ---------------------------- ! Optimized Parameters ! ! (Angstroms and Degrees) ! -------------------------- -------------------------- ! Name Definition Value Derivative Info. ! -------------------------------------------------------------------------------- ! R1 R(1,2) 1.018 -DE/DX = 0.0 ! ! R2 R(1,3) 1.018 -DE/DX = 0.0 ! ! R3 R(1,4) 1.018 -DE/DX = 0.0 ! ! A1 A(2,1,3) 105.7463 -DE/DX = 0.0 ! ! A2 A(2,1,4) 105.7463 -DE/DX = 0.0 ! ! A3 A(3,1,4) 105.7463 -DE/DX = 0.0 ! ! D1 D(2,1,4,3) -111.867 -DE/DX = 0.0 ! -------------------------------------------------------------------------------- GradGradGradGradGradGradGradGradGradGradGradGradGradGradGradGradGradGrad

Computational Inorganic Chemistry: Hunt Research Goup, Imperial College London
http://www.huntresearchgroup.org.uk/teaching/teaching_comp_lab_year1/4_output_nh3.html[13/11/2013 21:13:39]
the important information is in the part below "Item" this tells us that the forces are converged. Remember force is the gradient or slope of the energy vs distance graph, and we are at a minimum when the slope is zero. A system is in equilibrium when there are no forces acting on it, when the forces are zero. So we are looking for a slope or force that is zero.
The computer never gets to exactly zero because of rounding errors, so we apply a threshold, in this case the Maximum Force on any atom should not exceed 0.00045 au, and the average (RMS) force should not exceed 0.0003 au.
This table of data also tells us that the displacements are converged, this means that for a small displacement (movement of the atoms) the energy does not change (within a certain very small amount).
You should always check the Item section of your output at the end of an optimisation, even if gaussview says the job finished properly. All of my students keep a "log book" of their calculations and are required to add a copy and paste of the "Item" table of converged forces and distances in it.
Include the RMS force and RMS displacement from the "Item" table in your mini-report for every molecule that you study.
Information from a calculation is physically meaningful ONLY if the molecule is optimised. Thus optimisation is always the first step to examining the structure and electronic distribution (bonding) within a molecule.
You now have an optimised geometry and can analyse your molecule further
When you are ready close the text file AND the molecule window and move onto the next step
Top

Computational Inorganic Chemistry: Hunt Research Goup, Imperial College London
http://www.huntresearchgroup.org.uk/teaching/teaching_comp_lab_year1/5_view_opt_nh3.html[13/11/2013 21:15:25]
Home Contacts Profile Papers Research Group Openings Teaching Links
Comp. Chem. Lab
Lab main page
creating a molecule
understanding optimisation
running an optimisation
informaton from the output
viewing an optimisation
frequency analysis
animating vibrations
atomic charges
reaction energies
molecular orbitals
a molecule of your choice
Hunt Group main page
Viewing the Optimisation of NH3
Now we can look at your finished job and understand a bit more about what is happening. From the main menu along the top of the screen (in gaussview) choose "file" and then "open" from the pull-down menu
a new window will open with available files. Before selecting a file it is important to first check that under
"File type" the pull-down menu has "Gaussian Output Files (*.out *.log) selectedthe "Read Intermediate Geometries" tick-box is checked
You should now have a molecule window open with your NH3 molecule in it. But your molecule has no bonds!!! Don't panic!
Look at the top left of the window, there should be a green button, click on the green button. Rotate the molecule a little so you can see what is happening to the structure more easily. The H-atoms of the molecule are moving in small steps towards the N-atom and forming bonds. The animation has only 5 steps so it recycles very quickly. Click on the same spot to stop the animation. You can click on the small arrows to step through each action of the optimisation movie and see this process more easily.
The first few structures don't have any bonds. Gaussview draws bonds based on a distance critera, so the fact that gaussview hasn't drawn bonds doesn't mean they are not there! Just that the distance exceeds some pre-defined value. important "Bonds" in gausview are a structural convenience. We set the N-H bond distance as 1.3 at the beginning, this exceeded the internally defined distance within gaussview.
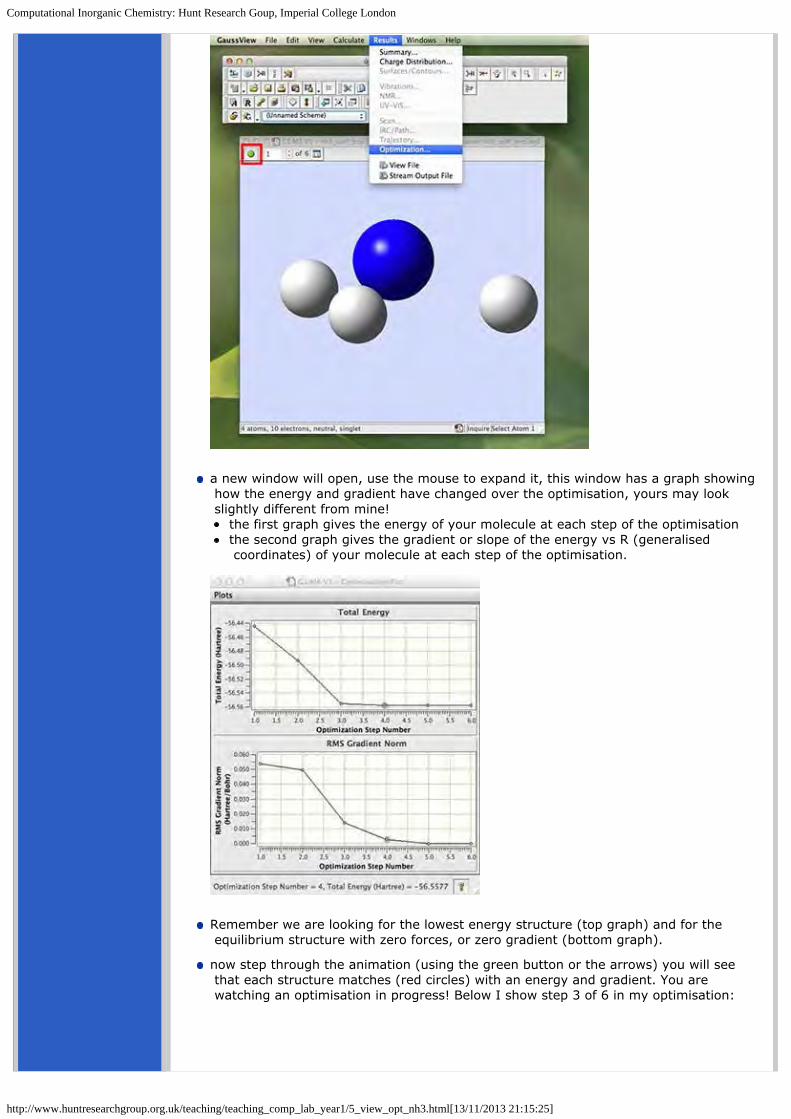
From the main menu along the top of the screen (in gaussview) choose "results" and then "optimization" from the pull-down menu:
Computational Inorganic Chemistry: Hunt Research Goup, Imperial College London
http://www.huntresearchgroup.org.uk/teaching/teaching_comp_lab_year1/5_view_opt_nh3.html[13/11/2013 21:15:25]
a new window will open, use the mouse to expand it, this window has a graph showing how the energy and gradient have changed over the optimisation, yours may look slightly different from mine!
the first graph gives the energy of your molecule at each step of the optimisationthe second graph gives the gradient or slope of the energy vs R (generalised coordinates) of your molecule at each step of the optimisation.
Remember we are looking for the lowest energy structure (top graph) and for the equilibrium structure with zero forces, or zero gradient (bottom graph).
now step through the animation (using the green button or the arrows) you will see that each structure matches (red circles) with an energy and gradient. You are watching an optimisation in progress! Below I show step 3 of 6 in my optimisation:

Computational Inorganic Chemistry: Hunt Research Goup, Imperial College London
http://www.huntresearchgroup.org.uk/teaching/teaching_comp_lab_year1/5_view_opt_nh3.html[13/11/2013 21:15:25]
The last structure has the most negative energy and the smallest gradient, this is the optimised structure of NH3.
Normally when you open an optimisation, only the final optimised structure is shown. However it is always a good idea to check the optimisation has completed properly once by opening the file and clicking the "read intermediate geometries" button and checking that the energy and gradient always go down.
Once you have checked the optimisation it is best to close the window, and then re-open the molecule without the intermediate geometries. I suggest this because students often forget that the first structure is not the optimised structure, and they analyse the wrong structure!
Now you have animated the molecule and visualised how it moves over the potential energy surface E(R)
When you are ready close the molecule window and move onto the next step
Top

Computational Inorganic Chemistry: Hunt Research Goup, Imperial College London
http://www.huntresearchgroup.org.uk/teaching/teaching_comp_lab_year1/6_freq_analysis_theory.html[13/11/2013 21:16:57]
Home Contacts Profile Papers Research Group Openings Teaching Links
Comp. Chem. Lab
Lab main page
creating a molecule
understanding optimisation
running an optimisation
informaton from the output
viewing an optimisation
frequency analysis
animating vibrations
atomic charges
reaction energies
molecular orbitals
a molecule of your choice
Hunt Group main page
I hope you remember from your pre-university days that while the first derivative of a function tells us the slope, it doesn't tell us if we are at a maximum or a minimum point! For example consider the case where there is a barrier to dissociation in our one dimensional example, as shown below, both the maximum of the barrier (the transition state) and the minimum (the ground state) have a slope of zero.
Vibrational Analysis and Confirming Minima
We will have to take the second derivative, if the second derivative is positive we have a minimum and if the second derivative is negative we have a maximum. The second derivative gives the curvature of the function, how this works is shown in the figure below.
When we carry out a frequency or vibrational analysis we are doing two things at once. The frequency analysis is essentially the second derivative of the potential energy surface, if the frequencies are all positive then we have a minimum, if one of them is negative we have a transition state, and if any more are negative then we have failed to find a critical point and the optimisation has not completed or has failed.
The frequency analysis has another important role to play, which you can guess from the name "frequency analysis", this calculation also provides the IR and Raman modes (or frequencies) to compare with experiment.
This means that the curvature, or second derivative of the potential energy surface is closely related to the vibrations a molecule undertakes.
Now we are ready to look at the vibrations of the NH3 molecule and to confirm we have minium and not a transition state structure.
When you are ready close the molecule window and move onto the next step

Computational Inorganic Chemistry: Hunt Research Goup, Imperial College London
http://www.huntresearchgroup.org.uk/teaching/teaching_comp_lab_year1/7_freq_animate_nh3.html[13/11/2013 21:17:42]
Home Contacts Profile Papers Research Group Openings Teaching Links
Comp. Chem. Lab
Lab main page
creating a molecule
understanding optimisation
running an optimisation
informaton from the output
viewing an optimisation
frequency analysis
animating vibrations
atomic charges
reaction energies
molecular orbitals
a molecule of your choice
Hunt Group main page
Animating the vibrationsNow we are ready to look at the output from the frequency, or vibrational analysis. We will be animating the vibrations and looking at the computed IR spectrum.
open your optimised structure (without intermediate geometries!)
From the main menu along the top of the screen (in gaussview) choose "Results" and then choose "Vibrations":
a new window will open called "Display Vibrations":

Computational Inorganic Chemistry: Hunt Research Goup, Imperial College London
http://www.huntresearchgroup.org.uk/teaching/teaching_comp_lab_year1/7_freq_animate_nh3.html[13/11/2013 21:17:42]
arrange your windows so that you can see both the molecule window and the vibration window
in the molecule window rotate your molecule so it is not completely in the plane of the screen
in the vibration window highlight the top vibration, then check the "Show Displacement Vectors" box, and finally click on the "Start" button, the molecule should start vibrating!
look at all the vibrations by highlighting them one after another down the list
All of these vibrations are active at zero kelvin! They represent the zero-point energy of the molecule, this is a purely quantum mechanical property of molecules.
If you have any vibrations with a negative number under the frequency heading this means your molecule is not fully optimised, go back and repeat the optimisation. If you are still unsuccessful after repeating your optimisation ONCE ask a demonstrator to help you determine where you have gone wrong.
you should have 6 vibrations, with frequencies similar (but not necessarily identical) to my example. The "mode" number is meaningless it is just to list the frequencies. The number in the IR column identifies the intensity of each vibration, it is only accurate to an integer value.
In your mini-report list the vibrational modes and answer the following questionshow many modes do you expect from the 3N-6 rule?which modes are degenerate (ie have the same energy)?which modes are "bending" vibrations and which are "bond stretch" vibrations?which mode is highly symmetric?one mode is known as the "umbrella" mode, which one is this?how many bands would you expect to see in an experimental spectrum of gaseous ammonia?
You have visualised the vibrations the molecule undergoes
When you are ready close the vibration window move onto the next step
Top

Computational Inorganic Chemistry: Hunt Research Goup, Imperial College London
http://www.huntresearchgroup.org.uk/teaching/teaching_comp_lab_year1/8_nbo_analysis_nh3.html[13/11/2013 21:18:26]
Home Contacts Profile Papers Research Group Openings Teaching Links
Comp. Chem. Lab
Lab main page
creating a molecule
understanding optimisation
running an optimisation
informaton from the output
viewing an optimisation
frequency analysis
animating vibrations
atomic charges
reaction energies
molecular orbitals
a molecule of your choice
Hunt Group main page
Charge AnalysisWhen we solve the Schrödinger equation the energy is not the only output, we also obtain a wavefunction (Φ). The square of the wavefunction gives the electron density which can then be partitioned up and assigned to each atom. The result is that we can determine an atomic charge. This process can be quite technical and you will find out more in your 3rd and 4th years.
Go to the results tab and select "charge distribution". A new window will appear select NBO as the type(1.) and color the atoms by charge (2.) Important: you must select the NBO charge distribution not the default Mulliken (which is a poor method for computing charge).
Include in your mini-report the charge on the N-atom and H-atoms. When carrying out calculations it is always good to check your results against your expectations. Write a sentence saying what charge (positive or negative) you would expect for N and H and why
When you are ready close the molecule window move onto the next step
Top
Computational Inorganic Chemistry: Hunt Research Goup, Imperial College London
http://www.huntresearchgroup.org.uk/teaching/teaching_comp_lab_year1/9_reaction_nh3.html[13/11/2013 21:19:13]
Home Contacts Profile Papers Research Group Openings Teaching Links
Comp. Chem. Lab
Lab main page
creating a molecule
understanding optimisation
running an optimisation
informaton from the output
viewing an optimisation
frequency analysis
animating vibrations
atomic charges
reaction energies
molecular orbitals
a molecule of your choice
Hunt Group main page
ReactivityThe Haber-Bosch process is the industrial means by which nitrogen gas and hydrogen gas are converted to ammonia. Ammonia is crucially important as a fertilizer. The reason we can support so many people in a limited area is that almost all farms in the western world use fertilizers extensively. More information can be found on the wiki
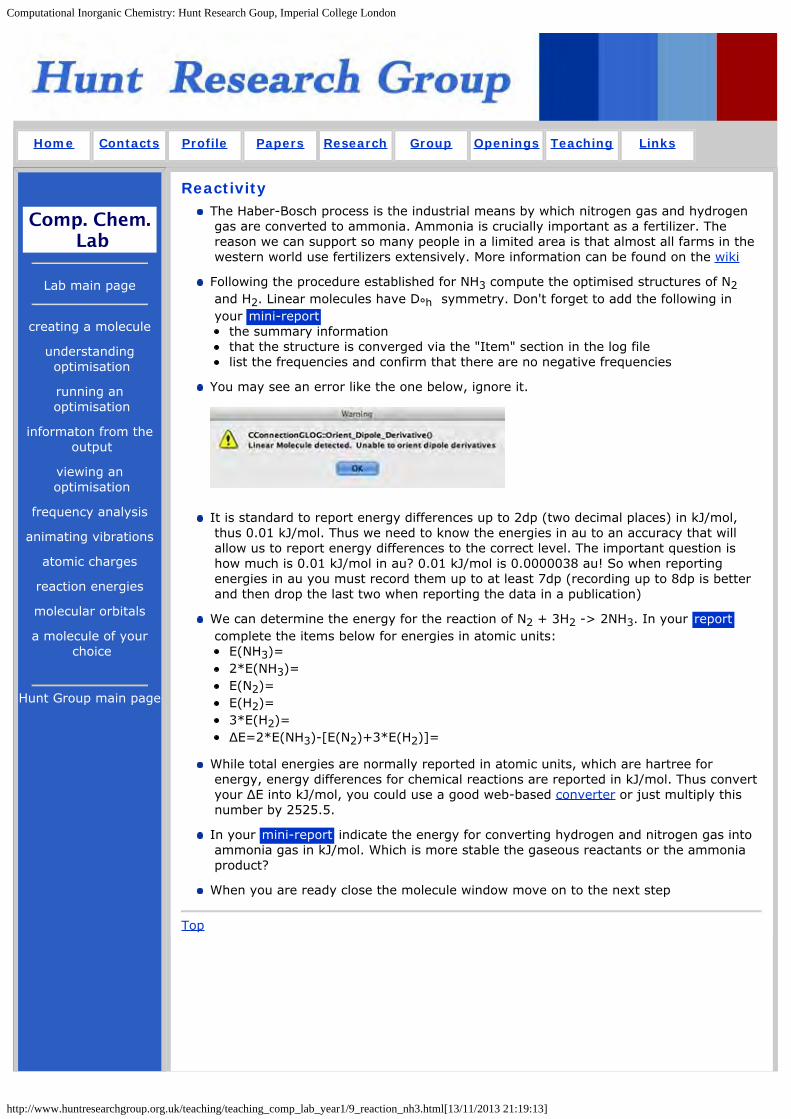
Following the procedure established for NH3 compute the optimised structures of N2 and H2. Linear molecules have D°h symmetry. Don't forget to add the following in your mini-report
the summary informationthat the structure is converged via the "Item" section in the log filelist the frequencies and confirm that there are no negative frequencies
You may see an error like the one below, ignore it.
It is standard to report energy differences up to 2dp (two decimal places) in kJ/mol, thus 0.01 kJ/mol. Thus we need to know the energies in au to an accuracy that will allow us to report energy differences to the correct level. The important question is how much is 0.01 kJ/mol in au? 0.01 kJ/mol is 0.0000038 au! So when reporting energies in au you must record them up to at least 7dp (recording up to 8dp is better and then drop the last two when reporting the data in a publication)
We can determine the energy for the reaction of N2 + 3H2 -> 2NH3. In your report complete the items below for energies in atomic units:
E(NH3)=2*E(NH3)=E(N2)=E(H2)=3*E(H2)=ΔE=2*E(NH3)-[E(N2)+3*E(H2)]=
While total energies are normally reported in atomic units, which are hartree for energy, energy differences for chemical reactions are reported in kJ/mol. Thus convert your ΔE into kJ/mol, you could use a good web-based converter or just multiply this number by 2525.5.
In your mini-report indicate the energy for converting hydrogen and nitrogen gas into ammonia gas in kJ/mol. Which is more stable the gaseous reactants or the ammonia product?
When you are ready close the molecule window move on to the next step
Top

Computational Inorganic Chemistry: Hunt Research Goup, Imperial College London
http://www.huntresearchgroup.org.uk/teaching/teaching_comp_lab_year1/10_mos_n2.html[13/11/2013 21:20:01]
Home Contacts Profile Papers Research Group Openings Teaching Links
Comp. Chem. Lab
Lab main page
creating a molecule
understanding optimisation
running an optimisation
informaton from the output
viewing an optimisation
frequency analysis
animating vibrations
atomic charges
reaction energies
molecular orbitals
a molecule of your choice
Hunt Group main page
Introduction to Moleuclar OrbitalsNext term you are going to start Molecular Orbital (MO) theory, and you have a number of courses that cover different aspects of MO theory from the mathematics through to qualitative MO diagrams in the 2nd Year. MO theory is also used in organic steroelectronics and in reaction mechanisms, both for transition metal complexes and organic synthesis.
To help you better understand the information your lecturers will be presenting we are going to have a look at some MOs here. We are going to focus on the MOs of N2.
Atoms have atomic orbitals which describe where the electrons spend most of their time. Molecules have molecular orbitals which describe where the electrons spend most of their time. Molecular orbitals are formed from combinations of atomic orbitals. For example in H2 the sAOs form a bonding and an antiboning pair. We say that the MOs can be modeled by a linear combination of the atomic orbitals this is know as LCAO theory. The LCAO approximation is a very very good one, but it is not exact, as you can see in the diagram below (and you will see shortly for N2), the electrons delocalise over the whole molecule. You will learn more about this in lectures next term.
Open the *.chk file for your N2 optimisation. Go to the "File" pulldown menu, choose "open", then in the File type: select *.chk, and select your N2 checkpoint file
Then from the "Edit" pulldown menu, choose "MOs":

Computational Inorganic Chemistry: Hunt Research Goup, Imperial College London
http://www.huntresearchgroup.org.uk/teaching/teaching_comp_lab_year1/10_mos_n2.html[13/11/2013 21:20:01]
A MO window should open. In the new window select the "Visualize" tab and then in the box "Add List" type "1-12", and click on Update. What will happen next is that gaussview will read information off the checkpoint file and covert this into the molecular orbitals 1-12 for you to visualise. Be patient, this requires quite a bit of number-crunching and may take up to 10min.
While you wait, let me explain what the window is going to present (see below). On the right hand side are a list of numbers, these are the energy of the MOs in atomic units. In the body of the window the molecular orbitals are going to appear. These orbitals are the orbital solutions to the Schrödinger equation, in other words the Φ, one for each MO energy level.

Computational Inorganic Chemistry: Hunt Research Goup, Imperial College London
http://www.huntresearchgroup.org.uk/teaching/teaching_comp_lab_year1/10_mos_n2.html[13/11/2013 21:20:01]
You will know the electronic configuration of a nitrogen atom: 1s22s22s3. When the nitrogen atoms combine to form N2 this is actually the atomic orbitals (AOs) combining to form molecular orbitals (MOs)
Click on the box for the lowest energy MO, the MO is the blue shaded region on the diagram above. (you may have different preferences set so it may give a mesh or an opaque surface, if you want to change the representation go into the "preferences" menu and select surfaces.) It is easy to see how this MO is a bonding combination of the two 1s core AOs on each N-atom. The next MO up in energy is the antibonding combination of the two 1s AOs. Notice how deep in energy these MOs are, -14.44 au much deeper than the MOs formed from the valence shell AOs. These AOs hardly overlap at all, they are held tightly to the respective nuclei, they are not very involved with chemical bonding.
Now look at MOs 3 and 4, this is the combination of the 2s valence AOs, bonding and antibonding. Notice how they overlap more strongly, the bonding overlap is so extensive that all we see is one extended surface. The energy is also much higher, now in the region of -0.5 to -1.12 au. The energy difference between the bonding and antibonding orbitals is much larger because they overlap better. These are valence orbitals and they are very involved in the chemical bonding.
The next band of MOs are made up from the 2p AOs.

Computational Inorganic Chemistry: Hunt Research Goup, Imperial College London
http://www.huntresearchgroup.org.uk/teaching/teaching_comp_lab_year1/10_mos_n2.html[13/11/2013 21:20:01]
There are two types of interactions, sigma along the bond and pi perpendicular to the bond, see the diagram below.
It is easy to see how pAOs perpendicular to the bond sitting side by side form the low energy bonding MOs. And because there are two pAOs on each atom that are perpendicular to the bond, we get two MOs of exactly the same energy (-0.46 au), orbitals of the same energy are said to be degenerate. You might already know that this type of MO is called a pi MO.
Above lies the MO formed from the bonding overlap of the along bond pAOs. There is a special reason called "mixing", which you will learn about a bit later in the year, which gives rise to the distorted shape of this MO. So remember these shapes (or just pop into the computer room and recalculate N2 when the time comes).
The next two orbitals are again degenerate and these are the antibonding combination of the perpendicular pAOs.
Then finally we have the antibonding MO from the along bond pAOs. This orbital is so high in energy it has positive energy, +0.41 au).
One of the reasons N2 is so stable, is that only bonding pAO based MOs are occupied.

Computational Inorganic Chemistry: Hunt Research Goup, Imperial College London
http://www.huntresearchgroup.org.uk/teaching/teaching_comp_lab_year1/10_mos_n2.html[13/11/2013 21:20:01]
You could also look at the higher energy MOs, however their shapes are not as reliable as those of the bonding MOs particularly the higher energy ones. When you get to your quantum mechanics course you will learn that this is because the SCF procedure only variationally optimises the occupied orbtials. So in terms of the mathematics the way we arrive at the un-occupied MOs is not as robust.
Now you are finished! If you have finished early there are some suggestions back on the main page for you to try.
Top