Embed Size (px)
Citation preview
Abstract—Obstructive Sleep Apnea Syndrome (OSAS) is a
common sleep disorder. It is characterized by repeated
occlusion of upper airway and discontinuation of sleep. The
breathing pauses and starts again with a loud snort. There may
even be an abrupt interruption of sleep to maintain the patency
of the airway. The pressure drop along the pharyngeal pathway
should be a good indicator to show the severity of the
pathological airways. Computational Fluid Dynamics (CFD)
has become an important tool in investigating the internal flow
dynamics of the respiratory system, especially for the upper
airway. It provides a non–invasive environment for the analysis
of the biological flow. Employing such technology, this study
will provide insight for a male patient with severe OSAS. This
patient also underwent surgical procedures to improve the size
of the airway.
The pre–operative and post–operative CT scans were
reconstructed and converted to two patient–specific,
three–dimensional models suitable for numerical simulations.
The inhalation process was simulated using a constant volume
flow rate, 0.3 liter per second (L s-1
), at the nostrils for both
cases. An index, the ‘resistance of the airway’, was defined as
the pressure drop per unit flow rate to estimate the tendency of
airway collapse.
The pressure distribution from the velopharynx to
hypopharynx was investigated. The pressure drops were 12.1
Pascal (Pa) and 7.3 Pascal before and after surgical treatment
respectively. The resistance of airway changed from 40 Pa s L-1
to 24 Pa s L-1
, a 40% reduction.
The results showed that the pressure drop along the upper
airway was reduced significantly after the surgical procedure.
This decreased the collapsibility of the airway and
consequently improved the sleep quality.
Index Terms—computational fluid dynamics, obstructive
sleep apnea, patient specific model, upper airway
Manuscript received March 28, 2011; revised April 10, 2011. Partial
financial support has been provided by the Hong Kong Research Grants
Council. Y. Fan is with The Department of Mechanical Engineering, The University
of Hong Kong, Pokfulam, Hong Kong (corresponding author to provide phone:
(852) 2859 2641; fax: (852) 2858 5415; e-mail: [email protected]).
L. K. Cheung, M. M. Chong and H. D. Chua are with The Discipline of Oral
and Maxillofacial Surgery, Faculty of Dentistry, The University of Hong Kong,
Pokfulam, Hong Kong (e-mail: [email protected];
[email protected]; [email protected])
K. W. Chow and C. H. Liu are with the Mechanical Engineering
Department, The University of Hong Kong, Pokfulam, Hong Kong (e-mail:
[email protected]; [email protected]).
I. INTRODUCTION
BSTRUCTIVE Sleep Apnea Syndrome (OSAS) is a
common sleep breathing disorder (SBD). It is
characterized by repeated occlusion of the upper airway and
discontinuation of sleep (Fig. 1). This leads to low respiratory
rate (hypopnea) or suspension of breathing (apnea). Once the
upper airway collapses (mostly occurs at the retroplatal and
retroglossal regions), the respiratory effort increases. The
breathing pauses and starts again with a loud snort. There
may even be an abrupt interruption of sleep to maintain the
patency of the airway [1]–[6].
There is a serious and rapid increase in the incidence of the
sleep disorder and related diseases. The prevalence of OSAS
in Hong Kong is similar to that in the United States (4% in
men, 2% in women) [5]–[6]. However, most of the people
underestimated the consequences of the obstructive sleep
apnea syndrome, 82–98% adults in the United States are
underdiagnosed [3] & [7].
A. Risk Factors
The major structures of the upper airway are the soft tissues
and the skeleton. The dysfunction or deformities of them are
the main constituents for the pathogenesis of OSAS. Obesity
and craniofacial factors are two major contributed elements
for OSAS. The pharyngeal wall is elastic and expansible at
which is free from the support of the cartilages. In the obese
patients, the bulky pharyngeal tissues narrow the air
pathway. The Asian groups are relatively less likely to be
overweight than the Caucasian counterparts. The
craniofacial parts then become a bigger contributor to the
development of OSAS in this predominantly Chinese
population [1].
B. Symptoms and Consequences
Due to the morphological differences in the upper airways,
most of the patients share some general signs and symptoms,
such as loud snoring, excessive daytime sleepiness and
morning headaches. The poor quality of sleep seriously
affects the daily life and health conditions of the patients. The
daytime fatigue and headache have a negative impact on the
efficiency at the workplace. It has also been reported that
OSAS patients are more likely to have motor vehicle
accidents [3]. Earlier studies showed that the OSAS patients
may have serious cardiovascular, pulmonary and neurologic
Computational Fluid Dynamics Analysis on the
Upper Airways of Obstructive Sleep Apnea
Using Patient – Specific Models
Y. Fan, L. K. Cheung, M. M. Chong, H. D. Chua, K. W. Chow, and C. H. Liu
O
IAENG International Journal of Computer Science, 38:4, IJCS_38_4_10
(Advance online publication: 12 November 2011)
______________________________________________________________________________________
problems [2]. This disorder also increases the risk of stroke
and death [2]–[4].
C. Treatments
OSAS is a treatable form of sleep breathing disorder. The
goals of treatments are to keep the airway open and to prevent
the pause of breathing during sleep. Continuous positive
airway pressure (CPAP) is the first–line, non–invasive
treatment for most of the patients [3]–[4]. The PAP devices
produce a pressurized airflow to the patient via a facial mask
during sleep.
For severe cases, invasive surgical procedures may be
carried out. In our work, mandibular distraction was
performed on a severe OSAS patient. The distraction is a
method to increase the length of the lower jaw bone as well as
the size of the pharyngeal airway.
D. Literature Review
Employing the computational fluid dynamics (CFD)
technique on the study of obstructive sleep apnea syndrome is
a very new aspect in biomedical engineering. In 2006, Xu
reported a CFD investigation of the airflow in the upper
airways of six subjects [8]. After his work, several authors
discussed the effect of the inspiration rate on the
aerodynamics of the upper airway [9]–[10]. Another group of
researchers described the effectiveness of the mandibular
advancing surgery with maxillomandibular advancement
[11]–[14]. Although some of them published a large scale
study of the OSAS patients using mandibular repositioning
appliances, there is still a research gap for the patients who
have undergone the mandibular distraction.
Computational fluid dynamics proves to be a convenient
and reliable tool for simulating the internal flow dynamics of
the respiratory system [8]–[16]. CFD gives a prediction on
the pressure distribution, flow velocities, and other physical
properties. We built patient–specific, three–dimensional
models in order to analyze the flow dynamics inside the
pharynx without complicated in vivo experiments.
The main objective of this study is to analyze the
morphological changes, the pressure distribution and the
airway resistance of a severe OSAS patient, before and after
the surgical procedure, by CFD.
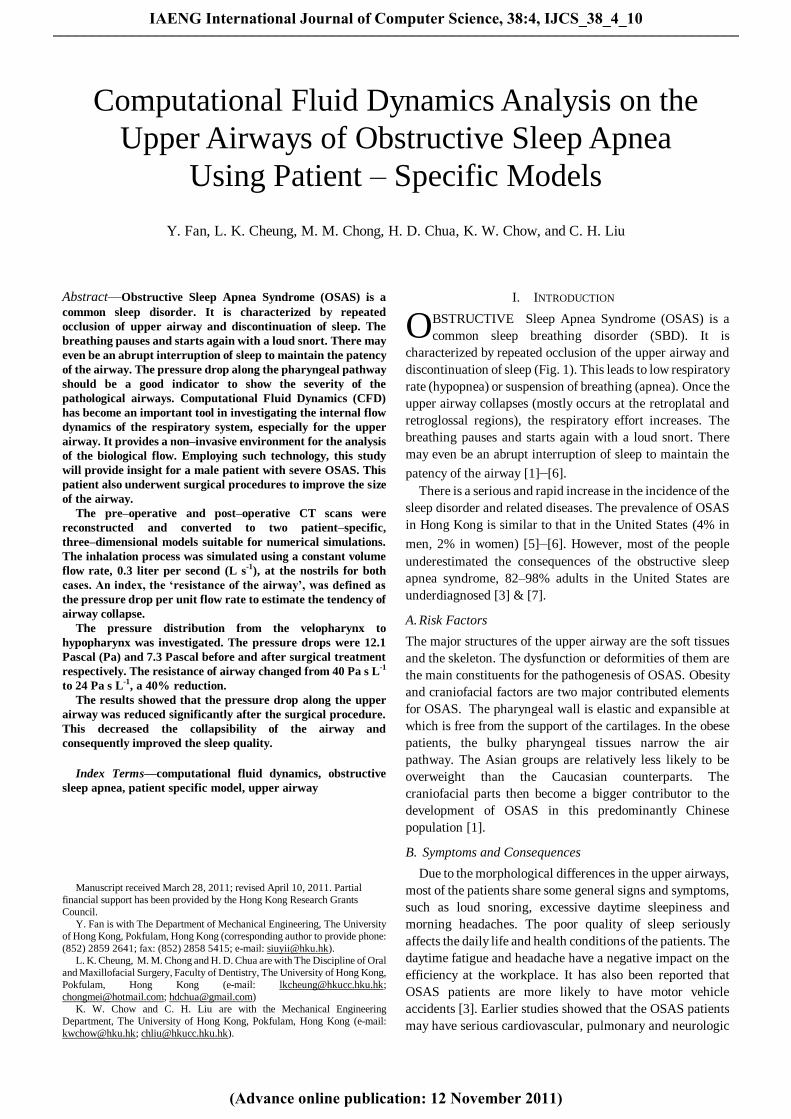
Fig. 1 The diagram shows the difference on the airflow
between a normal airway and an obstructed airway.
II. METHODS
Computational fluid dynamics is a widely used tool for the
prediction of the biological flow in the respiratory system.
Using similar methodology in the previous literatures, the
three–dimensional patient–specific models were
reconstructed and will be applied in the computation.
High–resolution cone–beam Computerized Tomography
(CBCT) images were obtained for the construction of the
patient–specific models. The mesh and mathematical models
were treated by sophisticated commercial software. The flow
patterns and streamlines were simulated by CFD.
Subsequently, the pressure distribution could then be
analyzed.
A. Patient Characteristics
The patient under consideration is a 45–year–old Chinese
man. The body mass index (BMI) is 21 kg m-2 which is
classified as ‗Normal‘. He was diagnosed with severe
Obstructive Sleep Apnea Syndrome, as well as severe
mandibular hypoplasia due to condylar resorption, which
means an unusually small size of the lower jaw. In order to
improve the quality of sleep, the patient underwent the
surgical intervention to lengthen the mandible and to expand
the pharyngeal pathway. The procedure included the
intraoral distraction of the mandible and bilateral condylar
shaving. The pre– and post– operative CBCT data files were
used for 3D reconstruction. The post–operative data was
obtained on the sixth year after the surgical treatment.
B. Patient-Specific Modeling
There were totally 323 two–dimensional images in each
case for the 3D model reconstruction of the mathematical
models. Each image was separated by a 0.3 mm distance. The
CT DICOM (Digital Imaging and Communications in
Medicine) images were imported into commercial software
(Mimics 13.0, Materialise, Belgium). The models included
the nostrils, the nasal cavity, the nasopharynx, velopharynx,
and oropharynx and ended below the epiglottis (Fig. 2).
The reconstruction of the upper airway was based on the
Hounsfield Units (HU) value, a measure of the electron
density of the tissue, in the CT images. The HU value of air in
the CT images ranged from -1000 to -500. The 3D models
were then smoothed and meshed in 3–matic (Materialise,
Belgium), and finally exported for further analysis (Fig. 3).
Volume meshing was generated with reference to the surface
mesh using the package TGrid 5.0.6 (ANSYS, Canonsburg,
USA). High quality, unstructured grids were created. There
were totally 4.4 x 10⁵ and 1.5 x 10⁶ cells in the pre–operative
and post–operative models respectively. Mesh independent
test was taken.
IAENG International Journal of Computer Science, 38:4, IJCS_38_4_10
(Advance online publication: 12 November 2011)
______________________________________________________________________________________
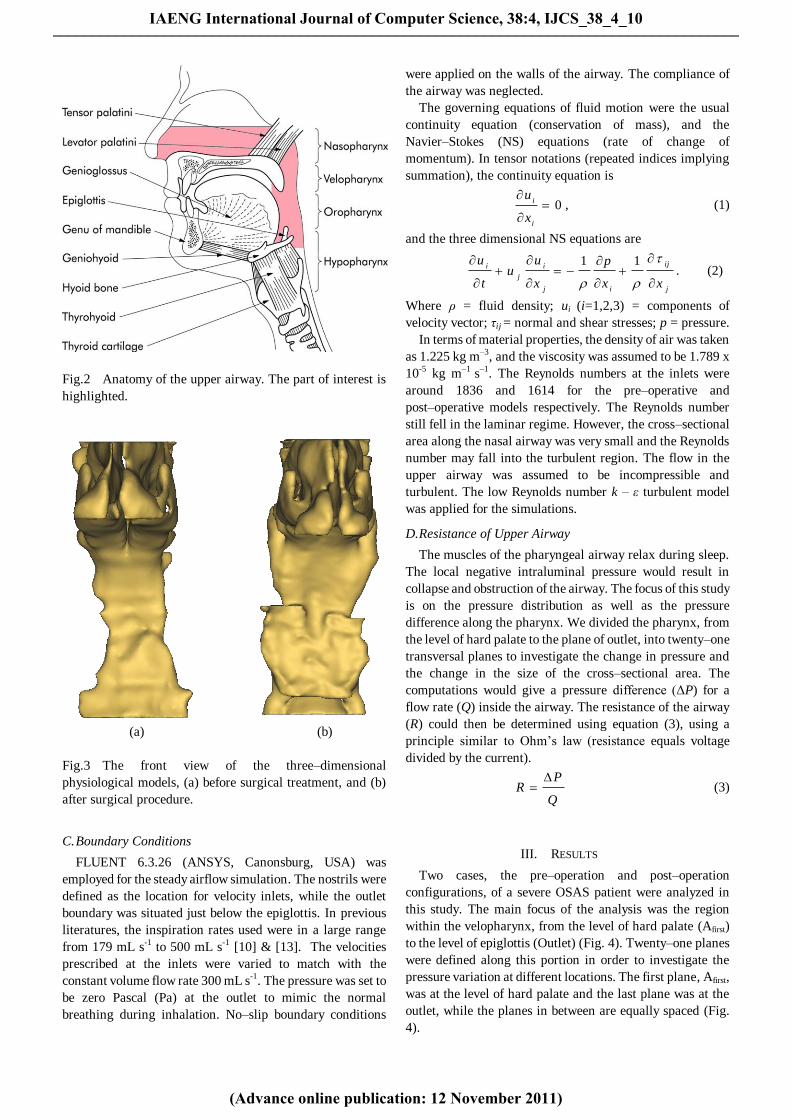
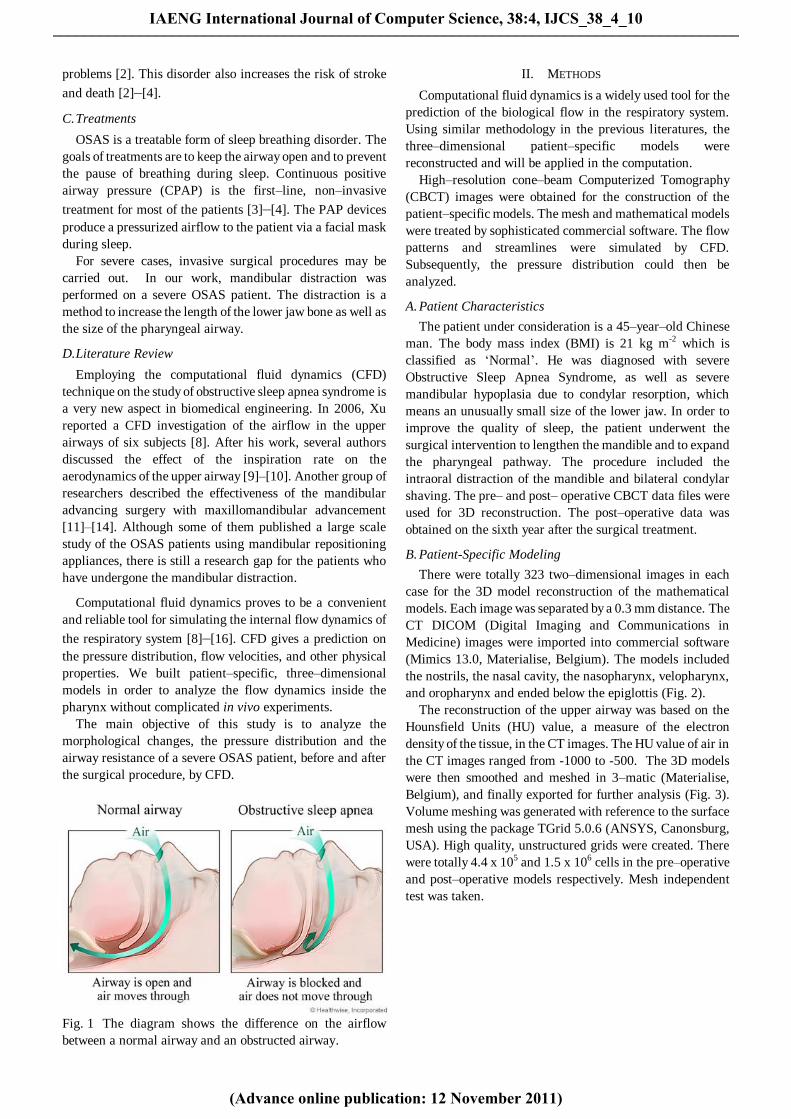
Fig.2 Anatomy of the upper airway. The part of interest is
highlighted.
(a) (b)
Fig.3 The front view of the three–dimensional
physiological models, (a) before surgical treatment, and (b)
after surgical procedure.
C. Boundary Conditions
FLUENT 6.3.26 (ANSYS, Canonsburg, USA) was
employed for the steady airflow simulation. The nostrils were
defined as the location for velocity inlets, while the outlet
boundary was situated just below the epiglottis. In previous
literatures, the inspiration rates used were in a large range
from 179 mL s-1 to 500 mL s-1 [10] & [13]. The velocities
prescribed at the inlets were varied to match with the
constant volume flow rate 300 mL s-1. The pressure was set to
be zero Pascal (Pa) at the outlet to mimic the normal
breathing during inhalation. No–slip boundary conditions
were applied on the walls of the airway. The compliance of
the airway was neglected.
The governing equations of fluid motion were the usual
continuity equation (conservation of mass), and the
Navier–Stokes (NS) equations (rate of change of
momentum). In tensor notations (repeated indices implying
summation), the continuity equation is
0
i
i
x
u, (1)
and the three dimensional NS equations are
j
ij
ij
i
j
i
xx
p
x
uu
t
u
11. (2)
Where ρ = fluid density; ui (i=1,2,3) = components of
velocity vector; τij = normal and shear stresses; p = pressure.
In terms of material properties, the density of air was taken
as 1.225 kg m–3, and the viscosity was assumed to be 1.789 x
10-5 kg m–1 s–1. The Reynolds numbers at the inlets were
around 1836 and 1614 for the pre–operative and
post–operative models respectively. The Reynolds number
still fell in the laminar regime. However, the cross–sectional
area along the nasal airway was very small and the Reynolds
number may fall into the turbulent region. The flow in the
upper airway was assumed to be incompressible and
turbulent. The low Reynolds number k – ε turbulent model
was applied for the simulations.
D. Resistance of Upper Airway
The muscles of the pharyngeal airway relax during sleep.
The local negative intraluminal pressure would result in
collapse and obstruction of the airway. The focus of this study
is on the pressure distribution as well as the pressure
difference along the pharynx. We divided the pharynx, from
the level of hard palate to the plane of outlet, into twenty–one
transversal planes to investigate the change in pressure and
the change in the size of the cross–sectional area. The
computations would give a pressure difference (ΔP) for a
flow rate (Q) inside the airway. The resistance of the airway
(R) could then be determined using equation (3), using a
principle similar to Ohm‘s law (resistance equals voltage
divided by the current).
Q
PR
(3)
III. RESULTS
Two cases, the pre–operation and post–operation
configurations, of a severe OSAS patient were analyzed in
this study. The main focus of the analysis was the region
within the velopharynx, from the level of hard palate (Afirst)
to the level of epiglottis (Outlet) (Fig. 4). Twenty–one planes
were defined along this portion in order to investigate the
pressure variation at different locations. The first plane, Afirst,
was at the level of hard palate and the last plane was at the
outlet, while the planes in between are equally spaced (Fig.
4).
IAENG International Journal of Computer Science, 38:4, IJCS_38_4_10
(Advance online publication: 12 November 2011)
______________________________________________________________________________________
A. Morphology of Airway
From the reconstructed physiological models, we can
easily see the differences in the sizes of the airways.
Three–dimensional expansion was noticed in the pharynx
which may give a better environment for breathing (Figs. 3 &
4). This expansion can be quantified by calculating the
percentage of the stenosis of the pharynx. The plane with
minimum area, Amin, was compared with the first plane, Afirst
(Fig. 4). Figure 5 showed the variation of the cross–sectional
area along the pharynx before and after the surgical
procedure. The graph clearly showed that the dimensions of
the airway were expanded successfully by the intra–oral
mandibular distraction. The dimensions of the minimum
areas were increased from 0.6 cm2 to 1.7 cm2. When
comparing these values with the sizes at the level of hard
palate, Afirst, the percentage of stenosis can be estimated by:
%1001min
firstA
AstenosisofPercentage
The percentage of stenosis improved from 80.5% to 49.0%
after the surgical treatment (Table I).
B. Airway Resistance
During inhalation, the atmospheric pressure was higher
than the pressure in the lungs. The pressure difference drove
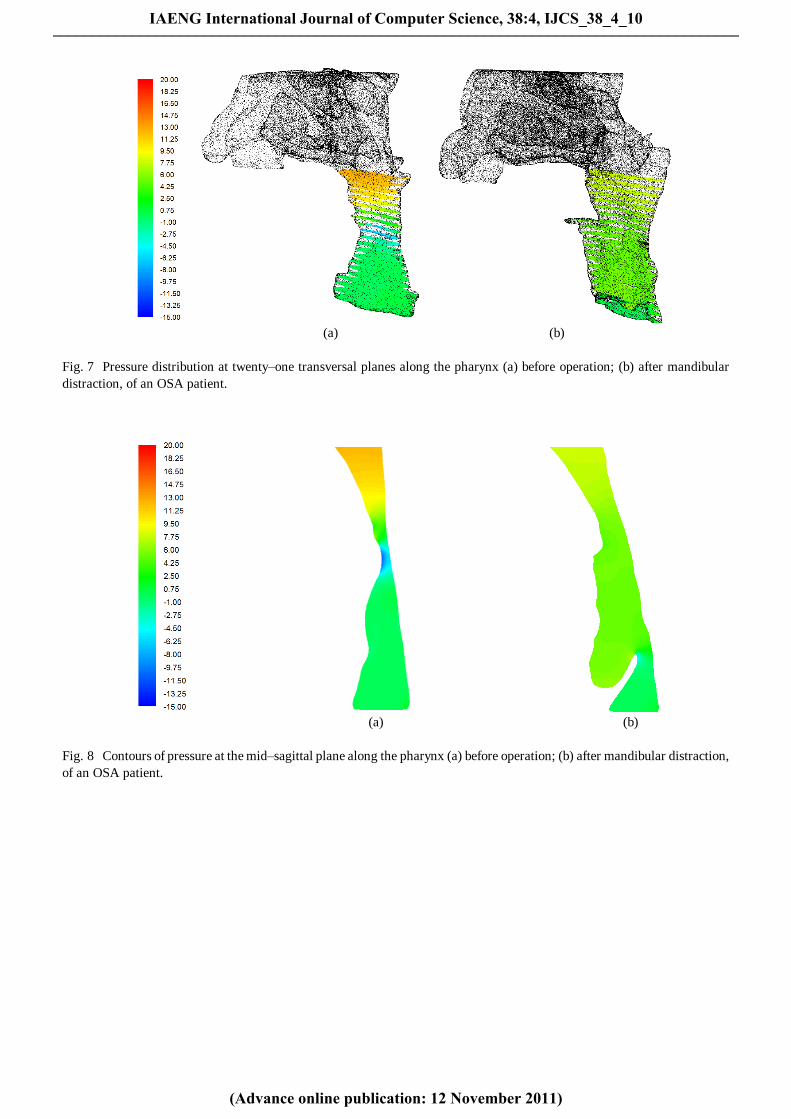
the inflow of air. Figure 6(a) showed the vector plots of
velocity magnitude at the mid–sagittal plane of the
pre–operative pharynx. The red color at the narrowest region
represented a very high speed flow at 5.7 m s-1. While the
vector plot of the post–operative model only showed a
gradual change in the velocity (Fig. 6).
According to the Bernoulli‘s Principle, for an inviscid
fluid, an increase in the speed of the fluid occurs
simultaneously with a decrease in pressure. The lowest
pressure was illustrated at the narrowest part of the airway
(Figs. 7 & 8). For an OSAS patient, a greater pressure was
required for driving the air into the restricted airway. The
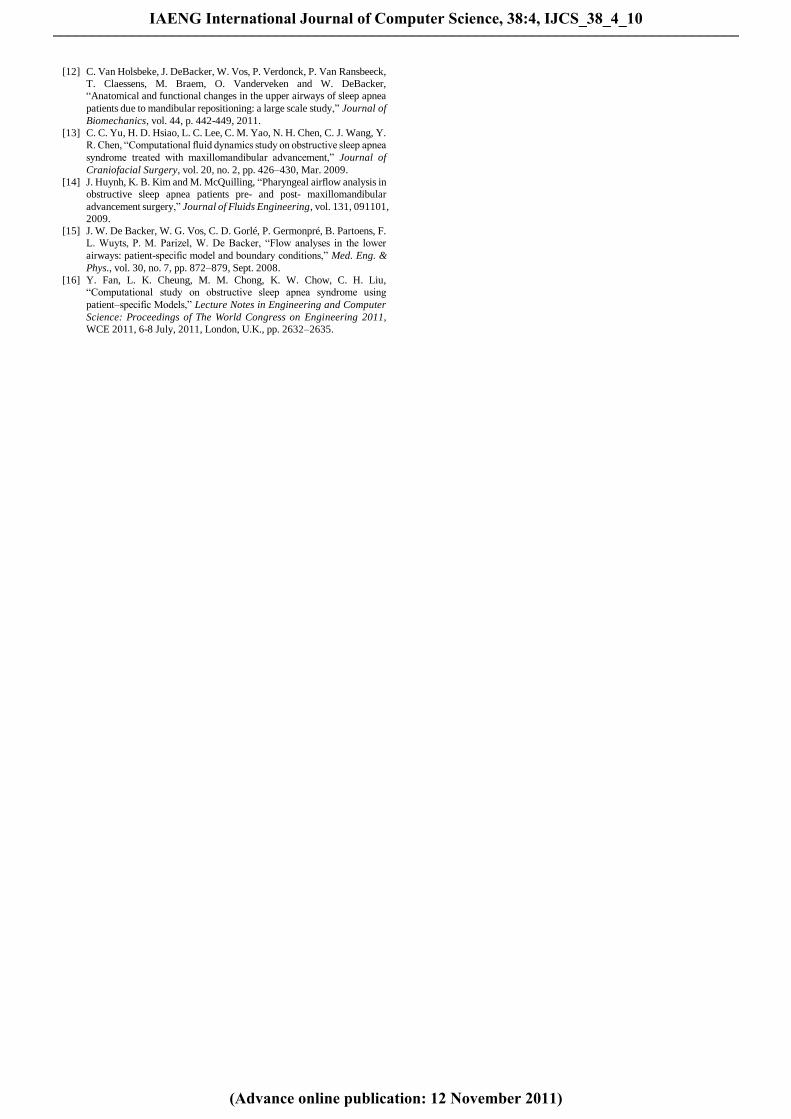
local pressure reduced to a negative value and the minimum
pressure was –6 Pascal (Pa) (Fig. 9).
The pressure difference between the first and the
twenty–first planes was 12.1 Pa. After the mandibular
distraction, no negative pressure was recorded along the
pharynx and only a gradual decrease in the pressure was
resulted which was 7.3 Pa. With a constant volume flow rate,
0.3 L s-1, the resistances were 40.2 Pa s L-1 and 24.3 Pa s L-1
before and after treatment respectively (Table I).
Amin
Afirst
Outlet
Amin
Afirst
Outlet (a) (b)
Fig. 4 The left view of the three–dimensional physiological models, (a) before surgical treatment, and (b) after surgical
procedure. The definitions of Afirst, Amin, and outlet.
A first
(cm2)
A min
(cm2)
Percentage of
Stenosis
Resistance
(Pa s L-1
)
Pre–operation 3.3 0.6 80.5% 40.2
Post–operation 3.3 1.7 49.0% 24.3
TABLE I
COMPARISON BETWEEN PRE-OPERATION AND POST-OPERATION
IAENG International Journal of Computer Science, 38:4, IJCS_38_4_10
(Advance online publication: 12 November 2011)
______________________________________________________________________________________
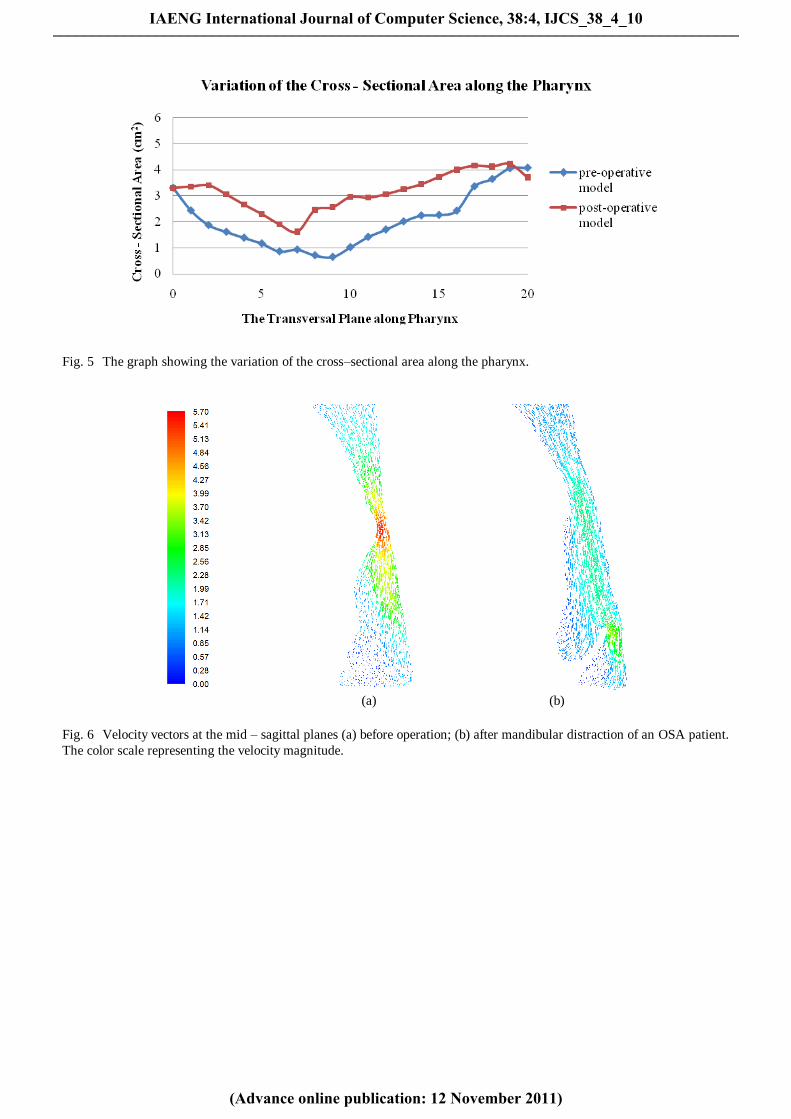
Fig. 5 The graph showing the variation of the cross–sectional area along the pharynx.
(a) (b)
Fig. 6 Velocity vectors at the mid – sagittal planes (a) before operation; (b) after mandibular distraction of an OSA patient.
The color scale representing the velocity magnitude.
IAENG International Journal of Computer Science, 38:4, IJCS_38_4_10
(Advance online publication: 12 November 2011)
______________________________________________________________________________________
(a) (b)
Fig. 7 Pressure distribution at twenty–one transversal planes along the pharynx (a) before operation; (b) after mandibular
distraction, of an OSA patient.
(a) (b)
Fig. 8 Contours of pressure at the mid–sagittal plane along the pharynx (a) before operation; (b) after mandibular distraction,
of an OSA patient.
IAENG International Journal of Computer Science, 38:4, IJCS_38_4_10
(Advance online publication: 12 November 2011)
______________________________________________________________________________________
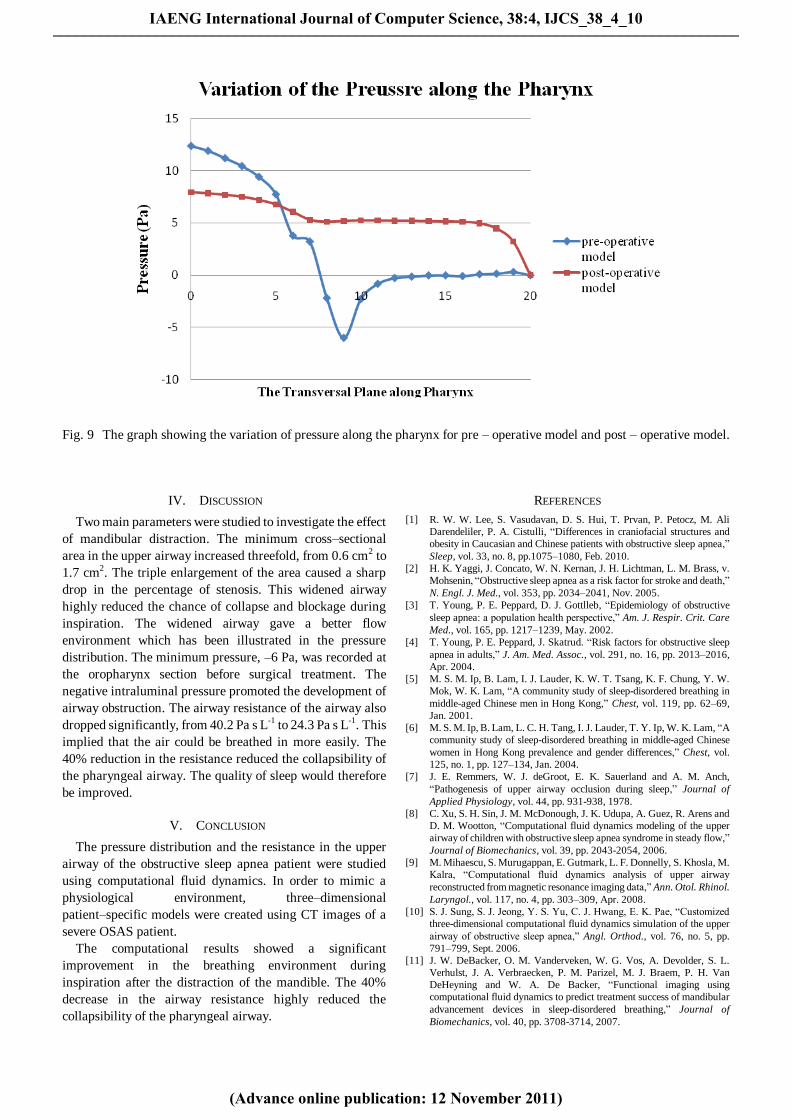
Fig. 9 The graph showing the variation of pressure along the pharynx for pre – operative model and post – operative model.
IV. DISCUSSION
Two main parameters were studied to investigate the effect
of mandibular distraction. The minimum cross–sectional
area in the upper airway increased threefold, from 0.6 cm2 to
1.7 cm2. The triple enlargement of the area caused a sharp
drop in the percentage of stenosis. This widened airway
highly reduced the chance of collapse and blockage during
inspiration. The widened airway gave a better flow
environment which has been illustrated in the pressure
distribution. The minimum pressure, –6 Pa, was recorded at
the oropharynx section before surgical treatment. The
negative intraluminal pressure promoted the development of
airway obstruction. The airway resistance of the airway also
dropped significantly, from 40.2 Pa s L-1 to 24.3 Pa s L-1. This
implied that the air could be breathed in more easily. The
40% reduction in the resistance reduced the collapsibility of
the pharyngeal airway. The quality of sleep would therefore
be improved.
V. CONCLUSION
The pressure distribution and the resistance in the upper
airway of the obstructive sleep apnea patient were studied
using computational fluid dynamics. In order to mimic a
physiological environment, three–dimensional
patient–specific models were created using CT images of a
severe OSAS patient.
The computational results showed a significant
improvement in the breathing environment during
inspiration after the distraction of the mandible. The 40%
decrease in the airway resistance highly reduced the
collapsibility of the pharyngeal airway.
REFERENCES
[1] R. W. W. Lee, S. Vasudavan, D. S. Hui, T. Prvan, P. Petocz, M. Ali
Darendeliler, P. A. Cistulli, ―Differences in craniofacial structures and
obesity in Caucasian and Chinese patients with obstructive sleep apnea,‖
Sleep, vol. 33, no. 8, pp.1075–1080, Feb. 2010.
[2] H. K. Yaggi, J. Concato, W. N. Kernan, J. H. Lichtman, L. M. Brass, v.
Mohsenin, ―Obstructive sleep apnea as a risk factor for stroke and death,‖
N. Engl. J. Med., vol. 353, pp. 2034–2041, Nov. 2005.
[3] T. Young, P. E. Peppard, D. J. Gottlleb, ―Epidemiology of obstructive
sleep apnea: a population health perspective,‖ Am. J. Respir. Crit. Care
Med., vol. 165, pp. 1217–1239, May. 2002.
[4] T. Young, P. E. Peppard, J. Skatrud. ―Risk factors for obstructive sleep
apnea in adults,‖ J. Am. Med. Assoc., vol. 291, no. 16, pp. 2013–2016,
Apr. 2004.
[5] M. S. M. Ip, B. Lam, I. J. Lauder, K. W. T. Tsang, K. F. Chung, Y. W.
Mok, W. K. Lam, ―A community study of sleep-disordered breathing in
middle-aged Chinese men in Hong Kong,‖ Chest, vol. 119, pp. 62–69,
Jan. 2001.
[6] M. S. M. Ip, B. Lam, L. C. H. Tang, I. J. Lauder, T. Y. Ip, W. K. Lam, ―A
community study of sleep-disordered breathing in middle-aged Chinese
women in Hong Kong prevalence and gender differences,‖ Chest, vol.
125, no. 1, pp. 127–134, Jan. 2004.
[7] J. E. Remmers, W. J. deGroot, E. K. Sauerland and A. M. Anch,
―Pathogenesis of upper airway occlusion during sleep,‖ Journal of
Applied Physiology, vol. 44, pp. 931-938, 1978.
[8] C. Xu, S. H. Sin, J. M. McDonough, J. K. Udupa, A. Guez, R. Arens and
D. M. Wootton, ―Computational fluid dynamics modeling of the upper
airway of children with obstructive sleep apnea syndrome in steady flow,‖
Journal of Biomechanics, vol. 39, pp. 2043-2054, 2006.
[9] M. Mihaescu, S. Murugappan, E. Gutmark, L. F. Donnelly, S. Khosla, M.
Kalra, ―Computational fluid dynamics analysis of upper airway
reconstructed from magnetic resonance imaging data,‖ Ann. Otol. Rhinol.
Laryngol., vol. 117, no. 4, pp. 303–309, Apr. 2008.
[10] S. J. Sung, S. J. Jeong, Y. S. Yu, C. J. Hwang, E. K. Pae, ―Customized
three-dimensional computational fluid dynamics simulation of the upper
airway of obstructive sleep apnea,‖ Angl. Orthod., vol. 76, no. 5, pp.
791–799, Sept. 2006.
[11] J. W. DeBacker, O. M. Vanderveken, W. G. Vos, A. Devolder, S. L.
Verhulst, J. A. Verbraecken, P. M. Parizel, M. J. Braem, P. H. Van
DeHeyning and W. A. De Backer, ―Functional imaging using
computational fluid dynamics to predict treatment success of mandibular
advancement devices in sleep-disordered breathing,‖ Journal of
Biomechanics, vol. 40, pp. 3708-3714, 2007.
IAENG International Journal of Computer Science, 38:4, IJCS_38_4_10
(Advance online publication: 12 November 2011)
______________________________________________________________________________________
[12] C. Van Holsbeke, J. DeBacker, W. Vos, P. Verdonck, P. Van Ransbeeck,
T. Claessens, M. Braem, O. Vanderveken and W. DeBacker,
―Anatomical and functional changes in the upper airways of sleep apnea
patients due to mandibular repositioning: a large scale study,‖ Journal of
Biomechanics, vol. 44, p. 442-449, 2011.
[13] C. C. Yu, H. D. Hsiao, L. C. Lee, C. M. Yao, N. H. Chen, C. J. Wang, Y.
R. Chen, ―Computational fluid dynamics study on obstructive sleep apnea
syndrome treated with maxillomandibular advancement,‖ Journal of
Craniofacial Surgery, vol. 20, no. 2, pp. 426–430, Mar. 2009.
[14] J. Huynh, K. B. Kim and M. McQuilling, ―Pharyngeal airflow analysis in
obstructive sleep apnea patients pre- and post- maxillomandibular
advancement surgery,‖ Journal of Fluids Engineering, vol. 131, 091101,
2009.
[15] J. W. De Backer, W. G. Vos, C. D. Gorlé, P. Germonpré, B. Partoens, F.
L. Wuyts, P. M. Parizel, W. De Backer, ―Flow analyses in the lower
airways: patient-specific model and boundary conditions,‖ Med. Eng. &
Phys., vol. 30, no. 7, pp. 872–879, Sept. 2008.
[16] Y. Fan, L. K. Cheung, M. M. Chong, K. W. Chow, C. H. Liu,
―Computational study on obstructive sleep apnea syndrome using
patient–specific Models,‖ Lecture Notes in Engineering and Computer
Science: Proceedings of The World Congress on Engineering 2011,
WCE 2011, 6-8 July, 2011, London, U.K., pp. 2632–2635.
IAENG International Journal of Computer Science, 38:4, IJCS_38_4_10
(Advance online publication: 12 November 2011)
______________________________________________________________________________________