Embed Size (px)
Citation preview
Computational Computational Methods in PhysicsMethods in Physics
PHYS 3437 PHYS 3437Dr Rob ThackerDr Rob Thacker
Dept of Astronomy & Physics Dept of Astronomy & Physics (MM-301C)(MM-301C)
[email protected]@ap.smu.ca
Today’s LectureToday’s Lecture VisualizationVisualization
Useful results to know about perception of informationUseful results to know about perception of information Help you to gain some of idea of “why that looks bad”Help you to gain some of idea of “why that looks bad”
How not to visualizeHow not to visualize Beginning using Opendx (more next lecture)Beginning using Opendx (more next lecture)
Sources for today’s lecture:Sources for today’s lecture: http://www.research.ibm.com/dx/proceedings/pravda/http://www.research.ibm.com/dx/proceedings/pravda/
truevis.htmtruevis.htm Spatial information & colour mapsSpatial information & colour maps
http://www2.sims.berkeley.edu/courses/is247/f05/http://www2.sims.berkeley.edu/courses/is247/f05/schedule.htmlschedule.html
Lectures by Marti HearstLectures by Marti Hearst http://www.cs.unb.ca/acrl/training/visual/macphee-http://www.cs.unb.ca/acrl/training/visual/macphee-
intro_to_visual/Intro_to_Visual.pptintro_to_visual/Intro_to_Visual.ppt Introduction to Opendx by Chris MacPheeIntroduction to Opendx by Chris MacPhee
Visualization as Visualization as computingcomputing
““Visualization is a method of computing. It Visualization is a method of computing. It transforms the symbolic into the geometric, transforms the symbolic into the geometric, enabling researchers to observe their enabling researchers to observe their simulations and computations. Visualization simulations and computations. Visualization offers a method for seeing the unseen. It offers a method for seeing the unseen. It enriches the process of scientific discovery enriches the process of scientific discovery and fosters profound and unexpected and fosters profound and unexpected insights. In many fields it is revolutionizing insights. In many fields it is revolutionizing the way scientists do science.”the way scientists do science.”
- Visualization in Scientific Computing, - Visualization in Scientific Computing,
ACM SIGGRAPH, 1987ACM SIGGRAPH, 1987
Why use Visualization?Why use Visualization?
““A picture says more than a thousand words.”A picture says more than a thousand words.”
““A picture says more than a thousand A picture says more than a thousand numbers.”numbers.”
““The purpose of [scientific] computing is The purpose of [scientific] computing is insight, not numbers.”insight, not numbers.”
- Dr. Richard Hamming, Naval Postgraduate School, - Dr. Richard Hamming, Naval Postgraduate School, CaliforniaCalifornia
““... half of the human brain is devoted directly ... half of the human brain is devoted directly or indirectly to vision ...”or indirectly to vision ...”
- Prof. Mriganka Sur, Brain and Cognative Sciences, - Prof. Mriganka Sur, Brain and Cognative Sciences, MITMIT
Visualization vs. Visualization vs. Analysis?Analysis?
Visualization is best applied to data mining and Visualization is best applied to data mining and data discoverydata discovery
Visualization tools are helpful for exploring Visualization tools are helpful for exploring hunches and presenting resultshunches and presenting results
Example: scatterplotsExample: scatterplots
Visualization is the WRONG primary tool when Visualization is the WRONG primary tool when the goal is to find a good model in a complex the goal is to find a good model in a complex situationsituation May provide hints but won’t provide concrete answersMay provide hints but won’t provide concrete answers Model building requires insight into the problem at Model building requires insight into the problem at
handhand
Value of visualization for Value of visualization for the cynical!the cynical!
““Conclude your technical Conclude your technical presentation and roll the presentation and roll the [videotape]. Audiences love razzle-[videotape]. Audiences love razzle-dazzle color graphics, and this dazzle color graphics, and this material often helps deflect attention material often helps deflect attention from the substantive technical from the substantive technical issues.”issues.”
David Bailey, NERSC
Simulation of Hurricane Simulation of Hurricane Earl (1998)Earl (1998)
Preattentive ProcessingPreattentive Processing
A limited set of visual properties are A limited set of visual properties are processed preattentivelyprocessed preattentively without need for focusing attentionwithout need for focusing attention Note, this is critical in web-site designNote, this is critical in web-site design
4 seconds before user decides they don’t understand 4 seconds before user decides they don’t understand the page…the page…
Important for design of visualizationsImportant for design of visualizations what can be perceived immediatelywhat can be perceived immediately
Does the viewer get the information without Does the viewer get the information without having to consciously process the image?having to consciously process the image?
what properties are good discriminators?what properties are good discriminators?
Pre-attentive ProcessingPre-attentive Processing
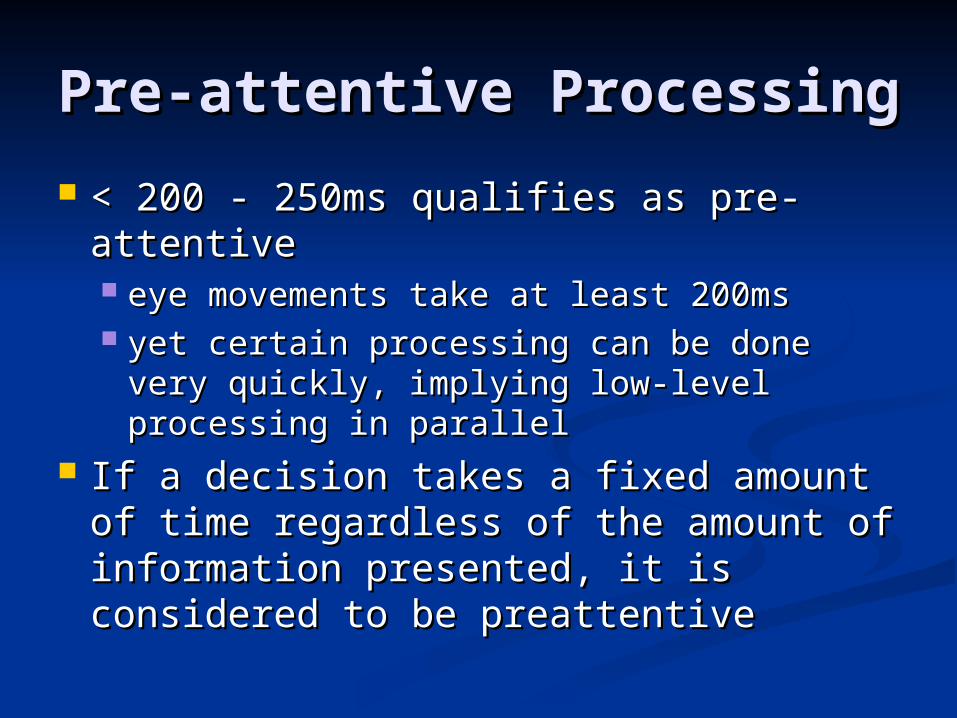
< 200 - 250ms qualifies as pre-attentive< 200 - 250ms qualifies as pre-attentive eye movements take at least 200mseye movements take at least 200ms yet certain processing can be done very yet certain processing can be done very
quickly, implying low-level processing in quickly, implying low-level processing in parallelparallel
If a decision takes a fixed amount of If a decision takes a fixed amount of time regardless of the amount of time regardless of the amount of information presented, it is considered information presented, it is considered to be preattentiveto be preattentive
Example: Color Example: Color SelectionSelection
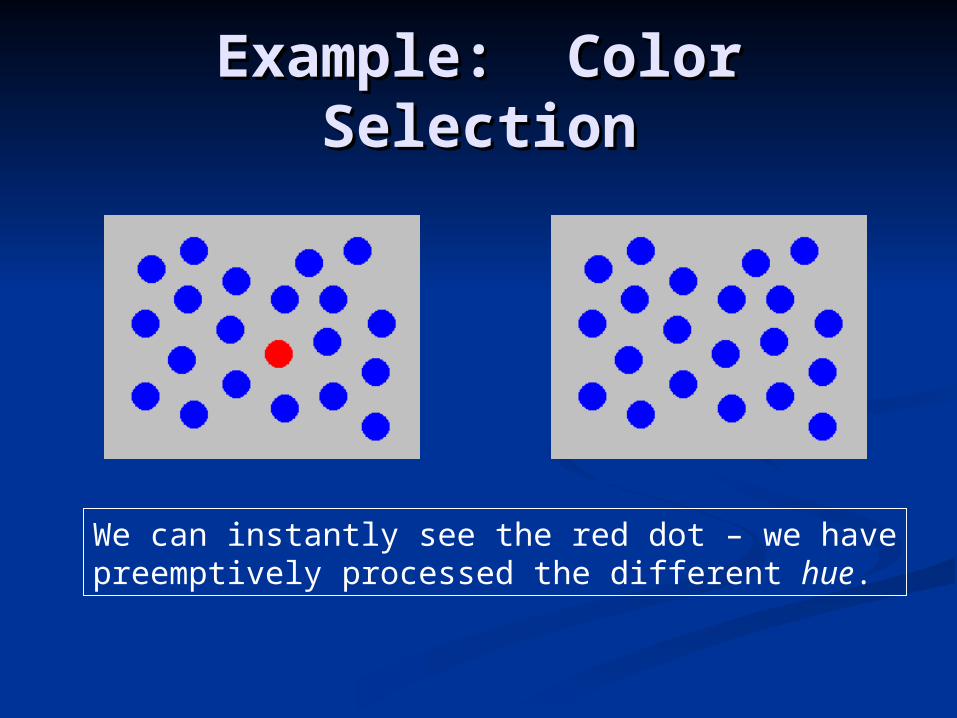
We can instantly see the red dot – we havepreemptively processed the different hue.
Example: Shape Example: Shape SelectionSelection
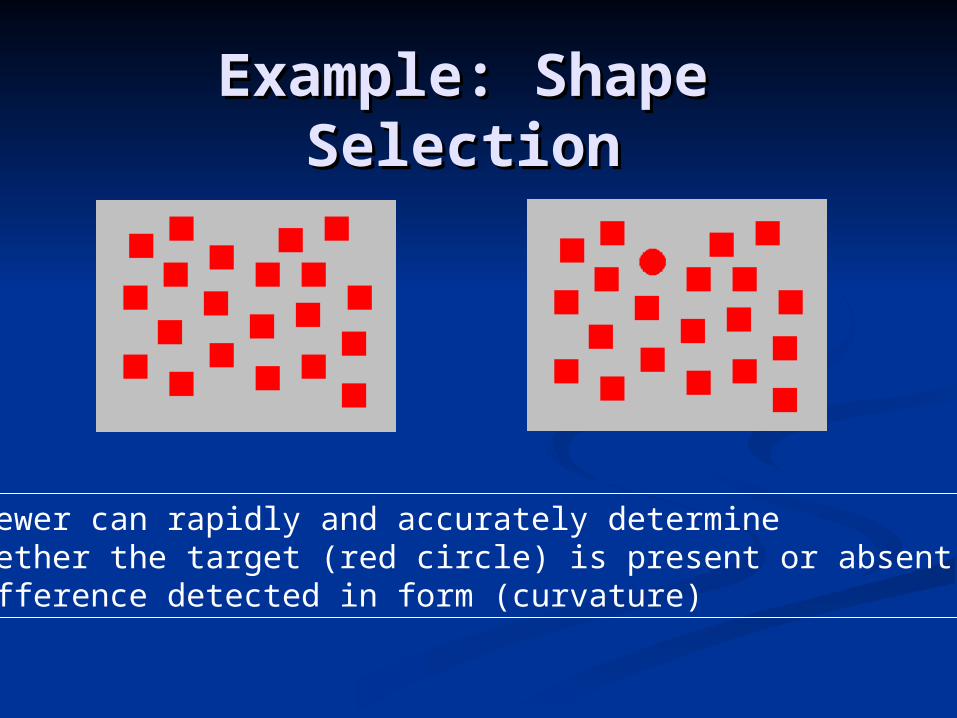
Viewer can rapidly and accurately determinewhether the target (red circle) is present or absent.Difference detected in form (curvature)

Example: Conjunction Example: Conjunction of Featuresof Features
Finding the target (red circle) requires that we sequentiallysearch through the image. We can’t rapidly (or accurately)determine the presence of the target when there are twoor more features that differentiate it from the remaininginformation (distractors).

Example: Emergent Example: Emergent FeaturesFeatures
Despite being constructed from similar componentsto the distractors, the unique feature of the target(open sides) allows us to process its presencepreattentively.
Example: Emergent Example: Emergent FeaturesFeatures
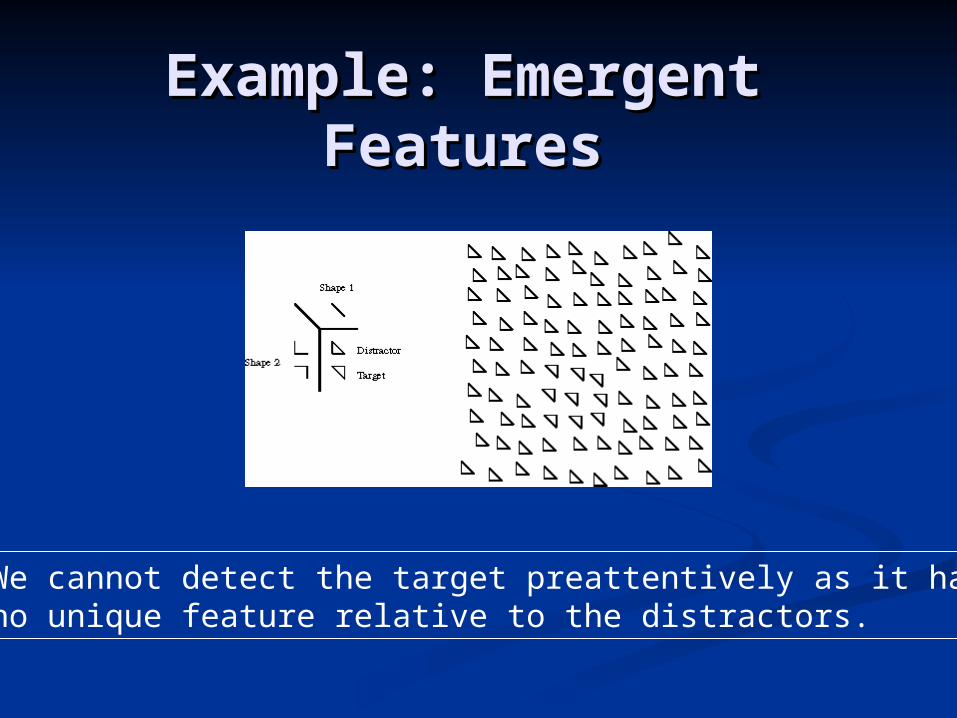
We cannot detect the target preattentively as it hasno unique feature relative to the distractors.
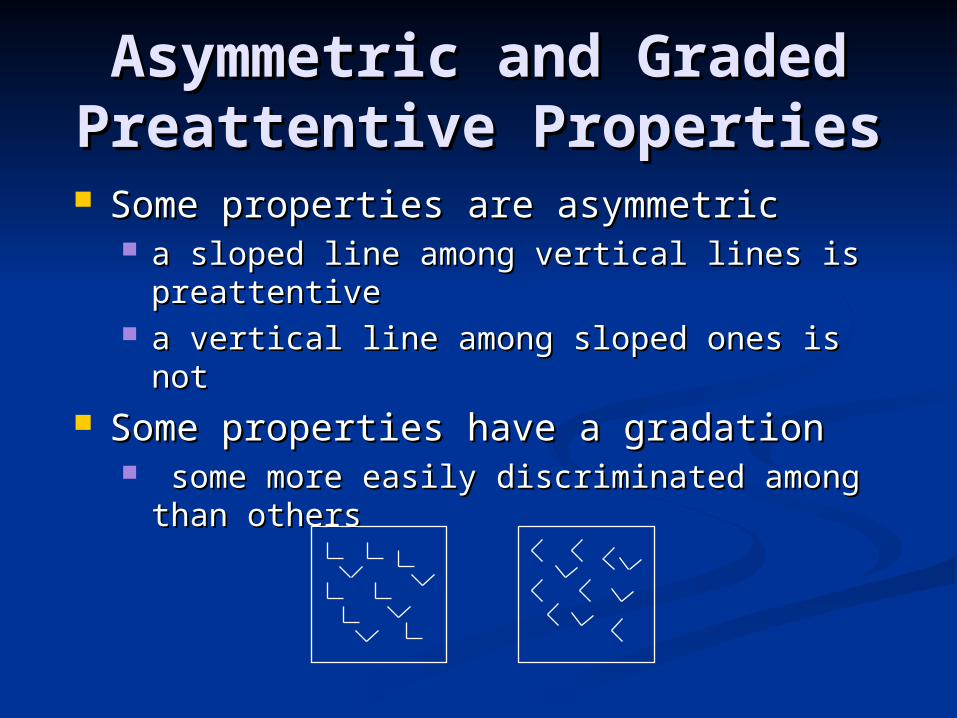
Asymmetric and Graded Asymmetric and Graded Preattentive PropertiesPreattentive Properties
Some properties are asymmetricSome properties are asymmetric a sloped line among vertical lines is a sloped line among vertical lines is
preattentivepreattentive a vertical line among sloped ones is nota vertical line among sloped ones is not
Some properties have a gradationSome properties have a gradation some more easily discriminated among some more easily discriminated among
than othersthan others
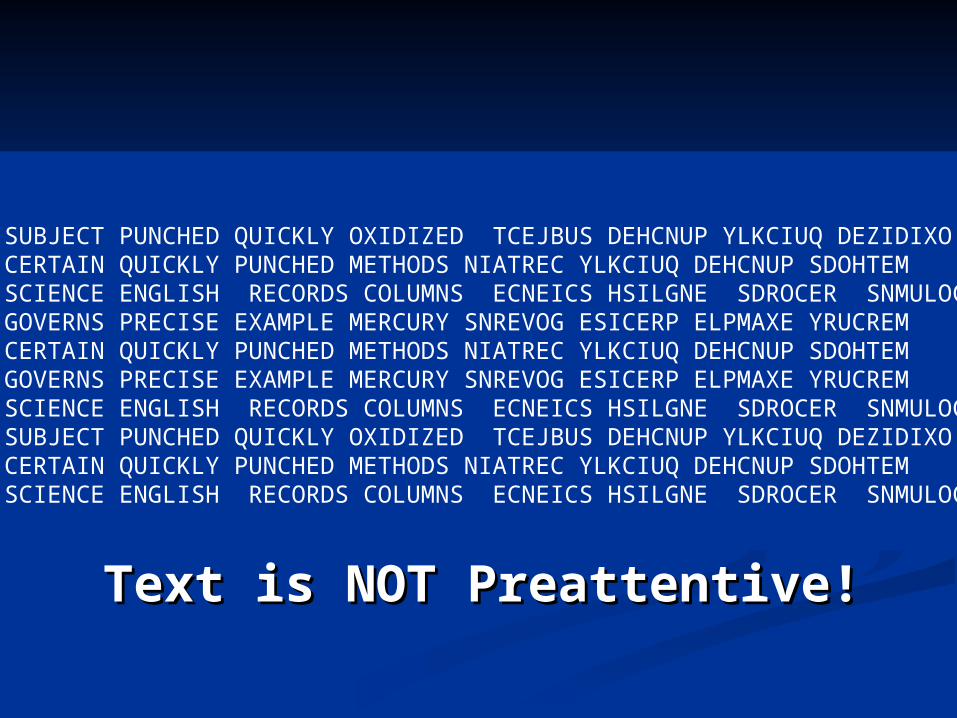
SUBJECT PUNCHED QUICKLY OXIDIZED TCEJBUS DEHCNUP YLKCIUQ DEZIDIXOCERTAIN QUICKLY PUNCHED METHODS NIATREC YLKCIUQ DEHCNUP SDOHTEMSCIENCE ENGLISH RECORDS COLUMNS ECNEICS HSILGNE SDROCER SNMULOCGOVERNS PRECISE EXAMPLE MERCURY SNREVOG ESICERP ELPMAXE YRUCREMCERTAIN QUICKLY PUNCHED METHODS NIATREC YLKCIUQ DEHCNUP SDOHTEMGOVERNS PRECISE EXAMPLE MERCURY SNREVOG ESICERP ELPMAXE YRUCREMSCIENCE ENGLISH RECORDS COLUMNS ECNEICS HSILGNE SDROCER SNMULOCSUBJECT PUNCHED QUICKLY OXIDIZED TCEJBUS DEHCNUP YLKCIUQ DEZIDIXOCERTAIN QUICKLY PUNCHED METHODS NIATREC YLKCIUQ DEHCNUP SDOHTEMSCIENCE ENGLISH RECORDS COLUMNS ECNEICS HSILGNE SDROCER SNMULOC
Text is NOT Preattentive!Text is NOT Preattentive!
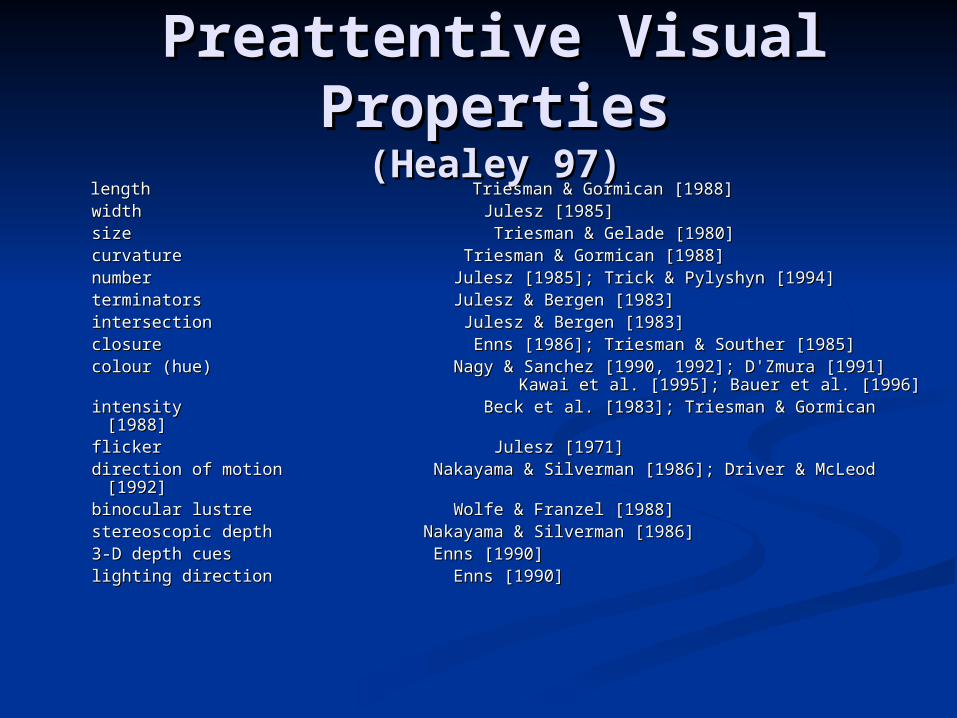
Preattentive Visual Preattentive Visual PropertiesProperties
(Healey 97)(Healey 97) length Triesman & Gormican [1988]length Triesman & Gormican [1988] width Julesz [1985]width Julesz [1985] size Triesman & Gelade [1980]size Triesman & Gelade [1980] curvature Triesman & Gormican [1988]curvature Triesman & Gormican [1988] number Julesz [1985]; Trick & Pylyshyn [1994]number Julesz [1985]; Trick & Pylyshyn [1994] terminators Julesz & Bergen [1983]terminators Julesz & Bergen [1983] intersection Julesz & Bergen [1983]intersection Julesz & Bergen [1983] closure Enns [1986]; Triesman & Souther [1985]closure Enns [1986]; Triesman & Souther [1985] colour (hue) Nagy & Sanchez [1990, 1992]; D'Zmura [1991] colour (hue) Nagy & Sanchez [1990, 1992]; D'Zmura [1991]
Kawai et al. [1995]; Bauer et al. [1996] Kawai et al. [1995]; Bauer et al. [1996] intensity Beck et al. [1983]; Triesman & Gormican [1988]intensity Beck et al. [1983]; Triesman & Gormican [1988] flicker Julesz [1971]flicker Julesz [1971] direction of motion Nakayama & Silverman [1986]; Driver & McLeod [1992]direction of motion Nakayama & Silverman [1986]; Driver & McLeod [1992] binocular lustre Wolfe & Franzel [1988]binocular lustre Wolfe & Franzel [1988] stereoscopic depth Nakayama & Silverman [1986]stereoscopic depth Nakayama & Silverman [1986] 3-D depth cues Enns [1990]3-D depth cues Enns [1990] lighting direction Enns [1990]lighting direction Enns [1990]
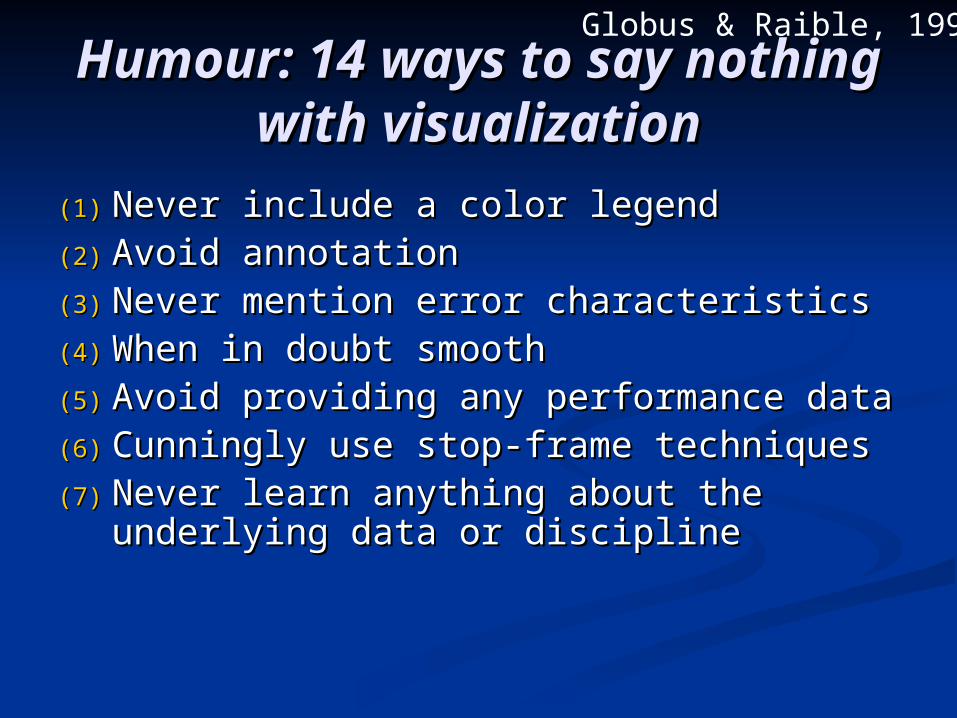
Humour: 14 ways to say Humour: 14 ways to say nothing with visualizationnothing with visualization
(1)(1) Never include a color legendNever include a color legend(2)(2) Avoid annotationAvoid annotation(3)(3) Never mention error characteristicsNever mention error characteristics(4)(4) When in doubt smoothWhen in doubt smooth(5)(5) Avoid providing any performance dataAvoid providing any performance data(6)(6) Cunningly use stop-frame techniquesCunningly use stop-frame techniques(7)(7) Never learn anything about the Never learn anything about the
underlying data or disciplineunderlying data or discipline
Globus & Raible, 1994
Humour: 14 ways to say Humour: 14 ways to say nothing with visualization - nothing with visualization -
22(8) Never provide contrasting visualizations to other (8) Never provide contrasting visualizations to other
datadata(9) Always ensure you develop your own new tool (9) Always ensure you develop your own new tool
and disregard others as out-dated and out-modedand disregard others as out-dated and out-moded(10) Don’t cite references for data(10) Don’t cite references for data(11) Claim generality but only ever show results (11) Claim generality but only ever show results
from one data setfrom one data set(12) Use viewing angle to hide unwanted (12) Use viewing angle to hide unwanted
informationinformation(13) If something can’t be hidden by choosing an (13) If something can’t be hidden by choosing an
angle, use shadowsangle, use shadows(14) “This is (14) “This is easilyeasily extended to 3d!” extended to 3d!”
Representing different Representing different types of datatypes of data
Nominal dataNominal data Data is put into categories with no implicit orderingData is put into categories with no implicit ordering
e.g. red and blue carse.g. red and blue cars Should be represented by distinguishably different objects Should be represented by distinguishably different objects
without any perceived orderingwithout any perceived ordering Ordinal dataOrdinal data
Data is put into categories that have an implied ordering Data is put into categories that have an implied ordering structurestructure
e.g. A,B,C.. grades in a classe.g. A,B,C.. grades in a class Should be represented by distinguishably different objects Should be represented by distinguishably different objects
with a perceived orderingwith a perceived ordering Interval dataInterval data
Data is not categorized and is instead described by a Data is not categorized and is instead described by a numeric systemnumeric system
e.g. temperatures, most scientific datae.g. temperatures, most scientific data Equal steps in data value should appear as steps of equal Equal steps in data value should appear as steps of equal
perceived magnitude in the representation perceived magnitude in the representation
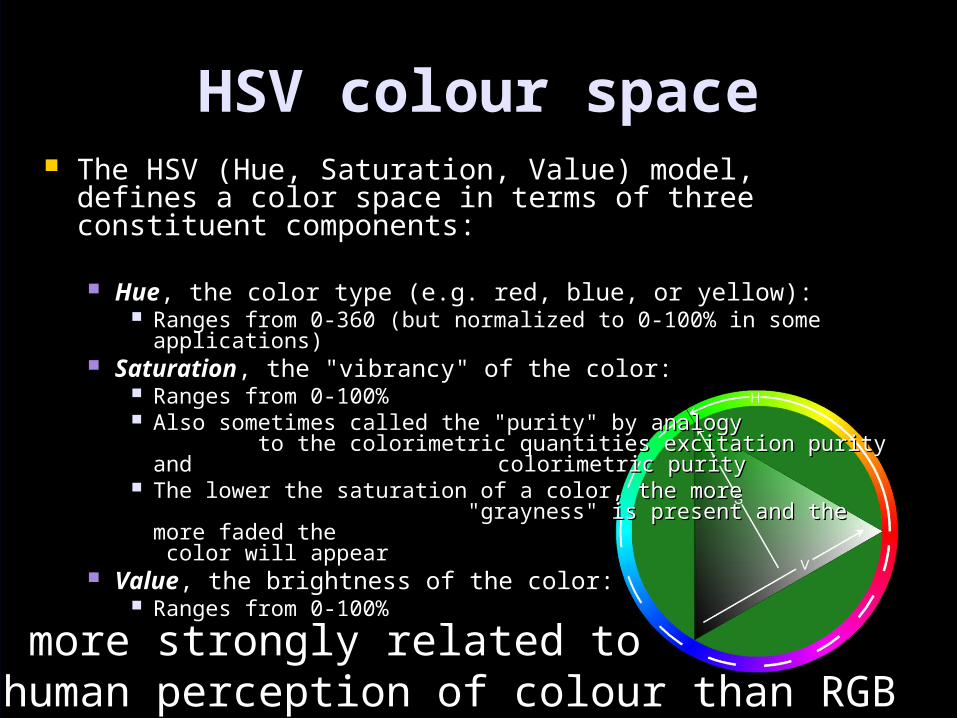
HSV colour spaceHSV colour space The HSV (Hue, Saturation, Value) model, defines The HSV (Hue, Saturation, Value) model, defines
a color space in terms of three constituent a color space in terms of three constituent components:components:
HueHue, the color type (e.g. red, blue, or yellow):, the color type (e.g. red, blue, or yellow): Ranges from 0-360 (but normalized to 0-100% in some Ranges from 0-360 (but normalized to 0-100% in some
applications)applications) SaturationSaturation, the "vibrancy" of the color:, the "vibrancy" of the color:
Ranges from 0-100%Ranges from 0-100% Also sometimes called the "purity" by analogy Also sometimes called the "purity" by analogy
to the colorimetric quantities to the colorimetric quantities excitation purity and excitation purity and colorimetric purity colorimetric purity
The lower the saturation of a color, the more The lower the saturation of a color, the more "grayness" is present and the more faded the "grayness" is present and the more faded the color will appear color will appear
ValueValue, the brightness of the color:, the brightness of the color: Ranges from 0-100%Ranges from 0-100%
Much more strongly related tothe human perception of colour than RGB
Colour mapsColour maps
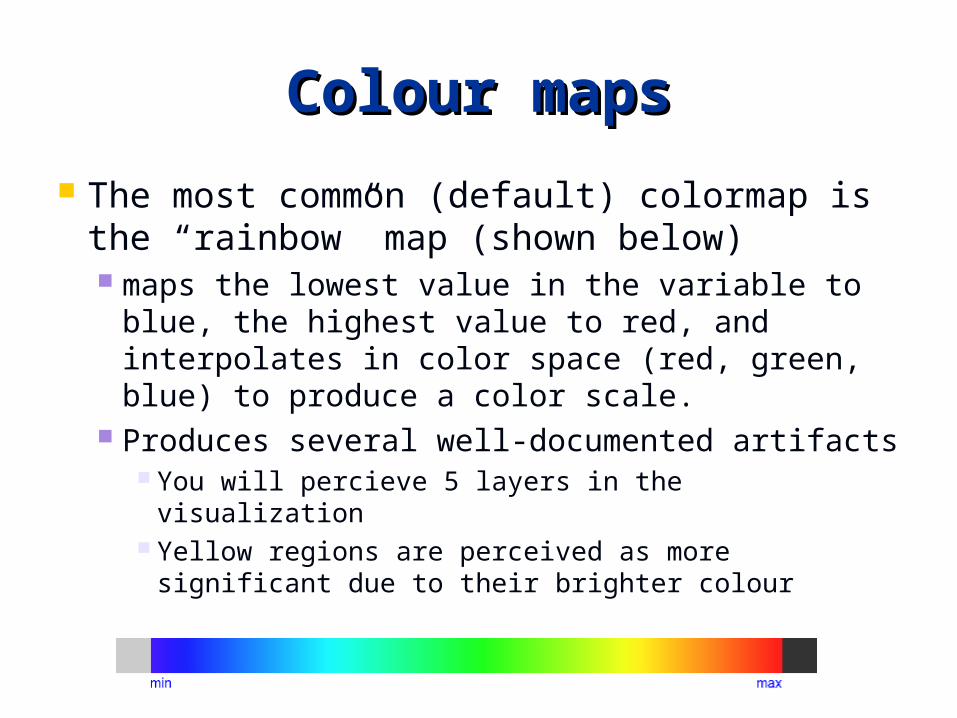
The most common (default) colormap is the “rainbow” map (shown below) maps the lowest value in the variable to
blue, the highest value to red, and interpolates in color space (red, green, blue) to produce a color scale.
Produces several well-documented artifacts You will percieve 5 layers in the visualization Yellow regions are perceived as more significant
due to their brighter colour
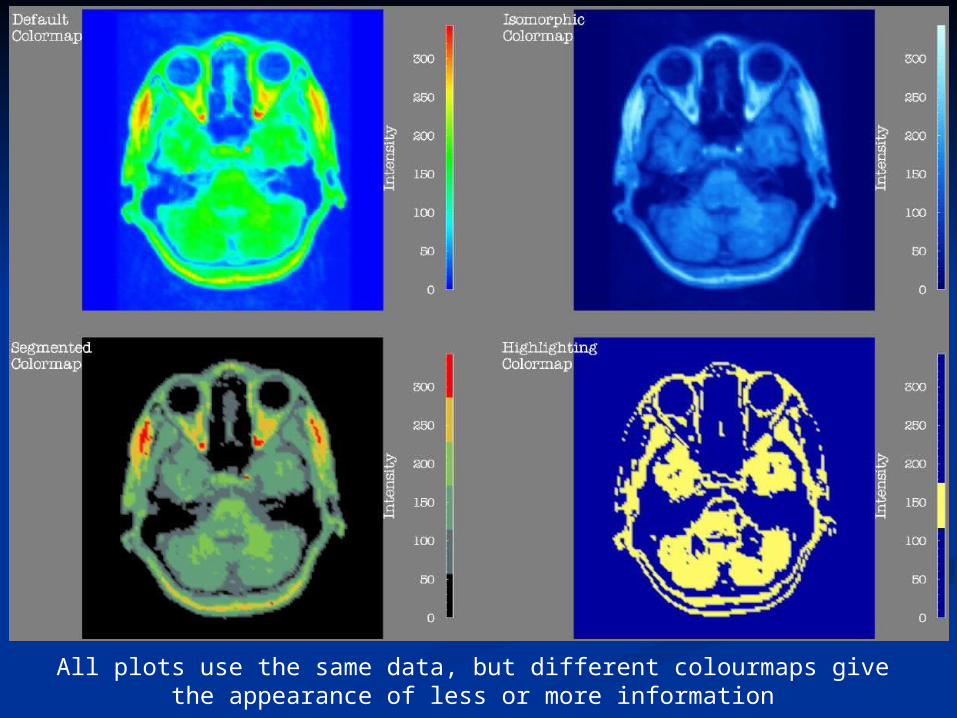
All plots use the same data, but different colourmaps givethe appearance of less or more information
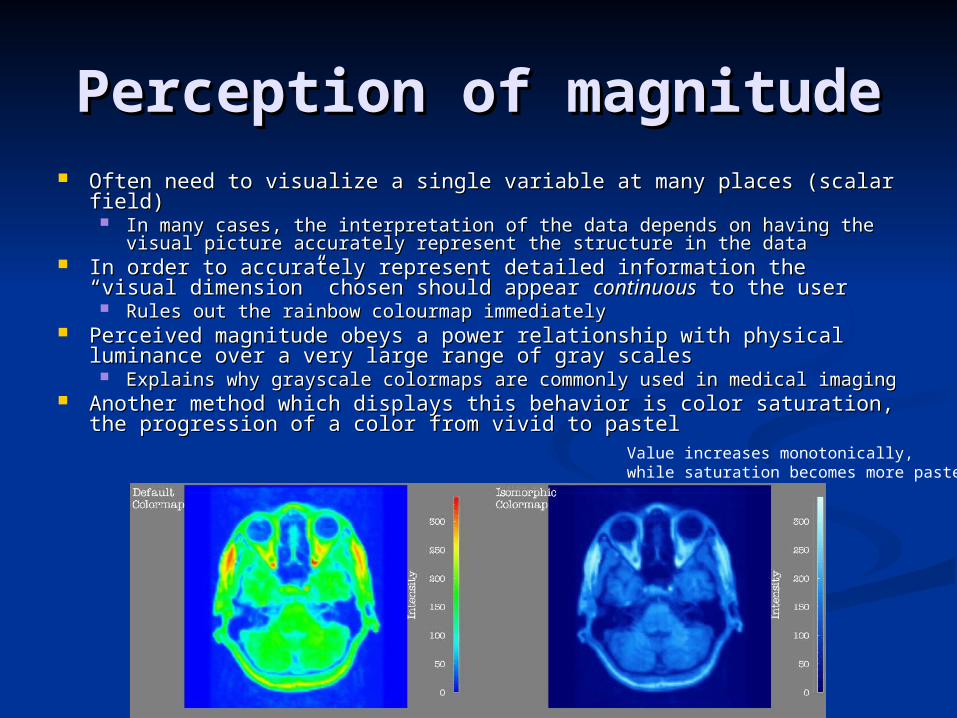
Perception of magnitudePerception of magnitude Often need to visualize a single variable at many places (scalar field)Often need to visualize a single variable at many places (scalar field)
In many cases, the interpretation of the data depends on having the visual In many cases, the interpretation of the data depends on having the visual picture accurately represent the structure in the data picture accurately represent the structure in the data
In order to accurately represent detailed information the “visual In order to accurately represent detailed information the “visual dimension” chosen should appear dimension” chosen should appear continuouscontinuous to the user to the user
Rules out the rainbow colourmap immediatelyRules out the rainbow colourmap immediately Perceived magnitude obeys a power relationship with physical Perceived magnitude obeys a power relationship with physical
luminance over a very large range of gray scalesluminance over a very large range of gray scales Explains why grayscale colormaps are commonly used in medical imaging Explains why grayscale colormaps are commonly used in medical imaging
Another method which displays this behavior is color saturation, the Another method which displays this behavior is color saturation, the progression of a color from vivid to pastel progression of a color from vivid to pastel
Value increases monotonically,while saturation becomes more pastel
Perception of spatial Perception of spatial frequencyfrequency
The value component in a color (the The value component in a color (the brightness/darkness component) is critical brightness/darkness component) is critical for carrying information about for carrying information about high spatial high spatial frequencyfrequency variations in the data variations in the data If the colour map does not contain a monotonic If the colour map does not contain a monotonic
value variation, fine resolution information will value variation, fine resolution information will not be seennot be seen
The saturation and hue components in color The saturation and hue components in color are critical for carrying information about are critical for carrying information about low spatial frequencylow spatial frequency variations in the data variations in the data A colour map which only varies in luminance A colour map which only varies in luminance
(e.g., a grayscale image) cannot adequately (e.g., a grayscale image) cannot adequately communicate information about gradual changes communicate information about gradual changes in the spatial structure of the data in the spatial structure of the data
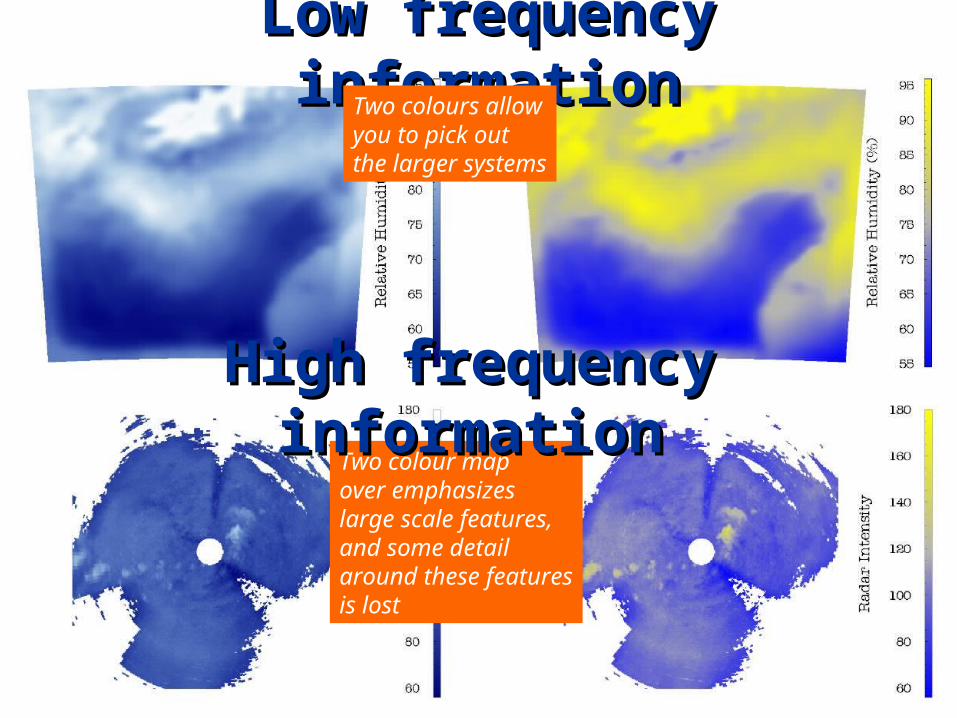
Low frequency Low frequency informationinformationTwo colours allow
you to pick outthe larger systems
Two colour mapover emphasizeslarge scale features,and some detail around these featuresis lost
High frequency High frequency informationinformation
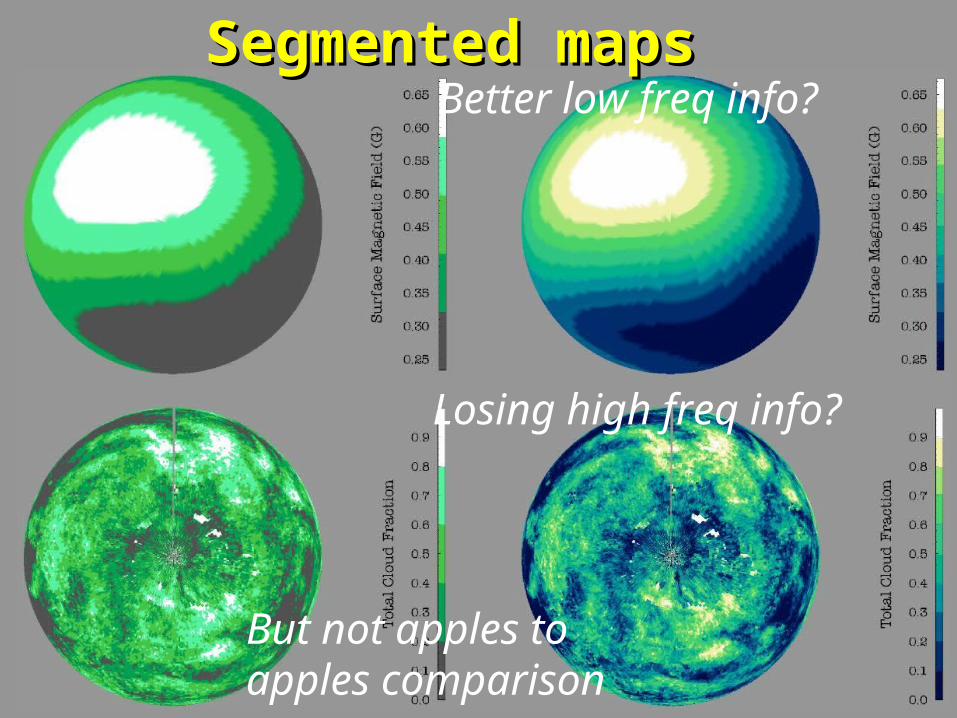
Segmented mapsSegmented maps
Losing high freq info?
Better low freq info?
But not apples toapples comparison
Key Questions to Ask about a Key Questions to Ask about a VizViz
1.1. Is it for analysis or presentation?Is it for analysis or presentation?
2.2. What does it teach/show/elucidate?What does it teach/show/elucidate?
3.3. What is the key contribution?What is the key contribution?
4.4. What are some compelling, What are some compelling, usefuluseful examples?examples?
5.5. Could it have been done more simply?Could it have been done more simply?
6.6. Have there been usability studies Have there been usability studies done? What do they show?done? What do they show?
Are we just limited to Are we just limited to 3d?3d?
A visualization can use x, y, and z to represent A visualization can use x, y, and z to represent the spatial dimensions of an objectthe spatial dimensions of an object color can be mapped onto a surface representing a color can be mapped onto a surface representing a
fourthfourth the surface can be deformed according to a fifththe surface can be deformed according to a fifth isocontour lines can represent a sixthisocontour lines can represent a sixth coloring them can represent a seventhcoloring them can represent a seventh glyphs on the surface can represent a few more, not to glyphs on the surface can represent a few more, not to
mention animation, transparency, and stereomention animation, transparency, and stereo This great flexibility, however, can open a This great flexibility, however, can open a
Pandora's box of problems for the user,Pandora's box of problems for the user, can easily give rise to visual representations which do can easily give rise to visual representations which do
not adequately represent the structure in the data or not adequately represent the structure in the data or which introduce misleading visual artifactswhich introduce misleading visual artifacts
Public domain viz toolsPublic domain viz tools While there are a host of public domain While there are a host of public domain
tools, the two most popular are probablytools, the two most popular are probably VTK – The Visualization toolkitVTK – The Visualization toolkit
http://www.vtk.org/http://www.vtk.org/ Mid-level library that requires you construct scripts Mid-level library that requires you construct scripts
(Tcl-Tk) to run your visualization(Tcl-Tk) to run your visualization Very powerful, allows you to wrap visualization code Very powerful, allows you to wrap visualization code
in with your own C++in with your own C++ Drawback – fairly steep learning curveDrawback – fairly steep learning curve
OpendxOpendx Freely available, packaged visualization program (as Freely available, packaged visualization program (as
opposed to library)opposed to library) Quick to get going with, so we’ll use it in this courseQuick to get going with, so we’ll use it in this course
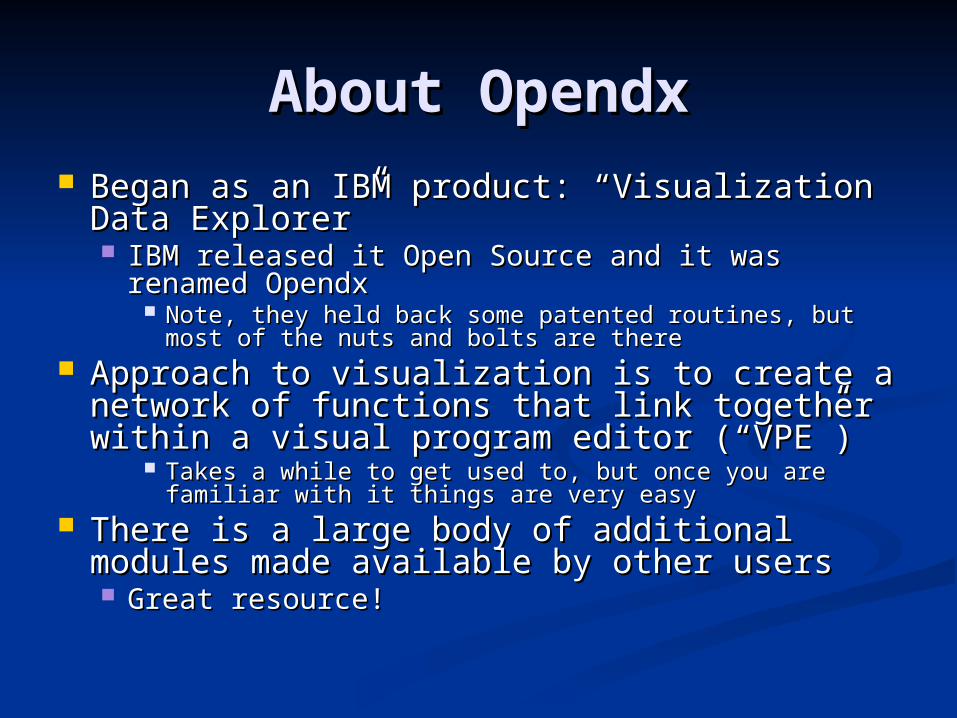
About OpendxAbout Opendx Began as an IBM product: “Visualization Began as an IBM product: “Visualization
Data Explorer”Data Explorer” IBM released it Open Source and it was IBM released it Open Source and it was
renamed Opendxrenamed Opendx Note, they held back some patented routines, but most Note, they held back some patented routines, but most
of the nuts and bolts are thereof the nuts and bolts are there Approach to visualization is to create a Approach to visualization is to create a
network of functions that link together network of functions that link together within a visual program editor (“VPE”)within a visual program editor (“VPE”)
Takes a while to get used to, but once you are familiar Takes a while to get used to, but once you are familiar with it things are very easywith it things are very easy
There is a large body of additional modules There is a large body of additional modules made available by other usersmade available by other users Great resource!Great resource!
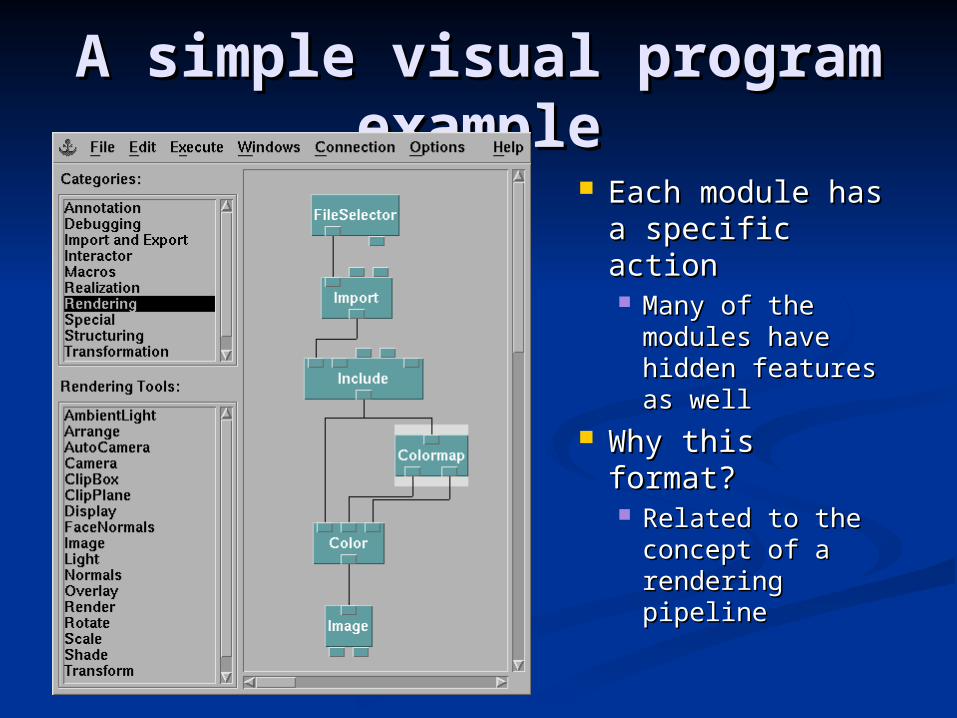
A simple visual program A simple visual program exampleexample
Each module has Each module has a specific actiona specific action Many of the Many of the
modules have modules have hidden features hidden features as wellas well
Why this format?Why this format? Related to the Related to the
concept of a concept of a rendering rendering pipelinepipeline
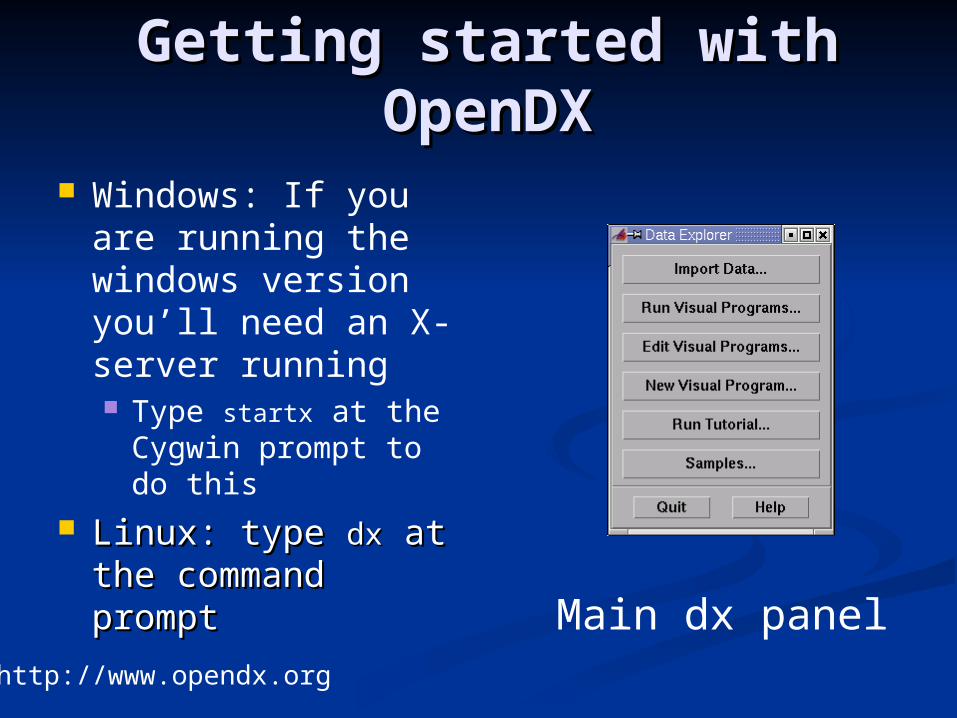
Getting started with Getting started with OpenDXOpenDX
Windows: If you are running the windows version you’ll need an X-server running Type startx at the
Cygwin prompt to do this
Linux: type Linux: type dxdx at at the command the command prompt prompt Main dx panel
http://www.opendx.org
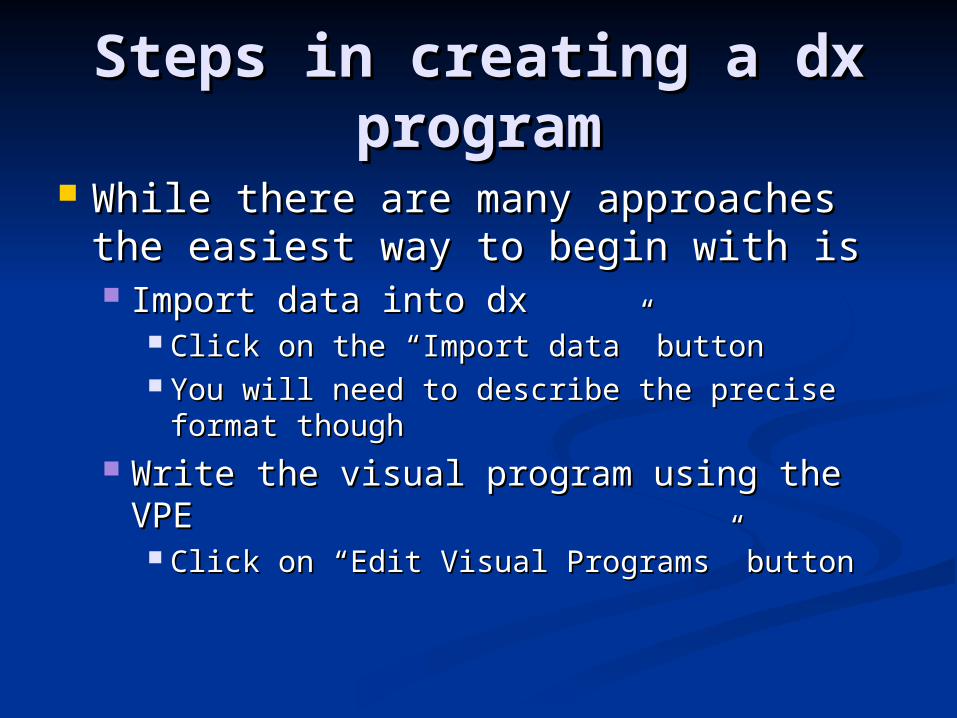
Steps in creating a dx Steps in creating a dx programprogram
While there are many approaches While there are many approaches the easiest way to begin with isthe easiest way to begin with is Import data into dxImport data into dx
Click on the “Import data” buttonClick on the “Import data” button You will need to describe the precise format You will need to describe the precise format
thoughthough Write the visual program using the VPEWrite the visual program using the VPE
Click on “Edit Visual Programs” buttonClick on “Edit Visual Programs” button
Opendx exampleOpendx example
If time…If time…
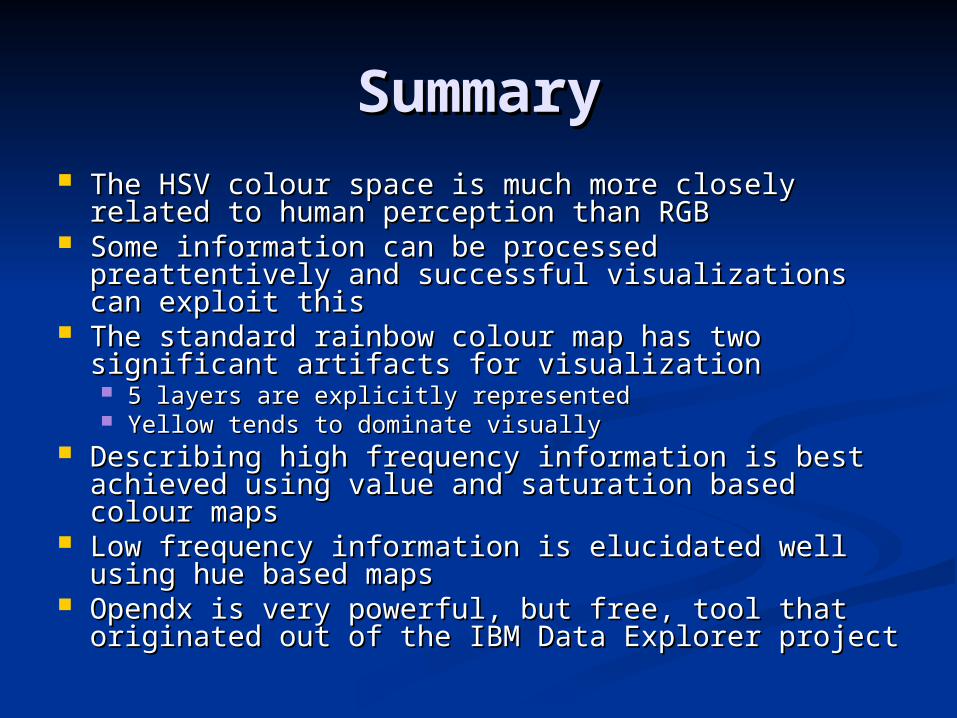
SummarySummary The HSV colour space is much more closely The HSV colour space is much more closely
related to human perception than RGBrelated to human perception than RGB Some information can be processed preattentively Some information can be processed preattentively
and successful visualizations can exploit this and successful visualizations can exploit this The standard rainbow colour map has two The standard rainbow colour map has two
significant artifacts for visualizationsignificant artifacts for visualization 5 layers are explicitly represented5 layers are explicitly represented Yellow tends to dominate visuallyYellow tends to dominate visually
Describing high frequency information is best Describing high frequency information is best achieved using value and saturation based colour achieved using value and saturation based colour mapsmaps
Low frequency information is elucidated well Low frequency information is elucidated well using hue based mapsusing hue based maps
Opendx is very powerful, but free, tool that Opendx is very powerful, but free, tool that originated out of the IBM Data Explorer projectoriginated out of the IBM Data Explorer project
Next lectureNext lecture
Visualization & data representationVisualization & data representation More on OpendxMore on Opendx 3d visualization methods3d visualization methods
IsosurfacesIsosurfaces Volume renderingVolume rendering