Embed Size (px)
Citation preview
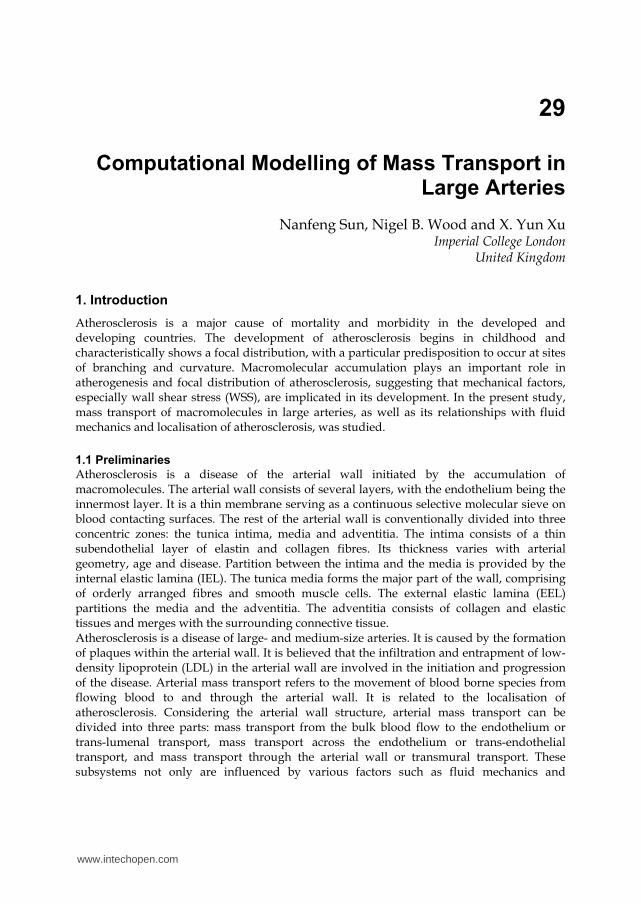
29
Computational Modelling of Mass Transport in Large Arteries
Nanfeng Sun, Nigel B. Wood and X. Yun Xu Imperial College London
United Kingdom
1. Introduction
Atherosclerosis is a major cause of mortality and morbidity in the developed and developing countries. The development of atherosclerosis begins in childhood and characteristically shows a focal distribution, with a particular predisposition to occur at sites of branching and curvature. Macromolecular accumulation plays an important role in atherogenesis and focal distribution of atherosclerosis, suggesting that mechanical factors, especially wall shear stress (WSS), are implicated in its development. In the present study, mass transport of macromolecules in large arteries, as well as its relationships with fluid mechanics and localisation of atherosclerosis, was studied.
1.1 Preliminaries
Atherosclerosis is a disease of the arterial wall initiated by the accumulation of macromolecules. The arterial wall consists of several layers, with the endothelium being the innermost layer. It is a thin membrane serving as a continuous selective molecular sieve on blood contacting surfaces. The rest of the arterial wall is conventionally divided into three concentric zones: the tunica intima, media and adventitia. The intima consists of a thin subendothelial layer of elastin and collagen fibres. Its thickness varies with arterial geometry, age and disease. Partition between the intima and the media is provided by the internal elastic lamina (IEL). The tunica media forms the major part of the wall, comprising of orderly arranged fibres and smooth muscle cells. The external elastic lamina (EEL) partitions the media and the adventitia. The adventitia consists of collagen and elastic tissues and merges with the surrounding connective tissue. Atherosclerosis is a disease of large- and medium-size arteries. It is caused by the formation of plaques within the arterial wall. It is believed that the infiltration and entrapment of low-density lipoprotein (LDL) in the arterial wall are involved in the initiation and progression of the disease. Arterial mass transport refers to the movement of blood borne species from flowing blood to and through the arterial wall. It is related to the localisation of atherosclerosis. Considering the arterial wall structure, arterial mass transport can be divided into three parts: mass transport from the bulk blood flow to the endothelium or trans-lumenal transport, mass transport across the endothelium or trans-endothelial transport, and mass transport through the arterial wall or transmural transport. These subsystems not only are influenced by various factors such as fluid mechanics and
www.intechopen.com
Recent Advances in Modelling and Simulation
556
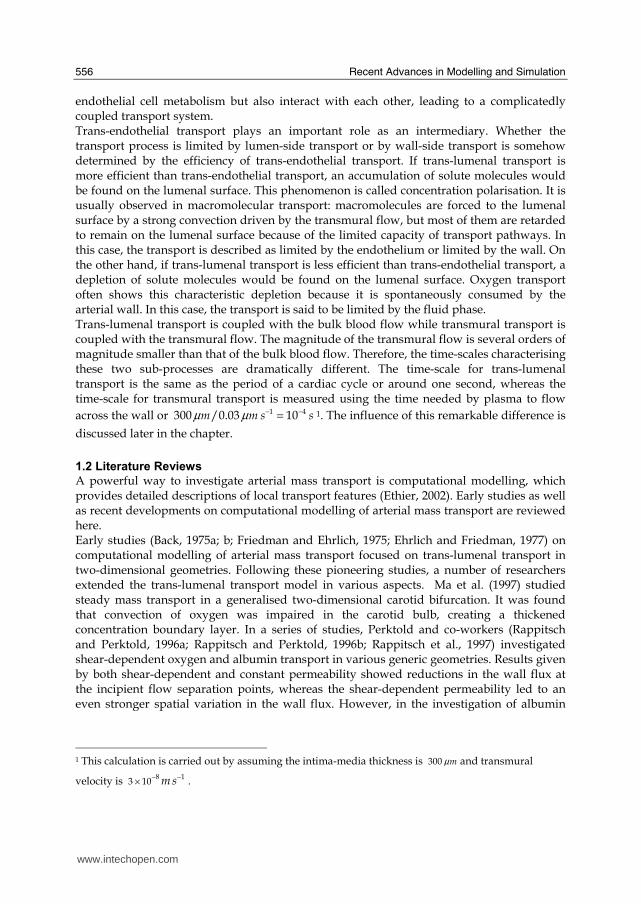
endothelial cell metabolism but also interact with each other, leading to a complicatedly coupled transport system. Trans-endothelial transport plays an important role as an intermediary. Whether the transport process is limited by lumen-side transport or by wall-side transport is somehow determined by the efficiency of trans-endothelial transport. If trans-lumenal transport is more efficient than trans-endothelial transport, an accumulation of solute molecules would be found on the lumenal surface. This phenomenon is called concentration polarisation. It is usually observed in macromolecular transport: macromolecules are forced to the lumenal surface by a strong convection driven by the transmural flow, but most of them are retarded to remain on the lumenal surface because of the limited capacity of transport pathways. In this case, the transport is described as limited by the endothelium or limited by the wall. On the other hand, if trans-lumenal transport is less efficient than trans-endothelial transport, a depletion of solute molecules would be found on the lumenal surface. Oxygen transport often shows this characteristic depletion because it is spontaneously consumed by the arterial wall. In this case, the transport is said to be limited by the fluid phase. Trans-lumenal transport is coupled with the bulk blood flow while transmural transport is coupled with the transmural flow. The magnitude of the transmural flow is several orders of magnitude smaller than that of the bulk blood flow. Therefore, the time-scales characterising these two sub-processes are dramatically different. The time-scale for trans-lumenal transport is the same as the period of a cardiac cycle or around one second, whereas the time-scale for transmural transport is measured using the time needed by plasma to flow
across the wall or µ µ − −=1 4300 /0.03 10m m s s 1. The influence of this remarkable difference is
discussed later in the chapter.
1.2 Literature Reviews
A powerful way to investigate arterial mass transport is computational modelling, which provides detailed descriptions of local transport features (Ethier, 2002). Early studies as well as recent developments on computational modelling of arterial mass transport are reviewed here. Early studies (Back, 1975a; b; Friedman and Ehrlich, 1975; Ehrlich and Friedman, 1977) on computational modelling of arterial mass transport focused on trans-lumenal transport in two-dimensional geometries. Following these pioneering studies, a number of researchers extended the trans-lumenal transport model in various aspects. Ma et al. (1997) studied steady mass transport in a generalised two-dimensional carotid bifurcation. It was found that convection of oxygen was impaired in the carotid bulb, creating a thickened concentration boundary layer. In a series of studies, Perktold and co-workers (Rappitsch and Perktold, 1996a; Rappitsch and Perktold, 1996b; Rappitsch et al., 1997) investigated shear-dependent oxygen and albumin transport in various generic geometries. Results given by both shear-dependent and constant permeability showed reductions in the wall flux at the incipient flow separation points, whereas the shear-dependent permeability led to an even stronger spatial variation in the wall flux. However, in the investigation of albumin
1 This calculation is carried out by assuming the intima-media thickness is µ300 m and transmural
velocity is − −×
8 13 10 m s .
www.intechopen.com
Computational Modelling of Mass Transport in Large Arteries
557
transport, the authors did not observe the concentration polarisation phenomenon because the transmural flow was not modelled. Deng and co-workers (Deng et al., 1993; Deng et al., 1994; Deng et al., 1995) studied concentration polarisation of LDL numerically in two-dimensional T-junction models. Counter-diffusion from the lumenal surface to the bulk flow was found to be suppressed in the regions of disturbed flow, leading to higher degrees of concentration polarisation. Wada and Karino (1999) carried out a more systematic investigation by studying the influences of various physical and fluid mechanical factors on LDL concentration polarisation in a straight tube. They found that the degree of concentration polarisation increased with increasing filtration velocity, decreasing flow rate, and decreasing LDL plasma diffusivity. The authors also carried out investigations on LDL trans-lumenal transport in a segment of a human right coronary artery (RCA) with multiple bends (Wada and Karino, 2002). LDL concentration was found to be elevated at low WSS locations and increased sharply as the WSS decreased from 1 to 0 Pa. As both the filtration velocity and LDL permeability were assumed to be constant, this indicated that concentration polarisation was dependent on WSS even when the shear-dependent transport pathways were discounted. But this dependence was due to the flow driven convection and removal of LDL particles, which were characterised by WSS distribution to some extent. Qiu and Tarbell (2000), in their investigation of oxygen transport in a two-dimensional idealised coronary artery, found that the transport was limited by fluid phase at the outer wall of a bend, whereas at the inner wall, fluid phase transport did not limit the wall consumption of oxygen. Kaazempur-Mofrad and Ethier (2001) extended this investigation to an image-based model of a right coronary artery. Based on the observations, it was argued that complex secondary flows in a realistic arterial model can produce substantial local variations in blood-wall mass transfer rates and precise geometries should be acquired to ensure the accuracy of flow and hence concentration predictions. When modelling the arterial mass transport, it is of great interest to obtain detailed concentration fields in the arterial wall. Due to the enhanced computing power, researchers have been working on more sophisticated mathematical models to include trans-endothelial and transmural transport. Karner and Perktold (2000) and Karner et al. (2001) developed a multi-layered model for macromolecular transport, where the transmural flow was modelled using Darcy's Law and transmural transport was modelled using the volume-averaged convection-diffusion-reaction equation. The intima and the media were treated as transport domains while the endothelium and the IEL were assumed to be membranes where matching conditions were prescribed. To estimate transport properties of different wall layers, the authors employed pore theory. The model was first tested in a straight tube and later applied to a more complex geometry (Prosi et al., 2005). A novel electric analogy approach was used to derive the values of transport parameters because a mismatch in LDL trans-endothelial flux was found by using the parameter values determined by Karner et al. (2001). This zero-dimensional method used experimental data as inputs to seek the transport resistances provided by different layers of the wall. In a series of studies, Stangeby and Ethier (2002a; b) proposed a fluid-plus-porous-wall method (FPPWM) to couple the transmural flow to the bulk blood flow and LDL transport. To incorporate the inhomogeneous uptake of LDL, a concentration and WSS dependent endothelial permeability was derived based on experimental data.
www.intechopen.com
Recent Advances in Modelling and Simulation
558
There exist a number of major problems in computational investigations of arterial mass transport. First of all, due to the complex and coupled dynamics in the mass transport process, slight variations of model parameters may bring about substantial changes in mass transfer patterns. However, most of the existing methods for parameter estimation, including theoretical models exploiting pore theory (Karner and Perktold, 2000; Karner et al., 2001; Ai and Vafai, 2006; Yang and Vafai, 2006) and electric analogy (Prosi et al., 2005), could not produce satisfactory estimations of the parameters. Secondly, the effects of WSS on arterial mass transport need to be further investigated. Although some researchers have studied shear-dependent trans-endothelial transport by employing shear-dependent permeability, the role of WSS in the whole arterial mass transport process needs to be elucidated. Finally, while most of the models assumed steady flow conditions, it is important to incorporate time-dependent trans-lumenal and transmural transport, which are characterised by different time-scales, into a model framework. In the present study, these problems were addressed using improved methodologies.
2. Mathematical Models
Arterial mass transport is coupled with both the bulk blood flow in the lumen and the transmural flow in the wall. Therefore, fluid dynamic models and solute dynamic models should be included. It is worth noting that, in the context of arterial mass transport, the arterial wall refers to the intima and the media, with the adventitia as the outer boundary (not included in the models). In this study, a fluid-wall model was formulated and numerical procedures used to carry out time-dependent simulations were introduced.
2.1 A Fluid-wall mass transport model
The fluid-wall model included fluid dynamics and solute dynamics in the blood lumen and the arterial wall. The computational domains and dividing boundaries for the model are shown in Fig. 1. Navier-Stokes equations were employed to model bulk blood flow in the lumen (Ωl), whereas Darcy's Law was used to model transmural flow in the arterial wall (Ωw). As for the modelling of mass balance, the convection-diffusion equation was employed in the lumen (Ωl), and an additional consumption term was added to form a convection-diffusion-reaction equation for the wall (Ωw). Furthermore, the Kedem-Katchalsky equations were employed to couple fluid dynamics and mass balance at the endothelium (ポend), the interface between the arterial lumen and the arterial wall. Please refer to our earlier study (Sun et al., 2006) for details of the model. Fluid dynamics Blood flow was assumed to be incompressible, laminar, Newtonian and hence described by the Navier-Stokes equations
( )ρ µ ρ∂
− ∇ + ⋅ ∇ + ∇ =∂
uu u u
2 0ll l l lp
t (1)
∇ =u 0l (2)
in the fluid domain, where ul is blood velocity in the lumen, pl is pressure, μ is dynamic viscosity of the blood, and ┩ is density of the blood.
www.intechopen.com
Computational Modelling of Mass Transport in Large Arteries
559
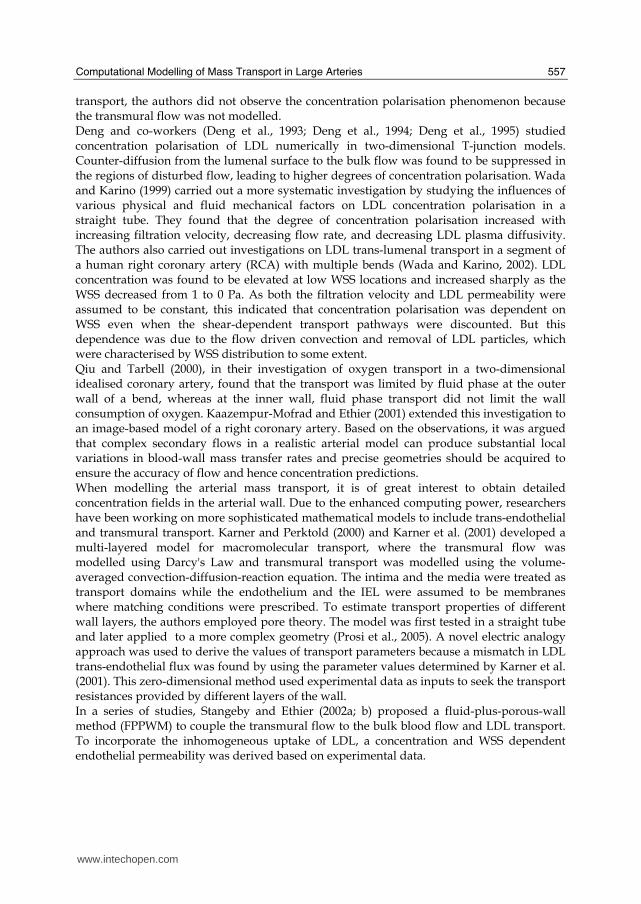
Figure 1. Computational domains and boundaries of the single-layered model. Ωl and Ωw are the lumen domain and the wall domain, respectively; ポl,in and ポl,out are the inlet and outlet boundaries of the lumen domain, respectively; ポw,in and ポw,out are the side boundaries of the wall domain; ポend is the endothelial boundary; ポadv is the outer wall boundary (the external elastic lamina and the adventitia)
The transmural flow in the arterial wall was modelled by Darcy's Law
κ
µ
⎛ ⎞⎜ ⎟− ∇ ⋅ =⎜ ⎟⎝ ⎠u 0w
w wp
p (3)
∇ =u 0w (4)
where uw is the velocity of the transmural flow in the wall, pw is pressure in the wall, μp is viscosity of the blood plasma, and κw is the Darcian permeability coefficient of the wall. Therefore, the velocity in the wall is proportional to pressure gradient. Solute dynamics Mass transfer in the blood lumen was coupled with the blood flow and modelled by the convection-diffusion equation as follows
( )∇ ⋅ − ∇ + =u 0l l l lD c c (5)
in the fluid domain, where cl is the solute concentration in the blood lumen, and Dl is the solute diffusivity in the lumen. Mass transfer in the arterial wall was coupled with the transmural flow and modelled by the convection-diffusion-reaction equations as follows
( )∇ ⋅ − ∇ + =uw w lag w w w wD c K c r c (6)
where cw is the solute concentration in the arterial wall, Dw is the effective solute diffusivity in the arterial wall, Klag is the solute lag coefficient, rw is the consumption rate constant. Interface coupling
At the fluid-tissue interface (i.e. the endothelium), volume flux and solute flux were defined by the Kedem-Katchalsky equations (Kedem and Katchalsky, 1958) as follows
( ), , ,σ π= Δ − Δv end p end end d end endJ L p (7)
( ), , ,σ= Δ + −1 ends end end end f end v endJ P c J c (8)
www.intechopen.com
Recent Advances in Modelling and Simulation
560
where Jv,end is the volume flux, Js,end is the solute flux, Lp,end is the hydraulic conductivity of the endothelium, ⦆cend is the solute concentration difference across the endothelium, ⦆pend is the pressure drop across the endothelium, ⦆┨end is the osmotic pressure difference across the endothelium, ┫d,end is the osmotic reflection coefficient of the endothelium, ┫f,end is the solvent reflection coefficient of the endothelium, Pend is the solute permeability of the endothelium,
endc is the mean interface concentration. In the present study, the osmotic pressure
difference ⦆┨end was neglected to de-couple the fluid dynamics from solute dynamics. Boundary conditions For the Navier-Stokes equations, a given velocity profile at the inlet of the lumen was prescribed; a zero relative pressure was assigned at the outlet of the lumen; and the outward transmural velocity given by the Kedem-Katchalsky equations was imposed at the endothelium. For Darcy’s Law, zero velocity normal to the side boundaries was prescribed; the inward transmural velocity was imposed at the endothelium; and a constant pressure was given at the outer wall boundary. For the convection-diffusion equation in the lumen, a flat concentration profile was prescribed at the inlet; a zero diffusive flux condition was imposed at the outlet; and the outward trans-endothelial flux given by the Kedem-Katchalsky equations was assigned at the endothelium. For the convection-diffusion-reaction equation in the wall, an insulated condition was imposed at the side boundaries; the inward trans-endothelial flux given by the Kedem-Katchalsky equations was assigned at the endothelium; and a constant concentration was prescribed at the outer wall boundary.
2.2 Implementation of pulsatile flow simulations
It is relatively straightforward to carry out steady state simulations, with all the time- dependent terms eliminated in the governing equations. So far, most of the computational studies on arterial mass transport have indeed assumed steady flow which seems be to a reasonable assumption for the long term mass transport process. However, as indicated earlier, arterial mass transport is influenced by two dramatically different time-scales. Thus, although concentration fluctuations in the wall are negligible within one cardiac cycle, the accumulated effect of haemodynamic factors over a longer time span could be significant. Therefore the effects of pulsatility on long term transport of macromolecules needs to be investigated and the validity of the steady flow assumption needs to be examined. However, it is difficult to carry out transient simulations of macromolecular transport over a long time span using the fluid-wall model with the current computing power. To circumvent the difficulties, lumen-free cyclic (LFC) and lumen-free time-averaged (LFTA) computational procedures were proposed to incorporate into the fluid-wall model. A couple of assumptions need to be made towards the development of the lumen-free methods. First of all, the highly convection-dominated mass transport in the lumen was omitted and a constant macromolecular concentration was assumed in the arterial lumen. This was also why the computational schemes were termed “lumen-free”. Although the lumenal convection of macromolecules could induce concentration polarisation, its influence on transmural transport is minor because the rate limiting process is wall-side transport (Caro, 1973; Tarbell, 2003). Secondly, it was assumed that hydraulic conductivity and macromolecular permeability of the endothelium changed simultaneously with WSS. Although this may not be true in vivo, our current understanding of the dynamic process limits the formulation of a mathematical model accounting for the dynamic response of transport properties.
www.intechopen.com
Computational Modelling of Mass Transport in Large Arteries
561
(a)
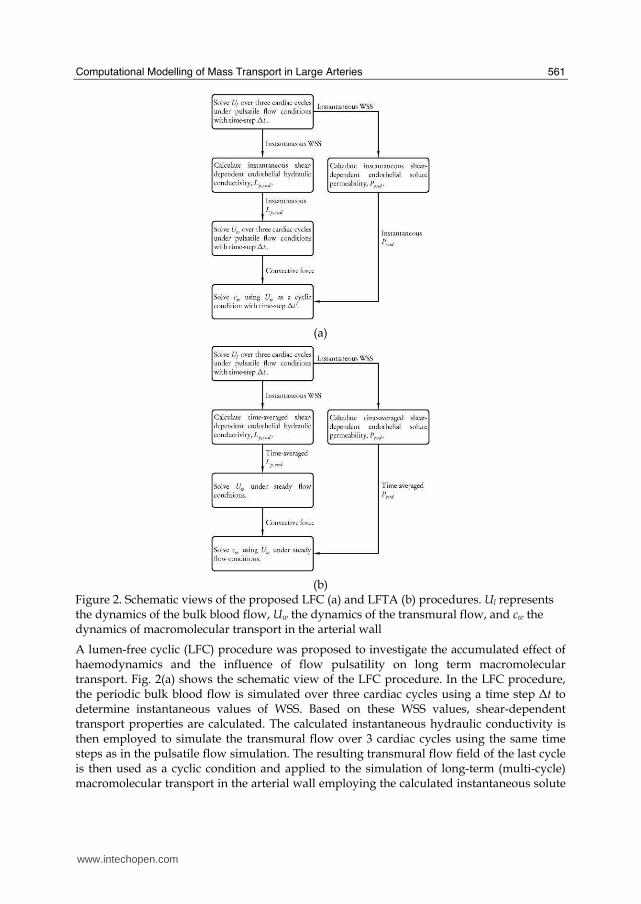
(b) Figure 2. Schematic views of the proposed LFC (a) and LFTA (b) procedures. Ul represents the dynamics of the bulk blood flow, Uw the dynamics of the transmural flow, and cw the dynamics of macromolecular transport in the arterial wall
A lumen-free cyclic (LFC) procedure was proposed to investigate the accumulated effect of haemodynamics and the influence of flow pulsatility on long term macromolecular transport. Fig. 2(a) shows the schematic view of the LFC procedure. In the LFC procedure, the periodic bulk blood flow is simulated over three cardiac cycles using a time step ⦆t to determine instantaneous values of WSS. Based on these WSS values, shear-dependent transport properties are calculated. The calculated instantaneous hydraulic conductivity is then employed to simulate the transmural flow over 3 cardiac cycles using the same time steps as in the pulsatile flow simulation. The resulting transmural flow field of the last cycle is then used as a cyclic condition and applied to the simulation of long-term (multi-cycle) macromolecular transport in the arterial wall employing the calculated instantaneous solute
www.intechopen.com
Recent Advances in Modelling and Simulation
562
permeability. An appropriate time step, ⦆t’, is selected through sensitivity test to preserve the characteristics of transmural flow within each cardiac cycle and save computational time. In addition to the LFC procedure, a lumen-free time-averaged (LFTA) procedure was also proposed to simulate the wall-side transport of macromolecules under a steady-state framework with time-averaged endothelial transport properties calculated using the instantaneous WSS from a pulsatile blood flow simulation. As shown in Fig. 2(b), periodic bulk blood flow is simulated over 3 cardiac cycles to determine the instantaneous WSS. On this basis, time-averaged shear-dependent model parameters are obtained and used in transmural momentum and LDL transport simulations. More details about the lumen-free models can be found in one of our earlier studies (Sun et al., 2007b).
3. Determination of Model Parameters
In the present study, the momentum transport properties were validated against experimental data reported by Meyer et al. (1996). The same experimental data were also used to determine the macromolecular mass transport properties using an optimisation approach based on one-dimensional simulations. Furthermore, shear-dependent models of endothelial hydraulic conductivity and albumin permeability were derived from experimental data reported by Sill et al. (1995) and Kudo et al. (1998), respectively.
3.1 Momentum transport parameters
The values of fluid phase momentum transport parameters, i.e. blood density and viscosity were well defined in the literature. In the present study, blood density was assumed to be 1.05 × 10³ kg/m3, and blood was assumed to be a Newtonian fluid with a constant viscosity 3.5 × 10⁻³ Pa· s. The tissue phase momentum transport parameters were validated against transmural velocities measured by Meyer et al. (1996). These included plasma viscosity
µ −= × ⋅47.2 10 ,p Pa s endothelial hydraulic conductivity ( )−= × ⋅12, 3 10 / ,p endL m Pa s and
Darcian permeability of the wall κ −= × 18 21 10 .w m These parameter values were mainly
taken from Karner et al. (2001) and Prosi et al. (2005).
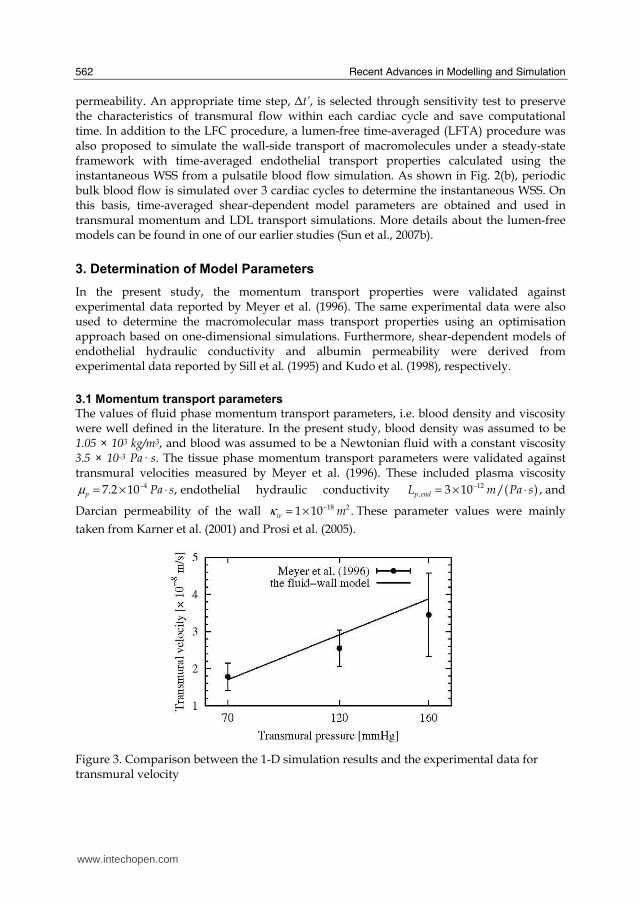
Figure 3. Comparison between the 1-D simulation results and the experimental data for transmural velocity
www.intechopen.com
Computational Modelling of Mass Transport in Large Arteries
563
Employing these parameter values, the transmural velocities given by the one-dimensional fluid-wall model were compared with experimental data in Fig. 3. It is shown that the fluid-wall model was able to predict transmural velocities in a reasonable range with constant momentum transport parameters under different transmural pressures.
3.2 Mass transport parameters
Mass transport parameters refer to the model parameters which characterise the transport properties of solutes in the arterial lumen and the wall. The solute transport properties in the arterial lumen were well defined in the literature, whereas the determination of solute transport properties in the arterial wall was usually difficult and needed specially designed methods to exploit the limited experimental observations. In the present study, an optimisation approach which minimised the difference between one-dimensional simulation results and experimental data was developed (Sun et al., 2007a). In the formulation of the optimisation problem, the mass transport properties were denoted by vector x. The simulated concentration distribution samples at predefined locations according to experimental data were denoted by vector c. The relationship between x and c was described by a one-dimensional convection-diffusion-reaction transport model ( )=c xf
with appropriate boundary conditions. The optimisation problem was formulated as follows
( )min
=
−∑ 2
1
n
j j j
j
W C c (9)
( )s. t . , , , , , , ,
, , , ,
= =
≤ ≤ =
A …
…1 2 1 2
1 2
j m
k k k
c f x x x j n
lb x ub k m
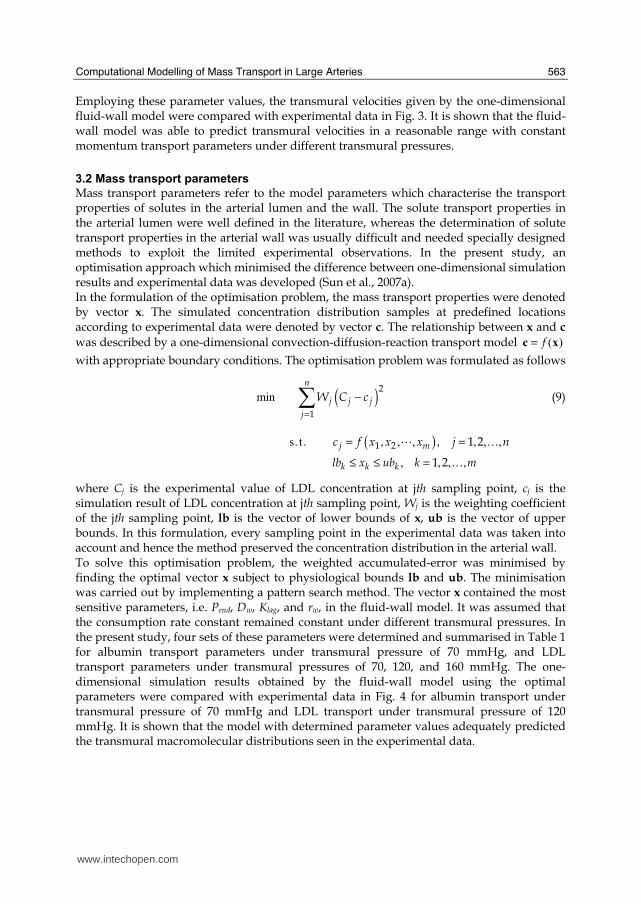
where Cj is the experimental value of LDL concentration at jth sampling point, cj is the simulation result of LDL concentration at jth sampling point, Wj is the weighting coefficient of the jth sampling point, lb is the vector of lower bounds of x, ub is the vector of upper bounds. In this formulation, every sampling point in the experimental data was taken into account and hence the method preserved the concentration distribution in the arterial wall. To solve this optimisation problem, the weighted accumulated-error was minimised by finding the optimal vector x subject to physiological bounds lb and ub. The minimisation was carried out by implementing a pattern search method. The vector x contained the most sensitive parameters, i.e. Pend, Dw, Klag, and rw, in the fluid-wall model. It was assumed that the consumption rate constant remained constant under different transmural pressures. In the present study, four sets of these parameters were determined and summarised in Table 1 for albumin transport parameters under transmural pressure of 70 mmHg, and LDL transport parameters under transmural pressures of 70, 120, and 160 mmHg. The one-dimensional simulation results obtained by the fluid-wall model using the optimal parameters were compared with experimental data in Fig. 4 for albumin transport under transmural pressure of 70 mmHg and LDL transport under transmural pressure of 120 mmHg. It is shown that the model with determined parameter values adequately predicted the transmural macromolecular distributions seen in the experimental data.
www.intechopen.com
Recent Advances in Modelling and Simulation
564
Figure 4. Comparison between 1-D simulation results and the experimental data for (a) transmural albumin concentration under transmural pressure of 70 mmHg, and (b) LDL concentration under transmural pressures of 120 mmHg
Parameter sets Dw [m2/s] Pend [m/s] rw [1/s] Klag [n/a]
Albumin, 70 mmHg 8.16×10⁻¹¹ 1.20×10⁻⁹ -1.04×10⁻³ 1.58
LDL, 70 mmHg 1.42×10⁻¹² 5.21×10⁻¹⁰ -6.05×10⁻⁴ 0.15
LDL, 120 mmHg 3.50×10⁻¹² 4.84×10⁻⁹ -6.05×10⁻⁴ 1.05
LDL, 160mmHg 1.56×10⁻¹² 9.38×10⁻⁹ -6.05×10⁻⁴ 0.90
Tabel 1. Parameters determined by the simulation-based optimisation
3.3 Shear-dependent parameters
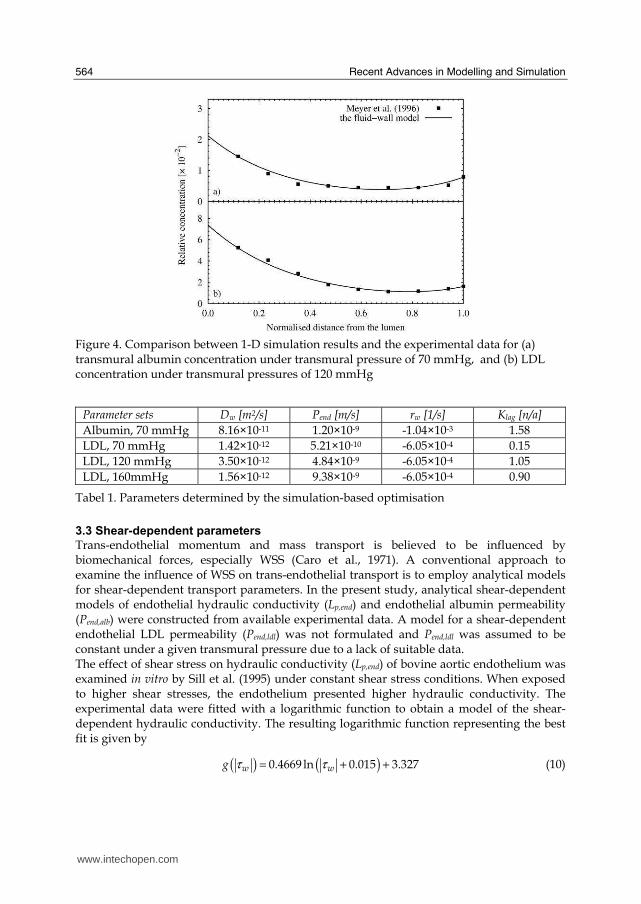
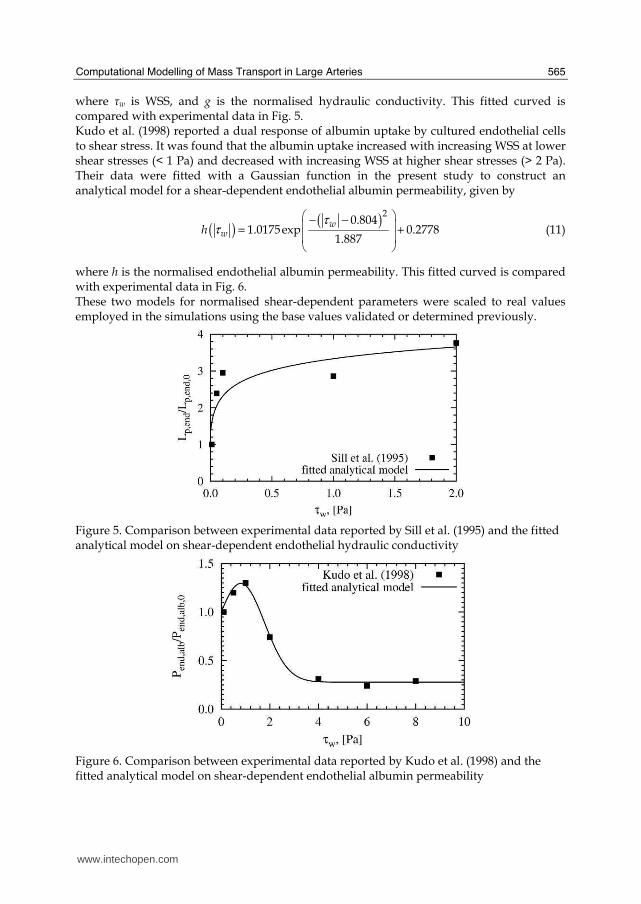
Trans-endothelial momentum and mass transport is believed to be influenced by biomechanical forces, especially WSS (Caro et al., 1971). A conventional approach to examine the influence of WSS on trans-endothelial transport is to employ analytical models for shear-dependent transport parameters. In the present study, analytical shear-dependent models of endothelial hydraulic conductivity (Lp,end) and endothelial albumin permeability (Pend,alb) were constructed from available experimental data. A model for a shear-dependent endothelial LDL permeability (Pend,ldl) was not formulated and Pend,ldl was assumed to be constant under a given transmural pressure due to a lack of suitable data. The effect of shear stress on hydraulic conductivity (Lp,end) of bovine aortic endothelium was examined in vitro by Sill et al. (1995) under constant shear stress conditions. When exposed to higher shear stresses, the endothelium presented higher hydraulic conductivity. The experimental data were fitted with a logarithmic function to obtain a model of the shear-dependent hydraulic conductivity. The resulting logarithmic function representing the best fit is given by
( ) ( )τ τ= + +0.4669 ln 0.015 3.327w wg (10)
www.intechopen.com
Computational Modelling of Mass Transport in Large Arteries
565
where ┬w is WSS, and g is the normalised hydraulic conductivity. This fitted curved is compared with experimental data in Fig. 5. Kudo et al. (1998) reported a dual response of albumin uptake by cultured endothelial cells to shear stress. It was found that the albumin uptake increased with increasing WSS at lower shear stresses (< 1 Pa) and decreased with increasing WSS at higher shear stresses (> 2 Pa). Their data were fitted with a Gaussian function in the present study to construct an analytical model for a shear-dependent endothelial albumin permeability, given by
( )( )τ
τ⎛ ⎞− −⎜ ⎟= +⎜ ⎟⎝ ⎠
20.804
1.0175exp 0.27781.887
wwh (11)
where h is the normalised endothelial albumin permeability. This fitted curved is compared with experimental data in Fig. 6. These two models for normalised shear-dependent parameters were scaled to real values employed in the simulations using the base values validated or determined previously.
Figure 5. Comparison between experimental data reported by Sill et al. (1995) and the fitted analytical model on shear-dependent endothelial hydraulic conductivity
Figure 6. Comparison between experimental data reported by Kudo et al. (1998) and the fitted analytical model on shear-dependent endothelial albumin permeability
www.intechopen.com
Recent Advances in Modelling and Simulation
566
4. Test cases
In the present study, the fluid-wall model and the lumen-free numerical procedures were tested in an idealised computational geometry.
4.1 Albumin transport in an idealised model of a stenosed coronary artery
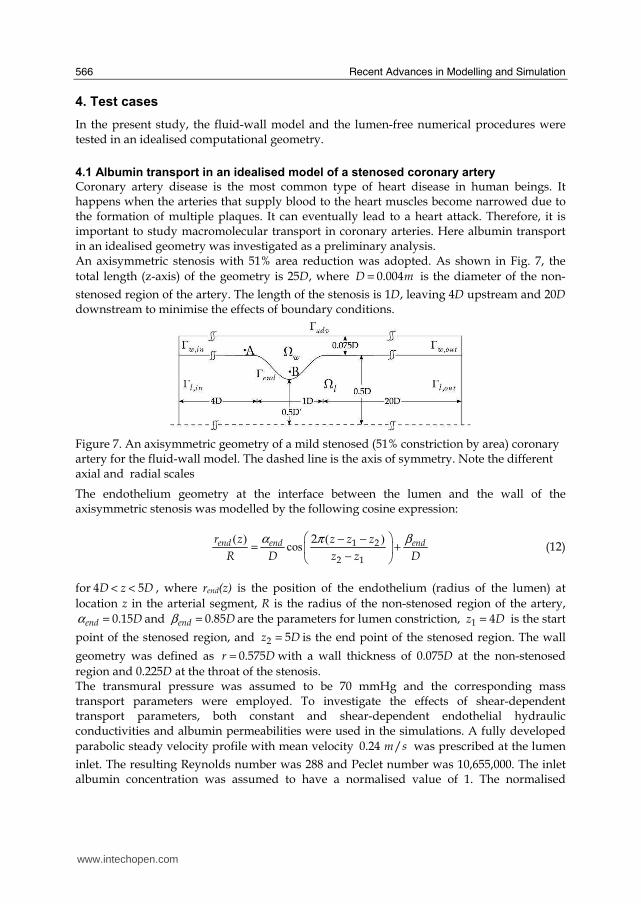
Coronary artery disease is the most common type of heart disease in human beings. It happens when the arteries that supply blood to the heart muscles become narrowed due to the formation of multiple plaques. It can eventually lead to a heart attack. Therefore, it is important to study macromolecular transport in coronary arteries. Here albumin transport in an idealised geometry was investigated as a preliminary analysis. An axisymmetric stenosis with 51% area reduction was adopted. As shown in Fig. 7, the total length (z-axis) of the geometry is 25D, where = 0.004D m is the diameter of the non-
stenosed region of the artery. The length of the stenosis is 1D, leaving 4D upstream and 20D downstream to minimise the effects of boundary conditions.
Figure 7. An axisymmetric geometry of a mild stenosed (51% constriction by area) coronary artery for the fluid-wall model. The dashed line is the axis of symmetry. Note the different axial and radial scales
The endothelium geometry at the interface between the lumen and the wall of the axisymmetric stenosis was modelled by the following cosine expression:
( ) ( )
cosα βπ⎛ ⎞− −
= +⎜ ⎟−⎝ ⎠
1 2
2 1
2end end endr z z z z
R D z z D (12)
for < <4 5D z D , where rend(z) is the position of the endothelium (radius of the lumen) at
location z in the arterial segment, R is the radius of the non-stenosed region of the artery, α = 0.15end D and β = 0.85end D are the parameters for lumen constriction, =1 4z D is the start
point of the stenosed region, and =2 5z D is the end point of the stenosed region. The wall
geometry was defined as = 0.575r D with a wall thickness of 0.075D at the non-stenosed
region and 0.225D at the throat of the stenosis. The transmural pressure was assumed to be 70 mmHg and the corresponding mass transport parameters were employed. To investigate the effects of shear-dependent transport parameters, both constant and shear-dependent endothelial hydraulic conductivities and albumin permeabilities were used in the simulations. A fully developed parabolic steady velocity profile with mean velocity 0.24 /m s was prescribed at the lumen
inlet. The resulting Reynolds number was 288 and Peclet number was 10,655,000. The inlet albumin concentration was assumed to have a normalised value of 1. The normalised
www.intechopen.com
Computational Modelling of Mass Transport in Large Arteries
567
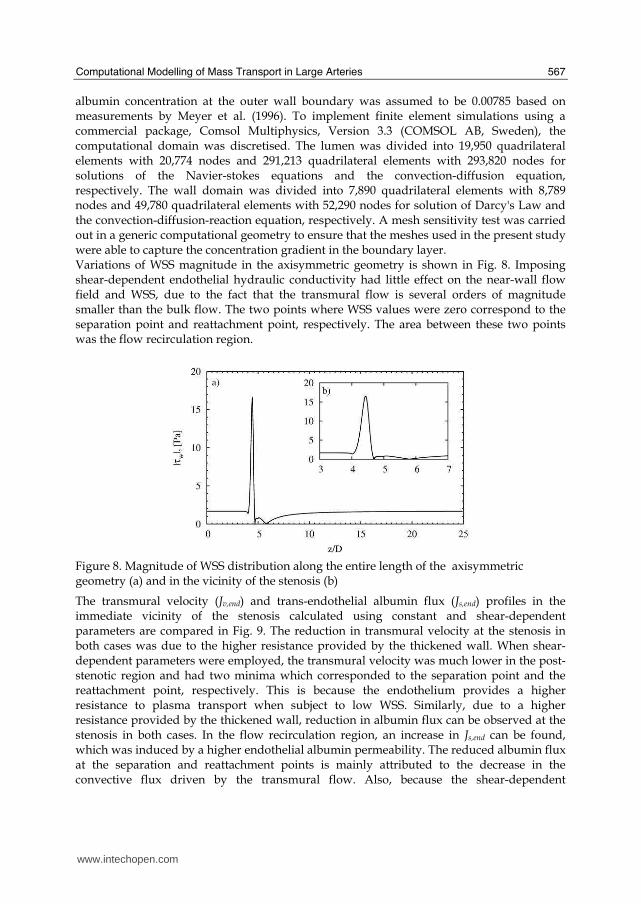
albumin concentration at the outer wall boundary was assumed to be 0.00785 based on measurements by Meyer et al. (1996). To implement finite element simulations using a commercial package, Comsol Multiphysics, Version 3.3 (COMSOL AB, Sweden), the computational domain was discretised. The lumen was divided into 19,950 quadrilateral elements with 20,774 nodes and 291,213 quadrilateral elements with 293,820 nodes for solutions of the Navier-stokes equations and the convection-diffusion equation, respectively. The wall domain was divided into 7,890 quadrilateral elements with 8,789 nodes and 49,780 quadrilateral elements with 52,290 nodes for solution of Darcy's Law and the convection-diffusion-reaction equation, respectively. A mesh sensitivity test was carried out in a generic computational geometry to ensure that the meshes used in the present study were able to capture the concentration gradient in the boundary layer. Variations of WSS magnitude in the axisymmetric geometry is shown in Fig. 8. Imposing shear-dependent endothelial hydraulic conductivity had little effect on the near-wall flow field and WSS, due to the fact that the transmural flow is several orders of magnitude smaller than the bulk flow. The two points where WSS values were zero correspond to the separation point and reattachment point, respectively. The area between these two points was the flow recirculation region.
Figure 8. Magnitude of WSS distribution along the entire length of the axisymmetric geometry (a) and in the vicinity of the stenosis (b)
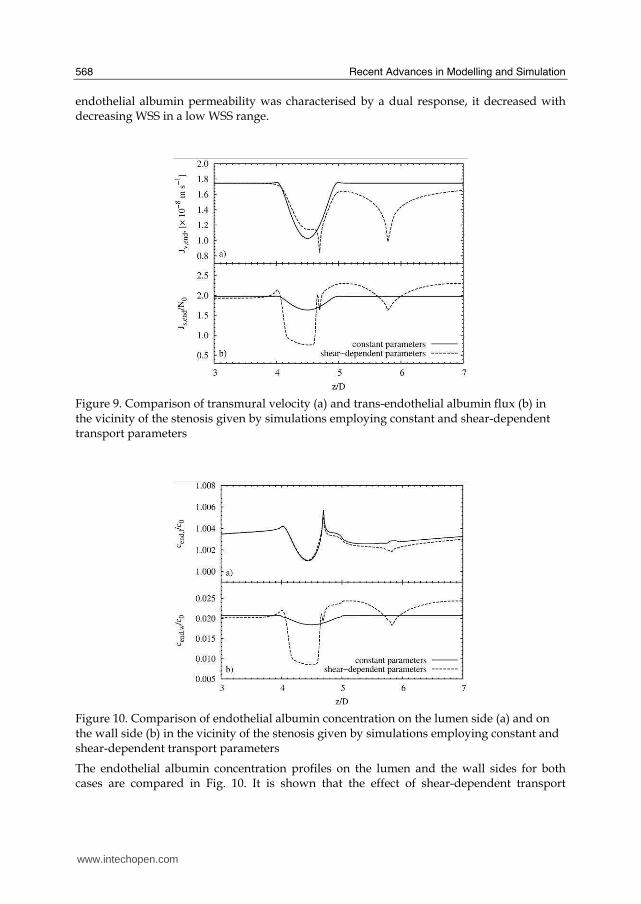
The transmural velocity (Jv,end) and trans-endothelial albumin flux (Js,end) profiles in the immediate vicinity of the stenosis calculated using constant and shear-dependent parameters are compared in Fig. 9. The reduction in transmural velocity at the stenosis in both cases was due to the higher resistance provided by the thickened wall. When shear-dependent parameters were employed, the transmural velocity was much lower in the post-stenotic region and had two minima which corresponded to the separation point and the reattachment point, respectively. This is because the endothelium provides a higher resistance to plasma transport when subject to low WSS. Similarly, due to a higher resistance provided by the thickened wall, reduction in albumin flux can be observed at the stenosis in both cases. In the flow recirculation region, an increase in Js,end can be found, which was induced by a higher endothelial albumin permeability. The reduced albumin flux at the separation and reattachment points is mainly attributed to the decrease in the convective flux driven by the transmural flow. Also, because the shear-dependent
www.intechopen.com
Recent Advances in Modelling and Simulation
568
endothelial albumin permeability was characterised by a dual response, it decreased with decreasing WSS in a low WSS range.
Figure 9. Comparison of transmural velocity (a) and trans-endothelial albumin flux (b) in the vicinity of the stenosis given by simulations employing constant and shear-dependent transport parameters
Figure 10. Comparison of endothelial albumin concentration on the lumen side (a) and on the wall side (b) in the vicinity of the stenosis given by simulations employing constant and shear-dependent transport parameters
The endothelial albumin concentration profiles on the lumen and the wall sides for both cases are compared in Fig. 10. It is shown that the effect of shear-dependent transport
www.intechopen.com
Computational Modelling of Mass Transport in Large Arteries
569
parameters on albumin concentration polarisation was minor. However, endothelial albumin concentration on the wall side was significantly different when shear-dependent transport parameters were employed. The distribution pattern of wall side concentration mainly followed that of trans-endothelial albumin flux, showing a lower concentration at the separation point, the reattachment point and the throat of the stenosis but a higher concentration in the recirculation region.
4.2 Transient LDL transport in an idealised model of a stenosed coronary artery
To avoid simulating the bulk blood flow for a prolonged period, the lumen-free cyclic (LFC) and the lumen-free time-averaged (LFTA) computational procedures were developed in the present study. To carry out a preliminary analysis, they were applied to model LDL transport in the same axisymmetric stenosis used previously. The transmural pressure was assumed to be 120 mmHg and corresponding mass transport parameters were employed. The shear-dependent endothelial hydraulic conductivity was used in the simulations. The effects of pulsatile flow were incorporated by using the LFC and LFTA procedures respectively and their results were compared. For transient flow simulations, a sinusoidal waveform was used to describe the variation of mean axial velocity at the inlet
( )[ ]ω= −0( ) 1 cosinu t U t (13)
where =0 0.24 /U m s is the time-averaged mean inlet velocity and ω π= 2 is the angular
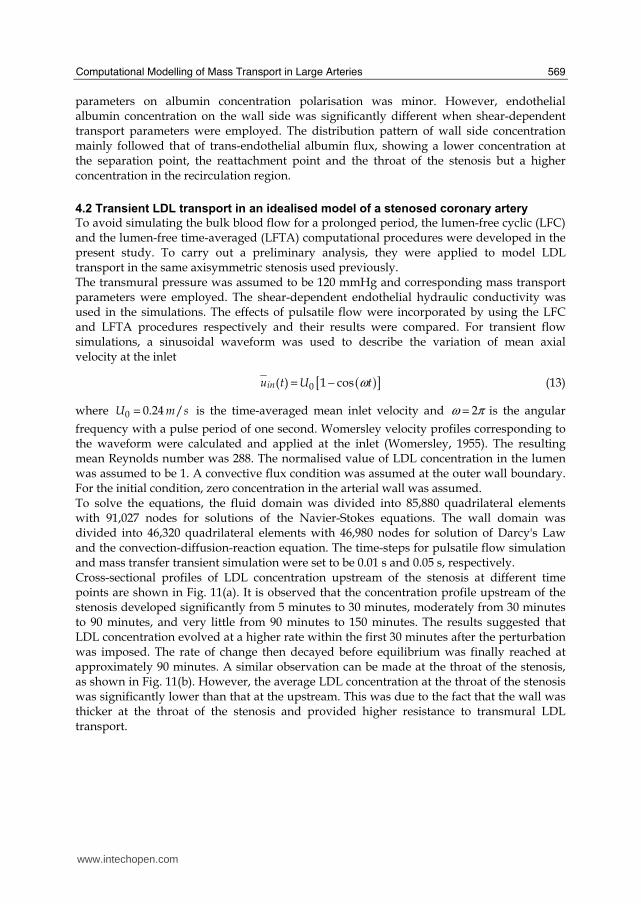
frequency with a pulse period of one second. Womersley velocity profiles corresponding to the waveform were calculated and applied at the inlet (Womersley, 1955). The resulting mean Reynolds number was 288. The normalised value of LDL concentration in the lumen was assumed to be 1. A convective flux condition was assumed at the outer wall boundary. For the initial condition, zero concentration in the arterial wall was assumed. To solve the equations, the fluid domain was divided into 85,880 quadrilateral elements with 91,027 nodes for solutions of the Navier-Stokes equations. The wall domain was divided into 46,320 quadrilateral elements with 46,980 nodes for solution of Darcy's Law and the convection-diffusion-reaction equation. The time-steps for pulsatile flow simulation and mass transfer transient simulation were set to be 0.01 s and 0.05 s, respectively. Cross-sectional profiles of LDL concentration upstream of the stenosis at different time points are shown in Fig. 11(a). It is observed that the concentration profile upstream of the stenosis developed significantly from 5 minutes to 30 minutes, moderately from 30 minutes to 90 minutes, and very little from 90 minutes to 150 minutes. The results suggested that LDL concentration evolved at a higher rate within the first 30 minutes after the perturbation was imposed. The rate of change then decayed before equilibrium was finally reached at approximately 90 minutes. A similar observation can be made at the throat of the stenosis, as shown in Fig. 11(b). However, the average LDL concentration at the throat of the stenosis was significantly lower than that at the upstream. This was due to the fact that the wall was thicker at the throat of the stenosis and provided higher resistance to transmural LDL transport.
www.intechopen.com
Recent Advances in Modelling and Simulation
570
Figure 11. Cross-sectional profiles of LDL concentration in the wall upstream of the stenosis at = 3z D (a) and at the throat of the stenosis ( = 4.5z D ) (b) at different time points. The
distance (δw) from the lumen was normalised by the total wall thickness (⦆w)
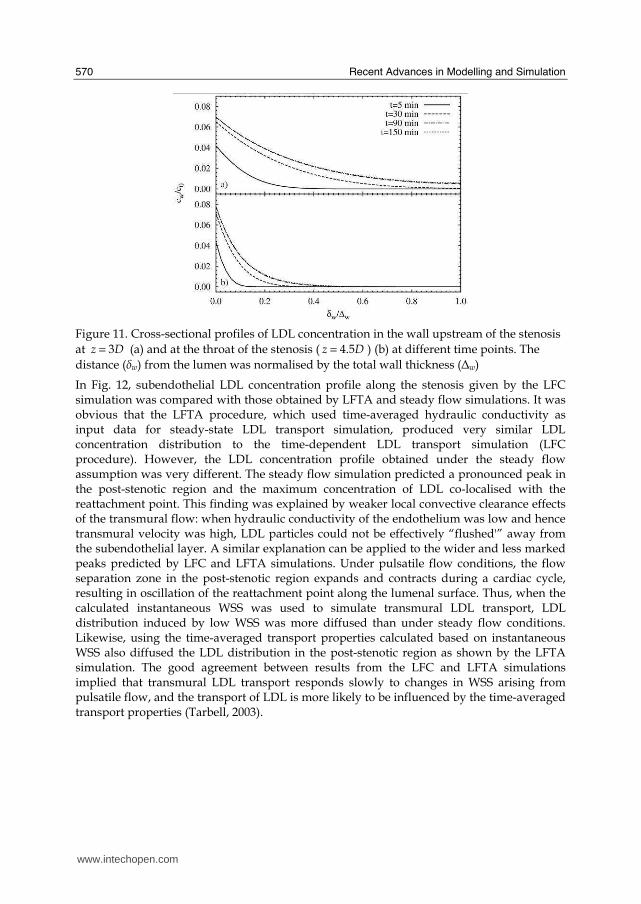
In Fig. 12, subendothelial LDL concentration profile along the stenosis given by the LFC simulation was compared with those obtained by LFTA and steady flow simulations. It was obvious that the LFTA procedure, which used time-averaged hydraulic conductivity as input data for steady-state LDL transport simulation, produced very similar LDL concentration distribution to the time-dependent LDL transport simulation (LFC procedure). However, the LDL concentration profile obtained under the steady flow assumption was very different. The steady flow simulation predicted a pronounced peak in the post-stenotic region and the maximum concentration of LDL co-localised with the reattachment point. This finding was explained by weaker local convective clearance effects of the transmural flow: when hydraulic conductivity of the endothelium was low and hence transmural velocity was high, LDL particles could not be effectively “flushed'” away from the subendothelial layer. A similar explanation can be applied to the wider and less marked peaks predicted by LFC and LFTA simulations. Under pulsatile flow conditions, the flow separation zone in the post-stenotic region expands and contracts during a cardiac cycle, resulting in oscillation of the reattachment point along the lumenal surface. Thus, when the calculated instantaneous WSS was used to simulate transmural LDL transport, LDL distribution induced by low WSS was more diffused than under steady flow conditions. Likewise, using the time-averaged transport properties calculated based on instantaneous WSS also diffused the LDL distribution in the post-stenotic region as shown by the LFTA simulation. The good agreement between results from the LFC and LFTA simulations implied that transmural LDL transport responds slowly to changes in WSS arising from pulsatile flow, and the transport of LDL is more likely to be influenced by the time-averaged transport properties (Tarbell, 2003).
www.intechopen.com
Computational Modelling of Mass Transport in Large Arteries
571
Figure 12. LDL concentration distribution at the endothelium on the wall side given by the steady flow simulation, LFC simulation, and LFTA simulation
This preliminary analysis indicated that the LFTA procedure could be an effective tool to investigate the effect of pulsatile flow on arterial mass transport as it takes into account the transient haemodynamics whilst saving the computational time through an appropriate time-averaging procedure. Furthermore, the results showed that LDL transport reached a quasi steady-state after 2 hours assuming that there was no LDL in the wall initially and a transmural pressure of 120 mmHg. This result can serve as a guideline for future experimental investigations on transmural LDL transport.
5. Model Application: Albumin Transport in a human Right Coronary Artery
The right coronary artery (RCA) originates from the aortic root above the right cusp of the aortic valve and supplies the myocardium with oxygen and nutrients. Coronary artery disease (CAD) is a result of formation of atheromatous plaques in the arterial wall. After decades of progression, some plaques may rupture and release thrombogenic materials. The resulting thrombosis can limit blood flow to the heart muscle with morbid or fatal results. Since the early processes of atherogenic progression and plaque formation include the accumulation of macromolecules, mass transport of albumin was investigated, in a human RCA in this study. Specifically, the fluid-wall model was combined with shear-dependent models for endothelial hydraulic conductivity and albumin permeability. The LFTA procedure was used to investigate the influence of pulsatility on macromolecular transport in the image-based patient geometry.
5.1 Image-based geometry and computational details
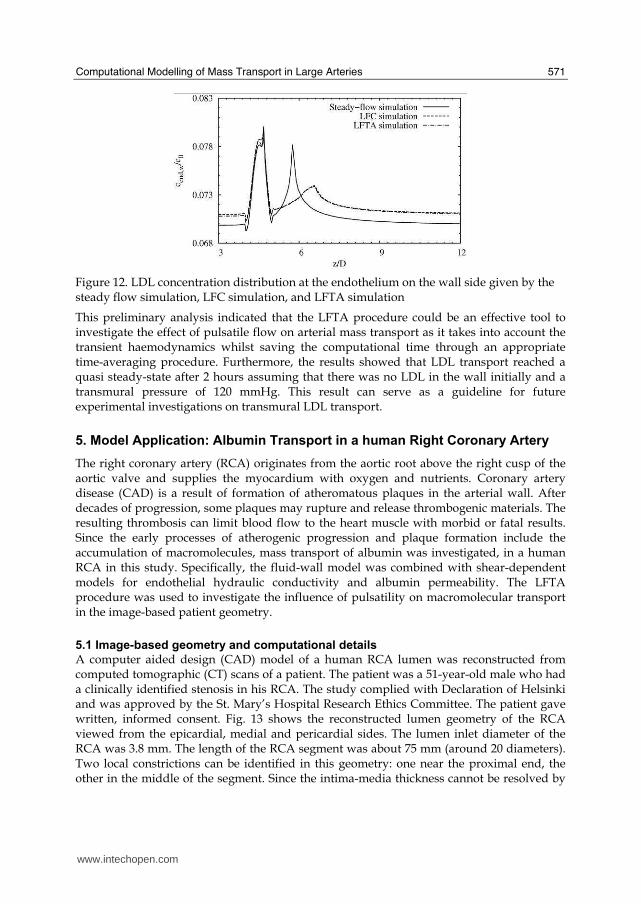
A computer aided design (CAD) model of a human RCA lumen was reconstructed from computed tomographic (CT) scans of a patient. The patient was a 51-year-old male who had a clinically identified stenosis in his RCA. The study complied with Declaration of Helsinki and was approved by the St. Mary’s Hospital Research Ethics Committee. The patient gave written, informed consent. Fig. 13 shows the reconstructed lumen geometry of the RCA viewed from the epicardial, medial and pericardial sides. The lumen inlet diameter of the RCA was 3.8 mm. The length of the RCA segment was about 75 mm (around 20 diameters). Two local constrictions can be identified in this geometry: one near the proximal end, the other in the middle of the segment. Since the intima-media thickness cannot be resolved by
www.intechopen.com
Recent Advances in Modelling and Simulation
572
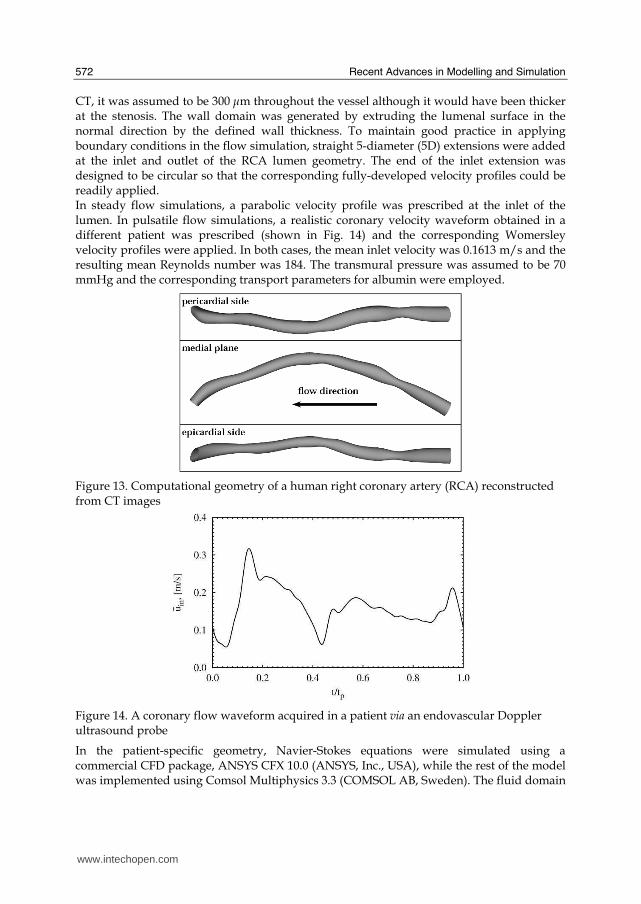
CT, it was assumed to be 300 μm throughout the vessel although it would have been thicker at the stenosis. The wall domain was generated by extruding the lumenal surface in the normal direction by the defined wall thickness. To maintain good practice in applying boundary conditions in the flow simulation, straight 5-diameter (5D) extensions were added at the inlet and outlet of the RCA lumen geometry. The end of the inlet extension was designed to be circular so that the corresponding fully-developed velocity profiles could be readily applied. In steady flow simulations, a parabolic velocity profile was prescribed at the inlet of the lumen. In pulsatile flow simulations, a realistic coronary velocity waveform obtained in a different patient was prescribed (shown in Fig. 14) and the corresponding Womersley velocity profiles were applied. In both cases, the mean inlet velocity was 0.1613 m/s and the resulting mean Reynolds number was 184. The transmural pressure was assumed to be 70 mmHg and the corresponding transport parameters for albumin were employed.
Figure 13. Computational geometry of a human right coronary artery (RCA) reconstructed from CT images
Figure 14. A coronary flow waveform acquired in a patient via an endovascular Doppler ultrasound probe
In the patient-specific geometry, Navier-Stokes equations were simulated using a commercial CFD package, ANSYS CFX 10.0 (ANSYS, Inc., USA), while the rest of the model was implemented using Comsol Multiphysics 3.3 (COMSOL AB, Sweden). The fluid domain
www.intechopen.com
Computational Modelling of Mass Transport in Large Arteries
573
was divided into 109,824 hexahedral elements with 116,171 nodes for solutions of the Navier-Stokes equations and 86,112 second order hexahedral elements (excluding inlet and outlet extensions) with 704,965 nodes for solutions of the convection-diffusion equation. The wall domain was divided into 66,240 hexahedral elements with 73,392 nodes for solutions of Darcy's Law and the convection-diffusion-reaction equation. A mesh independence test was carried out in a generic geometry to ensure that the employed computational mesh was able to resolve the mass transfer boundary layer. The implicit time step in the pulsatile flow simulation was chosen as 0.002 s.
5.2 Computational results
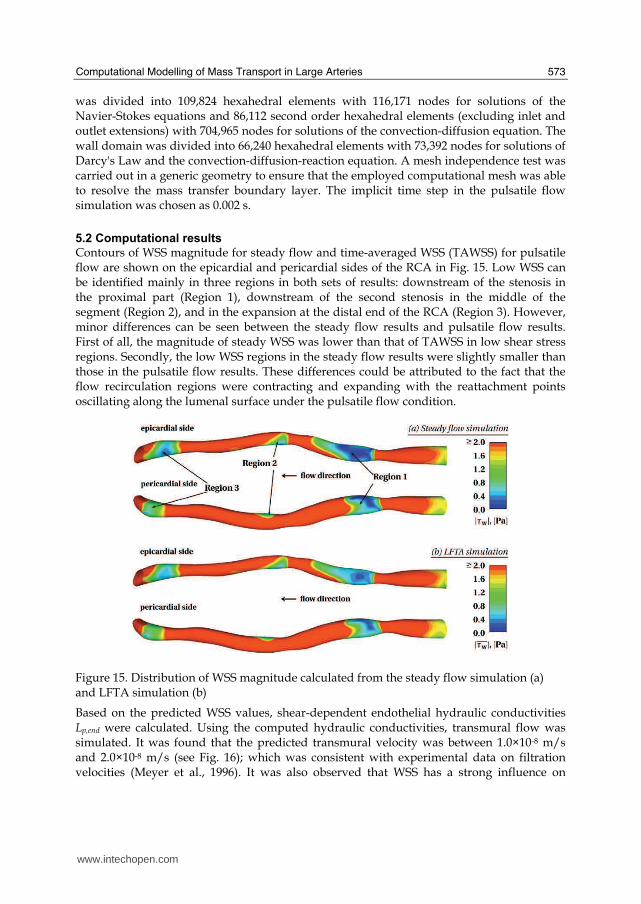
Contours of WSS magnitude for steady flow and time-averaged WSS (TAWSS) for pulsatile flow are shown on the epicardial and pericardial sides of the RCA in Fig. 15. Low WSS can be identified mainly in three regions in both sets of results: downstream of the stenosis in the proximal part (Region 1), downstream of the second stenosis in the middle of the segment (Region 2), and in the expansion at the distal end of the RCA (Region 3). However, minor differences can be seen between the steady flow results and pulsatile flow results. First of all, the magnitude of steady WSS was lower than that of TAWSS in low shear stress regions. Secondly, the low WSS regions in the steady flow results were slightly smaller than those in the pulsatile flow results. These differences could be attributed to the fact that the flow recirculation regions were contracting and expanding with the reattachment points oscillating along the lumenal surface under the pulsatile flow condition.
Figure 15. Distribution of WSS magnitude calculated from the steady flow simulation (a) and LFTA simulation (b)
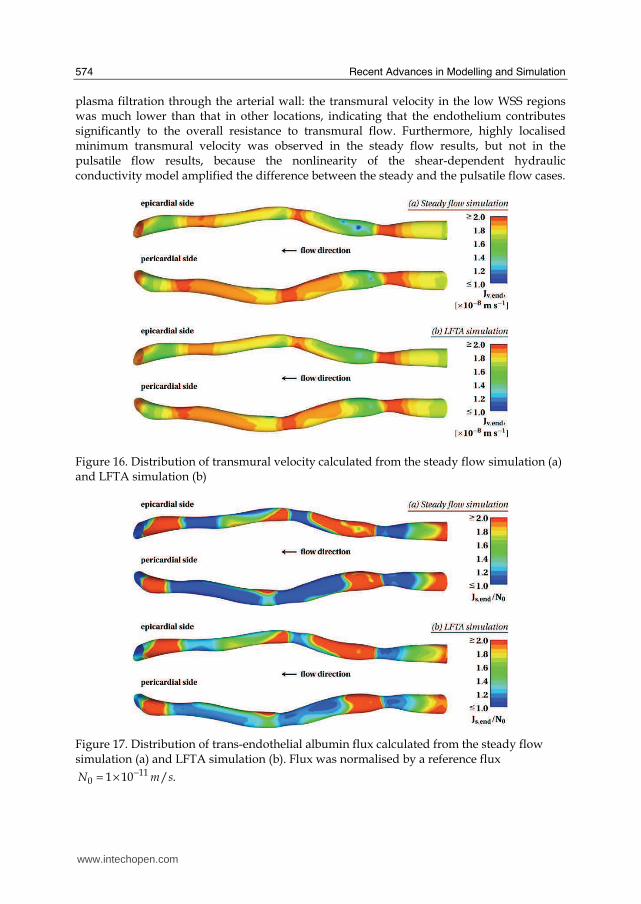
Based on the predicted WSS values, shear-dependent endothelial hydraulic conductivities Lp,end were calculated. Using the computed hydraulic conductivities, transmural flow was simulated. It was found that the predicted transmural velocity was between 1.0×10⁻⁸ m/s and 2.0×10⁻⁸ m/s (see Fig. 16); which was consistent with experimental data on filtration velocities (Meyer et al., 1996). It was also observed that WSS has a strong influence on
www.intechopen.com
Recent Advances in Modelling and Simulation
574
plasma filtration through the arterial wall: the transmural velocity in the low WSS regions was much lower than that in other locations, indicating that the endothelium contributes significantly to the overall resistance to transmural flow. Furthermore, highly localised minimum transmural velocity was observed in the steady flow results, but not in the pulsatile flow results, because the nonlinearity of the shear-dependent hydraulic conductivity model amplified the difference between the steady and the pulsatile flow cases.
Figure 16. Distribution of transmural velocity calculated from the steady flow simulation (a) and LFTA simulation (b)
Figure 17. Distribution of trans-endothelial albumin flux calculated from the steady flow simulation (a) and LFTA simulation (b). Flux was normalised by a reference flux
−= × 110 1 10 / .N m s
www.intechopen.com
Computational Modelling of Mass Transport in Large Arteries
575
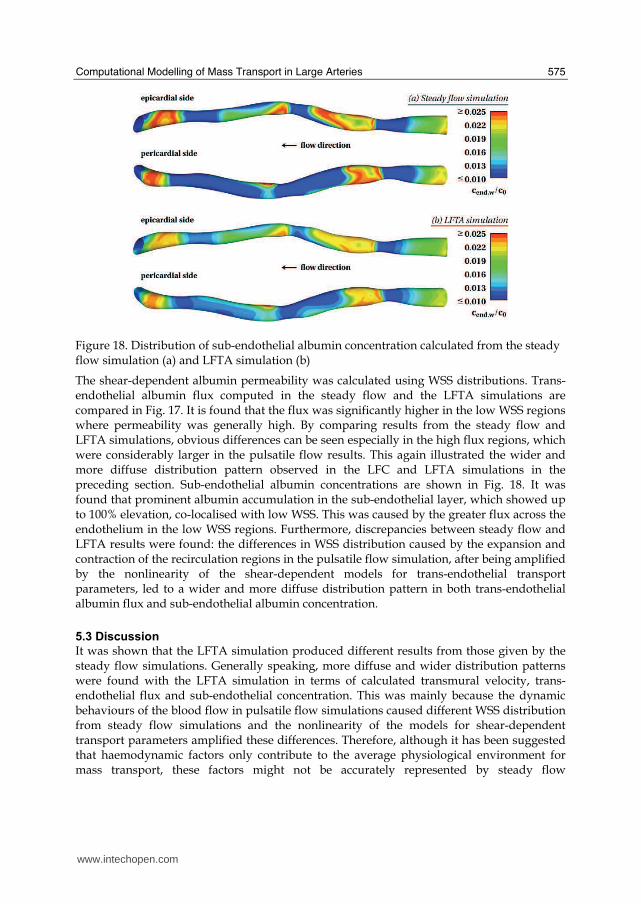
Figure 18. Distribution of sub-endothelial albumin concentration calculated from the steady flow simulation (a) and LFTA simulation (b)
The shear-dependent albumin permeability was calculated using WSS distributions. Trans-endothelial albumin flux computed in the steady flow and the LFTA simulations are compared in Fig. 17. It is found that the flux was significantly higher in the low WSS regions where permeability was generally high. By comparing results from the steady flow and LFTA simulations, obvious differences can be seen especially in the high flux regions, which were considerably larger in the pulsatile flow results. This again illustrated the wider and more diffuse distribution pattern observed in the LFC and LFTA simulations in the preceding section. Sub-endothelial albumin concentrations are shown in Fig. 18. It was found that prominent albumin accumulation in the sub-endothelial layer, which showed up to 100% elevation, co-localised with low WSS. This was caused by the greater flux across the endothelium in the low WSS regions. Furthermore, discrepancies between steady flow and LFTA results were found: the differences in WSS distribution caused by the expansion and contraction of the recirculation regions in the pulsatile flow simulation, after being amplified by the nonlinearity of the shear-dependent models for trans-endothelial transport parameters, led to a wider and more diffuse distribution pattern in both trans-endothelial albumin flux and sub-endothelial albumin concentration.
5.3 Discussion
It was shown that the LFTA simulation produced different results from those given by the steady flow simulations. Generally speaking, more diffuse and wider distribution patterns were found with the LFTA simulation in terms of calculated transmural velocity, trans-endothelial flux and sub-endothelial concentration. This was mainly because the dynamic behaviours of the blood flow in pulsatile flow simulations caused different WSS distribution from steady flow simulations and the nonlinearity of the models for shear-dependent transport parameters amplified these differences. Therefore, although it has been suggested that haemodynamic factors only contribute to the average physiological environment for mass transport, these factors might not be accurately represented by steady flow
www.intechopen.com
Recent Advances in Modelling and Simulation
576
simulations. It can be speculated that, in more complex geometries where the flow pattern is likely to be more disturbed, differences between steady flow and LFTA results would be even more pronounced. Taking into account the pulsatile flow is vital, especially when nonlinear shear-dependent trans-endothelial transport parameters are employed. It is important to point out that the LFTA procedure implicitly assumed that the endothelium responds instantaneously to changes in WSS. However, the endothelium may take a considerable period of time to adapt to WSS variations in vivo. An empirical dynamic model for endothelial adaptation may help relax the assumption but substantial experimental data are needed for the development of such a model. In summary, the fluid-wall model was used to simulate albumin transport in a patient-specific human RCA and showed that albumin accumulation (up to 100% elevation) occurred in the low WSS regions. It was also found that steady flow simulation could overestimate the magnitude and underestimate the area of accumulation. The association between low WSS and accumulation of macromolecules leading to atherosclerosis may be mediated through effects on transport properties and mass transport and is also influenced by flow pulsatility.
6. Conclusion
In the present study, a fluid-wall model was developed to simulate arterial mass transport of macromolecules in atherosclerosis-prone arteries. To incorporate time-dependent transport processes in the arterial wall, two time-averaged numerical procedures were proposed and compared. Model parameters, especially the transport properties of the arterial wall layers, were estimated using a simulation-based optimisation approach. Furthermore, shear-dependent transport properties, such as hydraulic conductivity and permeability were derived from relevant experimental data in the literature to incorporate the shear-dependence of trans-endothelial transport. The mathematical model and corresponding parameters were tested in idealised arterial geometries as preliminary investigations. The model was then applied to a patient-specific case, albumin transport in a human right coronary artery. The main outcomes of this study include the following. 1) The determination of four sets of model parameters, including albumin transport parameters under transmural pressure of 70 mmHg, LDL transport parameters under transmural pressures of 70 mmHg, 120 mmHg, and 160 mmHg. It was shown that the simulation-based optimisation approach led to much better parameter estimations than existing methods. 2) Preliminary model tests showed that the conventional steady flow assumption in the arterial mass transport models may not be adequate, especially when the bulk flow is highly disturbed. The LFTA numerical procedures provided an efficient way to incorporate the effects of flow pulsatility on shear-dependent trans-endothelial transport. Results suggested that the influence of transient haemodynamic conditions on macromolecular transport can be modelled as a time-averaged effect. 3) Albumin accumulation in the subendothelial layer was found to be co-localised with low WSS, implying that the arterial wall exposed to low WSS is atherosclerosis-prone due to a greater lipid accumulation. The accumulation was mainly due to a greater influx in the low WSS regions where the endothelium is more permeable. A number of limitations existed in the present study, including the use of a vascular scale model, parameter-related limitations, and limitations in the time-averaged numerical procedures.
www.intechopen.com
Computational Modelling of Mass Transport in Large Arteries
577
In the present study, transmural transport was approximated using volume-averaged notations, leading to formulation of a vascular scale model which could only simulate the spatially-averaged phenomenon. For instance, although sub-cellular scale variations in concentration polarisation have been found (Vincent et al., 2007), the present model predicted a smooth lumenal distribution of LDL because of the vascular scale formulation. The present study used available experimental data (Meyer et al., 1996) to determine the model parameters by a simulation-based optimisation approach. In these experiments, the fluid medium was only circulated for 30 minutes. However, it was shown that LDL concentration takes more than 2 hours to reach a quasi steady-state. Therefore, the experimental data that were used to determine the model parameters were somewhat questionable. Nevertheless, they were the most suitable data and were also used in other studies (Prosi et al., 2005; Ai and Vafai, 2006) to determine model parameters. In the time-averaged numerical procedures, two major assumptions were made. Lumenal concentration of macromolecules was assumed to be constant to avoid fully transient mass transport simulation for a prolonged period. In the long term, a better alternative should be developed, especially when the degree of concentration polarisation is predicted to be high. The endothelial cells in vitro take hours to reach a new steady state when a simple step change in WSS is imposed. However, instantaneous response of the endothelium to WSS was assumed here, due to the lack of relevant data and plausible models on how WSS induces changes in endothelial transport properties. This assumption needs to be evaluated further by using a dynamic model for endothelial response to WSS. The long term goal of computational investigations of arterial mass transport is to develop an experiment-assisted computational modelling framework spanning multiple spatial and time-scales to advance the understanding of arterial hyperlipidemia and its relations to progression and localisation of atherosclerosis. Therefore, the main tasks are to resolve physical and biological phenomena in different spatial- and time-scales. An optimal approach to improve the spatial resolution would be the combination of models in different spatial scales. The sub-cellular scale model has a better capacity to accommodate essential micro-scale physical phenomena that build up the macroscopic situation. When the sub-cellular scale predictions are made, the vascular scale model should be tuned to adapt to the observation and eventually give a broad picture. Efforts should also be made to improve the temporal resolution of the model. As discussed previously, the arterial mass transport processes are characterised by dramatically different time-scales. Therefore, to gain a complete understanding of the disease progression, it is essential to investigate phenomena that occur at different time-scales. That is to say, when looking at lipid accumulation in the arterial wall, one should not ignore haemodynamics in the fluid phase, which determines trans-endothelial transport. The present study attempted to integrate these transport processes into one model framework using time-averaged techniques, but major improvements are still needed. Furthermore, more subject-specific investigations should be carried out in the future to assess the feasibility of using the model predictions to facilitate disease diagnosis and management.
7. Acknowledgement
This work was supported by the Leverhulme Trust (F07 058/AA). The authors thank Dr. Andrew Wright, Dr. Andrew Dowsey, and Dr. Ryo Torii for their help on the RCA
www.intechopen.com
Recent Advances in Modelling and Simulation
578
geometry data, Dr. Nearchos Hadjiloizou for provision of the coronary waveform, and Prof. Simon Thom and Prof. Alun Hughes for various discussions.
8. References
Ai, L. and Vafai, K. (2006). A coupling model for macromolecule transport in a stenosed arterial wall. Int. J. Heat. Mass. Tran. Vol. 49: 1568-1591.
Back, L. H. (1975a). Theoretical investigation of mass transport to arterial walls in various blood flow regions - I. flow field and lipoprotein transport. Math. Biosci. Vol. 27: 231-262.
Back, L. H. (1975b). Theoretical investigation of mass transport to arterial walls in various blood flow regions - II. oxygen transport and its relationship to lipoprotein accumulation. Math. Biosci. Vol. 27: 263-285.
Caro, C. (1973). Transport of 14C-4-cholesterol between intra-luminal serum and artery wall in isolated dog common carotid artery. J. Physiol. (Lond.) Vol. 233: 37P-38P.
Caro, C. G., Fitz-Gerald, J. M. and Schroter, R. C. (1971). Atheroma and arterial wall shear observation, correlation and proposal of a shear dependent mass transfer mechanism for atherogenesis. Proc. R. Soc. London, Ser. B Biol. Sci. Vol. 177: 109-159.
Deng, X., King, M. and Guidoin, R. (1993). Localization of Atherosclerosis in Arterial Junctions. Modeling the Release Rate of Low Density Lipoprotein and its Breakdown Products Accumulated in Blood Vessel Walls. ASAIO J. Vol. 39: M489-M495.
Deng, X., King, M. and Guidoin, R. (1995). Localization of Atherosclerosis in Arterial Junctions. Concentration Distribution of Low Density Lipoproteins at the Luminal Surface in Regions of Disturbed Flow. ASAIO J. Vol. 41: 58-67.
Deng, X., Marois, Y., King, M. and Guidoin, R. (1994). Uptake of $^3$H-7-cholesterol along the Arterial Wall at an Area of Stenosis. ASAIO J. Vol. 40: 186-191.
Ehrlich, L. W. and Friedman, M. H. (1977). Steady convective diffusion in a bifurcation. IEEE Trans. Biomed. Eng. Vol. 24: 12-18.
Ethier, C. R. (2002). Computational Modeling of Mass Transfer and Links to Atherosclerosis. Ann. Biomed. Eng. Vol. 30: 461-471.
Friedman, M. H. and Ehrlich, L. W. (1975). Effect of spatial variations in shear on diffusion at the wall of an arterial branch. Circ. Res. Vol. 37: 446-454.
Kaazempur-Mofrad, M. R. and Ethier, C. R. (2001). Mass Transport in an Anatomically Realisitic Human Right Coronary Artery. Ann. Biomed. Eng. Vol. 29: 121-127.
Karner, G. and Perktold, K. (2000). Effect of Endothelial Injury and Increased Blood Pressure on Albumin Accumulation in the Arterial Wall: A Numerical Study. J. Biomech. Vol. 33: 709-715.
Karner, G., Perktold, K. and Zehentner, H. P. (2001). Computational Modeling of Macromolecule Transport in the Arterial Wall. Comput. Methods. Biomech. Biomed. Engin. Vol. 4: 491-504.
Kedem, O. and Katchalsky, A. (1958). Thermodynamic analysis of the permeability of biological membranes to non-electrolytes. Biochem. Biophys. Acta. Vol. 27: 229-246.
Kudo, S., Ikezawa, K., Matsumura, S., Ikeda, M., Oka, K. and Tanishita, K. (1998). Effect of wall shear stress on macromolecule uptake into cultured endothelial cells. Tran. JSME Vol. 64: 367-374.
www.intechopen.com
Computational Modelling of Mass Transport in Large Arteries
579
Ma, P., Li, X. and Ku, D. N. (1997). Convective Mass Transfer at the Carotid Bifurcation. J. Biomech. Vol. 30: 565-571.
Meyer, G., Merval, R. and Tedgui, A. (1996). Effects of Pressure-induced Stretch and Convection on Low-density Lipoprotein and Albumin Uptake in the Rabbit Aortic Wall. Circ. Res. Vol. 79: 532-540.
Prosi, M., Zunino, P., Perktold, K. and Quarteroni, A. (2005). Mathematical and Numerical Models for Transfer of Low-density Lipoproteins through the Arterial Wall: a New Methodology for the Model Set up with Applications to the Study of Disturbed Lumenal Flow. J. Biomech. Vol. 38: 903-917.
Qiu, Y. and Tarbell, J. M. (2000). Numerical Simulation of Oxygen Mass Transfer in a Compliant Curved Tube Model of a Coronary Artery. Ann. Biomed. Eng. Vol. 28: 26-38.
Rappitsch, G. and Perktold, K. (1996a). Computer Simulation of Convective Diffusion Processes in Large Arteries. J. Biomech. Vol. 29: 207-215.
Rappitsch, G. and Perktold, K. (1996b). Pulsatile Albumin Transport in Large Arteries: a Numerical Simulation Study. ASME J. Biomech. Eng. Vol. 118: 511-519.
Rappitsch, G., Perktold, K. and Pernkopf, E. (1997). Numerical Modelling of Shear-dependent Mass Transfer in Large Arteries. Int. J. Numer. Methods Fluids Vol. 25: 847-857.
Sill, H. W., Chang, Y. S., Artman, J. R., Frangos, J. A., Hollis, T. M. and Tarbell, J. M. (1995). Shear stress increases hydraulic conductivity of cultured endothelial monolayers. Am. J. Physiol. Heart Circ. Physiol. Vol. 268: 535-543.
Stangeby, D. K. and Ethier, C. R. (2002a). Computational analysis of coupled blood-wall arterial LDL transport. ASME J. Biomech. Eng. Vol. 124: 1-8.
Stangeby, D. K. and Ethier, C. R. (2002b). Coupled computational analysis of arterial LDL transport - effects of hypertension. Comput. Methods. Biomech. Biomed. Engin. Vol. 5: 233-241.
Sun, N., Wood, N. B., Hughes, A. D., Thom, S. A. M. and Xu, X. Y. (2006). Fluid-Wall Modelling of Mass Transfer in an Axisymmetric Stenosis: Effects of Shear-Dependent Transport Properties. Ann. Biomed. Eng. Vol. 34: 1119 - 1128.
Sun, N., Wood, N. B., Hughes, A. D., Thom, S. A. M. and Xu, X. Y. (2007a). Effects of transmural pressure and wall shear stress on LDL accumulation in the arterial wall: a numerical study using a multilayered model. Am. J. Physiol. Heart Circ. Physiol. Vol. 292: 3148-3157.
Sun, N., Wood, N. B., Hughes, A. D., Thom, S. A. M. and Xu, X. Y. (2007b). Influence of Pulsatile Flow on LDL Transport in the Arterial Wall. Ann. Biomed. Eng. Vol. 35: 1782-1790.
Tarbell, J. M. (2003). "Mass Transport in Arteries and the Localization of Atherosclerosis." Annu. Rev. Biomed. Eng. Vol. 5: 79-118.
Vincent, P., Sherwin, S. and Weinberg, P. (2007). Sub-celluar scale variations in low density lipoprotein concentration adjacent to the endothelium. Fifth Physiological Flow Meeting: Size, Sex and Sight.
Wada, S. and Karino, T. (1999). Theoretical Study on Flow-dependent Concentration Polarization of Low Density Lipoproteins at the Luminal Surface of a Straight Artery. Biorheology Vol. 36: 207-223.
www.intechopen.com

Recent Advances in Modelling and Simulation
580
Wada, S. and Karino, T. (2002). Theoretical Prediction of Low-Density Lipoproteins Concentration at the Luminal Surface of an Artery with a Multiple Bend. Ann. Biomed. Eng. Vol. 30: 778-791.
Womersley, J. R. (1955). Method for the calculation of velocity, rate of flow and viscos drag in arteries when the pressure gradient is known. J. Physiol. Vol. 127: 553-563.
Yang, N. and Vafai, K. (2006). Modeling of low-density lipoprotein (LDL) transport in the artery-effects of hypertension. Int. J. Heat. Mass. Tran. Vol. 49: 850-867.
www.intechopen.com
Modelling and SimulationEdited by Giuseppe Petrone and Giuliano Cammarata
ISBN 978-3-902613-25-7Hard cover, 688 pagesPublisher I-Tech Education and PublishingPublished online 01, June, 2008Published in print edition June, 2008
InTech EuropeUniversity Campus STeP Ri Slavka Krautzeka 83/A 51000 Rijeka, Croatia Phone: +385 (51) 770 447 Fax: +385 (51) 686 166www.intechopen.com
InTech ChinaUnit 405, Office Block, Hotel Equatorial Shanghai No.65, Yan An Road (West), Shanghai, 200040, China
Phone: +86-21-62489820 Fax: +86-21-62489821
This book collects original and innovative research studies concerning modeling and simulation of physicalsystems in a very wide range of applications, encompassing micro-electro-mechanical systems, measurementinstrumentations, catalytic reactors, biomechanical applications, biological and chemical sensors,magnetosensitive materials, silicon photonic devices, electronic devices, optical fibers, electro-microfluidicsystems, composite materials, fuel cells, indoor air-conditioning systems, active magnetic levitation systemsand more. Some of the most recent numerical techniques, as well as some of the software among the mostaccurate and sophisticated in treating complex systems, are applied in order to exhaustively contribute inknowledge advances.
How to referenceIn order to correctly reference this scholarly work, feel free to copy and paste the following:
Nanfeng Sun, Nigel B. Wood and X. Yun Xu (2008). Computational Modelling of Mass Transport in LargeArteries, Modelling and Simulation, Giuseppe Petrone and Giuliano Cammarata (Ed.), ISBN: 978-3-902613-25-7, InTech, Available from:http://www.intechopen.com/books/modelling_and_simulation/computational_modelling_of_mass_transport_in_large_arteries

© 2008 The Author(s). Licensee IntechOpen. This chapter is distributedunder the terms of the Creative Commons Attribution-NonCommercial-ShareAlike-3.0 License, which permits use, distribution and reproduction fornon-commercial purposes, provided the original is properly cited andderivative works building on this content are distributed under the samelicense.