Embed Size (px)
Citation preview
ARTICLE
Computational models of category-selective brainregions enable high-throughput tests of selectivityN. Apurva Ratan Murty 1,2,3,5✉, Pouya Bashivan 4,5, Alex Abate1, James J. DiCarlo 1,2,3 &
Nancy Kanwisher 1,2,3
Cortical regions apparently selective to faces, places, and bodies have provided important
evidence for domain-specific theories of human cognition, development, and evolution. But
claims of category selectivity are not quantitatively precise and remain vulnerable to
empirical refutation. Here we develop artificial neural network-based encoding models that
accurately predict the response to novel images in the fusiform face area, parahippocampal
place area, and extrastriate body area, outperforming descriptive models and experts. We use
these models to subject claims of category selectivity to strong tests, by screening for and
synthesizing images predicted to produce high responses. We find that these high-response-
predicted images are all unambiguous members of the hypothesized preferred category for
each region. These results provide accurate, image-computable encoding models of each
category-selective region, strengthen evidence for domain specificity in the brain, and point
the way for future research characterizing the functional organization of the brain with
unprecedented computational precision.
https://doi.org/10.1038/s41467-021-25409-6 OPEN
1 Department of Brain and Cognitive Sciences, Massachusetts Institute of Technology, Cambridge, MA, USA. 2McGovern Institute for Brain Research,Massachusetts Institute of Technology, Cambridge, MA, USA. 3 The Center for Brains, Minds and Machines, Massachusetts Institute of Technology,Cambridge, MA, USA. 4 Department of Physiology, McGill University, Montréal, QC, Canada. 5These authors contributed equally: N. Apurva Ratan Murty,Pouya Bashivan. ✉email: [email protected]
NATURE COMMUNICATIONS | (2021) 12:5540 | https://doi.org/10.1038/s41467-021-25409-6 |www.nature.com/naturecommunications 1
1234
5678
90():,;
The discovery of cortical regions apparently specialized forthe perception of faces1, places2, and bodies3 has not onlyenriched our understanding of the functional organization
of the human brain, but energized longstanding debates about thestructure, evolution, and development of the human mind. Afterall, faces, bodies, and places are highly meaningful stimuli at thecore of two human abilities: engaging in complex social interac-tions with other people, and finding our way around in the world.Extensive research has further shown that these abilities followdistinct developmental trajectories in infancy4,5 and are subservedby different representations and computations in adults. Thus, atheoretically rich account of category-selective regions in thebrain requires understanding the meaning and significance offaces, places, and bodies to humans, and how the perception ofthese stimuli might be tailored to their post-perceptual uses insocial cognition and navigation6,7.
On the other hand, the intuitive definitions of faces, places, andbodies that figure in theories of cognitive architecture, develop-ment, and evolution are incomplete as characterizations of neuralresponses. First, they are not image computable, instead requiringa human in the loop to ascertain what counts as a face, place orbody. Second, they provide no quantitative account of reliabledifferences in each region’s response to images either within, oroutside, its hypothesized preferred category. Finally, althoughconsiderable evidence supports the hypothesized category selec-tivities of the fusiform face area (FFA)8,9, extrastriate bodyarea3,10,11 (EBA), and the parahippocampal place area(PPA)2,12–14, each hypothesis remains vulnerable to refutation.Despite the hundreds of stimuli whose responses have beenreported in the literature on each region, a vast space of imagesremains untested. If any image not from the preferred category isfound in the future to maximally drive the region, the claim ofcategory selectivity of that region will be seriously challenged.That is, a real possibility exists that the claimed category selec-tivity of the FFA, PPA, or EBA could turn out to be false. Here wetackle all three problems by developing image-computableencoding models that accurately predict the response of eachregion to new images and generalize across participants. We thencycle back to use these models to conduct the strongest tests todate of the hypothesized category selectivity of these regions.
Our work is made possible by recent advances in deep con-volutional artificial neural networks (ANNs), based loosely on thehierarchical architecture and repeated computational motifsobserved in the primate visual system15,16. These networks nowapproach human-level performance on object recognitionbenchmarks, providing the first computationally explicithypotheses of how these tasks might be accomplished by thebrain. Further, the internal representations developed at differentprocessing stages within these ANNs mirror the hierarchicalorganization of the visual cortex17–19, and activations in thesenetworks can be linearly combined to accurately predict theobserved response to previously unseen images at different stagesof the visual processing hierarchy20–23. For these reasons, specificANNs are now considered our most quantitatively accuratecomputational models of visual processing in the primate ventralvisual stream21. However, it remains unclear whether or how theunderstanding provided by these models engages with previoustheories of visual processing in the brain24, or whether they evenrepresent any significant advance in our understanding beyondwhat is already known from decades of published work on theseregions.
In this work, we addressed these questions by collecting high-quality event-related functional MRI (fMRI) responses in theFFA, PPA, and EBA and screening a large number of ANN-basedmodels of the ventral stream for their ability to predict observedresponses in each region. Using prediction as one metric of
understanding, we further tested whether these models outper-form experts on the human ventral visual pathway at predictingthe fMRI responses to novel images. Finally, we adapted recentmachine learning methods to identify stimuli that maximally ordifferentially drive single neurons in the macaque visualsystem25–27, to identify optimal stimuli for the FFA, PPA, andEBA. This method enables us to turbo-charge the search forcounterevidence to the claimed selectivity of the FFA, PPA, andEBA, thereby conducting strong tests of longstanding hypothesesabout the category selectivity of each region.
We show here that our models accurately predict the responseof each region to images, even outperforming predictions fromprior descriptive models and experts in the fields. This enables usto use these models to screen millions of images and synthesizenaturalistic stimuli predicted to produce the highest response ineach region. All the high-response predicted images for eachregion are obvious exemplars of the hypothesized preferredcategory for that region, supporting the claimed category selec-tivity of each region.
ResultsWe scanned four participants with fMRI to first localize the FFA,PPA, and EBA in each participant individually using a standarddynamic localizer28–30, and then recorded event-related fMRIresponses in each of these functionally-defined regions of interest(fROIs) to a diverse set of 185 naturalistic stimuli. Each of the 185images was presented at least 20 times to each participant overfour scanning sessions (~10 h scanning in each of N= 4 parti-cipants), producing highly reliable responses of regions andvoxels in the ventral pathway to these stimuli (Figs. S1, S2).
ANN models of the ventral stream accurately predict responsesto the FFA, PPA, and EBA. How well do computational models ofthe ventral stream predict the observed response to natural stimuliin the FFA, PPA, and EBA? To find out, we modeled the averageresponse across participants of each of six fROIs (left and right FFA,PPA, and EBA) to 185 natural images using a regression-basedmodel-to-brain alignment approach20,21,23,26,31,32 (Fig. 1). Specifi-cally, given a model, we established a linear mapping between aselected layer of the model and the activation of each brain region.To determine the weights of that linear mapping, we used the brainregion’s measured responses (mean within a fROI, averaged overparticipants) to a subset of the stimuli (randomly selected) (Fig. 2).That is, the response of each ROI is modeled as a fixed, weightedsum of ANN features. We then tested the accuracy of this model atpredicting responses to completely held-out stimuli (aka. cross-validation, scored as the Pearson correlation of the predicted vs. theobserved responses on those held-out stimuli, see section onEncoding Models in Methods). Using this approach we screened arange of models on their ability to predict the observed responsesacross the different fROIs (i.e., integrative benchmarking21,33).These models include pixel and Gabor wavelet-based V1 modelswhich extract low-level features as well as several popular ANNs,considered the leading models of the primate ventral visualstream20,21,26 (N= 60 models, Table S1).
The results from the broad model screen are presented for allfROIs in Fig. S3, which shows that several ANNs have high cross-validated neural predictivity (i.e., above 0.8). Comparison ofpredictivity scores across models also reveal several notabletrends. First, deep ANN models of the ventral stream surpasssimple pixel and V1-level models. Second, prediction scores werehigher for deeper ANN models (or recurrent models likeCORnet-R34 and CORnet-S) than shallower models (with norecurrence) like CORnet-Z or even AlexNet. Third, modelstrained on broad stimulus categories (like ImageNet and Places,
ARTICLE NATURE COMMUNICATIONS | https://doi.org/10.1038/s41467-021-25409-6
2 NATURE COMMUNICATIONS | (2021) 12:5540 | https://doi.org/10.1038/s41467-021-25409-6 | www.nature.com/naturecommunications
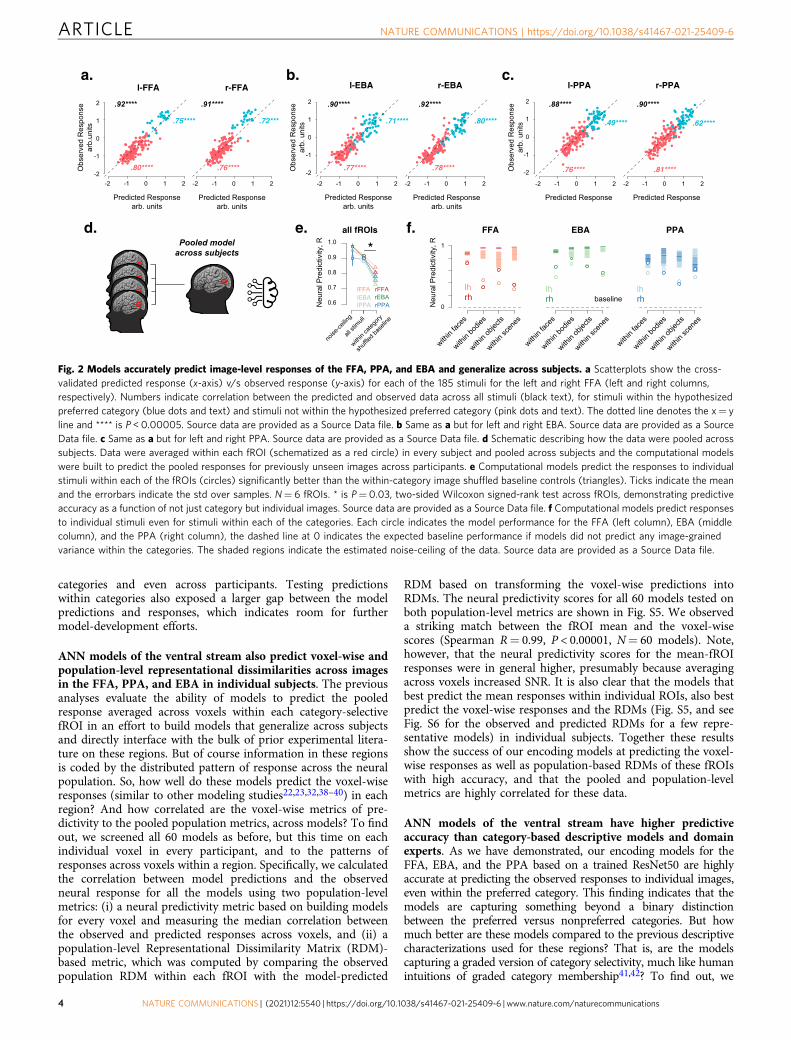
which contain diverse naturalistic images) better predict neuralresponses than models trained on a specific domain of stimuli(like faces). This conclusion is based on comparing the neuralpredictivity for models with the same architecture backbone (sayResnet-50), but with synaptic weights trained on objectcategorization using different stimulus datasets (likeIMAGENET35, Places36536, or VGGfaces237). And finally, wefind that models that are trained (see ResNet-50 random, Fig. S3)are much more accurate than models that have randomlyinitialized synaptic weights (see ResNet-50-random, Fig. S2).Figure 2a–c shows the striking correlation between the predictedand observed response to each image, separately for eachhemisphere of the FFA, EBA, and the PPA, for one of the bestANN models—Resnet50-V1. Note that these correlations havenot been corrected by the data reliability (though see Methodsunder Encoding Models). Together, the results from Fig. 2 andFig. S2 show that the models for each fROI based on a trainedResNet50 are able to predict the observed average response topreviously unseen stimuli with high accuracy (consistent withref. 38).
These encoding models for the FFA, PPA, and the EBA wouldbe most useful if they also generalized to predict the observedresponses from entirely new subjects. To find out how well ourcurrent models do this, we next built models based on poolingdata from three of the participants and evaluating how well thismodel generalizes to new stimuli in the held-out participant(cross-validation across both subjects and images). Here too wefound that models predict the observed responses in the held-outsubject, with average correlations between predicted and observedresponses for all fROIs above R= 0.78, (mean ± s.e.m acrossfROIs 0.82 ± 0.01, each P < 0.00005, Fig. S4). How manyparticipants do we need to obtain a good model for a givenfROI? And do our methods work well even when models are builtfrom a single participant, without first averaging responses acrossthree or more participants? To find out we measured predictiveaccuracy when models were built based on a single participant’sresponses to 90% of stimuli and tested on the held-out 10%stimuli for the same participant. Here too the correlationsbetween predicted and observed responses were high (eachR > 0.78, mean ± s.e.m across fROIs 0.83 ± 0.01 for all fROIs, eachP < 0.00005, Fig. S4). Finally, we asked whether the models builtfrom individual subjects generalize to other subjects by measuring
the predictive accuracy of a model built from one subject onanother individual’s responses to unseen images. Here againpredictive accuracy remained quite high, with the correlationsbetween predicted and observed responses R > 0.76 for all fROIs(mean ± s.e.m across fROIs 0.79 ± 0.01, each P < 0.00005, seeFig. S4).
The results described so far indicate that the encoding modelfor each fROI generalizes across participants, but they do not yetaddress the grain of predictions across stimuli. Do these modelspredict the responses to individual images, over and abovepredictions based on their category membership? The fact thatthe high predictive accuracy of the pooled model in Fig. 2a–c wasalso observed in a separate analysis of stimuli both within thehypothesized preferred category, and outside the preferredcategory (Fig. 2a blue and pink dots, correlations shown asinsets) already provides some evidence that they do. We furthertested this question in two ways. First, we randomly shuffled theimage labels (N= 100 iterations) but only within the face, body,scene, and object categories (within-category shuffled control)and estimated the correlation between this shuffled order and thepredicted activation. This correlation was significantly lower thanthe unshuffled correlation between the predicted and observedresponse (Fig. 2e, P= 0.03, Wilcoxon sign-rank test), indicatingthat models explained unique image-level variance over andabove the different mean responses to each category. Second, weestimated the degree to which the models could predict theobserved response to individual stimuli within each of the fourstimulus categories. If the models predict no image-level variance,the correlation within each category should be 0 (Fig. 2f, dottedline). Instead, each of these correlations were significantly greaterthan 0 for all fROIs (Fig. 2f, mean ± s.e.m across fROIs andcategories 0.56 ± 0.03, P= 1.19 × 10⁻⁷ Wilcoxon sign-rank test).Further, within-category predictivity was higher for the preferredthan nonpreferred categories for each region, as expected fromthe plausible hypothesis that these regions are more sensitive tovariation across exemplars within their preferred category thanvariations across exemplars within nonpreferred categories.Taken together, these results show that ANN models of theventral stream can predict the response to images in the FFA,PPA, and the EBA with very high accuracy. Further analyses on atrained ResNet50 show that the predictive accuracy of the modelsremain high even when tested on individual stimuli within
Integrative benchmarking with several base-models
event-related fMRI
mapping betweenmodels and fMRIbrain-model
a.400ms
400ms
3.6 - 11.6s
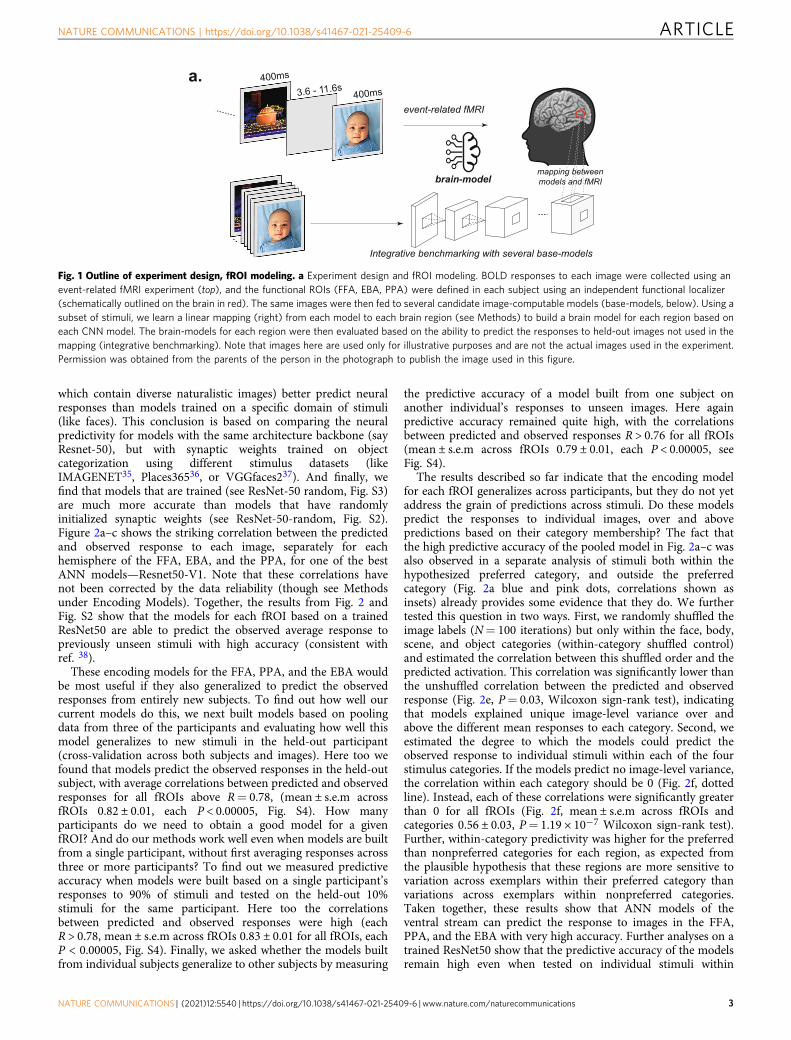
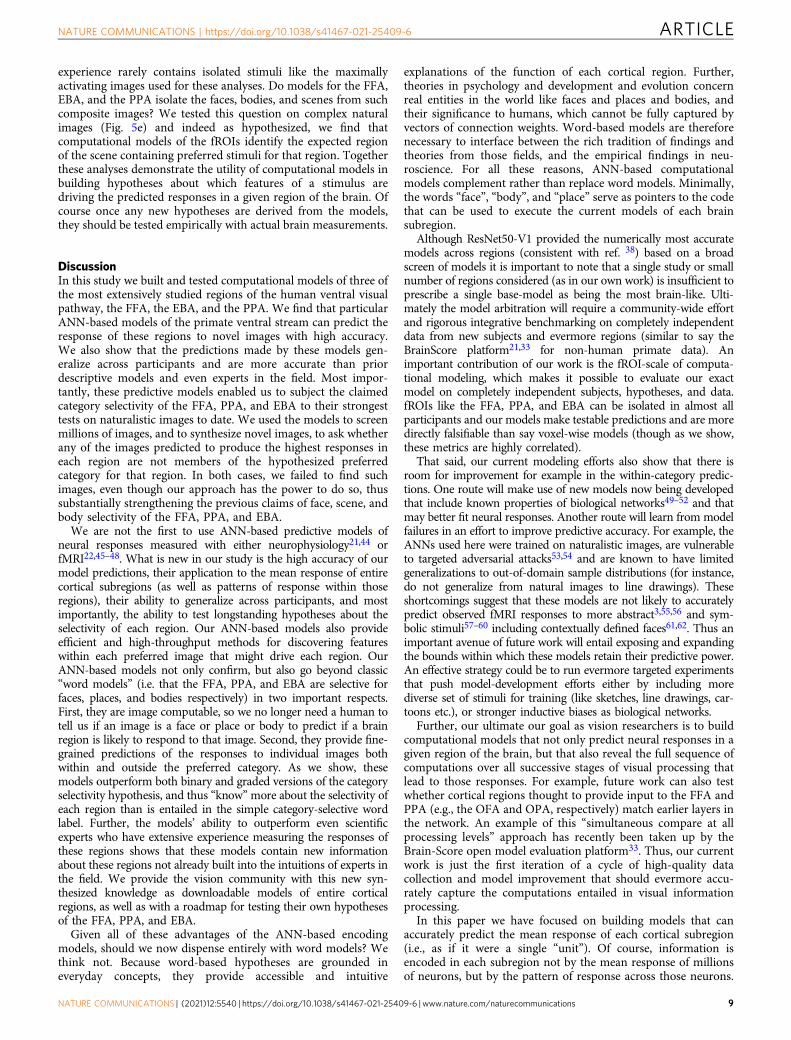
Fig. 1 Outline of experiment design, fROI modeling. a Experiment design and fROI modeling. BOLD responses to each image were collected using anevent-related fMRI experiment (top), and the functional ROIs (FFA, EBA, PPA) were defined in each subject using an independent functional localizer(schematically outlined on the brain in red). The same images were then fed to several candidate image-computable models (base-models, below). Using asubset of stimuli, we learn a linear mapping (right) from each model to each brain region (see Methods) to build a brain model for each region based oneach CNN model. The brain-models for each region were then evaluated based on the ability to predict the responses to held-out images not used in themapping (integrative benchmarking). Note that images here are used only for illustrative purposes and are not the actual images used in the experiment.Permission was obtained from the parents of the person in the photograph to publish the image used in this figure.
NATURE COMMUNICATIONS | https://doi.org/10.1038/s41467-021-25409-6 ARTICLE
NATURE COMMUNICATIONS | (2021) 12:5540 | https://doi.org/10.1038/s41467-021-25409-6 |www.nature.com/naturecommunications 3
categories and even across participants. Testing predictionswithin categories also exposed a larger gap between the modelpredictions and responses, which indicates room for furthermodel-development efforts.
ANN models of the ventral stream also predict voxel-wise andpopulation-level representational dissimilarities across imagesin the FFA, PPA, and EBA in individual subjects. The previousanalyses evaluate the ability of models to predict the pooledresponse averaged across voxels within each category-selectivefROI in an effort to build models that generalize across subjectsand directly interface with the bulk of prior experimental litera-ture on these regions. But of course information in these regionsis coded by the distributed pattern of response across the neuralpopulation. So, how well do these models predict the voxel-wiseresponses (similar to other modeling studies22,23,32,38–40) in eachregion? And how correlated are the voxel-wise metrics of pre-dictivity to the pooled population metrics, across models? To findout, we screened all 60 models as before, but this time on eachindividual voxel in every participant, and to the patterns ofresponses across voxels within a region. Specifically, we calculatedthe correlation between model predictions and the observedneural response for all the models using two population-levelmetrics: (i) a neural predictivity metric based on building modelsfor every voxel and measuring the median correlation betweenthe observed and predicted responses across voxels, and (ii) apopulation-level Representational Dissimilarity Matrix (RDM)-based metric, which was computed by comparing the observedpopulation RDM within each fROI with the model-predicted
RDM based on transforming the voxel-wise predictions intoRDMs. The neural predictivity scores for all 60 models tested onboth population-level metrics are shown in Fig. S5. We observeda striking match between the fROI mean and the voxel-wisescores (Spearman R= 0.99, P < 0.00001, N= 60 models). Note,however, that the neural predictivity scores for the mean-fROIresponses were in general higher, presumably because averagingacross voxels increased SNR. It is also clear that the models thatbest predict the mean responses within individual ROIs, also bestpredict the voxel-wise responses and the RDMs (Fig. S5, and seeFig. S6 for the observed and predicted RDMs for a few repre-sentative models) in individual subjects. Together these resultsshow the success of our encoding models at predicting the voxel-wise responses as well as population-based RDMs of these fROIswith high accuracy, and that the pooled and population-levelmetrics are highly correlated for these data.
ANN models of the ventral stream have higher predictiveaccuracy than category-based descriptive models and domainexperts. As we have demonstrated, our encoding models for theFFA, EBA, and the PPA based on a trained ResNet50 are highlyaccurate at predicting the observed responses to individual images,even within the preferred category. This finding indicates that themodels are capturing something beyond a binary distinctionbetween the preferred versus nonpreferred categories. But howmuch better are these models compared to the previous descriptivecharacterizations used for these regions? That is, are the modelscapturing a graded version of category selectivity, much like humanintuitions of graded category membership41,42? To find out, we
Predicted Responsearb. units
-2
-1
0
1
2
Obs
erve
d R
espo
nse
arb.
units
l-FFA r-FFA
.92****
.80****
.75****
.91****
.76****
.72***
-2 -1 0 1 2 -2 -1 0 1 2
Predicted Responsearb. units
l-EBA r-EBA
.90****
.77****
.71****
.92****
.78****
.80****
-2 -1 0 1 2 -2 -1 0 1 2
Obs
erve
d R
espo
nse
arb.
uni
ts
-2
-1
0
1
2
Predicted Responsearb. units
Predicted Responsearb. units
Predicted Response
l-PPA
Predicted Response
r-PPA
.88****
.76****
.49****
.90****
.62****
-2 -1 0 1 2 -2 -1 0 1 2
.81****-2
-1
0
1
2
Pooled modelacross subjects
a. b. c.
d. e. f.all fROIs
0
1
lhrh
lhrh
lhrh
within
faces
within
bodie
s
within
objec
ts
within
scen
es
within
faces
within
bodie
s
within
objec
ts
within
scen
es
within
faces
within
bodie
s
within
objec
ts
within
scen
es
baseline
Neu
ral P
redi
ctiv
ity, R
FFA EBA PPA
0.6
0.7
0.8
0.9
1.0
lFFA rFFArEBAlEBArPPAlPPAN
eura
l Pre
dict
ivity
, R
all st
imuli
within
categ
ory
shuff
led ba
selin
e
noise
-ceilin
g
*
Obs
erve
d R
espo
nse
arb.
uni
ts
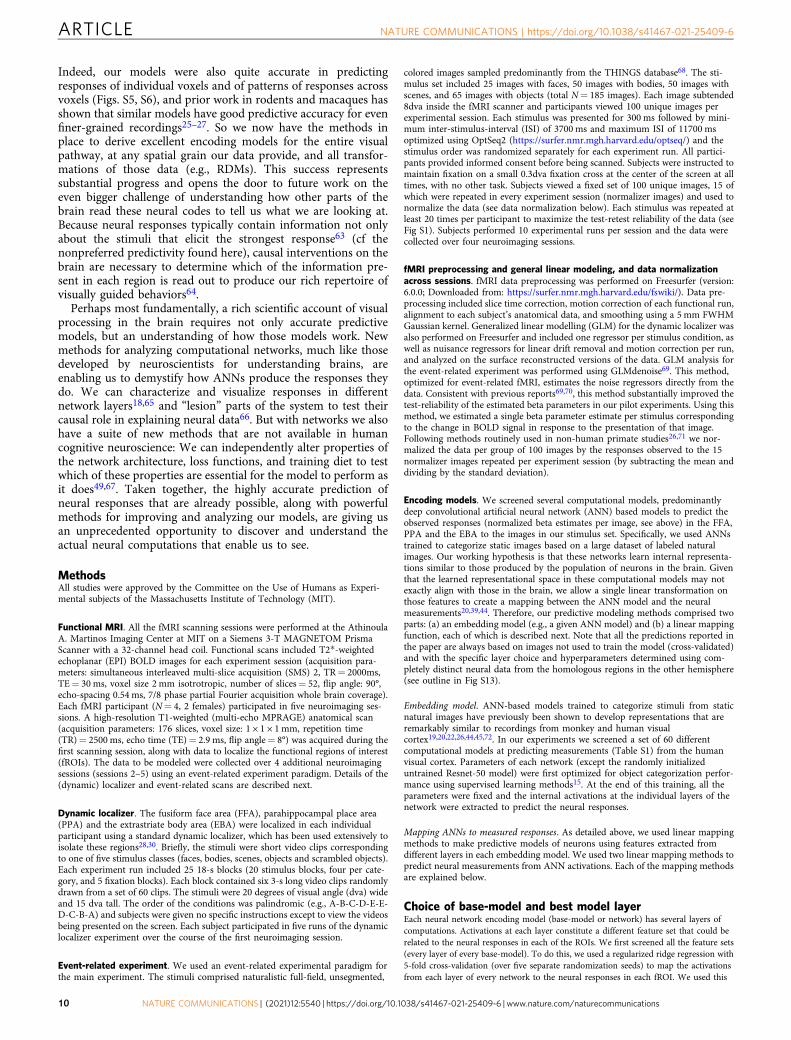
Fig. 2 Models accurately predict image-level responses of the FFA, PPA, and EBA and generalize across subjects. a Scatterplots show the cross-validated predicted response (x-axis) v/s observed response (y-axis) for each of the 185 stimuli for the left and right FFA (left and right columns,respectively). Numbers indicate correlation between the predicted and observed data across all stimuli (black text), for stimuli within the hypothesizedpreferred category (blue dots and text) and stimuli not within the hypothesized preferred category (pink dots and text). The dotted line denotes the x= yline and **** is P < 0.00005. Source data are provided as a Source Data file. b Same as a but for left and right EBA. Source data are provided as a SourceData file. c Same as a but for left and right PPA. Source data are provided as a Source Data file. d Schematic describing how the data were pooled acrosssubjects. Data were averaged within each fROI (schematized as a red circle) in every subject and pooled across subjects and the computational modelswere built to predict the pooled responses for previously unseen images across participants. e Computational models predict the responses to individualstimuli within each of the fROIs (circles) significantly better than the within-category image shuffled baseline controls (triangles). Ticks indicate the meanand the errorbars indicate the std over samples. N= 6 fROIs. * is P= 0.03, two-sided Wilcoxon signed-rank test across fROIs, demonstrating predictiveaccuracy as a function of not just category but individual images. Source data are provided as a Source Data file. f Computational models predict responsesto individual stimuli even for stimuli within each of the categories. Each circle indicates the model performance for the FFA (left column), EBA (middlecolumn), and the PPA (right column), the dashed line at 0 indicates the expected baseline performance if models did not predict any image-grainedvariance within the categories. The shaded regions indicate the estimated noise-ceiling of the data. Source data are provided as a Source Data file.
ARTICLE NATURE COMMUNICATIONS | https://doi.org/10.1038/s41467-021-25409-6
4 NATURE COMMUNICATIONS | (2021) 12:5540 | https://doi.org/10.1038/s41467-021-25409-6 | www.nature.com/naturecommunications
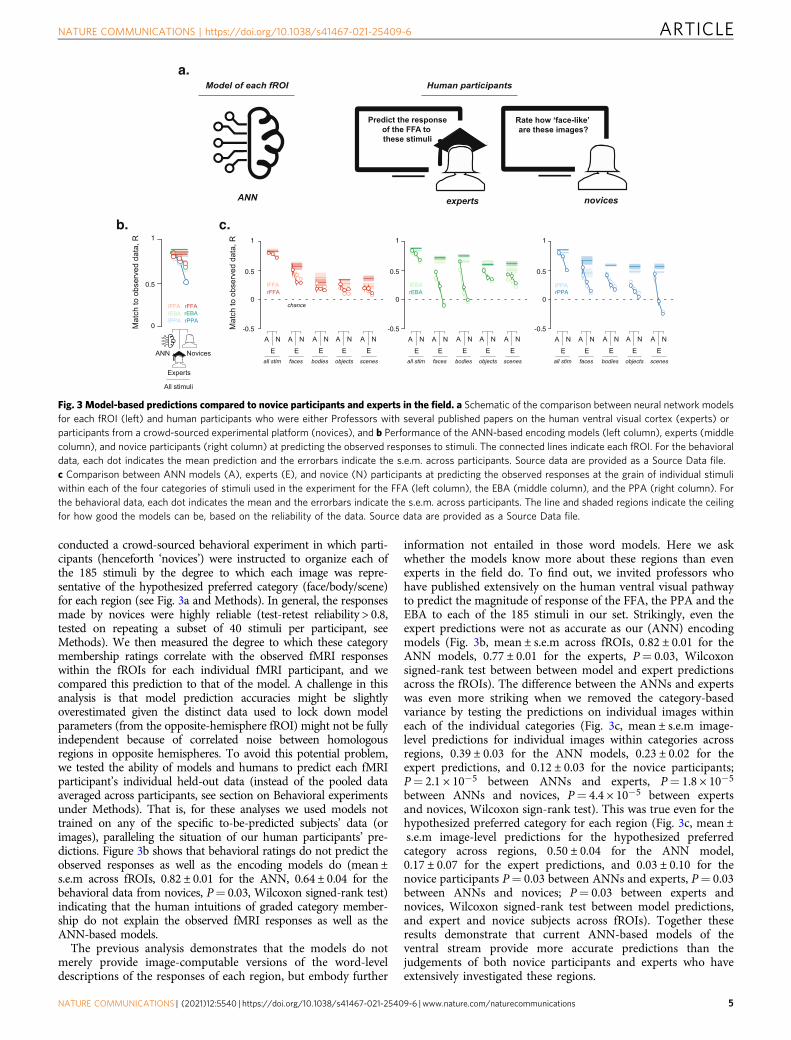
conducted a crowd-sourced behavioral experiment in which parti-cipants (henceforth ‘novices’) were instructed to organize each ofthe 185 stimuli by the degree to which each image was repre-sentative of the hypothesized preferred category (face/body/scene)for each region (see Fig. 3a and Methods). In general, the responsesmade by novices were highly reliable (test-retest reliability > 0.8,tested on repeating a subset of 40 stimuli per participant, seeMethods). We then measured the degree to which these categorymembership ratings correlate with the observed fMRI responseswithin the fROIs for each individual fMRI participant, and wecompared this prediction to that of the model. A challenge in thisanalysis is that model prediction accuracies might be slightlyoverestimated given the distinct data used to lock down modelparameters (from the opposite-hemisphere fROI) might not be fullyindependent because of correlated noise between homologousregions in opposite hemispheres. To avoid this potential problem,we tested the ability of models and humans to predict each fMRIparticipant’s individual held-out data (instead of the pooled dataaveraged across participants, see section on Behavioral experimentsunder Methods). That is, for these analyses we used models nottrained on any of the specific to-be-predicted subjects’ data (orimages), paralleling the situation of our human participants’ pre-dictions. Figure 3b shows that behavioral ratings do not predict theobserved responses as well as the encoding models do (mean ±s.e.m across fROIs, 0.82 ± 0.01 for the ANN, 0.64 ± 0.04 for thebehavioral data from novices, P= 0.03, Wilcoxon signed-rank test)indicating that the human intuitions of graded category member-ship do not explain the observed fMRI responses as well as theANN-based models.
The previous analysis demonstrates that the models do notmerely provide image-computable versions of the word-leveldescriptions of the responses of each region, but embody further
information not entailed in those word models. Here we askwhether the models know more about these regions than evenexperts in the field do. To find out, we invited professors whohave published extensively on the human ventral visual pathwayto predict the magnitude of response of the FFA, the PPA and theEBA to each of the 185 stimuli in our set. Strikingly, even theexpert predictions were not as accurate as our (ANN) encodingmodels (Fig. 3b, mean ± s.e.m across fROIs, 0.82 ± 0.01 for theANN models, 0.77 ± 0.01 for the experts, P= 0.03, Wilcoxonsigned-rank test between between model and expert predictionsacross the fROIs). The difference between the ANNs and expertswas even more striking when we removed the category-basedvariance by testing the predictions on individual images withineach of the individual categories (Fig. 3c, mean ± s.e.m image-level predictions for individual images within categories acrossregions, 0.39 ± 0.03 for the ANN models, 0.23 ± 0.02 for theexpert predictions, and 0.12 ± 0.03 for the novice participants;P= 2.1 × 10⁻⁵ between ANNs and experts, P= 1.8 × 10⁻⁵
between ANNs and novices, P= 4.4 × 10⁻⁵ between expertsand novices, Wilcoxon sign-rank test). This was true even for thehypothesized preferred category for each region (Fig. 3c, mean ±s.e.m image-level predictions for the hypothesized preferredcategory across regions, 0.50 ± 0.04 for the ANN model,0.17 ± 0.07 for the expert predictions, and 0.03 ± 0.10 for thenovice participants P= 0.03 between ANNs and experts, P= 0.03between ANNs and novices; P= 0.03 between experts andnovices, Wilcoxon signed-rank test between model predictions,and expert and novice subjects across fROIs). Together theseresults demonstrate that current ANN-based models of theventral stream provide more accurate predictions than thejudgements of both novice participants and experts who haveextensively investigated these regions.
Fig. 3 Model-based predictions compared to novice participants and experts in the field. a Schematic of the comparison between neural network modelsfor each fROI (left) and human participants who were either Professors with several published papers on the human ventral visual cortex (experts) orparticipants from a crowd-sourced experimental platform (novices), and b Performance of the ANN-based encoding models (left column), experts (middlecolumn), and novice participants (right column) at predicting the observed responses to stimuli. The connected lines indicate each fROI. For the behavioraldata, each dot indicates the mean prediction and the errorbars indicate the s.e.m. across participants. Source data are provided as a Source Data file.c Comparison between ANN models (A), experts (E), and novice (N) participants at predicting the observed responses at the grain of individual stimuliwithin each of the four categories of stimuli used in the experiment for the FFA (left column), the EBA (middle column), and the PPA (right column). Forthe behavioral data, each dot indicates the mean and the errorbars indicate the s.e.m. across participants. The line and shaded regions indicate the ceilingfor how good the models can be, based on the reliability of the data. Source data are provided as a Source Data file.
NATURE COMMUNICATIONS | https://doi.org/10.1038/s41467-021-25409-6 ARTICLE
NATURE COMMUNICATIONS | (2021) 12:5540 | https://doi.org/10.1038/s41467-021-25409-6 |www.nature.com/naturecommunications 5
The fact that our models make accurate predictions andoperate directly on image pixels (i.e., are image computable)enables us to use these models to ask new questions. Next we usethe models to put the claims of the hypothesized categoryselectivity of these regions to their strongest test yet.
ANN models of the ventral stream enable strong tests ofcategory selectivity. Now that we are equipped with computa-tionally precise encoding models that can predict the responses inthe FFA, PPA, and EBA with high accuracy, can we connect thesefindings in neuroscience to other fields, which use verbaldescriptions of category selectivity? To do this we first need toknow if the previously claimed category selectivity of each regionis even true, given that the responses in these regions have beentested for only a very small subset of possible images. Categoryselectivity can be defined and quantified in several different ways,but the most common definition concerns the category of imagesthat evoke the highest response in a neuron or voxel or region.According to this criterion the selectivity of the FFA for facescould be falsified if any of the stimuli producing the highestresponses in this region are not faces (as judged by humans).
So, are faces in fact the stimuli that produce the highestresponse in the FFA, places in the PPA, and bodies in the EBA?Here we cycle back to use the ANN-based models to put thecategory selectivity of these regions to a strong test by usingmodels to simulate high-throughput experiments that could notbe run with actual fMRI measurements. Specifically, we used ourpredictive models to screen ~3.5 million stimuli (N= 3,450,194images, Fig. 4a) from three popular natural image databases tofind the images predicted to produce the strongest response ineach region. These datasets include VGGface, which consists offaces only, usually used to train models on face discriminationtasks; Imagenet, a diverse stimulus set with 1000 different objectcategories; and Places2, a stimulus set with snapshots of 400unique place categories usually used to train models on scenecategorization tasks. A histogram of the predicted responses ofeach fROI for all ~3.5 million images is presented for eachstimulus database in Fig. 4b. The histogram for the FFA forinstance, shows that the responses to (face) stimuli from theVGGface database is considerably higher than the response tostimuli in the other databases. The key question though iswhether any of the top-predicted images based on this high-throughput screening procedure are not members of thehypothesized preferred category. To find out, we first visuallyinspected each of the top-predicted 5000 images for each region.Remarkably, we found that all were unambiguous members of thehypothesized preferred category for that region (five representa-tive images are shown in Fig. 4c). To test farther down the list, wesub-subsampled the top two images from each thousand of thetop 100,000 images for each region (Figs. S7-S9). Again, we foundthat all 200 such images were unambiguous members of eachregion’s hypothesized preferred category.
Finally, for the case of faces and the FFA and PPA, weperformed an additional test wherein we removed all the imagesin the VGG-face image set (that the builders of that set labeled asfaces), and all the images in the Places2 image set (that its buildershad previously labeled as places). Remarkably, when we askedeach model to report the remaining 5000 most preferred imagesin those sets, the FFA model still ended up finding only stimulicontaining faces and the PPA model still only found stimulicontaining places (Figs. S10-S10). Had we found any stimuli pre-dicted to produce a strong response in a region that were notmembers of the hypothesized preferred category for that region,we would have cycled back to scan participants viewing thoseimages to see if indeed they produced the predicted high
responses. But we did not find such images, so there were nopotentially hypothesis-falsifying stimuli to scan. This findingfurther strengthens the inference that these regions are indeedselective for faces and places.
Is this observation guaranteed, given that these regions weredefined by a preference for one category over others? Toinvestigate whether the alternative outcome was even possible,e.g., that the images predicted to produce the highest response inthe FFA would not be faces, we performed a simulation of theexperiment run on our human participants but instead on singleunits within a control ANN model. Briefly, we identified putative“face units” from the conv-5 layer of Alexnet based on snapshotsfrom the dynamic localizer used in our experiment and built aResNet-50 based computational model to predict the response tothe 185 images averaged over these putative face units. In thiscase we find that despite choosing the model units (from Alexnetlayer conv-5) that were putatively “face-selective” based on thehigher response to faces than to bodies, scenes, and objects onthe localizer task, 85% of the top-predicted images for those unitsare not faces (as compared to 0% for the human FFA). Thissimulation demonstrates that our method is capable of falsifyingpreviously observed selectivities and that the model-derived “faceunits” were not as face-selective as the human FFA (Fig S12).
As we demonstrated above, the high-throughput screeningstrategy is a powerful way to test category selectivity, but it stilldepends on having the stimuli capable of falsifying the hypothesisin the screened stimulus databases. To address this limitation, weturned to a complementary image synthesis method. Specifically,given each encoding model (above), we used a generativeadversarial network (GAN) to synthesize images that the modelpredicts would strongly activate each fROI (Fig. 4d). This methodallows exploration of the naturalistic images space that is muchbroader than sifting through photographic databases (above). Wefound that the preferred images synthesized by the algorithmcould be easily recognized as members of the previouslyhypothesized preferred category (Fig. 4e). Taken together, boththe image screening and synthesis procedures demonstrate thepower of the computational modeling approach that now enableus to strongly test and validate the claims of category selectivityfor the FFA, PPA, and EBA on naturalistic images in a way thatwas not possible before.
ANN models of the ventral stream enable efficient identifica-tion of features of the stimulus that drive neural responses inthe fROIs. Our previous analyses demonstrated how models ofthe ventral stream can be used to put theories of category selec-tivity to strong tests. But, as presented above, they still do notprovide any human-interpretable intuition about which featuresof the preferred stimuli drive the responses within their respectivefROIs. This is not only an important scientific question in its ownright, but also one that could increase our confidence in the use ofthese models, by ascertaining whether the model is doing what wethink it is doing (e.g., responding to face parts rather than inci-dental features associated with faces like hair or earrings). Dis-tilling this human-interpretable intuition about each brainsubregion directly from neuroimaging experiments has provenchallenging because the standard approaches (reverse correlationor partial occlusion) require measuring responses to a very largenumber of images. Next we show how computational models mayhelp overcome this critical barrier using a variant of RandomizedInput Sampling for Explanation (RISE)43. Conceptually, thismethod relies on applying a large number of different occludingmasks (2000 masks per image) to randomly subsample differentparts of an image, obtaining the predicted response to eachmasked image for each fROI, and finally linearly combining the
ARTICLE NATURE COMMUNICATIONS | https://doi.org/10.1038/s41467-021-25409-6
6 NATURE COMMUNICATIONS | (2021) 12:5540 | https://doi.org/10.1038/s41467-021-25409-6 | www.nature.com/naturecommunications
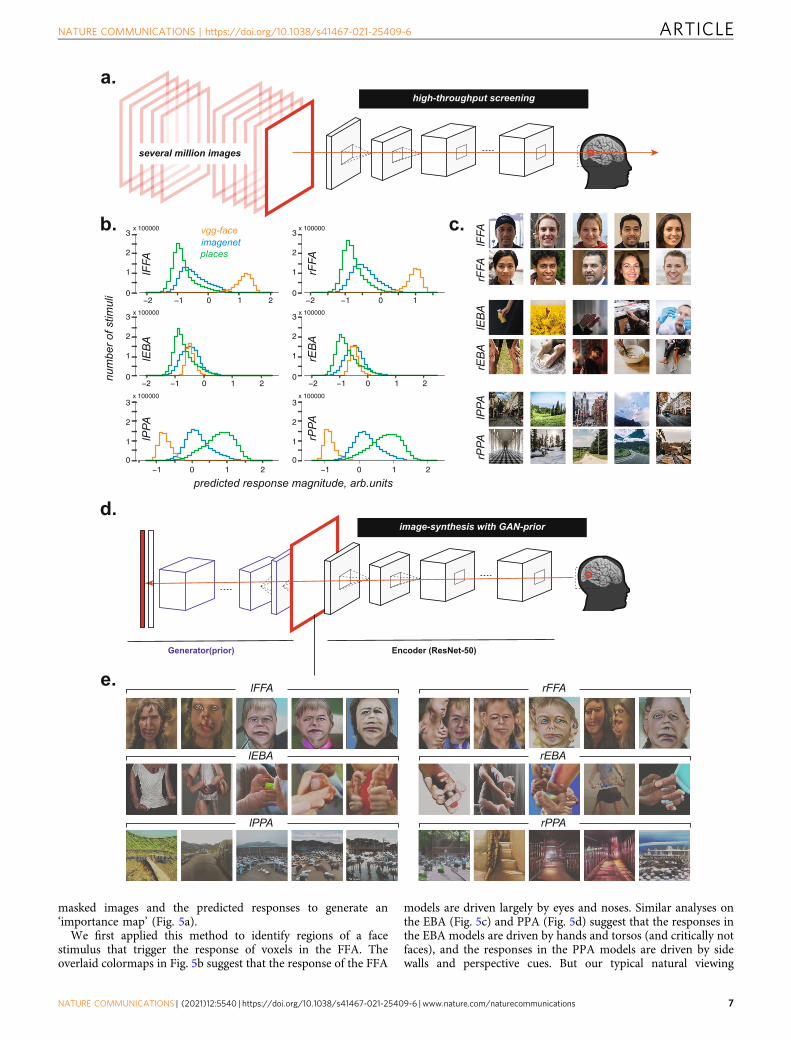
masked images and the predicted responses to generate an‘importance map’ (Fig. 5a).
We first applied this method to identify regions of a facestimulus that trigger the response of voxels in the FFA. Theoverlaid colormaps in Fig. 5b suggest that the response of the FFA
models are driven largely by eyes and noses. Similar analyses onthe EBA (Fig. 5c) and PPA (Fig. 5d) suggest that the responses inthe EBA models are driven by hands and torsos (and critically notfaces), and the responses in the PPA models are driven by sidewalls and perspective cues. But our typical natural viewing
Encoder (ResNet-50)Generator(prior)
−2 −1 0 1 2
num
ber o
f stim
uli −2 −1 0 1
−2 −1 0 1 2 −2 −1 0 1 2
−1 0 1 2
predicted response magnitude, arb.units−1 0 1 2
1
2
3
0
1
2
3
0
1
2
3
0
x 100000 x 100000
1
2
3
0
1
2
3
0
1
2
3
0
lFFA
rFFA
lEB
ArE
BA
lPPA
rPPA
x 100000 x 100000
x 100000 x 100000
imagenetvgg-face
places
several million images
high-throughput screening
image-synthesis with GAN-prior
a.
b. c.
d.
rFFA
rEBA
rPPA
lFFA
lEBA
lPPA
e.
lFFA
rFFA
lEB
A
rEB
A
lPPA
rPPA
NATURE COMMUNICATIONS | https://doi.org/10.1038/s41467-021-25409-6 ARTICLE
NATURE COMMUNICATIONS | (2021) 12:5540 | https://doi.org/10.1038/s41467-021-25409-6 |www.nature.com/naturecommunications 7
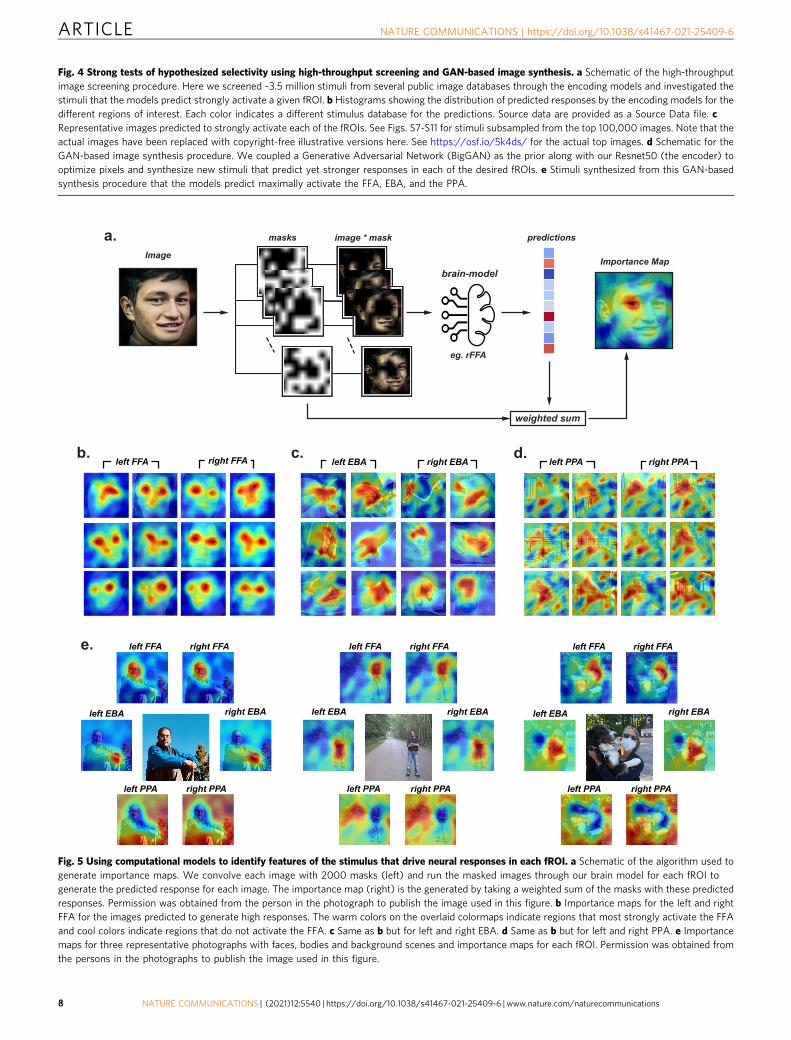
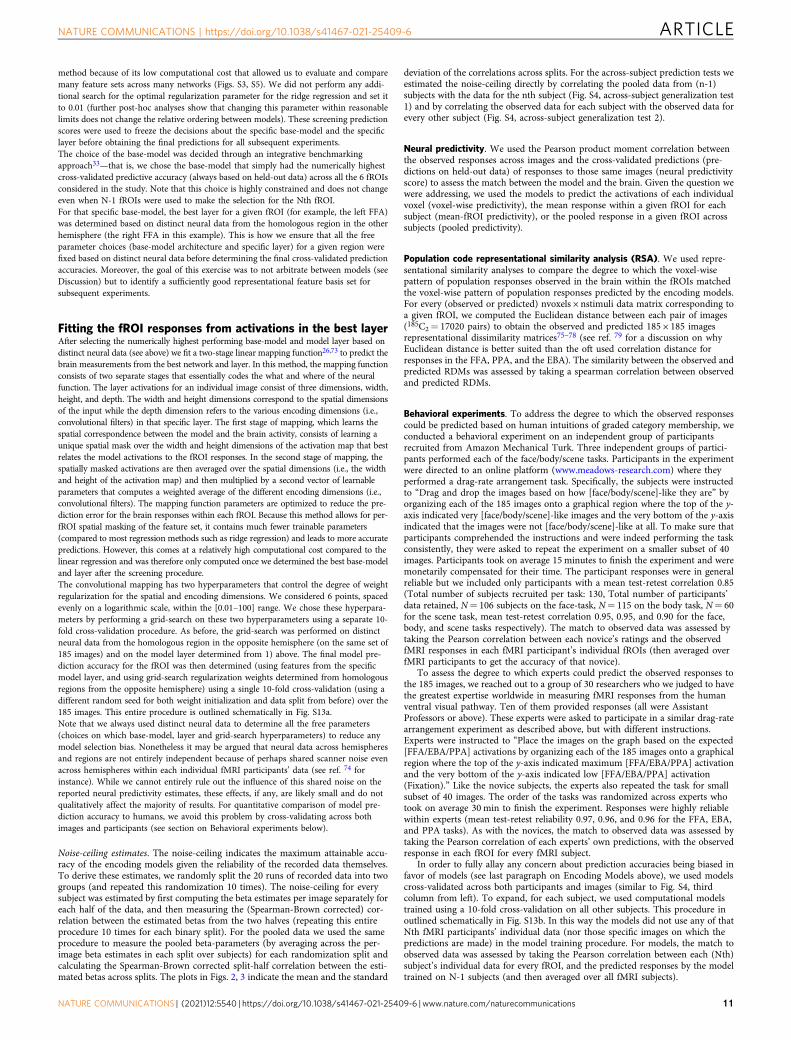
Fig. 4 Strong tests of hypothesized selectivity using high-throughput screening and GAN-based image synthesis. a Schematic of the high-throughputimage screening procedure. Here we screened ~3.5 million stimuli from several public image databases through the encoding models and investigated thestimuli that the models predict strongly activate a given fROI. b Histograms showing the distribution of predicted responses by the encoding models for thedifferent regions of interest. Each color indicates a different stimulus database for the predictions. Source data are provided as a Source Data file. cRepresentative images predicted to strongly activate each of the fROIs. See Figs. S7-S11 for stimuli subsampled from the top 100,000 images. Note that theactual images have been replaced with copyright-free illustrative versions here. See https://osf.io/5k4ds/ for the actual top images. d Schematic for theGAN-based image synthesis procedure. We coupled a Generative Adversarial Network (BigGAN) as the prior along with our Resnet50 (the encoder) tooptimize pixels and synthesize new stimuli that predict yet stronger responses in each of the desired fROIs. e Stimuli synthesized from this GAN-basedsynthesis procedure that the models predict maximally activate the FFA, EBA, and the PPA.
masks image * mask predictions
brain-modelImportance Map
Image
weighted sum
left FFA right FFA left EBA right EBA left PPA right PPA
left FFA right FFA
right EBAleft EBA
left PPA right PPA
left FFA right FFA
right EBAleft EBA
left PPA right PPA
a.
b. c. d.
e.
right EBAleft EBA
left FFA right FFA
left PPA right PPA
eg. rFFA
Fig. 5 Using computational models to identify features of the stimulus that drive neural responses in each fROI. a Schematic of the algorithm used togenerate importance maps. We convolve each image with 2000 masks (left) and run the masked images through our brain model for each fROI togenerate the predicted response for each image. The importance map (right) is the generated by taking a weighted sum of the masks with these predictedresponses. Permission was obtained from the person in the photograph to publish the image used in this figure. b Importance maps for the left and rightFFA for the images predicted to generate high responses. The warm colors on the overlaid colormaps indicate regions that most strongly activate the FFAand cool colors indicate regions that do not activate the FFA. c Same as b but for left and right EBA. d Same as b but for left and right PPA. e Importancemaps for three representative photographs with faces, bodies and background scenes and importance maps for each fROI. Permission was obtained fromthe persons in the photographs to publish the image used in this figure.
ARTICLE NATURE COMMUNICATIONS | https://doi.org/10.1038/s41467-021-25409-6
8 NATURE COMMUNICATIONS | (2021) 12:5540 | https://doi.org/10.1038/s41467-021-25409-6 | www.nature.com/naturecommunications
experience rarely contains isolated stimuli like the maximallyactivating images used for these analyses. Do models for the FFA,EBA, and the PPA isolate the faces, bodies, and scenes from suchcomposite images? We tested this question on complex naturalimages (Fig. 5e) and indeed as hypothesized, we find thatcomputational models of the fROIs identify the expected regionof the scene containing preferred stimuli for that region. Togetherthese analyses demonstrate the utility of computational models inbuilding hypotheses about which features of a stimulus aredriving the predicted responses in a given region of the brain. Ofcourse once any new hypotheses are derived from the models,they should be tested empirically with actual brain measurements.
DiscussionIn this study we built and tested computational models of three ofthe most extensively studied regions of the human ventral visualpathway, the FFA, the EBA, and the PPA. We find that particularANN-based models of the primate ventral stream can predict theresponse of these regions to novel images with high accuracy.We also show that the predictions made by these models gen-eralize across participants and are more accurate than priordescriptive models and even experts in the field. Most impor-tantly, these predictive models enabled us to subject the claimedcategory selectivity of the FFA, PPA, and EBA to their strongesttests on naturalistic images to date. We used the models to screenmillions of images, and to synthesize novel images, to ask whetherany of the images predicted to produce the highest responses ineach region are not members of the hypothesized preferredcategory for that region. In both cases, we failed to find suchimages, even though our approach has the power to do so, thussubstantially strengthening the previous claims of face, scene, andbody selectivity of the FFA, PPA, and EBA.
We are not the first to use ANN-based predictive models ofneural responses measured with either neurophysiology21,44 orfMRI22,45–48. What is new in our study is the high accuracy of ourmodel predictions, their application to the mean response of entirecortical subregions (as well as patterns of response within thoseregions), their ability to generalize across participants, and mostimportantly, the ability to test longstanding hypotheses about theselectivity of each region. Our ANN-based models also provideefficient and high-throughput methods for discovering featureswithin each preferred image that might drive each region. OurANN-based models not only confirm, but also go beyond classic“word models” (i.e. that the FFA, PPA, and EBA are selective forfaces, places, and bodies respectively) in two important respects.First, they are image computable, so we no longer need a human totell us if an image is a face or place or body to predict if a brainregion is likely to respond to that image. Second, they provide fine-grained predictions of the responses to individual images bothwithin and outside the preferred category. As we show, thesemodels outperform both binary and graded versions of the categoryselectivity hypothesis, and thus “know”more about the selectivity ofeach region than is entailed in the simple category-selective wordlabel. Further, the models’ ability to outperform even scientificexperts who have extensive experience measuring the responses ofthese regions shows that these models contain new informationabout these regions not already built into the intuitions of experts inthe field. We provide the vision community with this new syn-thesized knowledge as downloadable models of entire corticalregions, as well as with a roadmap for testing their own hypothesesof the FFA, PPA, and EBA.
Given all of these advantages of the ANN-based encodingmodels, should we now dispense entirely with word models? Wethink not. Because word-based hypotheses are grounded ineveryday concepts, they provide accessible and intuitive
explanations of the function of each cortical region. Further,theories in psychology and development and evolution concernreal entities in the world like faces and places and bodies, andtheir significance to humans, which cannot be fully captured byvectors of connection weights. Word-based models are thereforenecessary to interface between the rich tradition of findings andtheories from those fields, and the empirical findings in neu-roscience. For all these reasons, ANN-based computationalmodels complement rather than replace word models. Minimally,the words “face”, “body”, and “place” serve as pointers to the codethat can be used to execute the current models of each brainsubregion.
Although ResNet50-V1 provided the numerically most accuratemodels across regions (consistent with ref. 38) based on a broadscreen of models it is important to note that a single study or smallnumber of regions considered (as in our own work) is insufficient toprescribe a single base-model as being the most brain-like. Ulti-mately the model arbitration will require a community-wide effortand rigorous integrative benchmarking on completely independentdata from new subjects and evermore regions (similar to say theBrainScore platform21,33 for non-human primate data). Animportant contribution of our work is the fROI-scale of computa-tional modeling, which makes it possible to evaluate our exactmodel on completely independent subjects, hypotheses, and data.fROIs like the FFA, PPA, and EBA can be isolated in almost allparticipants and our models make testable predictions and are moredirectly falsifiable than say voxel-wise models (though as we show,these metrics are highly correlated).
That said, our current modeling efforts also show that there isroom for improvement for example in the within-category predic-tions. One route will make use of new models now being developedthat include known properties of biological networks49–52 and thatmay better fit neural responses. Another route will learn from modelfailures in an effort to improve predictive accuracy. For example, theANNs used here were trained on naturalistic images, are vulnerableto targeted adversarial attacks53,54 and are known to have limitedgeneralizations to out-of-domain sample distributions (for instance,do not generalize from natural images to line drawings). Theseshortcomings suggest that these models are not likely to accuratelypredict observed fMRI responses to more abstract3,55,56 and sym-bolic stimuli57–60 including contextually defined faces61,62. Thus animportant avenue of future work will entail exposing and expandingthe bounds within which these models retain their predictive power.An effective strategy could be to run evermore targeted experimentsthat push model-development efforts either by including morediverse set of stimuli for training (like sketches, line drawings, car-toons etc.), or stronger inductive biases as biological networks.
Further, our ultimate our goal as vision researchers is to buildcomputational models that not only predict neural responses in agiven region of the brain, but that also reveal the full sequence ofcomputations over all successive stages of visual processing thatlead to those responses. For example, future work can also testwhether cortical regions thought to provide input to the FFA andPPA (e.g., the OFA and OPA, respectively) match earlier layers inthe network. An example of this “simultaneous compare at allprocessing levels” approach has recently been taken up by theBrain-Score open model evaluation platform33. Thus, our currentwork is just the first iteration of a cycle of high-quality datacollection and model improvement that should evermore accu-rately capture the computations entailed in visual informationprocessing.
In this paper we have focused on building models that canaccurately predict the mean response of each cortical subregion(i.e., as if it were a single “unit”). Of course, information isencoded in each subregion not by the mean response of millionsof neurons, but by the pattern of response across those neurons.
NATURE COMMUNICATIONS | https://doi.org/10.1038/s41467-021-25409-6 ARTICLE
NATURE COMMUNICATIONS | (2021) 12:5540 | https://doi.org/10.1038/s41467-021-25409-6 |www.nature.com/naturecommunications 9
Indeed, our models were also quite accurate in predictingresponses of individual voxels and of patterns of responses acrossvoxels (Figs. S5, S6), and prior work in rodents and macaques hasshown that similar models have good predictive accuracy for evenfiner-grained recordings25–27. So we now have the methods inplace to derive excellent encoding models for the entire visualpathway, at any spatial grain our data provide, and all transfor-mations of those data (e.g., RDMs). This success representssubstantial progress and opens the door to future work on theeven bigger challenge of understanding how other parts of thebrain read these neural codes to tell us what we are looking at.Because neural responses typically contain information not onlyabout the stimuli that elicit the strongest response63 (cf thenonpreferred predictivity found here), causal interventions on thebrain are necessary to determine which of the information pre-sent in each region is read out to produce our rich repertoire ofvisually guided behaviors64.
Perhaps most fundamentally, a rich scientific account of visualprocessing in the brain requires not only accurate predictivemodels, but an understanding of how those models work. Newmethods for analyzing computational networks, much like thosedeveloped by neuroscientists for understanding brains, areenabling us to demystify how ANNs produce the responses theydo. We can characterize and visualize responses in differentnetwork layers18,65 and “lesion” parts of the system to test theircausal role in explaining neural data66. But with networks we alsohave a suite of new methods that are not available in humancognitive neuroscience: We can independently alter properties ofthe network architecture, loss functions, and training diet to testwhich of these properties are essential for the model to perform asit does49,67. Taken together, the highly accurate prediction ofneural responses that are already possible, along with powerfulmethods for improving and analyzing our models, are giving usan unprecedented opportunity to discover and understand theactual neural computations that enable us to see.
MethodsAll studies were approved by the Committee on the Use of Humans as Experi-mental subjects of the Massachusetts Institute of Technology (MIT).
Functional MRI. All the fMRI scanning sessions were performed at the AthinoulaA. Martinos Imaging Center at MIT on a Siemens 3-T MAGNETOM PrismaScanner with a 32-channel head coil. Functional scans included T2*-weightedechoplanar (EPI) BOLD images for each experiment session (acquisition para-meters: simultaneous interleaved multi-slice acquisition (SMS) 2, TR= 2000ms,TE= 30 ms, voxel size 2 mm isotrotropic, number of slices= 52, flip angle: 90°,echo-spacing 0.54 ms, 7/8 phase partial Fourier acquisition whole brain coverage).Each fMRI participant (N= 4, 2 females) participated in five neuroimaging ses-sions. A high-resolution T1-weighted (multi-echo MPRAGE) anatomical scan(acquisition parameters: 176 slices, voxel size: 1 × 1 × 1mm, repetition time(TR)= 2500 ms, echo time (TE)= 2.9 ms, flip angle= 8°) was acquired during thefirst scanning session, along with data to localize the functional regions of interest(fROIs). The data to be modeled were collected over 4 additional neuroimagingsessions (sessions 2–5) using an event-related experiment paradigm. Details of the(dynamic) localizer and event-related scans are described next.
Dynamic localizer. The fusiform face area (FFA), parahippocampal place area(PPA) and the extrastriate body area (EBA) were localized in each individualparticipant using a standard dynamic localizer, which has been used extensively toisolate these regions28,30. Briefly, the stimuli were short video clips correspondingto one of five stimulus classes (faces, bodies, scenes, objects and scrambled objects).Each experiment run included 25 18-s blocks (20 stimulus blocks, four per cate-gory, and 5 fixation blocks). Each block contained six 3-s long video clips randomlydrawn from a set of 60 clips. The stimuli were 20 degrees of visual angle (dva) wideand 15 dva tall. The order of the conditions was palindromic (e.g., A-B-C-D-E-E-D-C-B-A) and subjects were given no specific instructions except to view the videosbeing presented on the screen. Each subject participated in five runs of the dynamiclocalizer experiment over the course of the first neuroimaging session.
Event-related experiment. We used an event-related experimental paradigm forthe main experiment. The stimuli comprised naturalistic full-field, unsegmented,
colored images sampled predominantly from the THINGS database68. The sti-mulus set included 25 images with faces, 50 images with bodies, 50 images withscenes, and 65 images with objects (total N= 185 images). Each image subtended8dva inside the fMRI scanner and participants viewed 100 unique images perexperimental session. Each stimulus was presented for 300 ms followed by mini-mum inter-stimulus-interval (ISI) of 3700 ms and maximum ISI of 11700 msoptimized using OptSeq2 (https://surfer.nmr.mgh.harvard.edu/optseq/) and thestimulus order was randomized separately for each experiment run. All partici-pants provided informed consent before being scanned. Subjects were instructed tomaintain fixation on a small 0.3dva fixation cross at the center of the screen at alltimes, with no other task. Subjects viewed a fixed set of 100 unique images, 15 ofwhich were repeated in every experiment session (normalizer images) and used tonormalize the data (see data normalization below). Each stimulus was repeated atleast 20 times per participant to maximize the test-retest reliability of the data (seeFig S1). Subjects performed 10 experimental runs per session and the data werecollected over four neuroimaging sessions.
fMRI preprocessing and general linear modeling, and data normalizationacross sessions. fMRI data preprocessing was performed on Freesurfer (version:6.0.0; Downloaded from: https://surfer.nmr.mgh.harvard.edu/fswiki/). Data pre-processing included slice time correction, motion correction of each functional run,alignment to each subject’s anatomical data, and smoothing using a 5 mm FWHMGaussian kernel. Generalized linear modelling (GLM) for the dynamic localizer wasalso performed on Freesurfer and included one regressor per stimulus condition, aswell as nuisance regressors for linear drift removal and motion correction per run,and analyzed on the surface reconstructed versions of the data. GLM analysis forthe event-related experiment was performed using GLMdenoise69. This method,optimized for event-related fMRI, estimates the noise regressors directly from thedata. Consistent with previous reports69,70, this method substantially improved thetest-reliability of the estimated beta parameters in our pilot experiments. Using thismethod, we estimated a single beta parameter estimate per stimulus correspondingto the change in BOLD signal in response to the presentation of that image.Following methods routinely used in non-human primate studies26,71 we nor-malized the data per group of 100 images by the responses observed to the 15normalizer images repeated per experiment session (by subtracting the mean anddividing by the standard deviation).
Encoding models. We screened several computational models, predominantlydeep convolutional artificial neural network (ANN) based models to predict theobserved responses (normalized beta estimates per image, see above) in the FFA,PPA and the EBA to the images in our stimulus set. Specifically, we used ANNstrained to categorize static images based on a large dataset of labeled naturalimages. Our working hypothesis is that these networks learn internal representa-tions similar to those produced by the population of neurons in the brain. Giventhat the learned representational space in these computational models may notexactly align with those in the brain, we allow a single linear transformation onthose features to create a mapping between the ANN model and the neuralmeasurements20,39,44. Therefore, our predictive modeling methods comprised twoparts: (a) an embedding model (e.g., a given ANN model) and (b) a linear mappingfunction, each of which is described next. Note that all the predictions reported inthe paper are always based on images not used to train the model (cross-validated)and with the specific layer choice and hyperparameters determined using com-pletely distinct neural data from the homologous regions in the other hemisphere(see outline in Fig S13).
Embedding model. ANN-based models trained to categorize stimuli from staticnatural images have previously been shown to develop representations that areremarkably similar to recordings from monkey and human visualcortex19,20,22,26,44,45,72. In our experiments we screened a set of 60 differentcomputational models at predicting measurements (Table S1) from the humanvisual cortex. Parameters of each network (except the randomly initializeduntrained Resnet-50 model) were first optimized for object categorization perfor-mance using supervised learning methods15. At the end of this training, all theparameters were fixed and the internal activations at the individual layers of thenetwork were extracted to predict the neural responses.
Mapping ANNs to measured responses. As detailed above, we used linear mappingmethods to make predictive models of neurons using features extracted fromdifferent layers in each embedding model. We used two linear mapping methods topredict neural measurements from ANN activations. Each of the mapping methodsare explained below.
Choice of base-model and best model layerEach neural network encoding model (base-model or network) has several layers ofcomputations. Activations at each layer constitute a different feature set that could berelated to the neural responses in each of the ROIs. We first screened all the feature sets(every layer of every base-model). To do this, we used a regularized ridge regression with5-fold cross-validation (over five separate randomization seeds) to map the activationsfrom each layer of every network to the neural responses in each fROI. We used this
ARTICLE NATURE COMMUNICATIONS | https://doi.org/10.1038/s41467-021-25409-6
10 NATURE COMMUNICATIONS | (2021) 12:5540 | https://doi.org/10.1038/s41467-021-25409-6 | www.nature.com/naturecommunications
method because of its low computational cost that allowed us to evaluate and comparemany feature sets across many networks (Figs. S3, S5). We did not perform any addi-tional search for the optimal regularization parameter for the ridge regression and set itto 0.01 (further post-hoc analyses show that changing this parameter within reasonablelimits does not change the relative ordering between models). These screening predictionscores were used to freeze the decisions about the specific base-model and the specificlayer before obtaining the final predictions for all subsequent experiments.The choice of the base-model was decided through an integrative benchmarkingapproach33—that is, we chose the base-model that simply had the numerically highestcross-validated predictive accuracy (always based on held-out data) across all the 6 fROIsconsidered in the study. Note that this choice is highly constrained and does not changeeven when N-1 fROIs were used to make the selection for the Nth fROI.For that specific base-model, the best layer for a given fROI (for example, the left FFA)was determined based on distinct neural data from the homologous region in the otherhemisphere (the right FFA in this example). This is how we ensure that all the freeparameter choices (base-model architecture and specific layer) for a given region werefixed based on distinct neural data before determining the final cross-validated predictionaccuracies. Moreover, the goal of this exercise was to not arbitrate between models (seeDiscussion) but to identify a sufficiently good representational feature basis set forsubsequent experiments.
Fitting the fROI responses from activations in the best layerAfter selecting the numerically highest performing base-model and model layer based ondistinct neural data (see above) we fit a two-stage linear mapping function26,73 to predict thebrain measurements from the best network and layer. In this method, the mapping functionconsists of two separate stages that essentially codes the what and where of the neuralfunction. The layer activations for an individual image consist of three dimensions, width,height, and depth. The width and height dimensions correspond to the spatial dimensionsof the input while the depth dimension refers to the various encoding dimensions (i.e.,convolutional filters) in that specific layer. The first stage of mapping, which learns thespatial correspondence between the model and the brain activity, consists of learning aunique spatial mask over the width and height dimensions of the activation map that bestrelates the model activations to the fROI responses. In the second stage of mapping, thespatially masked activations are then averaged over the spatial dimensions (i.e., the widthand height of the activation map) and then multiplied by a second vector of learnableparameters that computes a weighted average of the different encoding dimensions (i.e.,convolutional filters). The mapping function parameters are optimized to reduce the pre-diction error for the brain responses within each fROI. Because this method allows for per-fROI spatial masking of the feature set, it contains much fewer trainable parameters(compared to most regression methods such as ridge regression) and leads to more accuratepredictions. However, this comes at a relatively high computational cost compared to thelinear regression and was therefore only computed once we determined the best base-modeland layer after the screening procedure.The convolutional mapping has two hyperparameters that control the degree of weightregularization for the spatial and encoding dimensions. We considered 6 points, spacedevenly on a logarithmic scale, within the [0.01–100] range. We chose these hyperpara-meters by performing a grid-search on these two hyperparameters using a separate 10-fold cross-validation procedure. As before, the grid-search was performed on distinctneural data from the homologous region in the opposite hemisphere (on the same set of185 images) and on the model layer determined from 1) above. The final model pre-diction accuracy for the fROI was then determined (using features from the specificmodel layer, and using grid-search regularization weights determined from homologousregions from the opposite hemisphere) using a single 10-fold cross-validation (using adifferent random seed for both weight initialization and data split from before) over the185 images. This entire procedure is outlined schematically in Fig. S13a.Note that we always used distinct neural data to determine all the free parameters(choices on which base-model, layer and grid-search hyperparameters) to reduce anymodel selection bias. Nonetheless it may be argued that neural data across hemispheresand regions are not entirely independent because of perhaps shared scanner noise evenacross hemispheres within each individual fMRI participants’ data (see ref. 74 forinstance). While we cannot entirely rule out the influence of this shared noise on thereported neural predictivity estimates, these effects, if any, are likely small and do notqualitatively affect the majority of results. For quantitative comparison of model pre-diction accuracy to humans, we avoid this problem by cross-validating across bothimages and participants (see section on Behavioral experiments below).
Noise-ceiling estimates. The noise-ceiling indicates the maximum attainable accu-racy of the encoding models given the reliability of the recorded data themselves.To derive these estimates, we randomly split the 20 runs of recorded data into twogroups (and repeated this randomization 10 times). The noise-ceiling for everysubject was estimated by first computing the beta estimates per image separately foreach half of the data, and then measuring the (Spearman-Brown corrected) cor-relation between the estimated betas from the two halves (repeating this entireprocedure 10 times for each binary split). For the pooled data we used the sameprocedure to measure the pooled beta-parameters (by averaging across the per-image beta estimates in each split over subjects) for each randomization split andcalculating the Spearman-Brown corrected split-half correlation between the esti-mated betas across splits. The plots in Figs. 2, 3 indicate the mean and the standard
deviation of the correlations across splits. For the across-subject prediction tests weestimated the noise-ceiling directly by correlating the pooled data from (n-1)subjects with the data for the nth subject (Fig. S4, across-subject generalization test1) and by correlating the observed data for each subject with the observed data forevery other subject (Fig. S4, across-subject generalization test 2).
Neural predictivity. We used the Pearson product moment correlation betweenthe observed responses across images and the cross-validated predictions (pre-dictions on held-out data) of responses to those same images (neural predictivityscore) to assess the match between the model and the brain. Given the question wewere addressing, we used the models to predict the activations of each individualvoxel (voxel-wise predictivity), the mean response within a given fROI for eachsubject (mean-fROI predictivity), or the pooled response in a given fROI acrosssubjects (pooled predictivity).
Population code representational similarity analysis (RSA). We used repre-sentational similarity analyses to compare the degree to which the voxel-wisepattern of population responses observed in the brain within the fROIs matchedthe voxel-wise pattern of population responses predicted by the encoding models.For every (observed or predicted) nvoxels × nstimuli data matrix corresponding toa given fROI, we computed the Euclidean distance between each pair of images(185C2= 17020 pairs) to obtain the observed and predicted 185 × 185 imagesrepresentational dissimilarity matrices75–78 (see ref. 79 for a discussion on whyEuclidean distance is better suited than the oft used correlation distance forresponses in the FFA, PPA, and the EBA). The similarity between the observed andpredicted RDMs was assessed by taking a spearman correlation between observedand predicted RDMs.
Behavioral experiments. To address the degree to which the observed responsescould be predicted based on human intuitions of graded category membership, weconducted a behavioral experiment on an independent group of participantsrecruited from Amazon Mechanical Turk. Three independent groups of partici-pants performed each of the face/body/scene tasks. Participants in the experimentwere directed to an online platform (www.meadows-research.com) where theyperformed a drag-rate arrangement task. Specifically, the subjects were instructedto “Drag and drop the images based on how [face/body/scene]-like they are” byorganizing each of the 185 images onto a graphical region where the top of the y-axis indicated very [face/body/scene]-like images and the very bottom of the y-axisindicated that the images were not [face/body/scene]-like at all. To make sure thatparticipants comprehended the instructions and were indeed performing the taskconsistently, they were asked to repeat the experiment on a smaller subset of 40images. Participants took on average 15 minutes to finish the experiment and weremonetarily compensated for their time. The participant responses were in generalreliable but we included only participants with a mean test-retest correlation 0.85(Total number of subjects recruited per task: 130, Total number of participants’data retained, N= 106 subjects on the face-task, N= 115 on the body task, N= 60for the scene task, mean test-retest correlation 0.95, 0.95, and 0.90 for the face,body, and scene tasks respectively). The match to observed data was assessed bytaking the Pearson correlation between each novice’s ratings and the observedfMRI responses in each fMRI participant’s individual fROIs (then averaged overfMRI participants to get the accuracy of that novice).
To assess the degree to which experts could predict the observed responses tothe 185 images, we reached out to a group of 30 researchers who we judged to havethe greatest expertise worldwide in measuring fMRI responses from the humanventral visual pathway. Ten of them provided responses (all were AssistantProfessors or above). These experts were asked to participate in a similar drag-ratearrangement experiment as described above, but with different instructions.Experts were instructed to “Place the images on the graph based on the expected[FFA/EBA/PPA] activations by organizing each of the 185 images onto a graphicalregion where the top of the y-axis indicated maximum [FFA/EBA/PPA] activationand the very bottom of the y-axis indicated low [FFA/EBA/PPA] activation(Fixation).” Like the novice subjects, the experts also repeated the task for smallsubset of 40 images. The order of the tasks was randomized across experts whotook on average 30 min to finish the experiment. Responses were highly reliablewithin experts (mean test-retest reliability 0.97, 0.96, and 0.96 for the FFA, EBA,and PPA tasks). As with the novices, the match to observed data was assessed bytaking the Pearson correlation of each experts’ own predictions, with the observedresponse in each fROI for every fMRI subject.
In order to fully allay any concern about prediction accuracies being biased infavor of models (see last paragraph on Encoding Models above), we used modelscross-validated across both participants and images (similar to Fig. S4, thirdcolumn from left). To expand, for each subject, we used computational modelstrained using a 10-fold cross-validation on all other subjects. This procedure inoutlined schematically in Fig. S13b. In this way the models did not use any of thatNth fMRI participants’ individual data (nor those specific images on which thepredictions are made) in the model training procedure. For models, the match toobserved data was assessed by taking the Pearson correlation between each (Nth)subject’s individual data for every fROI, and the predicted responses by the modeltrained on N-1 subjects (and then averaged over all fMRI subjects).
NATURE COMMUNICATIONS | https://doi.org/10.1038/s41467-021-25409-6 ARTICLE
NATURE COMMUNICATIONS | (2021) 12:5540 | https://doi.org/10.1038/s41467-021-25409-6 |www.nature.com/naturecommunications 11
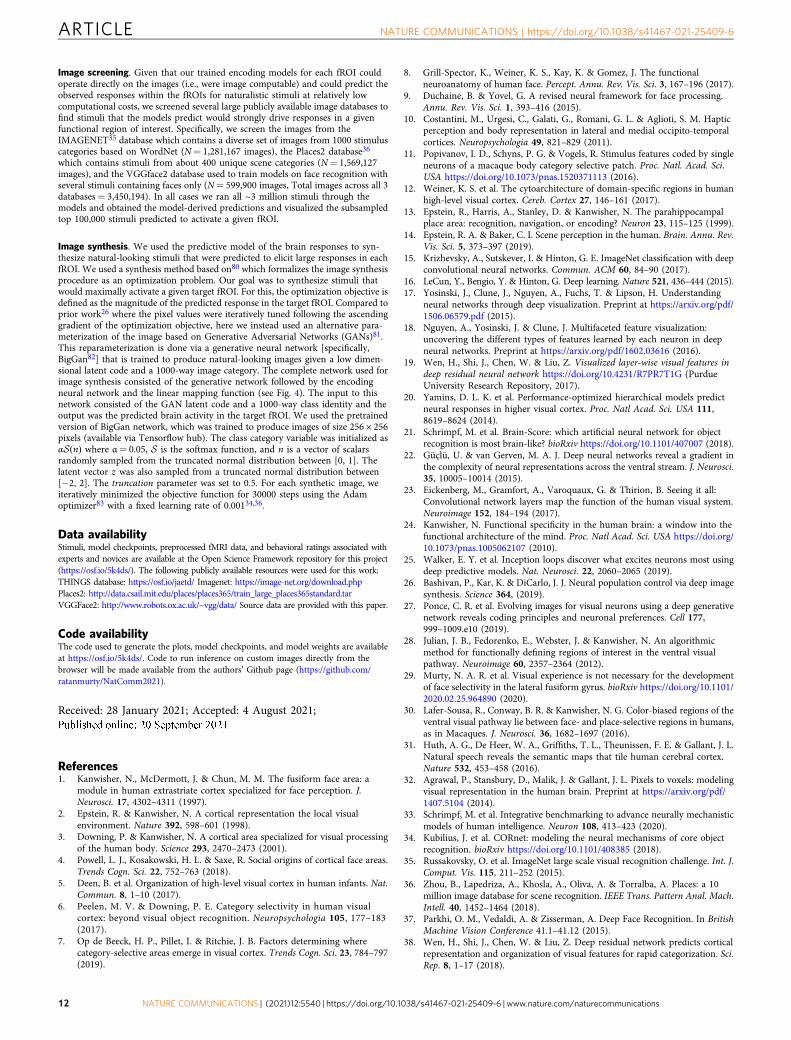
Image screening. Given that our trained encoding models for each fROI couldoperate directly on the images (i.e., were image computable) and could predict theobserved responses within the fROIs for naturalistic stimuli at relatively lowcomputational costs, we screened several large publicly available image databases tofind stimuli that the models predict would strongly drive responses in a givenfunctional region of interest. Specifically, we screen the images from theIMAGENET35 database which contains a diverse set of images from 1000 stimuluscategories based on WordNet (N= 1,281,167 images), the Places2 database36
which contains stimuli from about 400 unique scene categories (N= 1,569,127images), and the VGGface2 database used to train models on face recognition withseveral stimuli containing faces only (N= 599,900 images, Total images across all 3databases= 3,450,194). In all cases we ran all ~3 million stimuli through themodels and obtained the model-derived predictions and visualized the subsampledtop 100,000 stimuli predicted to activate a given fROI.
Image synthesis. We used the predictive model of the brain responses to syn-thesize natural-looking stimuli that were predicted to elicit large responses in eachfROI. We used a synthesis method based on80 which formalizes the image synthesisprocedure as an optimization problem. Our goal was to synthesize stimuli thatwould maximally activate a given target fROI. For this, the optimization objective isdefined as the magnitude of the predicted response in the target fROI. Compared toprior work26 where the pixel values were iteratively tuned following the ascendinggradient of the optimization objective, here we instead used an alternative para-meterization of the image based on Generative Adversarial Networks (GANs)81.This reparameterization is done via a generative neural network [specifically,BigGan82] that is trained to produce natural-looking images given a low dimen-sional latent code and a 1000-way image category. The complete network used forimage synthesis consisted of the generative network followed by the encodingneural network and the linear mapping function (see Fig. 4). The input to thisnetwork consisted of the GAN latent code and a 1000-way class identity and theoutput was the predicted brain activity in the target fROI. We used the pretrainedversion of BigGan network, which was trained to produce images of size 256 × 256pixels (available via Tensorflow hub). The class category variable was initialized asαSðnÞ where α= 0.05, S is the softmax function, and n is a vector of scalarsrandomly sampled from the truncated normal distribution between [0, 1]. Thelatent vector z was also sampled from a truncated normal distribution between[−2, 2]. The truncation parameter was set to 0.5. For each synthetic image, weiteratively minimized the objective function for 30000 steps using the Adamoptimizer83 with a fixed learning rate of 0.00134,36.
Data availabilityStimuli, model checkpoints, preprocessed fMRI data, and behavioral ratings associated withexperts and novices are available at the Open Science Framework repository for this project(https://osf.io/5k4ds/). The following publicly available resources were used for this work:THINGS database: https://osf.io/jaetd/ Imagenet: https://image-net.org/download.phpPlaces2: http://data.csail.mit.edu/places/places365/train_large_places365standard.tarVGGFace2: http://www.robots.ox.ac.uk/~vgg/data/ Source data are provided with this paper.
Code availabilityThe code used to generate the plots, model checkpoints, and model weights are availableat https://osf.io/5k4ds/. Code to run inference on custom images directly from thebrowser will be made available from the authors’ Github page (https://github.com/ratanmurty/NatComm2021).
Received: 28 January 2021; Accepted: 4 August 2021;
References1. Kanwisher, N., McDermott, J. & Chun, M. M. The fusiform face area: a
module in human extrastriate cortex specialized for face perception. J.Neurosci. 17, 4302–4311 (1997).
2. Epstein, R. & Kanwisher, N. A cortical representation the local visualenvironment. Nature 392, 598–601 (1998).
3. Downing, P. & Kanwisher, N. A cortical area specialized for visual processingof the human body. Science 293, 2470–2473 (2001).
4. Powell, L. J., Kosakowski, H. L. & Saxe, R. Social origins of cortical face areas.Trends Cogn. Sci. 22, 752–763 (2018).
5. Deen, B. et al. Organization of high-level visual cortex in human infants. Nat.Commun. 8, 1–10 (2017).
6. Peelen, M. V. & Downing, P. E. Category selectivity in human visualcortex: beyond visual object recognition. Neuropsychologia 105, 177–183(2017).
7. Op de Beeck, H. P., Pillet, I. & Ritchie, J. B. Factors determining wherecategory-selective areas emerge in visual cortex. Trends Cogn. Sci. 23, 784–797(2019).
8. Grill-Spector, K., Weiner, K. S., Kay, K. & Gomez, J. The functionalneuroanatomy of human face. Percept. Annu. Rev. Vis. Sci. 3, 167–196 (2017).
9. Duchaine, B. & Yovel, G. A revised neural framework for face processing.Annu. Rev. Vis. Sci. 1, 393–416 (2015).
10. Costantini, M., Urgesi, C., Galati, G., Romani, G. L. & Aglioti, S. M. Hapticperception and body representation in lateral and medial occipito-temporalcortices. Neuropsychologia 49, 821–829 (2011).
11. Popivanov, I. D., Schyns, P. G. & Vogels, R. Stimulus features coded by singleneurons of a macaque body category selective patch. Proc. Natl. Acad. Sci.USA https://doi.org/10.1073/pnas.1520371113 (2016).
12. Weiner, K. S. et al. The cytoarchitecture of domain-specific regions in humanhigh-level visual cortex. Cereb. Cortex 27, 146–161 (2017).
13. Epstein, R., Harris, A., Stanley, D. & Kanwisher, N. The parahippocampalplace area: recognition, navigation, or encoding? Neuron 23, 115–125 (1999).
14. Epstein, R. A. & Baker, C. I. Scene perception in the human. Brain. Annu. Rev.Vis. Sci. 5, 373–397 (2019).
15. Krizhevsky, A., Sutskever, I. & Hinton, G. E. ImageNet classification with deepconvolutional neural networks. Commun. ACM 60, 84–90 (2017).
16. LeCun, Y., Bengio, Y. & Hinton, G. Deep learning. Nature 521, 436–444 (2015).17. Yosinski, J., Clune, J., Nguyen, A., Fuchs, T. & Lipson, H. Understanding
neural networks through deep visualization. Preprint at https://arxiv.org/pdf/1506.06579.pdf (2015).
18. Nguyen, A., Yosinski, J. & Clune, J. Multifaceted feature visualization:uncovering the different types of features learned by each neuron in deepneural networks. Preprint at https://arxiv.org/pdf/1602.03616 (2016).
19. Wen, H., Shi, J., Chen, W. & Liu, Z. Visualized layer-wise visual features indeep residual neural network https://doi.org/10.4231/R7PR7T1G (PurdueUniversity Research Repository, 2017).
20. Yamins, D. L. K. et al. Performance-optimized hierarchical models predictneural responses in higher visual cortex. Proc. Natl Acad. Sci. USA 111,8619–8624 (2014).
21. Schrimpf, M. et al. Brain-Score: which artificial neural network for objectrecognition is most brain-like? bioRxiv https://doi.org/10.1101/407007 (2018).
22. Güçlü, U. & van Gerven, M. A. J. Deep neural networks reveal a gradient inthe complexity of neural representations across the ventral stream. J. Neurosci.35, 10005–10014 (2015).
23. Eickenberg, M., Gramfort, A., Varoquaux, G. & Thirion, B. Seeing it all:Convolutional network layers map the function of the human visual system.Neuroimage 152, 184–194 (2017).
24. Kanwisher, N. Functional specificity in the human brain: a window into thefunctional architecture of the mind. Proc. Natl Acad. Sci. USA https://doi.org/10.1073/pnas.1005062107 (2010).
25. Walker, E. Y. et al. Inception loops discover what excites neurons most usingdeep predictive models. Nat. Neurosci. 22, 2060–2065 (2019).
26. Bashivan, P., Kar, K. & DiCarlo, J. J. Neural population control via deep imagesynthesis. Science 364, (2019).
27. Ponce, C. R. et al. Evolving images for visual neurons using a deep generativenetwork reveals coding principles and neuronal preferences. Cell 177,999–1009.e10 (2019).
28. Julian, J. B., Fedorenko, E., Webster, J. & Kanwisher, N. An algorithmicmethod for functionally defining regions of interest in the ventral visualpathway. Neuroimage 60, 2357–2364 (2012).
29. Murty, N. A. R. et al. Visual experience is not necessary for the developmentof face selectivity in the lateral fusiform gyrus. bioRxiv https://doi.org/10.1101/2020.02.25.964890 (2020).
30. Lafer-Sousa, R., Conway, B. R. & Kanwisher, N. G. Color-biased regions of theventral visual pathway lie between face- and place-selective regions in humans,as in Macaques. J. Neurosci. 36, 1682–1697 (2016).
31. Huth, A. G., De Heer, W. A., Griffiths, T. L., Theunissen, F. E. & Gallant, J. L.Natural speech reveals the semantic maps that tile human cerebral cortex.Nature 532, 453–458 (2016).
32. Agrawal, P., Stansbury, D., Malik, J. & Gallant, J. L. Pixels to voxels: modelingvisual representation in the human brain. Preprint at https://arxiv.org/pdf/1407.5104 (2014).
33. Schrimpf, M. et al. Integrative benchmarking to advance neurally mechanisticmodels of human intelligence. Neuron 108, 413–423 (2020).
34. Kubilius, J. et al. CORnet: modeling the neural mechanisms of core objectrecognition. bioRxiv https://doi.org/10.1101/408385 (2018).
35. Russakovsky, O. et al. ImageNet large scale visual recognition challenge. Int. J.Comput. Vis. 115, 211–252 (2015).
36. Zhou, B., Lapedriza, A., Khosla, A., Oliva, A. & Torralba, A. Places: a 10million image database for scene recognition. IEEE Trans. Pattern Anal. Mach.Intell. 40, 1452–1464 (2018).
37. Parkhi, O. M., Vedaldi, A. & Zisserman, A. Deep Face Recognition. In BritishMachine Vision Conference 41.1–41.12 (2015).
38. Wen, H., Shi, J., Chen, W. & Liu, Z. Deep residual network predicts corticalrepresentation and organization of visual features for rapid categorization. Sci.Rep. 8, 1–17 (2018).
ARTICLE NATURE COMMUNICATIONS | https://doi.org/10.1038/s41467-021-25409-6
12 NATURE COMMUNICATIONS | (2021) 12:5540 | https://doi.org/10.1038/s41467-021-25409-6 | www.nature.com/naturecommunications
39. Naselaris, T., Kay, K. N., Nishimoto, S. & Gallant, J. L. Encoding and decodingin fMRI. NeuroImage 56, 400–410 (2011).
40. Seeliger, K. et al. End-to-end neural system identification with neuralinformation flow. PLoS Comput. Biol. 17, e1008558 (2021).
41. Rips, L. J. in Similarity and Analogical Reasoning 21–59 (CambridgeUniversity Press, 2009).
42. Medin, D. L. Concepts and conceptual structure. Am. Psychol. 44, 1469–1481(1989).
43. Petsiuk, V., Das, A. & Saenko, K. RISE: Randomized input sampling forexplanation of black-box models. Br. Mach. Vis. Conf. Preprint at https://arxiv.org/pdf/1806.07421.pdf%20/ (2018).
44. Hong, H., Yamins, D. L. K., Majaj, N. J. & DiCarlo, J. J. Explicit informationfor category-orthogonal object properties increases along the ventral stream.Nat. Neurosci. https://doi.org/10.1038/nn.4247 (2016).
45. Güçlü, U. & van Gerven, M. A. J. Increasingly complex representations ofnatural movies across the dorsal stream are shared between subjects.Neuroimage 145, 329–336 (2017).
46. Khaligh-Razavi, S.-M. & Kriegeskorte, N. Deep supervised, but notunsupervised, models may explain IT cortical representation. PLoS Comput.Biol. 10, 1003915 (2014).
47. Cichy, R. M., Khosla, A., Pantazis, D., Torralba, A. & Oliva, A. Comparison ofdeep neural networks to spatio-temporal cortical dynamics of human visualobject recognition reveals hierarchical correspondence OPEN. Nat. Publ. Gr.https://doi.org/10.1038/srep27755 (2016).
48. Tarhan, L. & Konkle, T. Sociality and interaction envelope organize visualaction representations. Nat. Commun. 11, 1–11 (2020).
49. Lee, H. et al. Topographic deep artificial neural networks reproduce thehallmarks of the primate inferior temporal cortex face processing network.bioRxiv https://doi.org/10.1101/2020.07.09.185116 (2020).
50. Zhuang, C. et al. Unsupervised neural network models of the ventral visualstream. bioRxiv https://doi.org/10.1101/2020.06.16.155556 (2020).
51. Konkle, T. & Alvarez, G. A. Instance-level contrastive learning yields humanbrain-like representation without category-supervision. bioRxiv https://doi.org/10.1101/2020.06.15.153247 (2020).
52. Deza, A. & Konkle, T. Emergent properties of foveated perceptual systems.Preprint at https://arxiv.org/pdf/2006.07991 (2020).
53. Szegedy, C. et al. Intriguing properties of neural networks. Preprint at https://arxiv.org/pdf/1312.6199.pdf?source=post_page (2014).
54. Goodfellow, I. J., Shlens, J. & Szegedy, C. Explaining and harnessingadversarial examples. Preprint at https://arxiv.org/pdf/1412.6572.pdf(2014).
55. Downing, P., Liu, J. & Kanwisher, N. Testing cognitive models of visualattention with fMRI and MEG. Neuropsychologia 39, 1329–1342 (2001).
56. Kanwisher, N. & Wojciulik, E. Visual attention: insights from brain imaging.Nat. Rev. Neurosci. 1, 91–100 (2000).
57. Geirhos, R., Meding, K. & Wichmann, F. A. Beyond accuracy: quantifyingtrial-by-trial behaviour of CNNs and humans by measuring error consistency.Preprint at https://arxiv.org/pdf/2006.16736 (2020).
58. Geirhos, R. et al. Imagenet-trained CNNs are biased towards texture;increasing shape bias improves accuracy and robustness. Preprint at https://arxiv.org/pdf/1811.12231 (2018).
59. O’Connell, T. P., Sederberg, P. B. & Walther, D. B. Representationaldifferences between line drawings and photographs of natural scenes: adissociation between multi-voxel pattern analysis and repetition suppression.Neuropsychologia 117, 513–519 (2018).
60. Geirhos, R. et al. Generalisation in humans and deep neural networks.Preprint at https://arxiv.org/pdf/1808.08750 (2018).
61. Dolan, R. J. et al. How the brain learns to see objects and faces in animpoverished context. Nature 389, 596–599 (1997).
62. Cox, D., Meyers, E. & Sinha, P. Contextually evoked object-specific responsesin human visual cortex. Science 304, 115–117 (2004).
63. Haxby, J. V. et al. Distributed and overlapping representations of faces andobjects in ventral temporal cortex. Science 293, 2425–2430 (2001).
64. Schalk, G. et al. Facephenes and rainbows: causal evidence for functional andanatomical specificity of face and color processing in the human brain. Proc.Natl Acad. Sci. USA 114, 12285–12290 (2017).
65. Nguyen, A., Dosovitskiy, A., Yosinski, J., Brox, T. & Clune, J. Synthesizing thepreferred inputs for neurons in neural networks via deep generator networks.in Advances in Neural Information Processing Systems 3395–3403(neurips.cc, 2016).
66. Frankle, J. & Carbin, M. The lottery ticket hypothesis: finding sparse,trainable neural networks. Preprint at https://arxiv.org/pdf/1803.03635(2018).
67. Yamins, D. L. K. & DiCarlo, J. J. Using goal-driven deep learning models tounderstand sensory cortex. Nat. Neurosci. 19, 356–365 (2016).
68. Hebart, M. N. et al. THINGS: A database of 1,854 object concepts andmore than 26,000 naturalistic object images. PLoS ONE 14, e0223792(2019).
69. Kay, K. N., Rokem, A., Winawer, J., Dougherty, R. F. & Wandell, B. A.GLMdenoise: a fast, automated technique for denoising task-based fMRI data.Front. Neurosci. 7, 247 (2013).
70. Charest, I., Kriegeskorte, N. & Kay, K. N. GLMdenoise improves multivariatepattern analysis of fMRI data. Neuroimage 183, 606–616 (2018).
71. Kar, K., Kubilius, J., Schmidt, K., Issa, E. B. & DiCarlo, J. J. Evidence thatrecurrent circuits are critical to the ventral stream’s execution of core objectrecognition behavior. Nat. Neurosci. 22, 974–983 (2019).
72. Çukur, T., Huth, A. G., Nishimoto, S. & Gallant, J. L. Functional subdomainswithin scene-selective cortex: Parahippocampal place area, retrosplenialcomplex, and occipital place area. J. Neurosci. 36, 10257–10273 (2016).
73. Klindt, D. A., Ecker, A. S., Euler, T. & Bethge, M. Neural system identificationfor large populations separating ‘what’ and ‘where’. in Advances in NeuralInformation Processing Systems, 3507–3517 (neurips.cc, 2017).
74. Davies-Thompson, J. & Andrews, T. J. Intra- and interhemisphericconnectivity between face-selective regions in the human brain. J.Neurophysiol. 108, 3087–3095 (2012).
75. Kriegeskorte, N., Mur, M. & Bandettini, P. Representational similarity analysis—connecting the branches of systems neuroscience. Front. Syst. Neurosci. 2, 4 (2008).
76. Mur, M. & Bandettini, P. A. & Kriegeskorte, N. Revealing representationalcontent with pattern-information fMRI-an introductory guide. Soc. Cogn.Affect. Neurosci. 4, 101–109 (2009).
77. Diedrichsen, J. & Kriegeskorte, N. Representational models: a commonframework for understanding encoding, pattern-component, andrepresentational-similarity analysis. PLoS Comput. Biol. 13, e1005508 (2017).
78. Martin Cichy, R., Roig, G. & Oliva, A. The Algonauts Project. Nat. Mach.Intell. 1, 613 (2019).
79. Walther, A. et al. Reliability of dissimilarity measures for multi-voxel patternanalysis. Neuroimage 137, 188–200 (2016).
80. Erhan, D., Bengio, Y., Courville, A. & Vincent, P. Visualizing higher-layerfeatures of a deep network. Univ. Montr. 1341, 1 (2009).
81. Goodfellow, I. J. et al. Generative adversarial nets. Adv. Neural Inf. Process.Syst. 3, 2672–2680 (2014).
82. Brock, A., Donahue, J. & Simonyan, K. Large scale GaN training for highfidelity natural image synthesis. Preprint at https://arxiv.org/pdf/1809.11096.pdf%20 http://arxiv.org/abs/1809.11096 (2018).
83. Kingma, D. P. & Ba, J. L. Adam: A method for stochastic optimization.Preprint at https://arxiv.org/pdf/1412.6980?source=post_page (2014).
AcknowledgementsWe would like to thank Martin Hebart for early access to the THINGS Database andmembers of the Kanwisher and DiCarlo labs for feedback on the project and drafts of themanuscript. This work was supported by the NIH Shared Instrumentation GrantS10OD021569 to the Athinoula Martinos Center at MIT, the NSERC Discovery GrantRGPIN-2021-03035 and the HBHL startup supplement grant HBHL-2b-NISU-13 (toP.B.), the MIT UROP Direct funding and the MIT Quest for Intelligence undergraduatefunding (to A.A.), the Office of Naval Research grant MURI-114407 and the SimonsFoundation Grant SCGB-542965 (to J.J.D.), and the NIH Pioneer Award NIHDP1HD091957 and the NSF Science and Technology Center—Center for Brains, Minds,and Machines Grant NSF CCF-1231216 (to N.K.).
Author contributionsN.A.R.M., P.B., J.J.D., and N.K. conceived and designed the study. N.A.R.M. and P.B. collectedhuman fMRI data, N.A.R.M. and A.A. collected and analyzed the human behavioral data.N.A.R.M., P.B., and A.A. analyzed the data and built the computational models. J.J.D. andN.K. supervised the project, N.A.R.M., P.B., A.A., J.J.D., and N.K. wrote the manuscript.
Competing interestsThe authors declare no competing interests.
Additional informationSupplementary information The online version contains supplementary materialavailable at https://doi.org/10.1038/s41467-021-25409-6.
Correspondence and requests for materials should be addressed to N. ApurvaRatan Murty.
Peer review information Nature Communications thanks Steven Scholte and the other,anonymous, reviewer(s) for their contribution to the peer review of this work. Peerreviewer reports are available.
Reprints and permission information is available at http://www.nature.com/reprints
Publisher’s note Springer Nature remains neutral with regard to jurisdictional claims inpublished maps and institutional affiliations.
NATURE COMMUNICATIONS | https://doi.org/10.1038/s41467-021-25409-6 ARTICLE
NATURE COMMUNICATIONS | (2021) 12:5540 | https://doi.org/10.1038/s41467-021-25409-6 |www.nature.com/naturecommunications 13
Open Access This article is licensed under a Creative CommonsAttribution 4.0 International License, which permits use, sharing,
adaptation, distribution and reproduction in any medium or format, as long as you giveappropriate credit to the original author(s) and the source, provide a link to the CreativeCommons license, and indicate if changes were made. The images or other third partymaterial in this article are included in the article’s Creative Commons license, unlessindicated otherwise in a credit line to the material. If material is not included in thearticle’s Creative Commons license and your intended use is not permitted by statutoryregulation or exceeds the permitted use, you will need to obtain permission directly fromthe copyright holder. To view a copy of this license, visit http://creativecommons.org/licenses/by/4.0/.
© The Author(s) 2021
ARTICLE NATURE COMMUNICATIONS | https://doi.org/10.1038/s41467-021-25409-6
14 NATURE COMMUNICATIONS | (2021) 12:5540 | https://doi.org/10.1038/s41467-021-25409-6 | www.nature.com/naturecommunications