Embed Size (px)
Citation preview

Computer
1B
Advanced Biology with Vernier 1B - 1
Osmosis
In order to survive, all organisms need to move molecules in and out of their cells. Molecules such as gases (e.g., O2, CO2), water, food, and wastes pass across the cell membrane. There are two ways that the molecules move through the membrane: passive transport and active transport. While active transport requires that the cell uses chemical energy to move substances through the cell membrane, passive transport does not require such energy expenditures. Passive transport occurs spontaneously, using heat energy from the cell's environment.
Diffusion is the movement of molecules by passive transport from a region in which they are highly concentrated to a region in which they are less concentrated. Diffusion continues until the molecules are randomly distributed throughout the system. Osmosis, the movement of water across a membrane, is a special case of diffusion. Water molecules are small and can easily pass through the membrane. Other molecules, such as proteins, DNA, RNA, and sugars are too large to diffuse through the cell membrane. The membrane is said to be semipermeable, since it allows some molecules to diffuse through but not others.
If the concentration of water on one side of the membrane is different than on the other side, water will move through the membrane seeking to equalize the concentration of water on both sides. When water concentration outside a cell is greater than inside, the water moves into the cell faster than it leaves, and the cell swells. The cell membrane acts somewhat like a balloon. If too much water enters the cell, the cell can burst, killing the cell. Cells usually have some mechanism for preventing too much water from entering, such as pumping excess water out of the cell or making a tough outer coat that will not rupture. When the concentration of water inside of a cell is greater than outside, water moves out of the cell faster than it enters, and the cell shrinks. If a cell becomes too dehydrated, it may not be able to survive. Under ideal conditions, the water concentration outside is nearly identical to that inside.
In this experiment, you will use a Gas Pressure Sensor to measure the rate of pressure change as water moves in to or out of the cell (dialysis tubes filled with various concentrations of sucrose solution). The pressure generated is called osmotic pressure and is in response to the overall movement of molecules, both water and sucrose, inside the dialysis cell.
OBJECTIVES In this experiment, you will
• Use a Gas Pressure Sensor to investigate the relationship between water movement and solute concentration.
• Determine the water potential of potato cells.
Figure 1
Evalua
tion co
py

Experiment 1B
1B - 2 Advanced Biology with Vernier
Figure 2
Figure 3
MATERIALS computer test tube rack Vernier computer interface prepared sucrose solutions Logger Pro four 16 × 100 mm test tubes with stoppers Vernier Gas Pressure Sensor dialysis tubing, 2.5 cm × 15 cm 25 mL graduated cylinder dialysis tubing clamp 15 cm piece of plastic tubing plastic tubing clamp ring stand plastic tubing with Luer connector utility clamp 600 mL beaker 20 mL syringe Parafilm or Seran wrap
PROCEDURE 1. Place four test tubes in a rack and label them 1.0 M, 0.9 M, 0.8 M,
and 0.7 M.
2. Fill each test tube with 15 mL of the correct solution.
3. Connect the plastic tubing with the Luer connector to the valve of the Gas Pressure Sensor.
4. Connect the Gas Pressure Sensor to the computer interface. Prepare the computer for data collection by opening the file “01B Osmosis” from the Advanced Biology with Vernier folder of Logger Pro.
5. Using a ring stand and clamp, mount the Gas Pressure Sensor above the beaker, as shown in Figure 1.
6. Obtain a piece of wet dialysis tubing and a dialysis tubing clamp. Fold 2 cm of the dialysis tubing back on itself and clamp as shown in Figure 2.
7. Prepare the dialysis tubing.
a. Connect the 15 cm segment of plastic tubing to the syringe and draw up 15 mL of the contents of the 1.0 M solution.
b. Open the remaining end of the dialysis tubing by rubbing the tubing between your fingers.
c. Insert the end of the syringe tubing into the dialysis tube and slowly inject the solution into the dialysis tubing as shown in Figure 3.
d. Slide the plastic tubing clamp onto the upper portion of the plastic tube from the Gas Pressure Sensor.
e. Place the plastic tubing from the Gas Pressure Sensor into the solution in the dialysis tubing and wrap the excess around the plastic tubing being sure that minimal no air space remains.
f. Wrap a 1 cm × 3 cm piece of Parafilm or Seran wrap tightly over the portion of the dialysis tubing that is wrapped around the Gas Pressure Sensor tube in order to protect the dialysis tubing from the clamp.
g. Slide the plastic tubing clamp down over the Parafilm or Seran wrap and clamp tightly as shown in Figure 4. There should be minimal airspace above the liquid.
h. Rinse the outside of the dialysis tubing with distilled water.
Figure 4

Osmosis
Advanced Biology with Vernier 1B - 3
8. Fill the beaker with 400 mL of distilled water and place the clamped dialysis tube in the beaker. Check that the tubing bulb is completely submerged and that there are no kinks in the tubing. Allow it to sit in the solution for five minute before starting data collection.
9. Click to begin data collection.
10. When data collection has finished, carefully release the tubing by unfastening the clamp. Important: Do not disconnect the tubing from the sensor prior to releasing the tubing clamp. There is enough pressure within the dialysis tubing to create a mess.
11. Rinse out the dialysis tubing and Styrofoam cup.
12. Determine the rate of change in osmotic pressure.
a. Highlight the data from the beginning of the region of increasing values to the end of the data.
b. Click the Linear Fit button, , to perform a linear regression. c. Record the slope of the line, m, as the rate of change in osmotic pressure for a 1.0 M
solution. d. Close the linear regression box.
13. Store the data by choosing Store Latest Run from the Experiment menu.
14. Repeat Steps 6–13 for the remaining solutions.
DATA
Table 1
Sucrose solution concentration
(M)
Rate of pressure change
(kPa/min)
1.0
0.9
0.8
0.7

Experiment 1B
1B - 4 Advanced Biology with Vernier
PROCESSING THE DATA 1. On Page 2 of the Logger Pro experiment file, create a graph of the class average rates of
pressure change on the y-axis and sucrose solution concentration on the x-axis.
QUESTIONS 1. Which solutions, if any, produced a positive slope? Was water moving in or out of the cell
(dialysis tubing) under these circumstances? Explain.
2. Which solutions, if any, produced a negative slope? Was water moving in or out of the cell under these circumstances? Explain.
3. Does sucrose move in or out of the cell? Explain.
4. Examine the graph of the rate of pressure change vs. the sucrose concentration. Describe any pattern in the data.
5. Use the graph to estimate the concentration of sucrose that would yield no change in pressure. Why is this biologically significant?
6. When wilted plants are watered, they tend to become rigid. Explain how this might happen.
7. Explain the strengths and weakness of this dialysis model with respect to an animal and plant cell.
8. Discuss and explain potential reasons to account for variation in class average pressure change at specific sucrose concentrations.
9. Predict the effect of increased and decreased initial temperature on rates of pressure change for each of these different solution concentrations.
10. Predict the rates of pressure change if the dialysis tubing is placed in an insulated cup holding 1000 mL of 37°C water. Explain your reasoning.
11. Predict the rate of pressure change if the dialysis tubing were filled with 10 mL of 0.8 M sucrose solution and 5 mL of 1.0 M sodium chloride solution. Explain your reasoning.

Osmosis
Advanced Biology with Vernier 1B - 5
EXTENSION – WATER POTENTIAL Water potential is a term used when predicting the movement of water into or out of plant cells. Water always moves from an area of higher water potential to an area of lower water potential. The symbol for water potential is the Greek letter Psi, Ψ. Water potential consists of a physical pressure component called pressure potential Ψp, and the effects of solutes called solute potential, Ψs.
Ψ = Ψp + ΨS
Water potential
= Pressure potential
+ Solute potential
Distilled water in an open beaker has a water potential of zero. The addition of solute decreases water potential while the addition of pressure increases water potential. A water potential value can be positive, negative, or zero. Water potential is usually measured in bars, a metric measure of pressure. (1 kPa = .1 bar)
In this experiment, you will measure the percent change in mass of potato cores after they have soaked in various concentrations of sugar solutions for a 24 hour period. You will use this data to calculate the water potential of the potato cells.
MATERIALS
computer Logger Pro
250 mL beaker plastic wrap
four potato cores balance 0 M, 0.33 M, 0.67 M, or
1.0 M sugar solution paper towels
PROCEDURE You will be assigned one or more of the sugar solutions in which to soak your potato cores.
1. Pour 100 mL of the assigned sugar solution into a 250 mL beaker.
2. Measure and record the mass of the four potato cores together.
3. Put the four cores into the beaker of sugar solution.
4. Cover the beaker with plastic wrap and allow it to stand for a 24 hour period.
5. Remove the cores from the beaker, blot with a paper towel, and determine the mass of the four cores together after soaking.
6. Calculate the percent change in mass and record your data for the sugar concentration tested in Table 2 as well as on the class data sheet.
7. Repeat Steps 1–6 for any additional assigned sugar solutions.

Experiment 1B
1B - 6 Advanced Biology with Vernier
DATA
Table 2
Sugar solution concentration
Initial mass (g)
Final mass (g)
Percent change in mass
0.00 M
0.33 M
0.67 M
1.0 M
Table 3 Class data of percent change in mass
Sugar solution concentration
Group 1
Group 2
Group 3
Group 4
Group 5
Group 6
Group 7
Group 8
Total Class average
0.00 M
0.33 M
0.67 M
1.00 M
Table 4
Sugar molar concentration
Solute potential
Water potential
PROCESSING THE DATA 1. On Page 3 of the Logger Pro experiment file, create a graph with the percent change in mass
on the y-axis and concentration of sugar on the x-axis.
2. Perform a linear regression to determine the molar concentration of sugar solution at which the mass of the potato cores does not change.
a. Click the Linear Fit button, , to perform a linear regression. A floating box will appear with the formula for a best fit line.
b. Choose Interpolate from the Analyze menu. Move the cursor along the regression line to the point where the line crosses the x axis. This point represents the molar concentration of sugar with a water potential equal to the potato core water potential. Record this concentration in Table 4.
Osmosis
Advanced Biology with Vernier 1B - 7
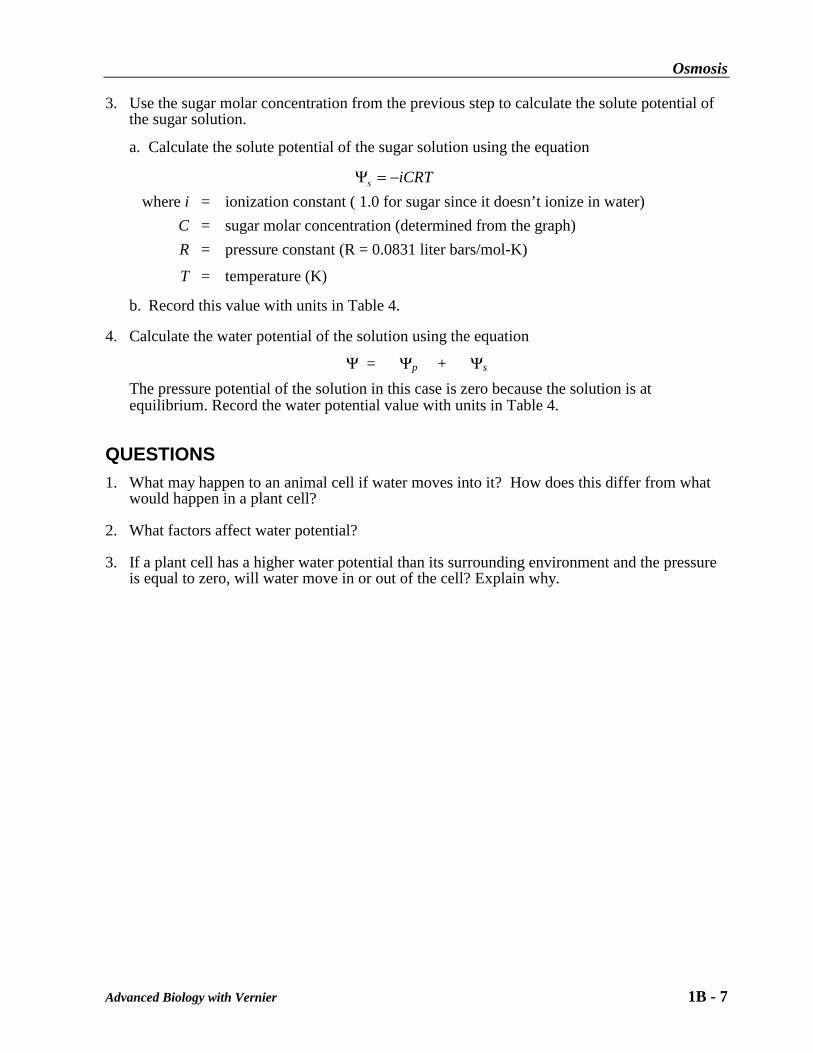
3. Use the sugar molar concentration from the previous step to calculate the solute potential of the sugar solution.
a. Calculate the solute potential of the sugar solution using the equation
where i = ionization constant ( 1.0 for sugar since it doesn’t ionize in water)
C = sugar molar concentration (determined from the graph)
R = pressure constant (R = 0.0831 liter bars/mol-K)
T = temperature (K)
b. Record this value with units in Table 4. 4. Calculate the water potential of the solution using the equation
Ψ = Ψp + Ψs
The pressure potential of the solution in this case is zero because the solution is at equilibrium. Record the water potential value with units in Table 4.
QUESTIONS 1. What may happen to an animal cell if water moves into it? How does this differ from what
would happen in a plant cell?
2. What factors affect water potential?
3. If a plant cell has a higher water potential than its surrounding environment and the pressure is equal to zero, will water move in or out of the cell? Explain why.
iCRTs −=Ψ

Vernier Lab Safety Instructions Disclaimer
THIS IS AN EVALUATION COPY OF THE VERNIER STUDENT LAB. This copy does not include:
Safety information Essential instructor background information Directions for preparing solutions Important tips for successfully doing these labs
The complete Advanced Biology with Vernier lab manual includes 27 labs and essential teacher information. The full lab book is available for purchase at: http://www.vernier.com/cmat/bioa.html
Vernier Software & Technology
13979 S.W. Millikan Way • Beaverton, OR 97005-2886 Toll Free (888) 837-6437 • (503) 277-2299 • FAX (503) 277-2440
[email protected] • www.vernier.com


![Unit 1B - HPT · design entwerfen, konstruieren; Entwurf, Muster 1B device Vorrichtung 1B dimension [ˌdaɪˈmen(t)ʃən] Abmessung 1B district Bezirk 1B drawing Zeichnung 1B drill](https://img.pdfslide.net/doc/110x75/6004851a49508c087b3c11bf/unit-1b-hpt-design-entwerfen-konstruieren-entwurf-muster-1b-device-vorrichtung.jpg)


