Embed Size (px)
Citation preview

Computer aided detection of microcalci®cations in digitalmammograms
Giuseppe Boccignonea,*, Angelo Chianeseb, Antonio Picariellob
aDIIIE and INFM, UniversitaÁ di Salerno, via Ponte Melillo 1, Fisciano, 84084, ItalybDIS, UniversitaÁ di Napoli, via Claudio 21, Napoli, 80100, Italy
Received 4 November 1999; accepted 13 April 2000
Abstract
Microcalci®cation detection is widely used for early diagnosis of breast cancer. Nevertheless,mammogram visual analysis is a complex task for expert radiologists. In this paper, we present a newmethod for computer aided detection of microcalci®cations in digital mammograms. The detection isperformed on the wavelet transformed image. The calci®cations are separated from the background byexploiting the evaluation of Renyi's information at the di�erent decomposition levels of the wavelettransform. Experiments are performed on a standard and publicly available dataset and the results areevaluated with respect to recent achievements reported in the literature. 7 2000 Elsevier Science Ltd.All rights reserved.
Keywords: Computer aided diagnosis; Image processing; Mammogram analysis; Microcalci®cation detection;Wavelet transform; Renyi's entropy
1. Introduction
Breast cancer is by far the most common cancer among women and X-ray mammography isa very important tool for its early detection. Radiologists go through visual analysis ofmammograms looking for certain abnormalities as signs of breast cancer. These signs are thepresence of clusters of calci®cations, spiculated lesions and circumscribed masses.Unfortunately, mammograms are among the most di�cult of radiological images to
Computers in Biology and Medicine 30 (2000) 267±286
0010-4825/00/$ - see front matter 7 2000 Elsevier Science Ltd. All rights reserved.PII: S0010-4825(00)00014-7
www.elsevier.com/locate/compbiomed
* Corresponding author. Tel.: +39-089-964275; fax: +39-089-964218.E-mail address: [email protected] (G. Boccignone).

interpret; in particular, microcalci®cation visual assessment turns out to be an actualchallenging task. A microcalci®cation is a tiny calcium deposit that has accumulated in thebreast tissue, and it appears in the mammogram as a small bright spot embedded within aninhomogeneous background. The calci®cations vary in size from smaller than 0.1 mm to 5 mmin diameter, and a radiologist must carefully examine the mammogram with a magni®er tolocate calci®cations which may be embedded in dense tissue. Size, shape and radiographicdensity are the most important factors on analysing individual calci®cations, whereas theirnumber and distribution are taken into account when clusters are considered, a cluster beingde®ned as a group of at least three to ®ve microcalci®cations within 1 cm2 region.Indeed, computer-aided analysis of microcalci®cations in digital mammograms is widely
reputed as a remarkable goal, and several methods have been proposed in the literature fortheir detection and segmentation. The e�ectiveness of such techniques can be assessed takinginto account True Positive (TP) and False Positive (FP) detections [1]. FP is the probability ofincorrectly classifying a non target object as a target object Ð the microcalci®cation Ð whileTP detection rate is the probability of correctly classifying a target object.One of the early methods achieving signi®cant clinical results is that of Davies and Dance
[2], with experiments performed over 50 test images, half of which contained no clusters. Theauthors report a 96% TP with an average of 0.18 FP clusters per image. However, the authorsdetect suspicious areas by using a local threshold and, to such end, the selected regions arelimited by size criteria; further, those with an irregular shape are discarded.The method due to Dengler et al. [3] exploits a two-stage algorithm for spot detection and
shape extraction, based on Gaussian ®lter detection followed by morphological reconstruction.They report 70% of TP and 0.3 FP. Such a result is tested using a number of mammogramsevaluated through the judgments of expert radiologists, although the mammographies are notpublicly available and the outcome cannot be compared with other methods.Shen et al. [4] propose a multi-tolerance region growing method. The resulting regions are
then given in input to a neural network for classi®cation. The results are the following: inmammograms containing benignant tumors, they achieve 81% of TP and zero FP, while 85%TP and 29 FP of malignant cases are reported. It has to be noted that the experiments, albeitbiopsy proved, have been performed on a very low number of images, four real mammograms,that are not publicly available.Other methods aim at incorporating a priori knowledge within the analysis phase. A
fundamental contribution is that of Karssemeijer [5]. The method exploits structural geometricknowledge and it relies upon bayesian statistic techniques and upon the application of random®eld models. The pixels are assigned to a certain class, maximising the probability of belongingto one of the four considered classes: background, micro-calci®cations, lines/edges and errorsdue to ®lm erosion. The experimental work is extensive and based on a Web availabledatabase. As reported by the author himself, the method is very complex and computationallyexpensive.Multi-scale detection has also been used for clustered microcalci®cations. Motivations for
adopting an image multi-scale representation ground in the wealth of physiological andpsychophysical data demonstrating that the visual system analyzes images at di�erentresolutions: visual information is processed in parallel by a number of spatial-frequency-tunedchannels and in the visual pathway, ®lters of di�erent size operate at the same location [6].
G. Boccignone et al. / Computers in Biology and Medicine 30 (2000) 267±286268

Brzakovic et al. [7] propose a detection method based on the Laplacian fuzzy pyramid, withexperiments performed over both synthetic and real images. On synthetic images, the resultsvary from 60% to 80%, with an average of 2 FP per image due to the complexity of thebackground. The experiments on real images have been performed on the database distributedfrom the University of South Florida formed by 67 images (17 containing abnormalities and 50without abnormalities). However, ROC analysis is not reported.Recently, multi-scale methods based on the wavelet transform (WT) have been introduced
[8±11].In particular, Strickland's approach [10] is appealing as regards both the results achieved and
the methodology. Microcalci®cation detection is directly accomplished within the transformdomain, relying on a thresholding of the wavelet coe�cients to produce a detect/no detectresult. However, the threshold is experimentally chosen as a ®xed percentile of the histogramof each channel, thus limiting the approach in the capability of dealing with varying conditionsdue to the image formation and digitization process, noise level, etc.In this paper, we propose a multi-scale detection of microcalci®cations based on a wavelet
representation of the digital mammogram. As in [10], the detection is directly accomplishedwithin the transform domain, but, in contrast, our approach automatically determines thethreshold function relying on an information theoretic tool, namely Renyi's entropy.Successively, the estimates of objects locations that we collect at the di�erent scales of thewavelet transform are combined to obtain the ®nal detection.In this way, images with varying characteristics can be successfully segmented using one
procedure and without the need of a priori ®xed thresholds.In the following we will describe the theoretical foundation of the proposed method and its
algorithmic realization. Experiments performed are presented and discussed.
2. Theory
In this section, we discuss and motivate the algorithm proposed to automatically detect themicrocalci®cations. The core of the algorithm relies on a representation of the image derivedfrom the WT.
2.1. Wavelet transform computation
Since the method we present exploits the properties given by the WT representation of animage, we review some of the basic properties, with special reference to the two-dimensionaltheory. An in-depth presentation is given in [12]. The WT has been introduced to get somespatial information in the Fourier space. As long as we are satis®ed with linear space invariantoperators the Fourier transform is suitable for a wide range of applications such as imagetransmission or stationary image processing. However if transient phenomena Ð for instance,an object located in the right corner of an image Ð are to be investigated, the Fouriertransform becomes a cumbersome tool. The uncertainty principle states that the energy spreadof a function and its Fourier transform cannot be simultaneously arbitrarily small. If a speci®c
G. Boccignone et al. / Computers in Biology and Medicine 30 (2000) 267±286 269

frequency is detected in a Fourier spectrum, it is di�cult to determine its spatial origin in thesignal.Following the pioneering work of Wigner in the context of quantum mechanics [13] and
Gabor [14], Morlet and Grossmann formalized the continuous WT [15]. The basic idea is touse a family of functions localized both in space and in the frequency domain. These functionsare related to each other by translations and by changes of scale. The frequency variable usedwith the Fourier transform is then replaced by the scale parameter.Formally, be an image a ®nite energy function I 2 L2�R2�, de®ned on a support O � R2, R
being the set of reals. The representation of the image according to a family of waveletfunctions is obtained as follows. First, a function c 2 L2�R2�, the `mother wavelet', is chosen,which satis®es the admissibility condition��1
ÿ1
��1ÿ1
j c�ox, oy� j2oxoy
dox doy <1,
where c�ox, oy� is the Fourier transform of c, and ox, oy are the spatial frequencycomponents along the x, y axes. Such condition is a regularity constraint so that c have zeromean value and local oscillation quickly decaying to zero. Secondly, a family of functions isderived from scaling and translation of the mother wavelet:
cux, uy, s�x, y� �1
j s j pc�xÿ ux
s,yÿ uy
s
�,
where s is the scaling term and ux, uy are the translational parameters. For the parameter pr0,di�erent choices are proposed in the literature ( p = 1, p = 1/2), but its actual value iscompletely irrelevant for the basic theory; thus, in the following we will assume p=1.The continuous WT of I at a scale s and at position (x, y ) is computed by decomposing I on
such a family:
WsI�ux, uy� � hI, cux, uy, si �1
s
� �OI�x, y� �c
�xÿ ux
s,yÿ uy
s
�dx dy, �1�
�c being the conjugate complex of c, and h i denoting the inner product. The squareintegrability of c and the admissibility condition ensure that the transformation is reversible.Intuitively, this transformation can be seen as a mathematical microscope whose position
and magni®cation are (ux, uy ) and 1/s, respectively, and whose optics is given by the choice ofthe speci®c wavelet c. Such a `gauging' property is illustrated in Fig. 1.In practice one deals with digital images, so I(x, y ) is canonically discretized on a square
lattice (we will denote I(i, j ) the value of I at node (i, j ) of the lattice). Taking into account adiscrete scaling s=s l0 based on a dilatation step s0 > 1, the translational parameters depend onthis scale and on a translational step u0:
ux � nu0sl0,
uy � mu0sl0
G. Boccignone et al. / Computers in Biology and Medicine 30 (2000) 267±286270

where (n, m, l ) $Z 3. Then, the discrete wavelet transform is de®ned as the decomposition onthe family of functions
cn, m, l �"1
sl0c
xÿ nu0s
l0
sl0,yÿmu0s
l0
sl0
!#n, m, l
:
Depending on the type of sampling, that is on the s0 and u0 values, the transform can be moreor less redundant. In the case of critical sampling s0=2 and u0=1, the wavelet family can bechosen as an orthonormal (ON) basis. On the other hand, if one is tied to speci®c constraints,e.g. a symmetric shape of the wavelet function, then the orthonormality requirements must berelaxed by employing biorthogonal bases [12].A fast algorithm to compute an ON transform, which is widely used for image processing
applications, has been given by Mallat [16]. According to this algorithm, ON wavelet basis canbe obtained by using two quadratic mirror ®lters H and G which are, respectively, a low passand a band-pass ®lter.The computing process is made recursive by ®ltering the image along the x, y axes. The
resulting ®lterings by H along both axes give an approximation (smoothing) of the image on ascale of 2l ÿ 1. Similarly the ®lterings by H along the x axis and by G along the y axis, by Galong the x axis and by H along the y axis, and by G along both the x and y axes provide thewavelets coe�cients on a scale of 2l ÿ 1.The sub-images representing the smoothed image and the wavelet coe�cients are named sub-
Fig. 1. An example of WT using B-Spline mother wavelet [17] over a scan line extracted from a mammography
containing microcalci®cations. At level 2 of the decomposition, a signal peak is shown corresponding to the target,whose magnitude is higher than the magnitude shown at level 1.
G. Boccignone et al. / Computers in Biology and Medicine 30 (2000) 267±286 271

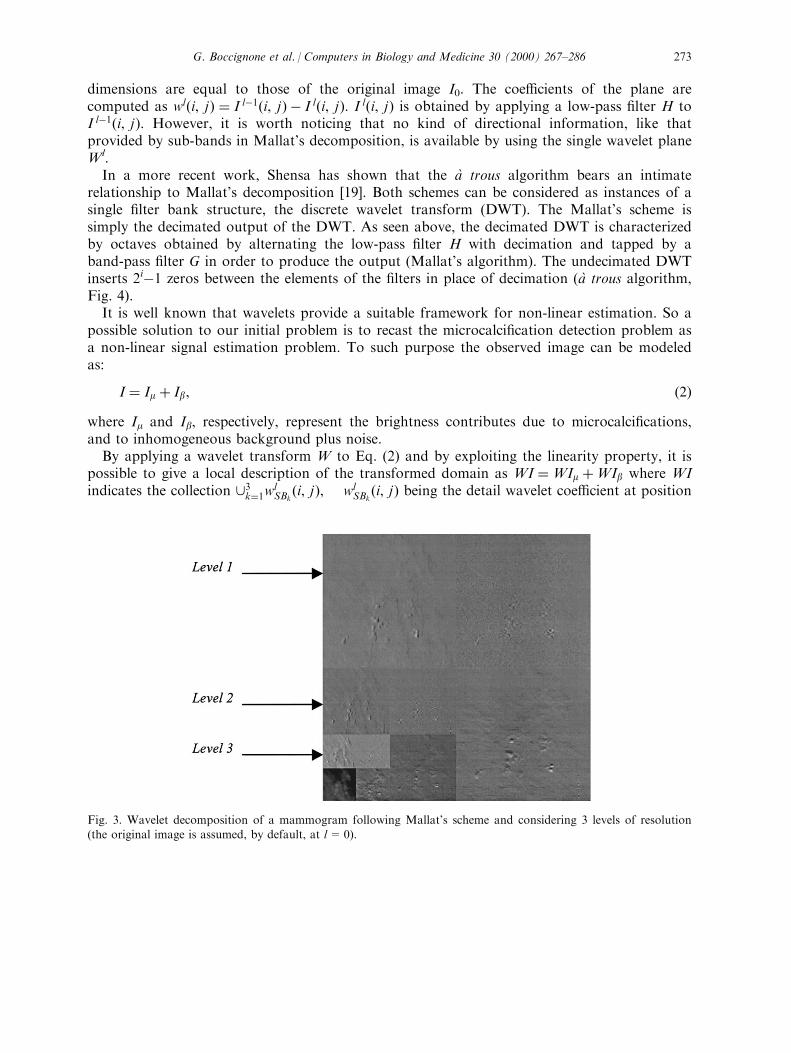
bands, which we will indicate as SBk, k = 0, 1, 2, 3. Fig. 2 represents one stage of thedecomposition. The ®lters H and G are one dimensional ®lters. This transform provides adecomposition of the original image into a set of independent, spatially oriented frequencychannels (the sub-bands) at di�erent resolution levels. Note that the algorithm can be adoptedby biorthogonal bases too [12].The representation properties of the WT can be grasped at a glance by considering Fig. 3. It
shows a portion of mammogram decomposed according to Mallat's scheme at l = 1, 2, 3resolution levels.In the ®gure, the channels are represented as sub-images. It can be noted that the SB0 sub-
image contains low spatial frequencies in both horizontal and vertical directions; in SB1 thehorizontal direction has low-frequencies, and the vertical one has high frequencies, thusrepresenting vertical details of the original image, while the opposite holds for SB2; eventually,the SB3 sub-image shows high spatial frequencies along both directions, thus focusing ondiagonal details.
2.2. Wavelet representation of mammographic images
The ON wavelet transform has been successfully applied for image processing and imagecompression. However, the same algorithm might not be convenient for image analysispurposes: on the one hand it is not shift-invariant, on the other hand image sub-bands resultuncorrelated at the di�erent scales.In signal analysis, unlike compression applications, a redundant expansion of the signal is
often desired. Therefore, several redundant decompositions have been proposed in theliterature.One such scheme, the aÁ trous (with holes) algorithm [18], is well known for its computational
e�ciency with respect to image analysis applications. The WT performed by this algorithmproduces a so-called wavelet plane W l � fwl�i, j�g at each decomposition level l, whose
Fig. 2. One stage of Mallat's decomposition.
G. Boccignone et al. / Computers in Biology and Medicine 30 (2000) 267±286272
dimensions are equal to those of the original image I0. The coe�cients of the plane arecomputed as wl�i, j� � I lÿ1�i, j� ÿ I l�i, j�: I l�i, j� is obtained by applying a low-pass ®lter H toI lÿ1�i, j�: However, it is worth noticing that no kind of directional information, like thatprovided by sub-bands in Mallat's decomposition, is available by using the single wavelet planeWl.In a more recent work, Shensa has shown that the aÁ trous algorithm bears an intimate
relationship to Mallat's decomposition [19]. Both schemes can be considered as instances of asingle ®lter bank structure, the discrete wavelet transform (DWT). The Mallat's scheme issimply the decimated output of the DWT. As seen above, the decimated DWT is characterizedby octaves obtained by alternating the low-pass ®lter H with decimation and tapped by aband-pass ®lter G in order to produce the output (Mallat's algorithm). The undecimated DWTinserts 2iÿ1 zeros between the elements of the ®lters in place of decimation (aÁ trous algorithm,Fig. 4).It is well known that wavelets provide a suitable framework for non-linear estimation. So a
possible solution to our initial problem is to recast the microcalci®cation detection problem asa non-linear signal estimation problem. To such purpose the observed image can be modeledas:
I � Im � Ib, �2�where Im and Ib, respectively, represent the brightness contributes due to microcalci®cations,and to inhomogeneous background plus noise.By applying a wavelet transform W to Eq. (2) and by exploiting the linearity property, it is
possible to give a local description of the transformed domain as WI �WIm �WIb where WIindicates the collection [3k�1wl
SBk�i, j�, wl
SBk�i, j� being the detail wavelet coe�cient at position
Fig. 3. Wavelet decomposition of a mammogram following Mallat's scheme and considering 3 levels of resolution(the original image is assumed, by default, at l=0).
G. Boccignone et al. / Computers in Biology and Medicine 30 (2000) 267±286 273

(i, j ) in the sub-band SBk, at level l 2 �0, Lÿ 1�: Notice that we are not considering the lowfrequency band SB0 (smoothed image), since useful information mostly resides in the detailsub-bands.At each level l, a representation plane fwl�i, j�:0Ri < N, 0Rj <M g is built, where each
coe�cient is the weighted linear combination:
wl�i, j� �X3k�1
ak j wlSBk�i, j� j �3�
Note that, di�erently from the classical aÁ trous algorithm, we obtain a wavelet plane in whichthe directional information of the original sub-bands SBk is implicitly retained through the akweights. Upon each plane, candidate microcalci®cations are to be estimated by thresholding.
2.3. Wavelet thresholding and microcalci®cation estimation
In order to perform a non-linear estimation, a thresholding of the wavelet coe�cients can beaccomplished. Note that wavelet thresholding, as suggested by Donoho [20], has been actuallyemployed for de-noising rather than true detection. Nevertheless the idea of using coe�cientthresholding speci®cally for object localization is not new, as discussed in section 1 [10]. Theoriginal contribution of our approach consists into an automatic determination of thethreshold function, relying on an information theoretic tool, namely Renyi's information.Motivations are the following.Consider at each level l the distribution pl(x ) of the wavelet coe�cients x � wl�i, j�: In
principle, the distribution pl�x� can be conceived as the mixture of two distributions ml�x� andbl�x�, namely the distributions of `microcalci®cation coe�cients' w l
m and `background
Fig. 4. One stage of the proposed decomposition scheme at level i.
G. Boccignone et al. / Computers in Biology and Medicine 30 (2000) 267±286274

coe�cients' w lb. More precisely, m l(x ) and b l(x ) are de®ned on the supports Om and Ob both
depending upon the parameter tl, that is Olm�tl�� fx:xl
min RxRtl g and Olb�tl�� fx:tl < xRxl
max g,where xl
min � minfwl�i, j�g and xlmax � maxfwl�i, j�g: Thus, we suppose that ml�x�4 0 on
Olb�tl� and that bl�x�40 on Ol
m�tl�:In order to detect the objects of interest, at a ®xed level l of the transform, one should
determine t l such that the functional�Ol �ml�x� ÿ bl�x��2 dx, representing the distance between
the two distributions, be maximized over Ol�Olm�tl� [ Ol
b�tl�: Denote
Vr�a� � 1
1ÿ rln
��Oa
a�x�r dx
��4�
the r-th order Renyi's information of the distribution a(x ) over the support Oa [21]. It is easyto show (Appendix A) that the optimum tl can be suitably approximated by maximising thesecond order Renyi's information of m l(x ) and b l(x ) with respect to tl. Namely,
tl � Arg maxfVr�ml� � Vr�bl�g, �5�where r=2.
3. Implementation
3.1. Algorithm realization
The algorithmic implementation of the proposed method was approached through a series ofphases: wavelet transformation of the digital mammographic image, average sub-bandformation, coe�cient quantization, computation of the thresholding values, thresholding, ®nalmicrocalci®cation detection.The ®rst phase, WT computation, consists in exploiting an undecimated decomposition in
two dimensions, so as to obtain an aÁ trous algorithm that still preserves sub-band information,as in Mallat's scheme. The scheme adopted is outlined in Fig. 4. Dif and Dig represent f and gwith 2i ÿ 1 zeros between each pair of ®lter coe�cients.The next phase takes into account the weighted composition, at each level, of the three sub-
bands SB1, SB2, SB3 according to Eq. (3). For the purposes of the present work, these aredetermined so as to enhance information provided by sub-band SB3 with respect to the othersub-bands. The output of this phase is represented by the l weighted sub-bands.In order to determine the thresholds, it is necessary to transform the coe�cients fwl�i, j�g
into distributions, and this is done in the following phases. First, a quantization phase isperformed. For each weighted sub-band, each coe�cient value is quantized according to thefollowing linear quantization:
~wl�i, j� � trunc
"Kwl�i, j� ÿ wl
min
wlmax ÿ wl
min
#, �6�
where K = 2k is the number of quantization levels, k being the number of bits used for
G. Boccignone et al. / Computers in Biology and Medicine 30 (2000) 267±286 275

quantization The quantized coe�cients ~wl�i, j� are thus in a suitable form to determineprobability distributions through histograms. To this end, we consider the coe�cients as asequence of independent and identically distributed random variables whose probability densityfunction is pl�x� � Prf ~wl�i, j� � xg:Let
pl�x� � nlx=N �7�be an estimate of the probability distribution of the ~wl�i, j�, where n l
x represents the number ofcoe�cients ~wl�i, j� assuming value x at level l, N is the total number of coe�cients. Thecontinuous Renyi's entropy of Eq. (4) is written in discrete form as:
Vr� pl� � 1
1ÿ rlnXKk�0
pl�k�r, �8�
where r�r 6�1� is a positive real parameter. We exploit Renyi's entropy as follows. Fromdistribution pl�x�, estimated according to Eq. (7), two probability distributions for the objectclass (microcalci®cations) and for the background class (breast tissue), m l and b l, respectively,are derived:
ml � pl�0�pl�ml� ,
pl�1�pl�ml� , . . . ,
pl�tl�pl�ml�
bl � pl�tl � 1�pl�bl� ,
pl�tl � 2�pl�bl� , . . . ,
pl�K �pl�bl� , �9�
where pl�ml� � Stl
i�0pl�i�, pl�bl� � SK
i�tl�1pl�i�, with pl�ml� � pl�bl� � 1:
The optimal threshold tl is that which maximizes the total Renyi's entropy Vr�ml� � Vr�bl�,and it is calculated according to Eq. (5). Practically, for each quantization level 0Ri < K,Vr�ml� and Vr�bl� are computed using Eqs. (8) and (9), then summed to obtain the total Renyi'sentropy; the maximum value of the total entropies is the one for which i corresponds to theoptimal threshold tl.By using tl, at each level the detection is performed by constructing a binary map Ml�i, j� as
a truth table such that Ml�i, j� � 1, if wl�i, j� > tl, and Ml�i, j� � 0 otherwise.The resulting Ml�i, j� are combined to produce a detection map M�i, j�: To this end, we
have adopted a majority vote criteria [22]: each Ml�i, j� is considered as an expert who votesfor one class (i.e., the microcalci®cation class and the non-microcalci®cation class) and theestimated class is the one voted by the majority. The vote is also weighted by a numberrepresenting the reliability of the expert assigning a sample to the class. In this way, weselectively reward each decomposition level according to its information content as respect tothe other ones (e.g., levels 2 and 3 are preferred as respect to level 1, which contains eitherdetails and noise). Eventually, the detection map M�i, j� is formed, where each connected set ofnon-zero locations of M�i, j� represents a target detected in the image.The algorithmic realization of the proposed method can be summarized as a series of steps.
These steps can be separated and listed as the following.
G. Boccignone et al. / Computers in Biology and Medicine 30 (2000) 267±286276

1. Computation of the wavelet transform of the digital mammogram.2. For each decomposition level the following sub-steps are repeated.
2.1. A weighted average of all the details images is formed2.2. The average detail image is quantized2.3. The threshold selection is accomplished by using Renyi's entropy.2.4. The quantized image is thresholded and the binary map formed as an estimation of the
microcalci®cation position.
3. The multiresolution supports that are produced at the various levels of the decompositionare combined in the detection map according to a majority vote policy.
When all the steps are completed, the connected regions of the latter map represent thedetected microcalci®cations.
3.2. Image data set
For evaluation purposes, experiments have been performed on the standard Nijmegen dataset. The 40 images of this data set have been made available by the Department of Radiology,University Hospital Nijmegen, The Netherlands, and can be obtained via anonymous ftp fromfigment.csee.usf.edu in directory pub/mammograms/nijmegen-images.All images are in raw format, of size 2048 by 2048 pixels, 12 bits per pixel of grey level
information. The images were digitized from ®lm using an Eikonix 1412 12 bits CCD camera.A sampling aperture of 0.05 mm in diameter was used, and a 0.1 mm sampling distance too.The images were corrected for inhomogeneity of the light source (Gordon plannar 1417). A®xed calibration of the CCD camera was adopted. Optical density 0.18 corresponds to themaximum output level (4095).The position and size of the microcalci®cation clusters were marked by two expert
radiologists, based on all patient data available (di�erent views, magni®cations). Theseannotations were put into the computer as circular areas and are stored in separate ®les.This is the same data set used by Karssemeijer in [5] and other recent papers (for a
comprehensive review see [23] and [24]).
3.3. Experimental framework
A ®rst prototype of the system has been written in C++ language running on a Pentium300 under Windows 95/Windows NT Operating Systems, and developed upon the FLOWeR
2
platform, an innovative object-oriented radiological information system produced by Integris-GROUPE BULL [25].
4. Procedures and results
In a preliminary stage, the aim was to tune method's parameters for maximising the truedetections while minimising false detections. As a ®gure of merit, the detection of
G. Boccignone et al. / Computers in Biology and Medicine 30 (2000) 267±286 277

microcalci®cation clusters was considered [5], by counting the ratio
TPC � #true positive clusters detected
#true positive clusters to be detected
and the false rating
FPC � #false positive clusters detected
#images
A cluster is observed if more than two microcalci®cations are localized inside a circular regionof radius 0.5 cm, marked around each detected microcalci®cation. The cluster is true positive ifmarked as such in the accompanying truth image; false positive, otherwise.Three aspects have been taken into account: (1) the choice of the wavelet bases; (2) the
number of decomposition levels; (3) the tuning of the ak weights in Eq. (3).Standard wavelet bases have been used: Burt±Adelson, Battle±Le Marie, B-spline I, B-spline
II, Daubechies 4, Daubechies 6, Daubechies 8, Daubechies 10. The exact ®lter coe�cients ofsuch bases, and detailed descriptions can be found in [17] and [12]. The best TP/FP rate, at®xed parameters, has been obtained by biorthogonal B-spline II basis [17]. Fig. 5 displays in agraph the performance of the di�erent bases.For this and subsequent experiments, an acceptable number of decomposition levels resulted
L = 4; clearly, this choice is a trade-o� between the size of the object to detect and thepresence of noise. As regards point (3), we initially set equal weights (Eq. (3)), i.e. a1 � a2 � a3:The results of these preliminary stages, as far as individual microcalci®cations are concerned,show that the method detects TP calci®cations in the same regions as in the accompanyingtruth images and a maximum of about 10 FP cases are detected per image. Fig. 6 illustrates atypical detection example.
Fig. 5. Cluster detection performance measured on 40 images of the Nijmegen database (a1=a2=a3, L = 4). The
following bases have been used: Burt±Adelson (W1), Battle±Le Marie (W2), B-spline I (W3), B-spline II (W4),Daubechies 4 (W5), Daubechies 6 (W6), Daubechies 8 (W7), Daubechies 10 (W8). W4 clearly shows the best TP/FPrate.
G. Boccignone et al. / Computers in Biology and Medicine 30 (2000) 267±286278

A second set of experiments derived from a more subtle analysis of point (3). The ak valuechoice, 0RakR1, implies a di�erent weighting of the information in the three subbands SBk. A®rst reasonable assumption is that the strongest singularities (like background texture ones) aremost likely to appear within the SB1 band (diagonal details) rather than within SB2 and SB3
(vertical and horizontal details). A second assumption is that SB2 and SB3 should be equallyweighted. By imposing that a1 � a2 � a3 � 1, with a2 � a3, it is possible to observe the TPC/FPC ratio versus the a 1 variation in the [0,1] range (FROC curve).Our method was then compared with the most recent ones, in particular Strickland's [10].
The obtained FROC is shown in Fig. 7. We obtained as best result 66% of TPC at the FPCrate of 0.7 (with a1=0.56). On the same database, Strickland achieves 55% of TPC at the FPCrate of 0.7.
Fig. 6. An example of detection: (a) original image; (b) truth image; and (c) detected microcalci®cations.
G. Boccignone et al. / Computers in Biology and Medicine 30 (2000) 267±286 279

The average time needed to process a mammogram from the selected data base was about 1minute on the described system.
5. Discussion
In its essence, the approach does not assume any contextual information about the presenceor absence of targets in the image, neither an exact model of the background tissue and noiseis needed. On the other hand, for e�ective use, the method requires some attention to be paidto the following points: the type of wavelet basis, the number of scales of the decomposition,and the a -weighting of the information carried in the sub-bands. All these parameters areapplication dependent. However, the ®rst two are generally common to any method relyingupon the WT, whereas the a-weighting is clearly speci®c of the method described here.The choice of wavelets and the range of scales are two well known and crucial problems in
the wavelet literature [12]. In particular, let us consider the choice of a suitable basis. If onewants to avoid the self-construction of a wavelet basis, then attention should at least be paidto the issues of orthonormality, compact support and regularity. Compact support improvesthe spatial resolution of wavelets. Wavelets are compactly supported if they have ®nite supportwith maximum number of vanishing moments for they support width; we recall that a waveletc�x� has n vanishing moments if
�1ÿ1xkc�x� dx � 0, for 0Rk < n: In general, a strict local
support results in a lack of symmetry. Regularity relates to the order of di�erentiability andhas a straightforward interpretation in terms of detectable structures. Since di�erentiation inFourier domain amounts to a multiplication by ( jo ), existence of derivatives is related tosu�cient decay of the Fourier spectrum. In other terms, regularity provides a su�cient decayof the mother wavelet in the frequency domain, which makes it continuous in the spatialdomain.
Fig. 7. Cluster detection performance measured by plotting TPC/FPC while varying a1(FROC curve).
G. Boccignone et al. / Computers in Biology and Medicine 30 (2000) 267±286280

As reported in the previous Section, the following bases have been used: Burt±Adelson,Battle±Le Marie, B-spline I, B-spline II, Daubechies 4, Daubechies 6, Daubechies 8,Daubechies 10. Among these, B-spline II has achieved the best TP/FP rate. The reasons whyone basis is better than the other is worth discussing at this point.The di�erent wavelet bases we employ for our method can be divided into orthonormal ones
(Battle±Le Marie, Daubechies 4, Daubechies 6, Daubechies 8, Daubechies 10) andbiorthogonal ones (Burt±Adelson, B-spline I, B-spline II). ON wavelets allow a compactcoding and a perfect reconstruction of the image on one side, and for such reasons are andhave been widely used, also in microcalci®cation analysis (namely, in the form of Daubechiesbases [9,11]. However, on the other side, a trade-o� has to be found between smoothness ofthe function, its shape and a strict ®nite support of the wavelet. Biorthogonal wavelet ®lterscoe�cients were chosen for this study because, due to their symmetry properties, they causeless image distortions than asymmetric ®lters such as the orthonormal Daubechies ®lters.The Burt±Adelson basis (labelled as W1 in Fig. 5) is a quasi-orthogonal basis. It
corresponds to the Laplacian pyramid ®lter proposed by Burt and Adelson. We employ it as areference, general purpose basis since the Burt and Adelson decomposition has been widelyused in the ®elds of image analysis and computational vision [6]. Speci®cally, we adopt it in theform proposed by [17], which is close to ON, nonsymmetric ®lters called `coi¯ets'. Due to therelationship between the number of vanishing moments and the symmetry of the function,these wavelet functions appear to be more symmetric than the Daubechies ones. However, inorder to gain symmetry, some price has to be paid to the smoothness of the wavelet function.This results in an aptitude for capturing `spiky' signals other than true microcalci®cations.Such an e�ect can be noted in the graph of Fig. 5, where a relative higher rate of TP cases isachieved with respect to other bases, but at the cost of a high number of FP detections.In contrast, the Battle±Lemarie wavelets (W2) represent a smoother example, than the Burt±
Adelson basis. These wavelets are ON, polynomial spline wavelets that are computed fromspline multiresolution approximations. Since the wavelet is a polynomial spline, it iscontinuously di�erentiable (which guarantees smoothness). As can be seen from the graph,Battle±Lemarie basis performs comparably to Burt±Adelson in terms of TP/FP ratio. Clearly,because of their improved smoothness, the false positive rate is reduced, but, meanwhile, sometrue positives are missed.More interesting is to confront this basis against its non-orthonormal equivalent, namely B-
spline wavelets (W3 and W4). These are the natural counterparts of the classic B-splinefunctions and are biorthogonal, regular wavelets of compact support. In this respect, B-spline Iand B-spline II are very similar (same length and number of vanishing moments, precisely 4),but B-spline II is slightly more regular, which explains its smaller rate of FP detections. Anessential property of these functions is their compact support, which makes them much betterlocalized than the orthogonal Battle±Lemarie wavelets, thus achieving a better TP/FP rate onmammographic images.It is worth noting that the best performance of the B-spline bases we have experimentally
reported with respect to other bases, was not an unexpected result. They are a goodapproximation of the Laplacian of Gaussian function, which has been shown by Strickland tobe a prewhitening matched (optimum) ®lter for objects of Gaussian shape (idealmicrocalci®cation), embedded in background noise of Markov type. The suitability of B-spline
G. Boccignone et al. / Computers in Biology and Medicine 30 (2000) 267±286 281

wavelets for processing images of the kind we are dealing with, also stems from a more generalproperty, namely the asymptotic convergence of B-spline wavelets to Gabor functions(modulated Gaussian) [26]. It is well known that Gabor functions are optimally concentratedin both spatial and spatial-frequency domain, which endows them with a remarkable aptitudefor the analysis of non-stationary signals and textures [6].Eventually, we considered the Daubechies family of wavelets (W5, W6, W7 and W8) [12].
The bases of this family are usually named `Daubechies k', where k denotes the length of the®lter (and k/2 the number of vanishing moments). Daubechies wavelets are orthonormal,compactly supported and regular. These bases are in principle suitable for analysis of signalswith ®nite support; further, they should provide a good combination of regular prototypewavelets with varying size to extract texture information with varying spatial frequency. Theregularity of the Daubechies wavelets is proportional to the number of vanishing moments.For instance, the mother wavelet of the Daubechies 4 (2 vanishing moments) is more `spike-like' compared with that of the smoother Daubechies 10 (5 vanishing moments): thus theformer is eligible to detect more pixels of high spatial frequency, as opposed to the latter.These pixels may belong to microcalci®cations, breast boundary, or background noise. In otherwords, the behavior of this family mirrors the fact that shorter wavelet ®lters are more sensibleto existing microcalci®cations but they tend to produce more false positives. Such behavior canbe neatly seen in the graph displayed in Fig. 5, where the number of FP cases decrease as kincreases.Once the wavelet basis has been selected, the range of scales can be derived by taking into
account the size of the structure to be detected against the size of background structures.In the case studied here, it is easy to forecast that most of the ®ne background structures are
matched at the ®nest scale whereas they are discarded at subsequent, coarser scales (l= 2,3,4).Nevertheless, it has to be remarked that the voting procedure has given evidence of appreciable¯exibility with respect to this speci®c problem (in the sense that, when the optimum coarsestscale L = 4 is relaxed to the L = 6 value, the system shows a very slight reduction ofperformance).As regards the presented method, some particular attention should be devoted to the a -
weighting of sub-band information. For this speci®c issue, ROC analysis, which is based onstatistical decision theory, provides a reliable tool. We have employed it in the particular formof FROC curves, which constitutes a standard procedure in mammographic analysis. It isworth noting, however, that, in general, ROC curves provide objective estimates ofprobabilities of decision outcomes (in terms of true-positive and false-positive decisions), thuscan be exploited for any and all of the criteria the system may have to tune.
6. Conclusion
In this study we have presented a new method for computer aided detection ofmicrocalci®cations in digital mammograms. The theoretical background of the method hasbeen discussed and the theory substantiated with experiments on real mammographic images.These are part of a standard and publicly available database.The method relies on a multi-scale representation of the mammographic image. Motivation
G. Boccignone et al. / Computers in Biology and Medicine 30 (2000) 267±286282

for adopting a multi-scale representation stems from the fact that microcalci®cations revealsome evident features at some speci®c scale, while being invisible at other scales; on the otherhand, directional information can be obtained at each scale in the form of sub-bands or detailimages, in order to account for di�erent kinds of image singularities Ð for instance,microcalci®cations and background texture. In our case we choose a redundant representationbased on an undecimated wavelet transform in order to avoid the lack of shift invariance andof spatial correlation across scales, which are typical of the most popular Mallat's algorithm.Meanwhile, directional information has been taken into account by a weighted merge of thevarious sub-bands at a scale. Such a decomposition scheme has demonstrated to be a goodtrade-o� between the e�ectiveness of completely redundant decomposition, like a Gaborrepresentation, and the computational e�ciency of an ON scheme.Di�erently from other methods (see for instance [3,8]), microcalci®cation detection is
thoroughly performed on the transformed image. The detection procedure relies on waveletcoe�cient thresholding. In contrast to another approach [10], the threshold is automaticallydetermined, at each scale, by maximising Renyi's entropy. The Renyi's entropy has deep rootsin information theory [21] and to the best of our knowledge this is the ®rst time it has beenaddressed for threshold selection in wavelet space.So far candidate detections are proposed at each scale. Thus, a ®nal combination stage,
based on majority voting, selects the actual detected microcalci®cation.It has to be noted that the only tuning speci®cally requested by the algorithm, apart from
the selection of a suitable wavelet basis and the number of the decomposition scales, is the a -weighting of the detail sub-bands. These parameters can be experimentally determined viaROC curves and no a priori knowledge is required. Therefore, while retaining e�ectivedetection, the algorithm avoids the complexity of other approaches [5].Improvements to the method can be obtained in several ways. First of all, no correlation is
considered among the several images of a single breast (cranio-caudal and lateral view). Takinginto account both images may result in an enhancement of detection results.Secondly, we argue that the TP/FP ratio may be improved if the detection results were given
in input to a combination of classi®ers or multiple experts. For instance, it is possible toconceive an architecture formed by wavelet detection modules coupled with neural networkstrained at the several decomposition levels used as inputs of a validation net. It is likely thatthe use of a hybrid architecture would result in better performance than could be achieved bythe method alone. However, this strategy should be followed only if the higher complexity ofthis approach were to be clearly counterbalanced by a noticeable improvement in detectionperformance.
7. Summary
This paper has been dealing with the application of computer image processing and analysistechniques to digital mammographic images. The purpose was the detection of clusteredmicrocalci®cations. Our algorithm was based on the wavelet transform. Unlike othertechniques proposed in the literature, the detection is directly accomplished into the waveletdomain and no inverse transform is required. Further, microcalci®cations are separated from
G. Boccignone et al. / Computers in Biology and Medicine 30 (2000) 267±286 283

background tissue using a thresholding procedure. A novelty of the method is that thecomputation of the threshold is automatic and exploits Renyi's entropy. The latter is evaluatedat the di�erent decomposition levels of the wavelet space and level dependent candidatedetections are produced. Successively, these are combined via majority voting to achieve the®nal detection. Experiments are reported on the standard Nijmegen mammogram data set.Preliminary results are demonstrating a high clinical relevance of the system.
Appendix A
In order to detect the objects of interest, one should determine tl such that the distancebetween the two distributions m l(x ) and b l(x ) be maximized. We say that such distancerepresents the level l information, and we de®ne it as the L 2 distance
�Ol �ml�x� ÿ bl�x��2 dx over
the support Ol�Olm�tl� [ Ol
b�tl�: Clearly, since�Ol�ml�x� ÿ bl�x��2 dx �
�Ol
m
ml�x�2 dx��Ol
b
bl�x�2 dxÿ 2
�Olml�x�bl�x� dx �10�
the functional at the left-hand side of Eq. (10) is maximised if�Ol ml�x�bl�x� dx is minimum. In
fact, for�Ol ml�x�bl�x� dx � 0 the two distributions can be considered `orthogonal' (we exactly
distinguish the targets from the background). If the left-hand side term of Eq. (10) denotes an`information', the last term on the right-hand side can be conceived as a sort of `entropy',which destroys information while increasing. Namely, denote H � ln
�Ol ml�x�b l�x� dx the
entropy we want to minimize for maximising information. By making use of the Cauchy±Schwartz inequality ��Ol ml�x�bl�x� dx�2R�
Ol ml�x�2 dx�Ol bl�x�2 dx and by taking into account
Eq. (10), H can be upper bounded as
2HR ln
�Ol
m
ml�x�2 dx� ln
�Ol
b
bl�x�2 dx �11�
Be IOa�r� � 1=1ÿ r ln��Oaa �x�r dx� the r-th order Renyi's information of the distribution a(x )
over the support Oa [21]. Then, from Eq. (11) follows
H < ÿ�IOlm�2� � IOl
b�2�� �12�
Consequently, the minimization of entropy H can be achieved by maximising the second orderRenyi's information of ml�x� and bl�x� with respect to tl:
tl � Arg max lim r42
8<: 1
1ÿ rln
�Ol
m
ml�x�r dx
!� 1
1ÿ rln
�Ol
b
bl�x�r dx
!9=; �13�
QED.
G. Boccignone et al. / Computers in Biology and Medicine 30 (2000) 267±286284
References
[1] K.S. Woods, Automated Image Analysis Techniques for Digital Mammography, Ph.D Thesis, University ofMaryland, Maryland, 1994.
[2] D.H. Davies, D.R. Dance, Automatic computer detection of clustered microcalci®cations in digitalmammograms, Physics in Medicine and Biology 35 (8) (1990) 1111±1118.
[3] J. Dengler, S. Behrens, J.F. Desaga, Segmentation of microcalci®cations in mammograms, IEEE Transactionson Medical Imaging 12 (4) (1993) 634±642.
[4] L. Shen, R.M. Rangayyan, J.E.L. Desautels, Application of shape analysis to mammographic calci®cations,
IEEE Transactions on Medical Imaging 13 (2) (1993) 263±274.[5] N. Karssemeijer, Adaptive noise equalization and recognition of microcalci®cations clusters in mammograms,
International Journal of Pattern Recognition and Arti®cial Intelligence 7 (6) (1993) 1357±1377.
[6] B.A. Wandell, Foundations of Vision, Sinauer, Sunderland, 1995.[7] D. Brzakovic, M. Neskovic, Mammogram screening using multiresolution-based image segmentation,
International Journal of Pattern Recognition and Arti®cial Intelligence 7 (6) (1993) 1437±1460.
[8] J.M. Dinten, M. Darbawx, E. Nicolas, A global approach for localization and characterization ofmicrocalci®cations in mammograms, in: K. Doi, M.L. Giger, R.M. Nishikawa, R.A. Schmidt (Eds.), Digital
Mammography '96, Elsevier, Chicago, 1996, pp. 235±238.[9] Y. Chitre, A.P. Dhawan, Adaptive wavelet analysis and classi®cation of mammographic microcalci®cation, in:
Digital Mammography '96, Elsevier, Chicago, 1996, pp. 323±326.
[10] R.N. Strickland, H.I. Han, Wavelet Transform for Detecting Microcalci®cations in Mammograms, IEEETransactions on Medical Imaging 15 (2) (1996) 218±229.
[11] T.C. Wang, N.B. Karayiannis, Detection of microcalci®cations in digital mammograms using wavelets, IEEETransactions on Medical Imaging 17 (4) (1998) 498±509.
[12] I. Daubechies, Ten Lectures on Wavelets, SIAM, Philadelphia, 1992.
[13] E.P. Wigner, On the quantum correction for thermodynamic equilibrium, Physical Review 40 (1932) 749±759.[14] D. Gabor, Theory of communication, Journal of IEE 93 (1946) 429±457.
[15] A. Grossmann, J. Morlet, Decomposition of Hardy functions into square integrable wavelets of constant
shape, SIAM Journal of Mathematical Analysis 15 (4) (1984) 723±736.[16] S. Mallat, Multifrequency channel decomposition of images and wavelet models, IEEE Transactions on
Acoustics, Speech and Signal Processing 37 (12) (1989) 2091±2110.
[17] M. Antonini, M. Barlaud, P. Mathieu, I. Daubechies, Image coding using wavelet transform, IEEETransactions on Image Processing 1 (2) (1992) 205±220.
[18] M. Vetterli, J. Kovacevic, Wavelets and Subband Coding, Prentice Hall, Englewood Cli�s, 1995.
[19] M.J. Shensa, The discrete wavelet transform: wedding the aÁ trous and Mallat algorithms, IEEE Transactionson Signal Processing 40 (10) (1992) 2464±2482.
[20] D. Donoho, I. Johnstone, Ideal spatial adaptation by wavelet shrinkage, Biometrika 81 (3) (1994) 425±455.[21] T.M. Cover, J.A. Thomas, Elements of Information Theory, Wiley, New York, 1991.
[22] J. Kittler, M. Hatef, R.B.W. Duin, J. Matas, On combining classi®ers, IEEE Transaction on Pattern Analysis
and Machine Intelligence 20 (3) (1998) 226±239.[23] K. Doi, M.L. Giger, R.M. Nishikawa, R.A. Schmidt (Eds.), Digital Mammography '96, Elsevier, Chicago,
1996.
[24] N. Karssemeijer, M. Thijssen, J. Hendreks, Hardbound L. Van Ermy (Eds.), Digital Mammography '98,Kluwer Academic, Nijmegen, 1998.
[25] G. Boccignone, M. De Santo, A. Picariello, L. Pierotti, F. Prigione, A system for computer aidedmammography, in: H.U. Lemke, M.W. Vannier, K. Inamura (Eds.), Computer Assisted Radiology and
Surgery, Elsevier Science B.V, 1997, pp. 197±202.
[26] M. Unser, A. Aldroubi, M. Eden, On the asymptotic convergence of B-spline wavelets to gabor functions,IEEE Transactions on Information Theory 2 (38) (1992) 864±872.
Giuseppe Boccignone is an Assistant Professor and a Senior Researcher at the Faculty of Engineering of the University of Salerno,
Italy. He received the Laurea degree in Physics from the University of Torino, Italy, in 1985. In 1986 he joined Olivetti Corporate
G. Boccignone et al. / Computers in Biology and Medicine 30 (2000) 267±286 285

Research, Ivrea, Italy. From 1990 to 1992, he was a chief researcher of the Computer Vision Lab at CRIAI, Napoli, Italy. From
1992 to 1994, he held a Research Consultant position at Research Labs of Bull HN, Milano, Italy, leading projects on biomedical
imaging. Since 1994 he has been with the Dipartimento di Ingegneria dell'Informazione e Ingegneria Elettrica of the University of
Salerno and in 1997 he was appointed Research Associate at INFM (National Institute for the Physics of Matter). His current
research interests include physics based vision, medical image processing and video parsing. Giuseppe Boccignone is a member of
IEEE and IAPR.
Angelo Chianese is an Associate Professor of Computer Science at the Faculty of Engineering at the University of Naples `Federico
II', Italy. He received the Laurea degree in Electronic Engineering from the University of Napoli, in 1980. From 1984 to 1992, he
was an Assistant Professor and a Researcher in the Computer Vision Lab of the Dipartimento di Informatica e Sistemistica of the
same university. His current research interests include image databases, distance education and distance learning, computer
networks, medical image processing and character recognition. Angelo Chianese is a member of AICA.
Antonio Picariello is an Assistant Professor and a Researcher at the Faculty of Engineering at the University of Napoli `Federico
II', Italy. He received the Laurea degree in Electronic Engineering from the University of Napoli in 1991 and a Ph.D. in Computer
and Electronic Engineering in 1998 from the same university. Since 1995 he has been with the Dipartimento di Informatica e
Sistemistica of the University of Napoli. His current research interests include medical image processing, image databases, and
cursive script recognition.
G. Boccignone et al. / Computers in Biology and Medicine 30 (2000) 267±286286


![Artificial Intelligence for Mammography and Digital Breast ... · Automated analysis (ie, artificial intelligence [AI]) of mammograms and DBT images may address these needs. Computer-aided](https://img.pdfslide.net/doc/110x75/5f6c7222a90f5f482669f70a/artificial-intelligence-for-mammography-and-digital-breast-automated-analysis.jpg)