Embed Size (px)
Citation preview

Computer Model and Experiments of Glycosylation Modulation Dynamics in Cardiac
Action Potentials
Cardiac action potentials (AP) are produced by the orchestrated functions of ion channels. A
slight change in ion channel activity may affect the AP waveform, thereby potentially increasing
susceptibility to abnormal cardiac rhythms. Cardiac ion channels are heavily glycosylated, with up
to 30% of a mature protein’s mass comprised of glycan structures. However, little is known about
how reduced glycosylation impacts the gating of hERG (human ether-a-go-go related gene)
channel, which is partially responsible for late phase 2 and phase 3 of the AP. This study integrates
the data from in vitro experiments with in-silico models to predict the glycosylation modulation
dynamics in hERG ion channels and cardiac electrical signals. The gating behaviors of hERG
channels were measured under four glycosylation conditions, i.e., full glycosylation, reduced
sialylation, mannose-rich. And N-glycanase treated. Further, we developed in-silico models to
simulate glycosylation-channel interactions and predict the effects of reduced glycosylation on
multi-scale cardiac processes (i.e., cardiac cells, 1-D and 2-D tissues). From the in-silico models,
reduced glycosylation was shown to shorten the repolarization phase of cardiac APs, thereby
influencing electrical propagation in cardiac fibers and tissues. In addition, the patterns of derived
electrocardiogram show that reduced glycosylation of hERG channel shortens the QT interval and
decreases the re-entry rate of spiral waves. This work suggests new pharmaceutical targets for the
long QT syndrome and potentially other cardiac disorders.
2.1 Introduction
Glycosylation is a common enzymatic process in cardiac cells. It was shown that nearly 30%
of a mature protein’s mass is comprised of glycan structures [1]. It is established that voltage-gated
Na+ channels (𝑁𝑎𝑣) and K+ channels (𝐾𝑣) are also known to be modulated by posttranslational
glycosylation through isoform-specific mechanisms [2-5]. Many previous studies showed that
glycosylation-dependent gating effects were imposed on ion channels primarily by the terminal
residue attached to N- and O-glycans, sialic acid [5-7]. The addition and removal of glycans from
proteins and lipids are completed by the activity of >200 glycosidases, glycosyltransferases, and
transport proteins (glycogenes). Recently, Montpetit et al. showed that the cardiac glycome (i.e.,
the complete set of glycan structures produced in the heart) varies between atria and ventricles,
and changes differentially during development of each cardiac chamber [4]. Regulated expression
of a single glycogene was sufficient to modulate action potential (AP) waveforms and gating of
less sialylated 𝑁𝑎𝑣 consistently [3].
In addition to the evidence that a correctly regulated glycome is vital to normal cell function,
aberrant glycosylation has dramatic effects on the cardiac function. There is a set of >40 distinct
forms of inherited human diseases of reduced glycosylation known as Congenital Disorders of
Glycosylation (CDG) caused, typically, by a mutation or deficiency in a glycogene which results
in a relatively modest reduction in glycoprotein glycosylation [8, 9]. This variable but modest
reduction in glycosylation among CDG subtypes causes a high infant mortality rate. Recently
reported prevalence of cardiac involvement prompted experts to suggest screening for cardiac
dysfunction in all CDG patients and for CDG in all young patients suffering from cardiomyopathy
of unknown etiology. Together, the literature suggests that regulated and aberrant changes in
glycosylation impact cardiac function.

However, little is known about how altered glycosylation will impact cardiac function at
different organization levels, i.e., from ion channels to cells to tissues to the whole heart.
Corroborating data that connects the changes in multi-scale cardiac systems is difficult without
performing computer simulations. There is an urgent need to couple the wealth of data obtained
from in-vitro and in-vivo experiments with in-silico models. Computer model overcomes practical
and ethical limitations in the in-vivo experiments. In addition, it enables the prediction of causal
relationships between normal or abnormal functions (e.g., glycosylation modulation dynamics)
that in-vivo experiments alone cannot easily achieve.
Our objective is to investigate how changes in glycosylation influence the hERG (i.e., human
ether-a-go-go related gene) ion channels and cardiac electrical signaling from cells to cables, and
to tissues. In this present study, we developed in-silico models of cardiac cells and tissues to study
the role of glycosylation in cardiac function. The hERG channel mediates the rapid delayed
rectifying potassium current (𝐼𝐾𝑟), which is partially responsible for late phase 2 and phase 3 of
the AP, i.e., the repolarization of cardiac myocytes [10]. The "gain" or “loss” in the hERG channel
function can potentially lead to the Short or Long QT syndromes [11]. Our contribution is to
integrate the data from in-vitro experiments with in-silico models for predicting the effects of
reduced glycosylation on cardiac function. The purpose of this article is to model the glycosylation
effects on ion channels, and further predict its impacts at larger scales, i.e., from cells to tissues.
2.2 Multi-Scale Cardiac Modeling
Computer models facilitate the quantitative simulation, elucidation and understanding of
cardiac function in health and disease. The need to integrate models and data across multiple
biological scales has been widely recognized by biomedical and clinical researchers [12, 13]. This
present investigation integrates glycosylation-channel interactions, obtained from the whole-cell

patch clamp experiments, with in-silico models to predict glycosylation modulation dynamics in
hERG channels and cardiac electrical signals including ionic currents, action potentials, spiral
waves, and ECG signals. The development of multi-scale cardiac models, i.e., hERG channel, cell,
and tissues, is described as follows.
2.2.1 Model of hERG Channel
The hERG channel is widely modeled in two forms. One is the Hodgkin-Huxley (HH) type
model, and the other is Markov state model. The HH type formulation typically describes the
gating of hERG channel with two independent activation and inactivation variables, as shown in
the following equations:
𝐼𝐾𝑟 = 𝐺𝐾𝑟√𝐾𝑜
5.4𝑋𝑟1𝑋𝑟2(𝑉 − 𝐸𝐾)
𝑋𝑟1∞ = 1
1 + 𝑒−
(𝑉−𝑉𝑎)𝐾𝑎
𝑋𝑟2∞ = 1
1 + 𝑒(𝑉−𝑉𝑖)
𝐾𝑖
where 𝑉 is the trans-membrane action potential, 𝐾𝑜=5.4mM is the extracellular K+ concentration,
𝐸𝐾 is the reversal potential, 𝐺𝐾𝑟 is the conductance (nS/pF), 𝑋𝑟1∞ is the steady-state activation,
𝑋𝑟2∞ is the steady-state inactivation, 𝑉𝑎 is the voltage of half-activation, 𝑉𝑖 is the voltage of half-
inactivation, 𝐾𝑎 and 𝐾𝑖 are slope factors.
Despite the popularity of HH-type descriptions, Markov models have become increasingly
important in recent years. There are a number of Markov models developed with different states
and structures, e.g., Wang et al. [14], Clancy and Rudy [15], Mazhari et al. [16], and Oehmen et
al. [17]. In 2011, Bett et al. compared the HH type formulation with the aforementioned four
Markov models. The conclusion is that hERG is best represented by a linear Markov model with
3 closed states, one open and one inactivated state [18]. Hence, we adopted the 5-state Markov
formulations to model the gating of hERG channel. As shown in Figure 2-1, the Markov model

includes 3 closed states (C1, C2, C3), 1 inactivation (I) and 1 open (O) state. The transition rates
(𝛼’𝑠 and 𝛽’𝑠) are voltage-dependent, i.e., 𝛼 = 𝑎𝑖 × 𝑒𝑏𝑖∙𝑉 and 𝛽 = 𝑐𝑖 × 𝑒𝑑𝑖∙𝑉, wherer 𝑖 is the index
of transition rate parameters. The constants, Kf and Kb, describe the voltage insensitive transition
in the gating of hERG channel. ᴪ is defined as a function of other transition rates to ensure the
microscopic reversibility [16, 18]. The hERG channel stays in the fully closed state (C1) during
resting, and transfers to other states when excited. The initial value of C1 = 1, and others are 0.
Figure 2-1. Structure of 5-state Markov model of hERG channel
2.2.2 Model of Cardiac Myocyte
When a cardiac myocyte is stimulated, the states of ion channels (e.g., close, activation,
inactivation) control the ability of the ions (e.g., 𝑁𝑎+, 𝐶𝑎++, and 𝐾+) to cross the membrane. The
influx and efflux of ions generate electrical currents through the ion channels, and vary trans-
membrane potentials. The cardiac cell is modeled as a structured electric circuit with capacitors,
resistors and batteries. Specific to human ventricular cells, a number of models have been
developed in the literature, e.g., Priebe and Beuckelmann model [19], ten Tusscher-Panfilov 2004
model [20] and the updated 2006 model [21], Iyer et al. model [22], Grandi et al. model[23], and
O’Hara et al. model [24].
In this present investigation, we utilized ten Tusscher-Panfilov 2006 model to describe the
electrophysiological behaviors of human ventricular myocytes [21]. The justification is that the
results of ten Tusscher-Panfilov 2006 model best match our wild-type data (i.e., full glycosylation)
C3 C2 C1 α1
β1 Kb
αi3 α i
βi
α2
β2
𝐼𝐾𝑟 = 𝐺𝐾𝑟𝑂(𝑉 − 𝐸𝐾)
𝑰𝑲𝒓 = 𝑮𝑲𝒓𝑶(𝑽 − 𝑬𝑲
O
I Kf
ᴪ

from in-vivo experiments. The major updates from the ten Tusscher-Panfilov 2004 model to the
2006 version are the inclusion of more detailed description of intracellular Ca++ dynamics and
subspace Ca++ dynamics, as well as the revisions of fast and slow voltage inactivation gate in 𝐼𝐶𝑎𝐿.
The endocardial-cell version of ten Tusscher-Panfilov 2006 model is used to simulate the AP
(𝑉) with the following ordinal differential equation:
−𝐶𝑚
𝑑𝑉
𝑑𝑡= 𝐼𝑡𝑜 + 𝐼𝐾𝑠 + 𝐼𝐾𝑟 + 𝐼𝐾1 + 𝐼𝑁𝑎𝐶𝑎 + 𝐼𝑁𝑎𝐾 + 𝐼𝑝𝐾 + 𝐼𝑝𝐶𝑎 + 𝐼𝑏𝐶𝑎
+𝐼𝑏𝑁𝑎 + 𝐼𝑁𝑎 + 𝐼𝐶𝑎𝐿 + 𝐼𝑠𝑡𝑖𝑚
where 𝑡 is time, 𝐶𝑚 is the cell capacitance per unit surface area, 𝐼𝑠𝑡𝑖𝑚 is the external stimulus
current which activates the cell from the resting state. The transmembrane currents include
transient outward current (𝐼𝑡𝑜), slow delayed rectifier 𝐾+ current (𝐼𝐾𝑠), rapid delayed rectifier 𝐾+
current (𝐼𝐾𝑟), inward rectifier current (𝐼𝐾1), 𝑁𝑎+/𝐶𝑎++exchange current (𝐼𝑁𝑎𝐶𝑎), pump current
(𝐼𝑁𝑎𝐾), plateau currents (𝐼𝑝𝐾, 𝐼𝑝𝐶𝑎), background currents (𝐼𝑏𝐶𝑎, 𝐼𝑏𝑁𝑎), fast Na+ current (𝐼𝑁𝑎) and L-
type 𝐶𝑎++ current (𝐼𝐶𝑎𝐿). Most of these voltage-gated ionic currents are modeled in the form of
cell conductance, membrane potential gradients and channel gate dynamics. The details of all ion-
channel kinetics can be found in references [20, 21]. All parameters and initial values are the same
as given in the ten Tusscher-Panfilov 2006 model. Note that we replaced the HH type model of
𝐼𝐾𝑟 with the 5-state Markov model. The 𝐺𝐾𝑟 is the same as the original value in ten Tusscher-
Panfilov model. We optimally calibrated the 5-state Markov model to fit the in-vivo data of four
glycosylation conditions from our in-vivo experiments.
2.2.3 Model of Cardiac Tissue
The cardiac cell is not an independent unit. Each depolarized cell can stimulate neighboring
cells and trigger cell-to-cell conductions. In the rapid depolarization phase, the overshoot of 𝑁𝑎+
ions causes a resting-to-depolarizing 𝑁𝑎+ gradient and drives the flow of 𝑁𝑎+ through gap

junctions that stimulates adjacent cells. The influx of 𝑁𝑎+ causes neighboring cells to reach
threshold potential and initiates the depolarization phase of the AP. As the depolarization and
repolarization propagate among cells, electrical waves are generated. This cell-to-cell conduction
is analogous to a circuit system with resistances and capacitors. As shown in Figure 2-2, the
consecutive cell connections are modeled as linear fiber (cable) and tissue (cell array). The 1D
linear cable is composed of 600 cells, and a stimulus is given at cell 1. The linear strand of cells
(i.e., cable) is modeled using the following mono-domain reaction-diffusion equation:
𝜕𝑉
𝜕𝑡= −
1
𝐶𝑚
(𝐼𝑖𝑜𝑛 + 𝐼𝑠𝑡𝑖𝑚) +1
𝜌𝑆𝐶𝑚 𝜕2𝑉
𝜕𝑥2
and in 2D tissue, the equation is:
𝜕𝑉
𝜕𝑡= −
1
𝐶𝑚
(𝐼𝑖𝑜𝑛 + 𝐼𝑠𝑡𝑖𝑚) +1
𝜌𝑆𝐶𝑚 (
𝜕2𝑉
𝜕𝑥2+
𝜕2𝑉
𝜕𝑦2)
where 𝐼𝑖𝑜𝑛 is the sum of trans-membrane ion currents, 𝜌 = 180Ω𝑐𝑚 is the cellular resistivity, 𝑆 =
0.2 𝑢𝑚−1 is the surface-to-volume ratio, and 𝐶𝑚 = 2 𝑢𝐹/𝑐𝑚2 is the cell capacitance.
To simulate the propagation of cardiac electrical waves along 1D fiber, reaction-diffusion
equations are numerically solved with the finite-difference scheme. The action potential can be
calculated as:
𝑉𝑖𝑡+𝑑𝑡 = −
𝑑𝑡
𝐶𝑚
(𝐼𝑖𝑜𝑛 + 𝐼𝑠𝑡𝑖𝑚) − (2𝑞
𝐶𝑚− 1) 𝑉𝑖
𝑡 +𝑞
𝐶𝑚 (𝑉𝑖−1
𝑡 + 𝑉𝑖+1𝑡 )
where 𝑞 = 𝑑𝑡
𝜌𝑆𝑑𝑥2 is the same for all cells. Neuman boundary condition was assumed in the
simulation of 1D cardiac cable, i.e. 𝑉101𝑡 = 𝑉99
𝑡 and 𝑉0𝑡 = 𝑉2
𝑡 at the boundaries. The numerical
finite-difference scheme for 2D tissue is formulated as:
𝑉𝑖,𝑗𝑡+𝑑𝑡 = −
𝑑𝑡
𝐶𝑚
(𝐼𝑖𝑜𝑛 + 𝐼𝑠𝑡𝑖𝑚) − (4𝑞
𝐶𝑚− 1) 𝑉𝑖,𝑗
𝑡 +𝑞
𝐶𝑚(𝑉𝑖−1,𝑗
𝑡 + 𝑉𝑖+1,𝑗𝑡 + 𝑉𝑖,𝑗−1
𝑡 + 𝑉𝑖,𝑗+1𝑡 )
where no flux boundary condition is assumed to ensure there are no current leakages on the borders.

Figure 2-2 Structures of 1D fiber and 2D tissues
2.2.4 ECG Derivation
The ECG signal provides a system-level view of cardiac electrical activity, which is an
important clinical diagnostic tool. The standard lead I, II and III (i.e., Einthoven's triangle) measure
difference in potentials between electrodes plsaced on left arm, right arm and left leg [25]. In this
study, 3-lead ECG signals are measured using 3 virtual electrodes in an equilateral triangle on 2D
tissues. The ECG will be used to evaluate and quantify whether and how altered glycosylation
affects cardiac electrical conduction. In this investigation, the electrodes were placed at a distance
of 6 cm above 2D tissues with no-flux boundary conditions. The potential at each electrode is
calculated using the following equation:
∅ = ∬𝐼𝑖𝑜𝑛
𝑟
𝑆
𝑑𝑥𝑑𝑦
where 𝑆 is the area over cardiac tissue, 𝑖𝑖𝑜𝑛 is the transmembrane currents, 𝑥 and 𝑦 represent the
coordinates of cells on 2D tissue, and 𝑟 is given as:
𝑟 = √(𝑥 − 𝑥𝐸)2 + (𝑦 − 𝑦𝐸)2 + 𝑧𝐸2
Array:
… Cell 600 Cell 300 Cell 1 …
(1,1) (1,300) … (1,600)
(300,1)
(300,300) (300,600)
(600,1) (600,300) (600,600)
Cable:
where 𝐸 = (𝑥𝐸 , 𝑦𝐸 , 𝑧𝐸) is the location of the electrode. The 𝐼𝑖𝑜𝑛 current is obtained with the
following equation:
𝐼𝑖𝑜𝑛 =1
𝜌𝑆𝐶𝑚 (
𝜕2𝑉
𝜕𝑥2+
𝜕2𝑉
𝜕𝑦2)
Lead I, II, III ECG signals are the potential differences between two electrodes as:
𝐸𝐶𝐺(𝐸1, 𝐸2) = ∅(𝑥𝐸1, 𝑦𝐸1, 𝑧𝐸1) − ∅(𝑥𝐸2, 𝑦𝐸2, 𝑧𝐸2)
It may be noted that 60o orientation is considered between each two leads.
2.3 Materials and Experimental Design
2.3.1 Physical Experiments
We recently reported the effects of differential glycosylation on the gating of hERG ion
channels, showing that N-glycosylation effectively limits the hERG activity [26, 27]. The in-vitro
experimental data were collected from hERG-expressing CHO cells under 4 glycosylation
conditions, i.e., full glycosylation (n = 11), reduced sialylation (n = 11), mannose-rich
glycosylation (n = 6) and N-Glycanase treated (n = 6). Steady-state gating parameters were
examined with the use of standard pulse protocols and solutions described by the Bennett lab [26].
Steady State Activation (SSA) protocol is described as follows. Cells were held at -80 mV,
stepped to more depolarized potentials (-80 mV to +40 mV in 10 mV increments) for 4 seconds,
then stepped back to -50 mV for another 4 seconds, and returned to the holding potential. Steady-
state conductance values (𝐺) were calculated using ohm’s law 𝐺 = 𝐼/(𝑉𝑝 − 𝐸𝐾), where 𝐼 is the
peak of tail currents elicited at each test potential (𝑉𝑝). The maximum conductance generated by
each cell was used to normalize the data for each cell to its maximum conductance by fitting the
data to a single Boltzmann distribution as:
Fraction of maximal conductance = [1+exp(-(V-Va)/Ka]]-1

where V is the membrane potentials, Va is the half-activation potential, Ka is the slope factor. The
normalized data were averaged with those from the other cells to calculate the resulting average
G-V curves.
Steady state inactivation (SSI) is measured following a conventional protocol. Cells were held
at -80 mV before stepping to +20 mV for 3 seconds. Then we stepped to -120 mV to +60 mV (in
10 mV increments) for 30 ms before stepping back to +20 mV for 1 second and then returned to
the resting potential. The maximum current generated by each cell was used to normalize the data
for each cell to its maximum current by fitting the data to a single Boltzmann distribution, from
which the mean Vi ± SEM and Ki ± SEM values were determined.
Fraction of maximal current = [1+exp ((V-Vi)/Ki)]-1
where V is the membrane potential, Vi is the voltage of half-inactivation, Ki is the slope factor.
Table 2-1 shows the mean ± SEM SSA and SSI parameters measured under four glycosylation
conditions, as reported by us previously [26] . These changes in hERG channel gating were used
to calibrate in-silico models, which further predict glycosylation effects on cardiac electrical
signaling of cells and tissues.
Table 2-1 hERG channel activation and inactivation parameters [26]
hERG Channel n Va(mV) Ka(mV) Vi(mV) Ki(mV)
Full Glycosylation 11 -22.0±1.3 8.4±0.3 -74.4±4.9 -19.0±0.8
Reduced Sialylation 11 -13.7±2.4 8.6±0.4 -56.2±5.3 -17.2±1.3
Mannose-Rich 6 -12.6±2.4 8.9±0.4 -51.48±3.6 -16.4±0.9
N-Glycanase treated 6 -12.1±2.2 8.9±0.9 -58.5±5.9 -20.3±1.2
2.3.2 Computer Experiments
Recall that we modeled the hERG channel with a 5-state Markov formulation, as opposed to
the traditional HH type formulation. First, the Markov model was calibrated and fitted to

glycosylation data from in-vivo experiments (see Table 2-1). The sensitivity analysis is performed
to establish model parameters that maximally influence the output for each protocol. Furthermore,
the algorithm of nonlinear constrained optimization is used to find the parameter values
minimizing the sum of the least-square errors between model predictions and experimental data in
glycosylation. Pulse protocols used in in-silico models are the same as in in-vivo experiments.
Second, we simulated and compared the variations of 𝐼𝐾𝑟 currents and APs for four glycosylation
conditions. The glycosylation-induced variations in hERG channels were modeled to predict the
changes of 𝐼𝐾𝑟 magnitudes and action potential durations (APDs). Third, cardiac cells were
connected by gap junctions in a linear fiber, i.e., cable, to predict the glycosylation effects on AP
propagation, assuming that altered glycosylation impacts hERG channel gating only. The
inhomogeneous cable contains 600 cells, in which 300 cells are fully glycosylated and the other
300 cells are under one of three conditions of reduced glycosylation (i.e., reduced sialylation,
mannose-rich, or N-Glycanase treated)., Further, we measured the APD restitution curves for 4
glycosylation conditions in the 1D cable of cardiac cells. Finally, we construct the model of 2D
tissues by arranging cardiac cells in an array (see Figure 2-2). Glycosylation effects on the
rectilinear and spiral waves were predicted using in-silico simulation models. In addition, ECG
signals were derived to characterize the variations of cardiac electrical conduction between full
glycosylation and reduced glycosylation.
In the single cell, we used a 2-ms 38 pA/pF stimulus current (𝐼𝑠𝑡𝑖𝑚) applied at a frequency of
0.5~2 Hz to trigger simulated APs. The 𝐼𝐾𝑟 currents and AP were obtained after at least 100 cycles
when the cell reached steady states. The variable temporal resolution is used in the single-cell
simulation. In the linear cable, the 𝐼𝑠𝑡𝑖𝑚 amplitude of 52 pA/pF and spatial resolution ∆x=0.25mm
were used to generate the electrical waves. In addition, APD restitution curve is quantified with

the S1-S2 protocol. The left of the cable is paced at a basic cycle length of 1000ms with the S1
stimulus until steady-state is reached and is then perturbed by a stimulus (S2) after waiting a
variable-length interval. (3) In the 2D tissues, the 𝐼𝑠𝑡𝑖𝑚 amplitude is twice the diastolic threshold,
i.e., 52pA/pF. The spatial resolution ∆x is 0.04cm, and the temporal resolution ∆t is 0.02ms. The
spiral wave was initiated by applying a first stimulus (S1=2ms) along one side of the tissue to
generate a rectilinear wave propagating toward the other side. When the refractory tail of electrical
waves reaches the middle, a second stimulus (S2=5ms) will be given in the middle of the tissue,
paralleling to the first rectilinear wave covering only 3/4 of the length of the tissue [21].
Table 2-2 Numerical accuracy of APD and CV at different ∆x and ∆t
∆t = 0.01 ms ∆t = 0.02 ms
∆x(cm) APD (ms) CV (cm/s) APD
(ms) CV (cm/s)
0.02 323.00 71.38 322.98 69.89
0.025 322.96 69.44 322.94 68.10
0.03 322.94 67.43 322.92 66.26
0.035 322.94 65.31 322.92 64.31
0.04 322.94 63.06 322.92 62.23
We measured the CVs at different spatial and time resolutions for four glycosylation conditions
on a cable of 600 cells. Note that Table 2-2 does not include the CVs and APDs for different
glycosylation conditions. This is because 𝐼𝑁𝑎 is the main contributor to excite a cardiac cell and
trigger electrical conduction. In this investigation, we assumed that only hERG channels have
altered glycosylation and all other channels (including 𝑁𝑎+channel) remain unchanged. In the 1D
cable, the CVs are primarily controlled by the front of the waves (i.e., 𝐼𝑁𝑎 current). Hence, in-
silico experiments show that CVs are approximately the same for different glycosylation
conditions at the same ∆x and ∆t. However, when electrical waves propagate in the tissues, not

only the front of the waves, but also the back of the waves (i.e., refractory period) could affect the
conduction. This will be shown later in the section of results of spiral waves.
Here, the APD and CV decrease slightly when ∆x increase from 0.02cm to 0.04cm at both time
steps. When ∆t increases from 0.01ms to 0.02ms, there is a slight decrease in both APD and CV.
These small variations are mainly due to the approximation errors in the numerical analysis. The
models of cardiac cell and tissue are solved with the use of Ode15s solver and explicit finite
difference methods. Computer models were implemented using Matlab R2010a and Simulink v7.5
software from MathWorks (Natick, MA, USA) in a Windows 7 (Microsoft, Redmond, WA, USA)
64-bit machine.
2.4 Results and Discussions
2.4.1 Glycosylation Modulation of hERG Channel
Table 2-3 Markov state transition rates under four glycosylation conditions
Full glycosylation Reduced Sialylation Mannose-rich N-Glycanase
𝛼0 0.0312·exp(0.0165V) 0.018633·exp(0.0234V) 0.0199·exp(0.0254V) 0.0173·exp(0.022V)
𝛽0 0.0993·exp(-0.0269V) 0.0413·exp(-0.03533V) 0.0469·exp(-0.0385V) 0.0364·exp(-0.0318V)
𝛼1 0.0036·exp(0.0221V) 0.0024·exp(0.0210V) 0.0025·exp(0.0225V) 0.0023·exp(0.0195V)
𝛽1 0.0003·exp(-0.0088V) 1.55E-4·exp(-0.0195V) 1.55E-4·exp(-0.0209V) 1.48E-4·exp(-0.0181V)
𝛼𝑖 0.0127·exp(-0.0343V) 0.0274·exp(-0.0357V) 0.0293·exp(-0.0393V) 0.0250·exp(-0.0320V)
𝛽𝑖 0.4916·exp(0.0065V) 0.4660·exp(0.0048V) 0.5771·exp(0.0063V) 0.3458·exp(0.0032V)
𝛼𝑖3 8.04E-5·exp(3.86E-7V) 1.53E-6·exp(6.34E-7V) 1.54E-6·exp(6.47E-7V) 1.53E-6·exp(6.2E-7V)
𝐾𝑓 0.0262 0.0296 0.0321 0.0272
𝐾𝑏 0.1478 0.2136 0.2297 0.1972
Markov model of hERG channels is optimally calibrated to reproduce the in-vitro data from the
whole-cell voltage clamp experiments. Note that the SSA and SSI curves were obtained using the
same pulse protocol from simulated currents as well as from in-vitro experiments (see Figure 2-3).
First, we performed the sensitivity analysis on the Markov model to identify transition rates that

maximally impact the in-silico data for each pulse protocol. Second, a constrained nonlinear
optimization algorithm, i.e., trust-region-reflective [28], is employed to identify the parameters of
transition rates. The objective function is to find optimal parameter values that minimize the sum
of the least-square errors between in-silico and in-vivo data. Note that the parameter values from
Mazhari et al. [16] were used as initial guesses in the minimization procedure. A full list of the
parameters of transition rates under 4 glycosylation conditions is reported in Table 2-3.
Figure 2-3 shows the fitted SSA and SSI relationships of hERG under four glycosylation
conditions. Note that the SSA and SSI curves are shifted rightward (5~15mv) to more
hyperpolarized potentials. In other words, N-glycans limits hERG voltage-dependent activation
and inactivation by shifting the half-activation voltage of hERG to more depolarized potentials
(see Table 2-3 for parameter values). Thus, changes in glycosylation modulate the voltage-
dependent gating behaviors of hERG ion channels.
Figure 2-3 The hERG channel gating and kinetics under four glycosylation conditions. (a) Steady-
state activation (b) Steady-state inactivation. (In-vitro data as reported by us previously [26]: ■
Full Glycosylation ●Reduced Sialylation▲Mannose Rich▼N-Glycanase, In-silico data from the
Markov model: straight and dashed lines)
-60 -40 -20 0 20 400
0.2
0.4
0.6
0.8
1
SS
A
voltage (mV)-100 -50 0
0.2
0.4
0.6
0.8
1
SS
I
voltage (mV)
Full Glycosylation
Reduced Sialylation
Mannose Rich
N-Glycanase
(a) (b)

2.4.2 Reduced Glycosylation Modifies 𝐼𝐾𝑟 and Shortens APD
The measured shifts in SSA and SSI with changes in glycosyaltion would likely modulate 𝐼𝐾𝑟
during the repolarization phases of the AP. Further, we integrate glycosylation-channel
interactions (see Figure 2-3 from the whole-cell patch clamp experiments) with the in-silico model
of cardiac cell to predict whether and how reduced glycosylation will impact the 𝐼𝐾𝑟 currents and
action potentials. As shown in Figure 2-4, the 𝐼𝐾𝑟 current is shifted leftward along the time axis
with earlier and higher current densities under 3 reduced glycosylation conditions (i.e., reduced
sialylation, mannose-rich, and N-Glycanase). When hERG channels recover from the inactivation
to the activated state, the repolarized cell will decrease the AP from the peak value to resting
potential. As shown in Figure 2-4, the N-Glycanase treated cell has a early peak in the 𝐼𝐾𝑟 current
along the time axis. This indicates the efflux of potassium current occurs earlier (i.e., repolarization)
in Phases 2 and 3 of AP. It may also be noted that mannose-rich and reduced sialylation treated
cells have similar 𝐼𝐾𝑟 spike shapes except the former has a higher peak in Figure 2-4. The larger
rightward shift in SSI curve measured for the mannose-rich conditions (See Figure 2-3(b)) are
likely responsible for this higher peak. In other words, hERG channels under mannose-rich
conditions would recover from inactivation at more depolarized potentials during the AP, therefore
the hERG channel would be more active during the AP, causing an increased 𝐾+ efflux.
Figure 2-5 shows that reduced glycosylation shortens the action potential duration (APD), and
the N-Glycanse treated cell yields the shortest APD. When 𝐾+ efflux increases, the
transmembrane potential decreases quickly and the cell repolarizes to the resting potential more
quickly. Reduced glycosylation promotes an earlier/higher 𝐼𝐾𝑟 peak, thereby leading to a faster
repolarization and a shortened APD. (see Figure 2-5). In addition, we validated the results from
in-silico models by measuring hERG current in CHO cells treated with N-Glycanase and under
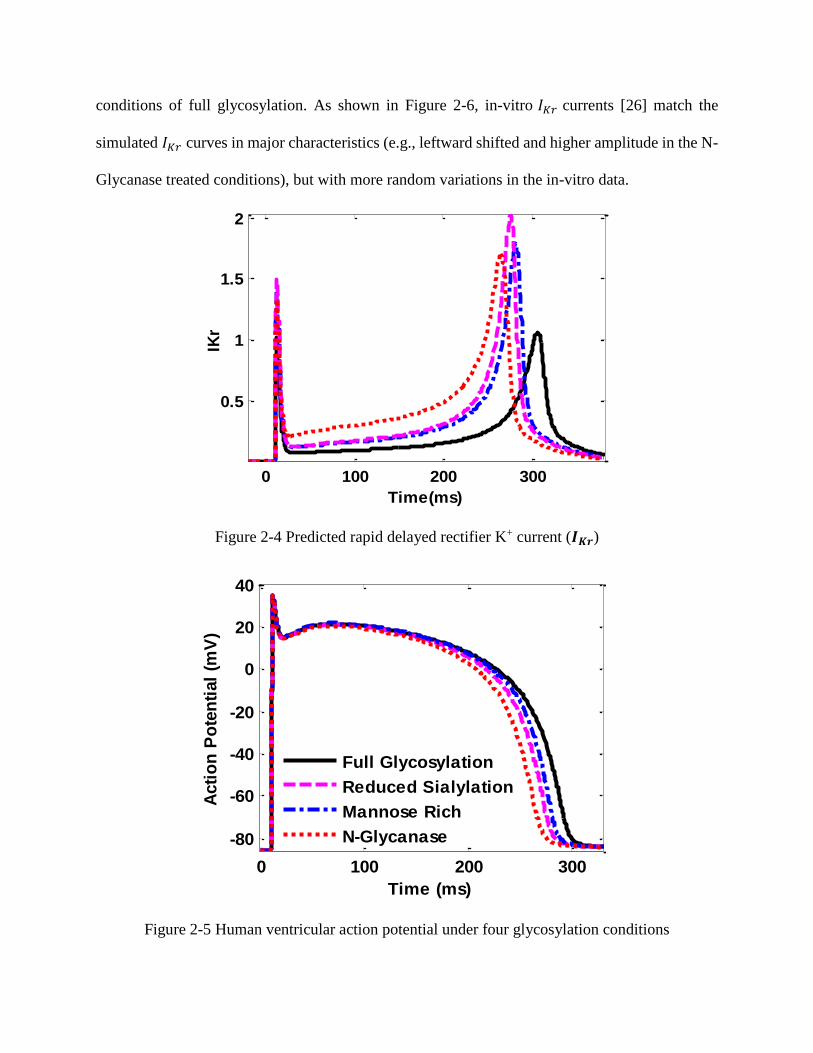
conditions of full glycosylation. As shown in Figure 2-6, in-vitro 𝐼𝐾𝑟 currents [26] match the
simulated 𝐼𝐾𝑟 curves in major characteristics (e.g., leftward shifted and higher amplitude in the N-
Glycanase treated conditions), but with more random variations in the in-vitro data.
Figure 2-4 Predicted rapid delayed rectifier K+ current (𝑰𝑲𝒓)
Figure 2-5 Human ventricular action potential under four glycosylation conditions
0 100 200 300
0.5
1
1.5
2
Time(ms)
IKr
0 100 200 300
-80
-60
-40
-20
0
20
40
Acti
on
Po
ten
tial
(mV
)
Time (ms)
Full Glycosylation
Reduced Sialylation
Mannose Rich
N-Glycanase

Figure 2-6 Comparison between in-vitro and simulated 𝑰𝑲𝒓 currents
2.4.3 Reduced Glycosylation Affects the APD Restitution in A Single Cell
We measured the APD restitution with the S1-S2 restitution protocol. The cell is paced at a
basic cycle length (BCL) with the S1 stimulus until steady-state is reached and is then perturbed
by a stimulus (S2) after waiting a variable-length interval. In our experiments, S1 stimulus is
applied for 30 cycles to reach the steady state. Also, two different BCLs, i.e., 1000ms and 2000ms
were used. Both S1 and S2 stimulus are 1ms duration and 38pA/pF amplitude.
Figure 2-7 a and b shows the APD90 restitution curves APDn+1 = f(DIn) at the BCL of 1000ms
and 2000ms, respectively. Note that the BCL of 1000ms yields a similar shape of APD90 restitution
curve as the 2000ms. The APD increases with the DI, and the reduce glycosylated cell has smaller
APD90 than the fully glycosylated one. However, there is a negative slope (𝑑𝑓/𝑑(𝐷𝐼) =< 0) at
small DIs, i.e., 15ms~22ms (see Figure 2-7a) for the BCL of 1000ms. For the BCL of 1000ms, the
minimal DI is 74.56ms, 73.16ms, 73.75ms and 70.69ms respectively for full glycosylation,
0 100 200 300 400
0
0.5
1
1.5
2
Time (ms)
IKr
N-Glycanase
Full glycosylation
Real Data
In-silico Model

reduced sialylation, mannose rich and N-Glycanase. The minimal DI is calculated when the slope
of APD90 restitution curve reaches 1 (i.e., 𝑑𝑓/𝑑(𝐷𝐼) = 1). Note that the minimal DI interval in
the condition of full glycosylation is the largest. Similar results were obtained for the BCL of
2000ms. The minimal DI interval is slightly smaller, i.e., 71.89ms, 64.29ms, 68.23ms and 64.74ms
respectively for full glycosylation, reduced sialylation, mannose rich and N-Glycanase.
Figure 2-7 Single-cell action potential duration (APD) restitution curves obtained with the pacing
rates of 1Hz (a) and 0.5Hz (b)
Figure 2-8 Protocol (a) and CV restitution (b) of 1D cable at Full Glycosylation, Reduced
Sialylation, Mannose Rich and N-Glycanase
0 100 200 300 400 500 600 7000
50
100
150
200
250
300
350
400
DI (ms)
AP
D90 (
ms)
Full glycosylation
Reduced sialylation
Mannose-Rich
N-Glycanase
0 100 200 300 400 500 600 7000
50
100
150
200
250
300
350
400
DI (ms)
AP
D90 (
ms)
20 40
100
120
140
160
180
DI (ms)
AP
D90 (
ms)
APD = T-DI (a) (b)
…
S1 S2
Variable pacing period
(a)
350 400 450 500 550 600 650 700
60
62
64
66
68
Pacing Period (ms)
CV
(cm
/s)
Full glycosylation
Reduced sialylation
Mannose-Rich
N-Glycanase
(b)
360 380
59.560
60.561
61.5
Pacing Period (ms)
CV
(cm
/m)

2.4.4 Conduction Velocity
We measured the conduction velocity (CV) restitutions on 1D cables composing of 1400 cells.
The S1-S2 protocol used is similar to the one in the APD restitution of 1D cable. As shown in
Figure 2-8, we varied the pacing period between S1 and S2 stimulus to investigate the impact on
the CVs. Note that the CVs increase when the pacing period increase, and tend to be the same for
four glycosylation conditions when the pacing period is > 650ms. However, when the pacing
period <650ms, the CVs for full glycosylation are smaller than others. This is because the
refractory period is larger for fully glycosylation condition. Also, when the pacing period is <
370ms, the CVs of reduced sialylation and mannose rich are smaller than the N-Glycanase. The
minimal pacing period (i.e., if smaller than this interval, electrical waves cannot be stimulated) is
350ms, 340ms, 342ms and 338ms respectively for full glycosylation, reduced sialylation, mannose
rich and N-Glycanase.
2.4.5 Reduced Glycosylation Affects 𝐼𝐾𝑟 Magnitudes, APDs at Different Pacing Rates, and APD
Restitution in A Cardiac Cable
Figure 2-9 shows the variations of 𝐼𝐾𝑟 currents (peak currents) of four glycosylation conditions
at different pacing rates in a linear cable of cardiac cells. In our experiments, 600 cardiac cells are
connected to form a cell cable. The first cell in the cable is stimulated. The 𝐼𝐾𝑟 for the 200th cell
are collected in the steady state. In order to make sure the stability, computer experimental results
are collected after the first cell is stimulated for at least 20 times. As shown in Figure 2-9, the 𝐼𝐾𝑟
magnitude decreases 30.98%, 26.08%, 17.37% and 32.73% when the pacing period increases from
400ms to 2000ms for full glycosylation, reduced sialylation, mannose rich and N-Glycanase,
respectively. However, the differences of 𝐼𝐾𝑟 magnitudes are bigger between four glycosylation
conditions for the larger pacing period, i.e., 1000ms-2000ms (see Figure 2-9).

Figure 2-9 The variations of IKr magnitudes (peak currents) in 1D cable with respect to different
pacing periods under the conditions of Full Glycosylation, Reduced Sialylation, Mannose Rich
and N-Glycanase.
Figure 2-10 shows the variations of APDs of four glycosylation conditions, i.e., Full
Glycosylation, Reduced Sialylation, Mannose Rich and N-Glycanase, at different pacing rates in
a linear cable of 600 cells. Similarly to the experiments of 𝐼𝐾𝑟 currents, the first cell in the cable is
stimulated. The APDs for the 200th cell are collected in the steady state (i.e., after the first cell is
stimulated for at least 20 times). Modeling results shows that APD90 increases when the pacing
period increases from 400ms to 2000ms (see Figure 2-10). Note that APD90 differences decrease
among 3 reduced glycosylation conditions when the pacing period increases. However, if we
compare reduced glycosylation with full glycosylation, the effect to shorten the APD90 is the same
for different pacing periods (see Figure 2-10). It may also be noted that the APD90 differences
among 3 reduced glycosylation conditions vanish when the pacing periods is greater than 1500ms.
500 1000 1500 2000
0.45
0.5
0.55
0.6
0.65
0.7
0.75
Period (ms)
IKr
(pA
/pF
)

Figure 2-10 The variations of APDs in 1D cable with respect to different pacing periods under the
conditions of Full Glycosylation, Reduced Sialylation, Mannose Rich and N-Glycanase.
We also measured APD restitution 𝐴𝑃𝐷𝑛+1 = 𝑓(𝐷𝐼𝑛) for a linear cable of 600 cells with the
S1-S2 restitution protocol (see details in Section 2.3, computer experiments). Note that the
experiments of APD restitution not only quantify the effects of glycosylation on the minimal
diastolic interval (DI), but also potentially indicate the stability of spiral waves. In other words,
the slope of APD restitution curve provides potential information on the alternans or breakups of
spiral waves [28]. In our experiment, S1 stimulus is applied in the first cell for 20 cycles at the
basic cycle length (BCL) of 1000ms to reach the steady state. The APD90 restitution curve for the
200th cell is collected. As shown in Figure 2-11, the APD increase with DI. The slope of APD
restitution curve are greater than or equal to 1 (i.e., 𝑑𝑓/𝑑(𝐷𝐼) ≥ 1 ) for four glycosylation
conditions. This indicates that reduced glycosylation does not increase the probability of spiral
wave breakups. In addition, the minimal DIs that elicit a propagating action potential are 99.02ms,
500 1000 1500 2000
260
270
280
290
300
310
320
330
Period (ms)
AP
D90 (
ms)
Full Glycosylation
Reduced Sialylation
Mannose Rich
N-Glycanase

99.44ms, 99.58ms and 99.40ms for full glycosylation, reduced sialylation, mannose rich and N-
Glycanase, respectively. Note that the minimal DI in tissues is often larger than a single cell
because of the effects of cell coupling and electrical conduction.
Figure 2-11 The action potential duration (APD) restitution curve of a 1D cable.
2.5 Conclusions
In the pharmaceutical industry, in-vitro and in-vivo experiments are widely used to characterize
and quantify the drug effects on biological systems. However, there are often many practical and
ethical limitations in physical experiments of animal or human subjects. Also, it is very expensive
and difficult to comprehensively conduct physical experiments across biological scales, e.g., from
ion channels to cells to tissues. In-silico models allow one to overcome these limitations, discover
gaps in the in-vivo data, derive new hypotheses and/or suggest new experimental designs.
100 200 300 400 500 600 700
240
260
280
300
320
D I (ms)
AP
D90 (
ms)
Full Glycosylation
Reduced Sialylation
Mannose Rich
N-Glycanase

Figure 2-16 Markov state occupancy under the conditions of Full glycosylation, Reduced
Sialylation, Mannose-rich and N-Glycanase
Although computer models have long been intertwined with physical experiments in cardiac
research, no approach to date has integrated the understanding of cardiac function in variable levels
of glycosylation across the physical scales of increasing complexity, from molecules to cells to
tissues. Note that cardiac ion channels are heavily glycosylated, and slight changes in the glycan
structure can possibly impact the gating behaviors of ion channels. This study made one of the first
attempts to integrate glycosylation-channel data from in-vitro experiments with in-silico models
to investigate how aberrant glycosylation modulates hERG ion channels and, as a result, cardiac
electrical signaling across different organization levels, from molecule to cell to tissues.

Currently, little data is available about how reduced glycosylation will impact the gating of
hERG channels [26]. In this present investigation, it is shown that reduced glycosylation, i.e.,
reduced sialylation, mannose-rich and N-Glycanase, shifts the steady-state activation and
inactivation of hERG channels towards more positive potentials. These measured changes were
integrated with in-silico models to predict glycosylation modulation dynamics on cardiac cells and
tissues. The results of computer experiments show that reduced glycosylation increases the 𝐼𝐾𝑟
magnitudes and shortens the APD. These glycosylation-induced changes are consistent over a
range of pacing rates from 0.5 Hz to 2Hz, but they are less pronounced for faster rates. Also, the
APD restitution indicates that reduced glycosylation does not increase the probability of spiral
wave breakups. Further, the abruptions in inhomogeneous cable experiments show that reduced
glycosylation affects the AP repolarization and shortens the wavelength in 1D cable. It may be
noted that N-Glycanase has the most significant effect on cardiac repolarization and electrical
propagations. Moreover, 3-lead ECGs derived from rectilinear waves and spiral waves in 2D
tissues demonstrate that reduced hERG channel glycosylation narrows the width of waves,
shortens the QT interval, and speeds up the reentry.
Because QT intervals are closely related to ventricular repolarization and hERG ion channel
gating, a better understanding of glycosylation modulation dynamics in hERG ion channels can
suggest a possible new mechanism to control QT intervals in ECG signals. As a result, new
"rescue" therapies can be developed by imposing a glycan-dependent change in channel function
that counterbalances the dysfunction due to diseases such as long QT syndrome. Our future studies
will be dedicated to a continued understanding of how regulated and aberrant glycosylation
impacts cardiac function using in-vitro and in-vivo experiments as well as in-silico simulations as
tools to test this novel mechanism for the control of cardiac electrical signaling.

2.6 References
[1] A. R. Ednie and E. S. Bennett, "Modulation of voltage-gated ion channels by sialylation," in
Comprehensive Physiology, John Wiley & Sons, Inc., 2012, pp. 1269-1301.
[2] T. A. Schwetz, S. A. Norring, A. R. Ednie and E. S. Bennett, "Sialic acids attached to O-
glycans modulate voltage-gated potassium channel gating." Journal of Biological Chemistry,
vol. 286, pp. 4123-4132, 2011.
[3] M. L. Montpetit, P. J. Stocker, T. A. Schwetz, J. M. Harper, S. A. Norring, L. Schaffer, S. J.
North, J. Jang-Lee, T. Gilmartin, S. R. Head, S. M. Haslam, A. Dell, J. D. Marth and E. S.
Bennett, "Regulated and aberrant glycosylation modulate cardiac electrical signaling," Proc
Natl Acad Sci USA, vol. 106, pp. 16517-16522, 2009.
[4] P. J. Stocker and E. S. Bennett, "Differential Sialylation Modulates Voltage-gated Na+
Channel Gating throughout the Developing Myocardium," The Journal of General
Physiology, vol. 127, pp. 253-265, March 01, 2006.
[5] I. Watanabe, J. Zhu, J. J. Sutachan, A. Gottschalk, E. Recio-Pinto and W. B. Thornhill, "The
glycosylation state of Kv1.2 potassium channels affects trafficking, gating, and simulated
action potentials," Brain Research, vol. 1144, pp. 18, 2007.
[6] C. A. Ufret-Vincenty, D. J. Baro and L. F. Santana, "Differential contribution of sialic acid to
the function of repolarizing K+ currents in ventricular myocytes," American Journal of
Physiology - Cell Physiology, vol. 281, pp. C464-C474, August 01, 2001.
[7] Y. Zhang, H. A. Hartmann and J. Satin, "Glycosylation influences voltage-dependent gating
of cardiac and skeletal muscle sodium Channels." Journal of Membrane Biology, vol. 171,
pp. 195-207, 1999.
[8] H. H. Freeze, "Genetic defects in the human glycome," Nat. Rev. Genet., vol. 7, pp. 537-551,
2006.
[9] J. Jaeken, "Congenital disorders of glycosylation (CDG): Update and new developments," J.
Inherit. Metab. Dis., vol. 27, pp. 423-426, 2004.
[10] M. C. Sanguinetti and M. Tristani-Firouzi, "hERG potassium channels and cardiac
arrhythmia," Nature, vol. 400, pp. 463-469, 2006.
[11] H. Morita, J. Wu and D. P. Zipes, "The QT syndromes: long and short," The Lancet, vol. 372,
pp. 750-763, 2008.
[12] R. H. Clayton, O. Bernus, E. M. Cherry, H. Dierckx, F. H. Fenton, L. Mirabella, A. V.
Panfilov, F. B. Sachse, G. Seemann and H. Zhang, "Models of cardiac tissue
electrophysiology: Progress, challenges and open questions," Progress in Biophysics and
Molecular Biology, vol. 104, pp. 22-48, 2011.
[13] M. Fink, S. A. Niederer, E. M. Cherry, F. H. Fenton, J. T. Koivumäki, G. Seemann, R. Thul,
H. Zhang, F. B. Sachse, D. Beard, E. J. Crampin and N. P. Smith, "Cardiac cell modeling:
Observations from the heart of the cardiac physiome project," Progress in Biophysics and
Molecular Biology, vol. 104, pp. 2-21, 2011.
[14] S. Wang, S. Liu, M. J. Morales, H. C. Strauss and R. L. Rasmusson, "A quantitative analysis
of the activation and inactivation kinetics of HERG expressed in Xenopus oocytes." The
Journal of Physiology, vol. 502, pp. 45-60, July 01, 1997.
[15] C. E. Clancy and Y. Rudy, "Cellular consequences of HERG mutations in the long QT
syndrome: precursors to sudden cardiac death," Cardiovascular Research, vol. 50, pp. 301-
313, May 01, 2001.
[16] R. Mazhari, J. L. Greenstein, R. L. Winslow, E. Marbán and H. B. Nuss, "Molecular
Interactions Between Two Long-QT Syndrome Gene Products, HERG and KCNE2,
Rationalized by In Vitro and In Silico Analysis," Circulation Research, vol. 89, pp. 33-38,
July 06, 2001.
[17] C. S. Oehmen, W. R. Giles and S. S. Demir, "Mathematical Model of the Rapidly Activating
Delayed Rectifier Potassium Current IKr in Rabbit Sinoatrial Node," J. Cardiovasc.
Electrophysiol., vol. 13, pp. 1131-1140, 2002.
[18] G. C. Bett, Q. Zhou and R. L. Rasmusson, "Models of HERG Gating," Biophys. J., vol. 101,
pp. 631-642, 8/3, 2011.
[19] L. Priebe and D. J. Beuckelmann, "Simulation Study of Cellular Electric Properties in Heart
Failure," Circulation Research, vol. 82, pp. 1206-1223, June 15, 1998.
[20] K. H. W. J. Ten Tusscher, D. Noble, P. J. Noble and A. V. Panfilov, "A model for human
ventricular tissue," Am J Physiol Heart Circ Physiol, vol. 286, pp. 1573-1589, 2004.
[21] K. H. W. J. Ten Tusscher and A. V. Panfilov, "Alternans and spiral breakup in a human
ventricular tissue model," Am J Physiol Heart Circ Physiol, vol. 291, pp. H1088-H1100,
September 01, 2006.
[22] V. Iyer, R. Mazhari and R. L. Winslow, "A Computational Model of the Human Left-
Ventricular Epicardial Myocyte," Biophys. J., vol. 87, pp. 1507-1525, 9, 2004.
[23] E. Grandi, F. S. Pasqualini and D. M. Bers, "A novel computational model of the human
ventricular action potential and Ca transient," J. Mol. Cell. Cardiol., vol. 48, pp. 112-121, 1,
2010.
[24] T. O'Hara, L. Virág, A. Varró and Y. Rudy, "Simulation of the undiseased human cardiac
cardiac ventricular action potential: model formulation and experimental validation," PLoS
Computational Biology, vol. 7, pp. e1002061, 2011.
[25] J. Malmivuo and R. Plonsey, Bioelectromagnetism:Principles and Applications of
Bioelectric and Biomagnetic Fields. New York Oxford: Oxford University Press, 1995.

[26] S. A. Norring, A. R. Ednie, T. A. Schwetz, D. Du, H. Yang and E. S. Bennett, "Channel
Sialic Acids Limit hERG Channel Activity During the Ventricular Action Potential," The
FASEB Journal, vol. 27, pp. 622-631, 2013.
[27] D. Du, H. Yang, S. A. Norring and E. S. Bennett, "Multi-scale modeling of glycosylation
modulation dynamics in cardiac electrical signaling," in Engineering in Medicine and
Biology Society,EMBC, 2011 Annual International Conference of the IEEE, 2011, pp. 104-
107.
[28] R. H. Byrd, J. C. Gilbert and J. Nocedal, "A trust region method based on interior point
techniques for nonlinear programming," Math. Program., vol. 89, pp. 149-185, 11/01, 2000.
[29] F. Xie, Z. Qu, A. Garfinkel and J. N. Weiss, "Electrical refractory period restitution and
spiral wave reentry in simulated cardiac tissue," Am J Physiol Heart Circ Physiol, vol. 283,
pp. 448-460, 2002.
[30] A. R. Ednie, K. K. Horton, J. Wu and E. S. Bennett, "Expression of the sialyltransferase,
ST3Gal4, impacts cardiac voltage-gated sodium channel activity, refractory period and
ventricular conduction," J Mol Cell Cardiol, vol. 59, pp. 117-127, 2013.
[31] J. N. Weiss, P. S. Chen, Z. Qu, H. S. Karagueuzian and A. Garfinkel, "Ventricular
Fibrillation : How Do We Stop the Waves From Breaking?" Circulation Research, vol. 87,
pp. 1103-1107, December 08, 2000.
[32] D. Du, H. Yang, S. Norring and E. Bennett, "In-Silico Modeling of Glycosylation
Modulation Dynamics in hERG Ion Channels and Cardiac Electrical Signals," IEEE Journal
of Biomedical and Health Informatics, vol. 18, pp. 205-214, 2013.


![Coordinate Regulation of Metabolite Glycosylation and · Coordinate Regulation of Metabolite Glycosylation and StressHormoneBiosynthesisbyTT8inArabidopsis1[OPEN] Amit Rai2,3, Shivshankar](https://img.pdfslide.net/doc/110x75/60342c778ae2d32d91662064/coordinate-regulation-of-metabolite-glycosylation-coordinate-regulation-of-metabolite.jpg)