Embed Size (px)
Citation preview

COMPUTER SCIENCE
IMPAIRED COGNITIVE FLEXIBILITY AND INTACT COGNITIVE CONTROL IN
AUTISM: A COMPUTATIONAL COGNITIVE NEUROSCIENCE APPROACH
TRENTON E. KRIETE
Thesis under the direction of Professor David C. Noelle
In people with autism, the ability to enact a behavior in the presence of competing
responses appears intact, while the ability to fluently adapt cognitive control in the face
of changing task contingencies is impaired. In this paper, the Cross-Task Generalization
model (Rougier et al., in press), which offers a formal account of the effect of dopamine
on frontal cortex function, is used to capture performance of both normally function-
ing individuals and people with autism on a classic test of cognitive control, the Stroop
task (Stroop, 1935), and one of cognitive flexibility, the Wisconsin Card Sort Test (Berg,
1948). By weakening the effect of the dopamine signal on frontal cortex, the model fits
quantitative and qualitative results of autistic performance on these tasks and demonstrates
the potential usefulness of computational cognitive neuroscience approaches in autism re-
search.
Approved Date

IMPAIRED COGNITIVE FLEXIBILITY AND INTACT COGNITIVE CONTROL IN
AUTISM: A COMPUTATIONAL COGNITIVE NEUROSCIENCE APPROACH
By
Trenton E. Kriete
Thesis
Submitted to the Faculty of the
Graduate School of Vanderbilt University
in partial fulfillment of the requirements
for the degree of
MASTER OF SCIENCE
in
Computer Science
May, 2005
Nashville, Tennessee
Approved:
Professor: David C. Noelle
Professor: Robert E. Bodenheimer

ACKNOWLEDGMENTS
I would like to extend thanks first and foremost to my mentor and advisor Dr. David
Noelle, for sharing his advice and knowledge throughout this beginning of my graduate
school career, and for leading by example. I would also like to thank Dr. Wendy Stone for
her help and for offering resources from the TRIAD (The Treatment and Research Institute
for Autism Spectrum Disorders) to help further my research. My gratitude is also shared
with all of the members of Computational Cognitive Neuroscience Laboratory.
Finally, my parents for their unwavering support for me and all of my crazy adventures.
ii

TABLE OF CONTENTS
Page
ACKNOWLEDGMENTS . . . . . . . . . . . . . . . . . . . . . . . . . . . . . . . . ii
LIST OF TABLES . . . . . . . . . . . . . . . . . . . . . . . . . . . . . . . . . . . v
LIST OF FIGURES . . . . . . . . . . . . . . . . . . . . . . . . . . . . . . . . . . . vi
Chapter
I. INTRODUCTION . . . . . . . . . . . . . . . . . . . . . . . . . . . . . . 1
II. BACKGROUND . . . . . . . . . . . . . . . . . . . . . . . . . . . . . . . 6
Psychological Frameworks . . . . . . . . . . . . . . . . . . . . . . . . 6Neuroscientific Frameworks . . . . . . . . . . . . . . . . . . . . . . . 9Computational Approaches . . . . . . . . . . . . . . . . . . . . . . . . 11Cognitive Flexibility and Control in ASD . . . . . . . . . . . . . . . . 18Dopamine & Temporal Difference Learning . . . . . . . . . . . . . . . 22Computational Models of PFC . . . . . . . . . . . . . . . . . . . . . . 23The Cross-Task Generalization Model (XT) . . . . . . . . . . . . . . . 26
III. METHODS . . . . . . . . . . . . . . . . . . . . . . . . . . . . . . . . . . 31
Simple XT Model . . . . . . . . . . . . . . . . . . . . . . . . . . . . 33Basic Mechanisms . . . . . . . . . . . . . . . . . . . . . . . . . . . . 33Modeling WCST . . . . . . . . . . . . . . . . . . . . . . . . . . . . . 35Modeling Stroop . . . . . . . . . . . . . . . . . . . . . . . . . . . . . 37Network Training . . . . . . . . . . . . . . . . . . . . . . . . . . . . . 39
IV. RESULTS . . . . . . . . . . . . . . . . . . . . . . . . . . . . . . . . . . . 40
Simple Model Stroop Results . . . . . . . . . . . . . . . . . . . . . . 40Simple Model WCST Results . . . . . . . . . . . . . . . . . . . . . . 41XT Model Stroop Results . . . . . . . . . . . . . . . . . . . . . . . . 42XT Model WCST Results . . . . . . . . . . . . . . . . . . . . . . . . 43DA Sensitivity . . . . . . . . . . . . . . . . . . . . . . . . . . . . . . 45
V. DISCUSSION & FUTURE WORK . . . . . . . . . . . . . . . . . . . . . 50
iii

Appendix
A. LEABRA MODEL EQUATIONS . . . . . . . . . . . . . . . . . . . . . . 54
Activation Function . . . . . . . . . . . . . . . . . . . . . . . . . . . . 54Inhibition and Competition . . . . . . . . . . . . . . . . . . . . . . . . 56Weight Update Equations (Learning) . . . . . . . . . . . . . . . . . . 56Temporal Difference Learning and Adaptive Gating of PFC . . . . . . 57
B. NAV: NODE ACTIVITY VISUALIZER . . . . . . . . . . . . . . . . . . 60
Introduction . . . . . . . . . . . . . . . . . . . . . . . . . . . . . . . . 60Features . . . . . . . . . . . . . . . . . . . . . . . . . . . . . . . . . . 61User Evaluations . . . . . . . . . . . . . . . . . . . . . . . . . . . . . 62Conclusion . . . . . . . . . . . . . . . . . . . . . . . . . . . . . . . . 66
BIBLIOGRAPHY . . . . . . . . . . . . . . . . . . . . . . . . . . . . . . . . . . . . 67
iv

LIST OF TABLES
Table Page
1. WCST Simple Model Results . . . . . . . . . . . . . . . . . . . . . . . 42
2. WCST Full Model Results . . . . . . . . . . . . . . . . . . . . . . . . . 45
v

LIST OF FIGURES
Figure Page
1. WCST example stimuli varying feature values across three dimensions:Color, Quantity, and Shape . . . . . . . . . . . . . . . . . . . . . . . . . 20
2. Stroop example stimuli . . . . . . . . . . . . . . . . . . . . . . . . . . . 20
3. Firing rates of midbrain dopamine neurons of the basal ganglia duringclassical conditioning (Adapted from (Shultz et al., 1997)) . . . . . . . . 24
4. A still image of an animation of a simple computational model of therole of PFC in the Stroop task (Cohen et al., 1990) (See Appendix B) . . 26
5. XT Model Architecture . . . . . . . . . . . . . . . . . . . . . . . . . . . 29
6. Stimulus Input Layer: Caricature of input to the XT model, with rowsportraying stimulus dimension (color, shape, size, etc) and columns in-dexing feature values across dimensions (small, medium, large, etc.) . . . 30
7. Simplified XT Model . . . . . . . . . . . . . . . . . . . . . . . . . . . . 34
8. XT WCST example stimulus input . . . . . . . . . . . . . . . . . . . . . 36
9. Simple XT model: Stroop results . . . . . . . . . . . . . . . . . . . . . 41
10. WCST Perseverative Error Results: Previous study from (Minshew et al.,2002) . . . . . . . . . . . . . . . . . . . . . . . . . . . . . . . . . . . . 43
11. Full XT model: Stroop reaction time results, human data from (Dunbarand Macleod, 1984) . . . . . . . . . . . . . . . . . . . . . . . . . . . . 44
12. DA Sensitivity: Stroop Task (Simple XT Model) . . . . . . . . . . . . . 47
13. DA Sensitivity: Stroop Task (Full XT Model) . . . . . . . . . . . . . . . 47
14. DA Sensitivity : WCST Total Errors . . . . . . . . . . . . . . . . . . . . 48
15. DA Sensitivity : WCST Perseverative Errors . . . . . . . . . . . . . . . 48
16. DA Sensitivity : WCST Categories Achieved . . . . . . . . . . . . . . . 49
17. The main NAV window displaying an animation of a component of thespreading activation based memory network of an ACT-R model. . . . . 63
vi

18. Novice user evaluation results, broken down by topic area. Each ratingis on a five point Likert scale, ranging from “Difficult” (1) to “Easy” (5).Error bars display standard errors of the mean. . . . . . . . . . . . . . . 64
vii
CHAPTER I
INTRODUCTION
The methods and tools a researcher employs when searching for explanations of any
particular phenomena naturally will depend on each individual researcher’s area of exper-
tise. As an example consider when a cognitive psychologist and a cognitive neuroscientist
are separately investigating a particular (but identical) aspect of human behavior. The psy-
chologist may use their in-depth knowledge of patterns of human behavior, existing theories
of psychological processes, and psychophysical measures such as reaction times on specific
experimental tasks in order to explain the phenomena of interest. The cognitive neurosci-
entist, on the other hand, would likely use a more “bottom up” strategy, looking for specific
neural mechanisms responsible for the observed behavior. Correlational techniques such
as functional neuroimaging (e.g., FMRI and PET), lesion studies such as those employed
in neuropsychology, and electrophysiological studies in mainly non-human primates, are
commonly employed tools of the cognitive neuroscientist. Both the cognitive psychologist
and the cognitive neuroscientist are seeking to explain the same basic phenomena, namely
the processes that give rise to some aspect of human behavior. Intuitively, the data gath-
ered and the theories formed from these somewhat disparate, but still overlapping, domains
could be used both to inform and to constrain one another. However, this is not always
found in practice. It is common for psychological theories to brush aside the issue of
the precise neural implementation of the phenomena of interest, concentrating instead on
the more abstract psychological processes and their relation to the behavior. Conversely,
neuroscientific theories have tended to concentrate on the biophysical properties of neural
systems, not reaching all of the way up to the full complexities of behavior. When the
neuroscientific theories do attempt to account for behavior, a correlational rather than a
mechanistic explanation is typically offered (e.g., FRMI studies where neural activity dur-
ing a behavioral task is correlated with the observed behavior). A conceptual bridge needs
1

to be constructed to facilitate intertheoretic reductions across these disciplines, resulting in
explanations that capture the observations and data from both domains using a common
language.
A telling example can be found in analyzing the neurological developmental disorder
known as autism. Autism was first described by Dr. Leo Kanner in 1943 when he reported
on 11 children with severe social and communication deficits, along with a strong interest
with unusual aspects of the inanimate environment (Kanner, 1943). Kanner described these
children as having “early infantile autism”, where autism was originally used to describe
a particular aspect of behavior in schizophrenia, namely the withdrawal of oneself from
the social aspects of life or a “escape from reality” (Bleuler, 1950). At almost the exact
same time, Hans Asperger independently made very similar discoveries in his patients, but
Asperger’s patients lacked the language difficulties found in Kanner’s patients (Asperger,
1991). The fluent use of language along with characteristic social difficulties has been
used to demarcate this disorder, known as Asperger’s syndrome, from autism. Autism and
Asperger’s are two of five disorders which comprise a set of disorders known as autism
spectrum disorders (ASD)1. Autism spectrum disorders are pervasive developmental dis-
orders with a prevalence estimated at 1 in 166 live births according the Center for Disease
Control (2004). ASD is characterized by severe social deficits, problems in both verbal and
non-verbal communications, motor skill deficiencies, disruptive stereotypic movements,
and occasionally self-injurious behavior. Genetic factors are evident in the disorder, shown
through inheritibility as well the fact that 4 out of 5 people with autism are male. There has
been steady progress in the early identification of the behavioral characteristics of the dis-
order, as well as early intervention techniques, but no consensus has been reached concern-
ing the neural basis of ASD. People with autism are impaired across a range of cognitive
tasks, including planning (Bennetto et al., 1996), theory of mind tasks (Baron-Cohen et al.,
1985), and tasks requiring spontaneous generation of novel behaviors and ideas (Turner,
1Other disorders included in ASD are Rett syndrome, Childhood Disintegrative Disorder (CDD), andpervasive developmental disorder not otherwise specified (PDD-NOS).
2
1999). Interestingly, people with autism show spared and relatively robust cognitive per-
formance across a variety of tasks. These include, but are not limited to, tasks believed
to test inhibition (Ozonoff and Strayer, 1997; Russell et al., 1999) as well as visuospatial
abilities (Shah and Frith, 1983). A particularly perplexing aspect of the cognitive profile
demonstrated by people with autism is that cognitive flexibility has been shown to be im-
paired in experimental tasks such as the Wisconsin Card Sort Test (WCST) (Berg, 1948)
showing a significant increase in perseverative performance, while cognitive control, as
measured by tests such as the classic Stroop paradigm (Stroop, 1935), remains robust and
relatively unaffected (Ozonoff and Jensen, 1999). Stroop is a classic measure of cognitive
control and the ability to inhibit a prepotent response, in which the stimuli are text of dif-
ferent color words, presented in various colored fonts. The participants are asked to either
read the word or to name the color of the font in which the text is presented. WCST is
used as a measure of cognitive flexibility. During this task participants are asked to sort
cards, which contain stimuli varying along three dimensions (e.g., color, shape, quantity)
and across four different features per dimension (e.g., for color dimension: red, blue, green,
& yellow) into four piles based only on sparse feedback —correct or incorrect—. After the
sorting strategy (e.g., sort according to the color of the stimuli) is deduced and a specific
performance criterion is met, the sorting criterion is changed making the previous rule in-
correct. The number of incorrect sorts in which the participant continues to employ the
previously correct sorting strategy are termed “perseverative errors”, and are the key mea-
sure of cognitive flexibility in WCST2. Cognitive control describes our ability to enact a
behavior in the presence of a distracting or more automatic competing response. Cognitive
flexibility can be described as our ability to fluently adjust cognitive control as task contin-
gencies change. This dichotomous performance is difficult to explain using conventional
accounts of the neural basis of cognitive control. Traditionally, deficits in cognitive con-
trol and cognitive flexibility have been attributed to problems in frontal areas of the brain,
2For a detailed account of WCST and Stroop please see the “Cognitive Flexibility and Control in ASD”section of chapter II - Background
3

namely the prefrontal cortex (PFC). Task performance on these tasks in populations with
frontal dysfunction have shown either across-the-board deficits, as seen in frontally dam-
aged patients (Stuss et al., 2000; Stuss et al., 2001), or only impaired cognitive control as
seen in people with ADHD (Ozonoff and Jensen, 1999), but not both retained cognitive
control and impaired cognitive flexibility as found in ASD. Capturing this dichotomy is a
considerable challenge for any theoretical account whose goal is explaining autistic behav-
ior. Ideally, the vast collection of behavioral observations and theories in the current ASD
literature should help constrain and inform the search for the neural underpinnings of the
disorder, and a precise characterization of the neural mechanisms implicated would also
assist in validating psychological theories.
A potentially valuable and novel approach to autism research involves leveraging the
tools of computational cognitive neuroscience to help formalize how neural mechanisms
could be responsible for the pattern of behavior found in people with autism. Compu-
tational models of cognition force the researcher to be explicit in the assumptions made,
as well as the mechanisms employed, during scientific conjecture. The formal nature of
these models allow us to form precise and testable hypothesis concerning the mechanisms
responsible for the phenomena of interest. By incorporating explicit mechanistic charac-
terizations of the underlying neurobiology, while reaching up and attempting to capture
actual behavioral patterns, computational cognitive neuroscience models provide a means
of bridging the conceptual valley between cognitive psychology and cognitive neuroscience
in the domain of ASD research. While computational modeling has not been widely em-
ployed in the study of ASD, there have been some investigators who have tried to leverage
modeling techniques in hopes of formalizing an account of the disorder (Cohen, 1994;
McClelland, 2000; O’Loughlin and Thagard, 2000; Gustafsson, 1997). These models,
however, have suffered from various shortcomings, namely either not incorporating pre-
cise neural mechanisms in their models (e.g., being too abstract) or not providing a tight
4

quantitative fit to behavioral data, instead relying on more qualitative results to justify their
hypothesis.
The Cross-Task (XT) Generalization model (Rougier et al., in press) is a model of cog-
nitive control and flexibility inspired by, and implemented using, contemporary accounts
of the role of dopamine (DA) in PFC function. XT is the first model which has been used
to, quantitatively and qualitatively, capture performance of both normal functioning and
frontally damaged individuals, on the Wisconsin Card Sort Test and Stroop. Importantly,
XT learns proper frontal representations through extended experience and interactions with
the environment. This is unique in comparison to previous models of cognitive control
where these representations existed a priori, built into the structure of the model by the de-
signer from the beginning. Using the XT framework, we investigate whether reducing the
effect of DA on frontal functioning is sufficient to capture the perplexing behavioral profile
exhibited by people with autism, capturing the impaired cognitive flexibility demonstrated
by an increase in the number of perseverative errors on the WCST, while leaving perfor-
mance on the Stroop task unaffected, signaling a lack of effect on cognitive control. Our
modeling approach differs from previous models in the explicit mechanisms being em-
ployed and investigated, the precise fit to behavioral data, and the potential to use XT to
analyze and make predictions about the possible developmental trajectory of cognitive con-
trol mechanisms in ASD. This hypothesis suggests that “executive dysfunction” symptoms
in autism may be mediated by PFC / DA interactions, and provides an example of how
computational models can serve as a lingua franca between seemingly disparate research
domains.
5

CHAPTER II
BACKGROUND
Psychological Frameworks
Three main cognitive theories have been proposed for understanding behavioral symp-
toms in autism: theory of mind, weak central coherence, and executive dysfunction. These
theories are usually not considered to be competing ideas, but, instead, each theory can be
viewed as trying to capture a specific aspect of behavior in autism (Frith and Hill, 2003).
Theory of Mind
The “theory of mind” (TOM) (Baron-Cohen et al., 1985) hypothesis suggests that the
understanding of mental states and the ability to attribute these mental states to oneself, as
well as to others, is impaired in people with autism. “Mental states” are used here to refer
to things such as our “beliefs” “desires” and “intentions” The ability to interpret other’s
mental states, as well as predict their behavior from these interpretations, is believed to
be important for engaging in effective social communication. The absence of this ability
in people with ASD is hypothesized to be at the core of their social difficulties. The pro-
totypical task used to evaluate TOM is the false-belief or “Sally-Anne” task. During the
task, two dolls are presented to the child with one doll (Sally) placing a marble inside of
a basket, Sally then proceeds to leave the area. While Sally is gone, Anne moves the mar-
ble from the basket to a nearby box. When Sally returns the child is asked, “Where will
Sally look for her marble?”. Normally developing children as young as 4 years old easily
succeed at this task, realizing that Sally did not see Anne move the marble and will look
in the place where it was left. However, in a study by Baren-Cohen et al. (1985), 80% of
the children with autism, matched to be of a mental age of at least 4 years old, failed at this
task. These children reported that Sally would look for the marble in the box —where the
marble actually was— instead of where it was left by Sally. Functional MRI studies have
6

putatively identified a system of brain areas which may be responsible for TOM (Vogeley
et al., 2001), but no mechanistic account is provided as to how the brain areas identified
in this study give rise to our ability to attribute “mental states” to others. TOM deficits
provide a possible explanation for a large range of the social deficits found in people with
autism, but have little to say about other aspects of the cognitive profile in ASD, such as
attentional abnormalities where children with autism can show an intense focus on parts
of play objects often at the cost of a more functional or conventional ways (Joseph, 1999),
and spared or increased abilities in some domains. The following theory provides a better
account for these observed behavioral patterns.
Weak Central Coherence
Strong coherence can be thought of as a tendency to integrate pieces of information
into a coherent whole. Weak central coherence (WCC) (Happe, 1999; Frith, 1989) can be
described as the opposite of this tendency, where the parts are not abstracted and gathered
into a coherent “gestalt”, but, instead, are left as atomic elements for processing. In Frith’s
account of WCC, it is posited that people with autism exhibit a weak central coherence,
processing the world in a “piecemeal” manner rather than integrating the parts into more
coherent wholes. It is important to note that this can be seen as a difference in processing
styles, rather than a cognitive deficit, per se. This distinction is important because it affords
WCC the ability to account for the spared, or even enhanced, abilities found in ASD, while
still providing an explanation for the differences between normally functioning individuals
and those with autism. This is a major strength of WCC. An example of this unique pro-
cessing style can be found using the embedded figures test (Witkin et al., 1971). The task
involves finding a simple image (e.g., a triangle), embedded within a much more complex
scene (e.g., a farm scene). Performance of people with autism on this task has been shown
to be superior to that of controls (Shah and Frith, 1983). The gestalt or holistic view of
the scene could actually hinder or interfere with the search for the individual item, since
this would entail abstracting information away from the specific parts by definition. Thus,
7
this an example were a “piecemeal” processing style is advantageous. On the other hand,
the ability to disambiguate pronunciation of homographs (words with a single spelling but
multiple possible meanings and pronunciations such as ’bow’ and ’tear’) while reading
a sentence depends on the ability to incorporate the context of the sentence to succeed.
Studies have found that individuals with autism were less likely to pronounce the homo-
graph correctly depending on the context of the sentence when compared to performance
of control subjects (Happe, 1997). WCC’s approach accounts for behavior in autism by
suggesting a different cognitive style rather than a deficit. This fits nicely with differences
found in attentional and visuospatial tasks, and, importantly, makes predictions as to why
there are spared as well as enhanced cognitive abilities observed in people with autism.
Executive Dysfunction
The Executive Dysfunction hypothesis views autism as emerging from a deficit in ex-
ecutive control over behavior (Hughes et al., 1994; Ozonoff et al., 1991). This hypothesis
is used to account for the rigid, inflexible, and perserverative “stuck-in-set” behavior found
in autism (Hill, 2004). Executive functioning is used as an umbrella term for a variety
of deliberate and modulatory processes, such as planning, cognitive control, and cognitive
flexibility. These processes are traditionally associated with frontal neural circuits evi-
denced by deficits in tasks believing to measure executive processing in frontally damaged
patients (Stuss et al., 2000; Stuss et al., 2001). This theory is bolstered by impaired perfor-
mance on many executive function tasks such as those believed to measure planning (e.g.,
Tower of Hanoi (Hughes et al., 1994; Ozonoff and Jensen, 1999)) and cognitive flexibility
(e.g., Wisconsin Card Sort Test (Bennetto et al., 1996)). However, there are unaffected
areas of executive functioning found in people with autism as well. For instance, cogni-
tive control seems to be relatively unaffected, as measured by the classic Stroop task. This
raises into question the general Executive Dysfunction hypothesis as it has traditionally
been cast. It is possible, however, that the executive problems found in ASD are not neces-
sarily due to damage to the PFC, proper, but arise from problems with other brain structures
8

that have connections with, and affect the functioning of, the frontal lobes (Robbins, 1997).
It is just these kinds of questions —whether executive problems can be explained in terms
of the dysfunction of specific neural circuits interacting with PFC— which computational
models are well suited to help us explore.
Neuroscientific Frameworks
The success of these psychological frameworks in explaining many behavioral charac-
teristics of ASD could be solidified if a formal account of the underlying biological mech-
anisms which give rise to observed behavior could be provided. Neuroscientific frame-
works thus far have had little success in providing a unified view of the neural mechanisms
responsible for behavioral symptoms in autism. Indeed, the vast amount of variance in
brain regions implicated as possible underlying neural substrates in ASD makes the task
of identifying a unified neuroscientific account somewhat daunting. Confounding the is-
sue further, data concerning observations in neural structures must rely on causal primacy.
Causal primacy here is used to refer to whether a specific difference in the neural system
is a primary cause of other abnormalities, or if it is an effect of some other neural dys-
function. For instance, many different brain areas can be affected during development by
the dysfunction of a neurotransmitter with diffuse and widespread effects on the brain such
as DA or serotonin. In this case, the multiple brain areas affected and showing impaired
functioning are secondary to the primary neurotransmitter dysfunction. It is unfortunately a
very difficult “chicken and egg” conundrum, requiring difficult and expensive longitudinal
studies to discern how different parts of the autistic brain develop over time. Caveats aside,
there are many neurobiological differences thought to exist in ASD that are worth further
exploration. In the end, all consistent underlying differences in the neurobiology need to
be accounted for as either a primary neural underpinning or as an effect of the actual neural
underpinning(s) of ASD.
The most consistent neuroimaging finding in people with ASD are abnormalities in
9
the structure of the cerebellum (Akshoomoff, 2000). These findings consist of hypopla-
sia (reduced growth) and hyperplasia (increased growth) (Rodier et al., 1996) within the
cerebellar vermis. Dysfunction of the cerebellum accounts for some of the motor difficul-
ties found in people with autism, since the cerebellum is known to be important for motor
control. Researchers are also actively pursuing the possibility of cerebellar influence on
attention and attention shifting (Courchesne, 1987), which might help explain attentional
differences found in autism.
Investigations into measures of brain volume have discovered increased cerebral (white
matter) volumes in people with ASD (Filipek, 1995), which are argued to be due to a
failure in cortical pruning which occurs early in development (Eigsti and Shapiro, 1995).
It is not immediately clear what effect the overgrowth of neural connections would have on
behavior, but some theories suggest that possible effects might include the rigid and context
specific patterns of behavior seen in ASD (Cohen, 1994).
The amygdala has been of interest in autism research due to its suggested role in social
and emotional behavior, both believed to be problematic in autism. Controlled damage to
the amygdala has provided an interesting animal model of autism (Bachevalier, 1994). In
this animal model, selective ablation of the amygdala was performed in rhesus monkey
subjects. The lesioned monkeys displayed repetitive motor behaviors, as well as “autistic-
like” social behaviors such as active social avoidance and lack of eye contact.
Inspired partially by links to executive function deficits in ASD and partly by neu-
roanatomical findings, the PFC is an area of key interest for many ASD researchers. Anatom-
ically, researchers have identified the possibility of “narrow mini-columns” in the PFC (Casanova
et al., 2003) and have noted that the parietal, temporal, and occipital lobes show overall
brain volume enlargements, while the frontal lobes show no such increase. The lack of an
increase means that the frontal lobes may be considered smaller in volume when compared
with the relative scaling of the rest of the brain (Piven et al., 1996). Considering the many
10

executive functioning problems observed in ASD, the PFC stands out as, at a minimum, a
likely indirect player in some of the unusual behavior displayed in autism.
Using techniques such as urinalysis and PET studies, differential amounts of serotonin
and DA have been identified in people with autism (Martineau et al., 1992; Posey and
McDougle, 2000; Chugani, 2004) compared to controls. Neurotransmitters are of particular
interest in the search for the brain basis of autistic behavior since, due to their diffuse global
nature, there is potential for both DA and serotonin to affect multiple brain regions. This
fact is particularly compelling given the heterogeneity found in both the functional and
anatomical properties discovered thus far in the neural systems of people with ASD.
Psychological and neuroscientific theories have the potential to constrain and inform
each other, unifying research concerning the neural basis of autism. However, it is unclear
at this point, given the multiplicity of brain areas implicated in ASD, how best to integrate
the cognitive neuroscience and cognitive psychology of autism.
Computational Approaches
The formal and explicit nature of the tools of computational cognitive modeling pro-
vide a novel method for approaching this problem. In order for computational models to
be useful in this endeavor, they must be constrained by both bottom-up (neurobiological
mechanisms) and by top-down (observed behavior) considerations. It is not at all clear that
the current computational models attempting to provide explanations for the behavior of
people with autism have accomplished these goals. A brief review of existing computa-
tional modeling efforts focusing on the anomalous behaviors found in autism is presented
in this section. Every model reviewed here is concerned with the same basic phenomena
either implicitly or explicitly, namely, the observation that people with autism show stim-
ulus overselectivity and poor generalization. Stimulus overselectivity is the tendency of
people with autism to selectively respond to a limited number of cues in a multiple cue
context (Cushing et al., 1983). Poor generalization in autism is displayed as a difficulty
11

when trying to use similar skills in different situations (e.g., with different people, places,
etc).
The problem with overfitting
Cohen was the first person to publish a neural network model attempting to explain
patterns of behavior in people with ASD (Cohen, 1994). Cohen’s model rests on the notion
that neural networks, when allowed to have too many units or nodes in the hidden layer,
are likely to fall prey to “overfitting” the training data. When training a neural network,
one wishes to capture the true functional form (or at least the best possible approximation)
of the task, as implicitly characterized by the training data. By capturing the form of the
function, the model is able to generalize to inputs that it has not been exposed to in the
past. When “overfitting” occurs, instead of capturing the true underlying functional form,
the model memorizes the specific training data items. This results in precisely correct
performance when the network experiences the training data again, but poor performance
on novel inputs. In other words, overfitting results in poor generalization.
Citing studies noting that many areas of the brain, with a particular focus on the amyg-
dala and hippocampus, have found an overall increase in the number of neurons in people
with autism as compared to controls, Cohen argues that an analog between overfitting in
neural networks and poor generalization and stimulus specificity, as seen in people with
ASD, can be made. Cohen conjectures that since the amygdala is implicated in emotional
and social processing, too many neurons could result in a kind of “overfitting” of socially
relevant stimuli, resulting in unrelated and unimportant features of a social situation being
taken into account when learning appropriate social behavior. The unrelated information
will usually only hinder the ability to act appropriately in the extremely subtle and complex
acts of social interactions, explaining the overall poor social abilities and lack of ability to
generalize to new situations found in people with ASD. A model is provided which demon-
strates that, as the number of hidden layer units increase, the ability of the network to gen-
eralize to new inputs deteriorates. Furthermore, it is argued that the savant-like abilities
12

found in some people with autism can be explained as an overall increase in the number
neurons which are employed in the task. For instance, Cohen suggests that if a person with
autism has an extraordinary ability in a specific modality then, according to his theory, we
should find an increased amount of neurons in the network facilitating the learning of that
modality (e.g., visual) and not in areas used for other modalities (e.g., haptic or auditory).
Cohen’s hypothesis of too many neurons resulting in a type of behavioral “overfitting”
has some intuitive appeal, especially when analyzing how neural networks perform as a
function of the number of processing units. However, the model does not possess any solid
fits to any specific quantitative behavioral data. Instead it relies on a more abstract verbally
justified account of how poor generalization and stimulus overselectivity arises in people
with ASD. Also, links to underlying neurobiological systems are of an almost anecdotal
nature, casually noting that some postmortem studies have found an increased number of
neurons in some areas of the brain in people with autism.
Inadequate cortical feature maps
Gustafsson’s modeling of inadequate cortical feature maps in autism follows in the
footsteps of Cohen’s attempt to explain good discrimination skills (stimulus overselectiv-
ity) and poor generalization skills found in people with ASD (Gustafsson, 1997). In this
endeavor, Gustafsson argues that overly narrow neural columns in people with autism are
at the core of this pattern of behavior. Cortex is believed to be organized in a columnar
manner within which neurons posses similar receptive field properties. In simpler terms,
neurons within a column in cortex tend to respond to the same aspects of a stimulus, re-
sulting in a type of “cortical feature map”. If these neural columns are overly narrow, then
as Gustafsson writes, “feature detection will only be possible if the set of features very
closely corresponds to that which the neural column has become identified with, i.e., there
must not be much variability in features”, and he follows, “an individual with such an inad-
equate feature map must insist on precision or “sameness”. This desire for “sameness” is a
common behavioral feature found in people with ASD. The thrust of the inadequate feature
13

map hypothesis is that narrower neural columns in cortex will have narrower receptive field
properties (responsive to a smaller than normal range of stimuli) and therefore exhibit good
discrimination but poor generalization.
The artificial neural network discussed in Gustafsson’s 1997 article is based on net-
works developed by Kohonen (Kohonen, 1984), which include excitatory and inhibitory
lateral feedback connections in a neighborhood like structure. This means that units within
a certain distance of each other will contain mutually excitatory connections, while outside
of this of this distance the connections to other units will be inhibitory (von der Malsburg,
1973). This relationship results in a topological structure developing in the models, with
columnar like groupings of units which respond in a similar manner to stimulus features.
An important property of these networks is that the Kohonen map learns its fundamental
properties through extensive exposure to stimuli. No set structure for stimulus representa-
tion is assumed to exist a priori. This property allows for the possibility that inadequate
feature maps will arise somewhat naturally during development, simply by manipulating a
single parameter in the model. Gustafsson proceeds to provide a mathematical proof, based
on previous findings (Kohonen, 1984), that as you increase the overall lateral inhibition, the
columns in the Kohonen maps become narrower and respond to a smaller set of stimulus
features. In other words, they develop smaller receptive fields.
Unlike the previous models, Gustafsson’s model makes strong contact with underlying
biological mechanisms. However, considering the high comorbidity of seizures in the dis-
order it is unclear whether excessive lateral inhibition is justified (Casanova et al., 2003).
It is difficult to analyze the performance of the model, as no actual model simulation re-
sults were presented. Therefore, the same critique of Cohen’s work holds for Gustafsson’s
model: there is no evidence that the model will be able to provide a tight quantifiable fit to
actual behavioral data.
14
Weak Central Coherence as constraint satisfaction
O’Loughlin and Thagard provide a computational modeling account of Frith’s theory
of weak central coherence (Frith, 1989) by simulating coherence using a constraint satis-
faction network (O’Loughlin and Thagard, 2000). A constraint satisfaction problem can be
roughly described as follows: Given a set of possible states of the world, of which some
states may be less likely to coincide simultaneously with others (e.g., it is not likely to
be outside while it is raining, and not get wet), what set of states maximally satisfy all
possible constraints? A constraint satisfaction network embodies a constraint satisfaction
problem where the different aspects of possible states of the world are specified as nodes in
the networks, and the constraints between these states are embodied in the weights or the
values of the connections between these nodes. For an exclusivity constraint between two
different states (representing the concept that the two states are not likely to occur together,
e.g., eating and being asleep at the same time), a negative weight value is used, and for a
co-occurence constraint (representing when the two states are likely to occur together, e.g.,
being thirsty and drinking water) a positive weight value is used. “Normal” coherence is
taken to be the network functioning in the standard manner, maximally choosing the states
which satisfy the most constraints. WCC is simulated as pushing the network to settle in a
sub-optimal set of states, which will not maximally satisfy the constraints.
To make this more clear, it is helpful to consider the simulation provided by O’Loughlin
and Thagard using the Sally-Anne task (Baron-Cohen et al., 1985). To simulate this task,
the nodes of the network are coded to represent possible states in the task such as “Sally puts
marble in basket” and “Anne transfers marble to box while Sally is away”, with positive
connections (positive constraint) between the states, and negative connections (negative
constraints) between nodes such as “Sally look in basket” and ”Sally look in box”. The
different states and constraints between them represent a kind of “knowledge network” of
the Sally-Anne task. If the constraints are set up properly, the network will settle on the
correct hypothesis, that “Sally will look in the basket”.
15

In order to simulate WCC as seen in children with autism, the negative constraints
(connections) were increased, making the inhibitory connections stronger than the excita-
tory connections. This manipulation results in the network settling prematurely, and most
likely in a state that did not satisfy all of the constraints in the network. In the simulation of
the Sally-Anne task, the solution resulting in the incorrect choice of “Sally look in box” is
essentially shorter than the correct, but unfortunately more causally complex, choice “Sally
look in basket”. This allows the increased inhibition to result in the network guessing in-
correctly, “Sally will look in the box”, since when the network has finished the settling
process, it will satisfy the most constraints in the constraint satisfaction network.
The modeling approach used is extremely abstract in nature, with all the knowledge of
how the problem is to be solved pre-specified within the structure of the network (i.e., the
nodes and the constraints between them). It is unclear whether the mechanism employed
to simulate performance of people with autism on the Sally-Anne task, namely increased
inhibition in the network, can be biologically supported, considering, once again, the high
comorbidity of seizures in the disorder (Casanova et al., 2003) as well as lack of any other
justification from the authors. While the model is used to capture qualitative behavioral
performance on the Sally-Anne task (as well as an example of a homograph task using the
same approach), it is unclear how the model would fair at capturing quantitative behavioral
data on these tasks.
Hyperspecificity
McClelland takes a slightly different approach to the same issues of poor generalization
and stimulus overselectivity (or hyperspecificity) addressed by the models previously men-
tioned (McClelland, 2000). Instead of providing a model, or even a description of a model,
McClelland provides a general description of properties of neural networks which could
give rise to hyperspecificity at the cost of the ability to generalize. Conjunctive codes in
neural networks are representations that consist of components that, instead of responding
to individual features of input (e.g., either “red” or “square”), only respond to conjunctions
16

of the input features (e.g., “red square”). As the number of conjunctions required to acti-
vate a processing unit increases, the more specific the representation becomes (e.g., only
responding to small green circles with radial lines, etc). Conjunctive representations are
useful when the stimulus is actually a conjunction of features (e.g., a chair is a conjunc-
tion of many smaller components such as the seat, legs, back, etc), however, this coding
scheme can hinder generalization, since each unit only responds to a specific conjunction
of features. McClelland indroduces the possibility that children with autism posses overly
conjunctive representations of the environment, then this could account for hyperspecificity
found in people with ASD. McClelland provides an anecdotal story of a child with autism
who refuses to use the restroom at a friends house because it is unfamiliar. In other words,
it is not the specific bathroom with which he is familiar. If we think of the bathroom which
the child with autism uses at his home, it may posses items such as green walls, a toilet, tile
on the floor, etc, none of which are present in the friends home, with the likely exception of
the toilet. Perhaps, McClelland argues, the child represents the toilet with an overly con-
junctive representation that includes other contextual items such as the color of the walls,
the tile on the floor, etc.
The largest problem with McClelland’s modeling theory of hyperspecificity in autism
is that no computational model —not even a precise description of a model—, is provided.
Leaving the theory at a purely verbal description, with no possibility of accounting for
quantitative data. Also, there is no mention of what neurobiological differences in peo-
ple with autism might give rise the overly conjunctive code argued to provide a possible
account of hyperspecificity in ASD.
Most of the existing models of autism reviewed above are fairly abstract in nature,
making little contact with specific neurobiological considerations (Cohen, 1994; McClel-
land, 2000; O’Loughlin and Thagard, 2000). Even those models of autism which have
incorporated biology in their framework have thus far only matched qualitative patterns of
behavior in people with ASD, not attempting to account for any quantitative behavioral
17

data (Gustafsson, 1997). Models more tightly coupled with observed functional properties
of neurobiological systems and constrained by actual behavioral data will be able to more
precisely inform theories of ASD.
Cognitive Flexibility and Control in ASD
Computational models might be able to provide a means of building a conceptual bridge
unifying the psychological and neuroscientific findings in ASD. However, it would be over-
ambitious (and a bit naive) to attempt to include all neurobiological differences or to at-
tempt to account for every behavioral finding. Instead the approach taken here is to provide
a possible explanation for a specific and informative, but circumscribed and well defined,
area of behavior observed in people with autism. The goal is to eventually, incrementally,
expand the theory instantiated in the computational model to account for an increasing
range of behavioral phenomena. In this initial study, we have focused on autistic perfor-
mance on tests intended to assess cognitive flexibility and cognitive control.
Cognitive control is our ability to enact a specific behavior, even in the presence of
a more automatic or competing response. For example, cognitive control underlies our
ability to resist scratching a mosquito bite, even though this is sometimes an effortful to
avoid doing so. In people with autism, cognitive control is believed to be robust. It is
relatively unaffected when measured using tasks such as the Stroop task. PFC is believed
to be important in our ability to enact control over our behavior. Functional brain imaging
studies show activation in dorsolateral regions of PFC when an automatic response needs
to be inhibited (MacDonald et al., 2000). Also, patient populations with frontal damage are
impaired on tasks measuring cognitive control such as Stroop (Stuss et al., 2001).
The Stroop (Stroop, 1935) task is a classic measure of cognitive control and the ability
to inhibit a prepotent response. In the classic version of Stroop, the stimuli are textual
displays of different color words, presented in various colored fonts. (See Figure 2.) The
participants are asked to either “read the word” or to “name the color” of the font in which
the text is presented. People are faster overall at reading the word as opposed to naming
18

the color of the word. This suggests that word reading is a more “automatic” response to
word stimuli. Furthermore, when comparing congruent (e.g., the word “red” in red font)
versus the incongruent (the word “red” written in green font) conditions, people only show
an interference effect when naming the color and not when reading the word. In other
words, there is an increase in reaction time for color naming, but not for word reading,
when comparing incongruent to congruent cases.
Cognitive flexibility can be viewed as the ability to fluently adapt our control of be-
havior as the task contingencies change. This ability is impaired in people with autism as
measured by tasks such as the Wisconsin Card Sort Test, (WCST), showing a significant
increase in the number of perseverative errors committed compared to normally develop-
ing individuals and people with other developmental disorders (Ozonoff and Jensen, 1999).
PFC is also believed to be important to our ability to flexibly adjust our control over be-
havior. For example, the role of PFC in flexible responding is demonstrated by an increase
in the number of perseverative errors committed during the WCST by patients with frontal
damage (Stuss et al., 2000).
The Wisconsin Card Sort Test (WCST) (Berg, 1948) is a psychological test used to
measure ones ability to implicitly learn a rule, maintain and apply this rule, and to flexibly
adapt your behavior when the task contingencies change. Subjects are told to sort cards
portraying stimuli varying along three dimensions (e.g., color, shape, and quantity) and
across four features per dimension (e.g., for the color dimension: red, green, blue, and yel-
low) into piles, one at a time, according to a sorting rule. (See Figure 1.) For example, a
sorting rule could be “sort according to the color of the card”, requiring the participant to
create four piles of cards, with a unique color represented by each pile. No explicit sort-
ing rule is ever communicated to the subject however. Instead, the subject tries different
strategies and uses performance feedback — “Correct” or “Incorrect” — provided on ev-
ery trial, to find the proper sorting rule is acquired. This same sorting rule must then be
maintained and applied for 10 consecutive correct sorts, after which and without informing
19

Figure 1: WCST example stimuli varying feature values across three dimensions: Color,Quantity, and Shape
Figure 2: Stroop example stimuli
the subject, the rule changes making the previous strategy incorrect and forcing the subject
to choose a new rule based on sorting feedback. This requires the subject to fluently adapt
their behavior as the rules change, a task which normally functioning individuals are quick
to succeed. People with impaired cognitive flexibility, including people with autism, will
show an increase in the overall number of perseverative errors. Perseverative errors are er-
rors due to continuing to sort based on the previously correct stimulus dimension. The test
will continue until either the subject achieves 6 correct categories (10 consecutive correct
sorts each), or all 127 cards are exhausted in the deck.
The cognitive profile observed in people with ASD —impaired cognitive flexibility
coupled with intact cognitive control— is difficult to relate to an underlying substrate,
considering the importance of PFC function in both control and flexibility. How then can
we resolve this apparent conflict? One possible answer is that people with autism do not
20

have a frontal deficit. Instead, they may be suffering from a problem with some other neural
system that interacts with or affects PFC.
As researchers began to build computational models of PFC’s role in cognitive control
and cognitive flexibility, two separate functions of PFC were found to be necessary in order
to account for observed behavior. The first, believed to be important of cognitive control, is
the ability of PFC to actively and robustly maintain abstract goal-like dimensional represen-
tations such as “pay attention to the stimulus color” across the firing patterns of its cells.
These actively maintained representations are not only biologically justified (Goldman-
Rakic, 1987; Miller and Cohen, 2001), but also serve a necessary functional role in the up-
modulation of appropriate posterior pathways, enabling a type of “top-down” control and
biasing of our behavior. Persistent activity across cells in PFC enable the firing of cells in
the appropriate posterior pathways, which correspond the controlled behavior. As an effect
of upmodulating the pathway corresponding to controlled behavior, PFC also indirectly
inhibits competing more automatic behaviors. If the need to flexibly adapt our behavior
should arise (cognitive flexibility), we need a mechanism capable of intelligently updating
the actively maintained PFC representations with a pattern of activity that is better suited for
the task at hand. This updating mechanism can be conceptualized functionally as a “gating”
mechanism for PFC representations. The gate is able to shut, allowing the current control
representation (e.g., “pay attention to the stimulus color”) to be actively maintained in PFC
and remain unaffected by competing representations (e.g., “pay attention to the stimulus
shape”). If the need arises to change our behavior, the gate can be opened by this gating
mechanism, allowing a different and more-task appropriate representation to be loaded into
PFC. The concept of a gate is a useful metaphor when conceptualizing the necessary mech-
anisms the PFC must embody for cognitive control and flexible adaptation of this control,
but we must ask the question of how this gate intelligently opens and closes. First attempts
at explaining the intelligent opening and closing of the gate on PFC representations left
much to be desired, positing a homunculi-like “central executive” component which could
21

inform PFC when to open and shut the “gate”. Unfortunately, no explanation was provided
as to how the “central executive” component knew how to intelligently control the gate.
To address this problem, researchers have recently looked toward the midbrain DA system
as a possible candidate of a neural implementation of the intelligent gating mechanism for
representations in PFC.
Dopamine & Temporal Difference Learning
Hidden within the firing rates of midbrain DA neurons lie clues to how the intelligent
updating of PFC might be implemented in the neural hardware of the brain. Analyzing the
response profile of DA neurons in the basal ganglia of monkeys Schultz et al. (1997) have
demonstrated that DA cells appear to encode a prediction error in the amount of future re-
ward given to the monkey. In other words, these cells seem to encode a change in expected
future reward. Figure 3 shows results from a population of midbrain DA cells during one
of Schultz’s experiments. The top panel represents the situation in which the monkey is not
expecting reward, but then receives reward (e.g., a sip of juice). Notice that the DA cells
fire upon receiving the reward (signified by ‘R’ on the graph), encoding a positive change
in what the monkey was expecting. In the bottom left hand panel, the monkey has now
been conditioned to associate a flash of light with the delivery of the juice, after a short
delay. In other words the monkey now knows that the flash of light predicts future reward.
When the flash of light is seen (represented as ‘CS’, for conditioned stimulus, in the graph),
the DA cells fire. This can be explained as the monkey not expecting future reward when
the light comes on, signaling that juice is expected to be coming soon: a positive change
in expected future reward. However, when the reward is delivered (‘R’) the cells to do not
fire, since the monkey was already expecting reward. When the juice is delivered there is
no change in expected future reward in this case, and, therefore, no increase in the rate of
DA firing. In the panel located at the bottom right, the DA cells again fire for the flash of
light (‘CS’, conditioned stimulus) , but this time the experimenters withhold the juice at the
22

time when the monkey is expecting the juice to be delivered. The monkey is expecting re-
ward, but no reward is delivered. Thus, at the time that juice is expected, there is a negative
going change in expected future reward. Notice that the firing rates of the DA cells around
the expected delivery time of reward (‘R’) actually dip below their baseline firing rate and,
indeed, appear to encode this negative change in expected future reward.
This is very interesting because change in expected future reward is also the key variable
in a very powerful reinforcement learning algorithm known as Temporal Difference (TD)
learning. In TD learning, the change in expected future reward, the same value the DA cells
appear to be encoding, is know as the TD Error. Across two consecutive time steps the TD
Error is given by:��������������� �������������������������
(1)
Where������
is a continuous reward value that is delivered at each time step based on
system performance (e.g.,����������
for correct performance and����������
for incorrect),� �����
and� �����!���
are the expected future rewards at times�
and���"�
respectively,�������
is
the change in expected future reward, or TD Error, and�
is a constant discounting factor,
where�$#%�&#'�
. Adjusting�
changes the amount by which temporally distant rewards
are discounted as compared to rewards that can be attained in the temporally near future.
Linking machine learning and neurobiology, this connection has led researchers to for-
malize the role of midbrain DA neurons in the brain’s learning mechanisms (Barto, 1994;
Montague et al., 1996), equating the firing rate of the DA cells with the amount of change
in expected future reward, or TD Error. Neurally plausible implementations of TD learning
have been implemented and have been used to model the learning of motor sequences in
the striatum (Montague et al., 1996), driven by the reward-prediction DA signal.
Computational Models of PFC
Our current work builds on an existing body of computational modeling work having
strong ties to biology which includes a formal account of DA’s affect on PFC functioning.
23

Figure 3: Firing rates of midbrain dopamine neurons of the basal ganglia during classicalconditioning (Adapted from (Shultz et al., 1997))
The effect DA is formalized by equating the firing rate of midbrain DA neurons to the key
variable, the TD Error, of the powerful TD learning algorithm. Using this analogy between
biology and machine learning, researchers have been able to provide models of how motor
systems can learn sequences of overt actions leading to reward. One of the primary insights
of these models of PFC functioning is that the DA based TD learning mechanism might be
used to learn, from experience, when to open and when to close the gate on PFC. After
all, if TD can be used to learn sequences of overt actions, it might be possible to use this
same error signal to learn covert actions, such as when to open and when to shut the gate
on PFC representations. By building computational models of PFC function, researchers
have shown that this account is plausible (Braver and Cohen, 2000; O’Reilly et al., 2002).
A layer of processing units representing the PFC is included in these models, and this layer
is used to actively maintain abstract task dimensions across the firing patterns of the units.
For instance, the PFC layer can encode, and actively maintain, a representation such as
24

“pay attention to the stimulus color”. This maintained pattern of activity can then provide
a “top-down” bias or upmodulation of pathways in posterior brain areas associated with
the processing of stimulus color (Cohen et al., 1990). (See figure 4.) The extra biasing
provided by the PFC bootstrap weaker, less automatic, behaviors (naming the color as op-
posed to reading the word) when appropriate. This activation based modulation is thought
to be key to our ability to provide cognitive control over behavior. The DA based adaptive
gating mechanism can be used within this context as a way to signal to PFC to strengthen
the maintenance of the representation currently encoded (close the gate) when a positive
TD Error occurs signifying a positive change in our expected future reward. In other words,
when the system is doing better than expected, close the gate on PFC representations so we
are more likely to keep doing the same thing. Conversely, when the network starts perform-
ing worse than expected (possibly due to task contingencies changing), this will result in a
negative TD Error signaling that system is not performing as well as expected, indicating
that the system should adapt its behavior to perform more optimally. The negative TD er-
ror can be used as a gating signal on the PFC representations, signally the gate to open and
allowing a new representation to replace the old allowing the network to flexibly adjust its
control over behavior.
Along with providing a neural mechanism that can learn to appropriately and adap-
tively gate PFC representations, these models have also been successful in tying frontal
disturbances, such as those found in schizophrenia, to deficits in cognitive control (Cohen
and Servan-Schrieber, 1992) and cognitive flexibility (Braver and Cohen, 1999; O’Reilly
et al., 2002). A recent elaboration of this model, XT (Rougier et al., in press), is the first
neuroscientific model able to provide quantitative fits to a hallmark task of cognitive con-
trol, the Stroop task, and a widely used measure of cognitive flexibility, WCST, in both
neurologically intact and frontally damaged people.
25

Figure 4: A still image of an animation of a simple computational model of the role of PFCin the Stroop task (Cohen et al., 1990) (See Appendix B)
The Cross-Task Generalization Model (XT)
XT is a model of cognitive flexibility and cognitive control built using the biologically
grounded Leabra framework for computational cognitive neuroscience modeling (O’Reilly
and Munakata, 2000). Leabra incorporates many useful neural network tools including a
biophysical point neuron activation function, bidirectional excitation, an efficient imple-
mentation of lateral inhibition, as well as both Hebbian and error driven learning rules.
The general design of the XT network is shown in Figure 5. The input of XT consists of
a layer of units that use a localist code to specify stimuli being presented to the system
in the current task. We can think of the rows of the input layer as representing different
dimensions (e.g., color, shape, size) and the columns indexing features across each dimen-
sion. (See Figure 6.) The response layer is analogous in structure to the input layer, with
26

a winner-take-all mechanism used to simulate lateral inhibition between the units, facili-
tating a competition for a single output response corresponding to a single stimulus fea-
ture. There is one additional unit—a “No Response” unit—included in the response layer,
which provides the network with an alternative to the stimuli present in the input layer. The
PFC layer provides top-down cognitive control using abstract rule-like representations in
the same spirit of the models mentioned earlier, with one important difference. In previous
models, the PFC representations were hand-coded by the modeler, with the question of how
these representations develop brushed aside. In contrast, the rule-like PFC representations
in XT are learned through extensive experience with the stimuli. This extended amount of
initial experience provides a reasonable account for the protracted period of development
exhibited by PFC, continuing into adolescence. Thus, the XT model shows how control can
emerge through experience, supported by biologically based self-organizing mechanisms.
The Dimension Cue layer is used to inform the network concerning what stimulus di-
mension (e.g., color) is currently relevant. For example, the Dimension Cue layer is used
in the Stroop task to inform the network when it should name the ink color rather than read
the word, or vice versa. Each unit in the Dimension Cue corresponds to a dimension in the
stimulus (input) layer. If no Dimension Cue unit is activated, the network is uninformed as
to what dimension is currently relevant, and must rely on a random search method in order
to discover relevant stimulus dimensions. This uninformed search strategy is used during
the modeling of WCST performance.
The Task layer is vital in the training of the XT network, with each unit representing
a different task for the network to perform. Rougier et al. (in press), show that a large
breadth of experience is necessary for useful rule-like representations to develop in PFC
necessitating the exposure of the network to multiple tasks during initial training. For our
simulations, the Task layer is held constant after training, always requiring the network to
perform the “Naming Feature” task. “Naming Feature” requires the network to name one
27

feature from the input stimuli, using feedback to adjust the dimensional representation in
PFC in order to name the correct feature.
The flexible adaptation of cognitive control is implemented using a DA-based adaptive
gating (AG) mechanism, depicted in XT by the AG unit (See Figure 5.) The AG mecha-
nism computes the expected future reward based on the TD learning algorithm, with reward
delivered based on the network’s performance. When the model performs better than ex-
pected (positive TD Error,��������� �
) the PFC representations are strengthened using an
intrinsic maintenance current to stabilize PFC. XT leverages the intrinsic bistability of PFC
neurons along with recurrent excitatory recurrent connections to support the active main-
tenance of PFC representations (Durstewitz et al., 2000; Fellous et al., 1998). When the
model performs worse than expected (negative TD Error,������� # �
), the PFC represen-
tations are destabilized allowing a new, possibly more appropriate PFC representation to
be maintained. In the model, the�������
value directly modulates excitatory ionic mainte-
nance currents ( ��� below). Large maintenance currents drive the membrane potential of
simulated neurons in the PFC up, pushing them towards their maximal firing rate. These
currents are not allowed to become negative, being clipped at zero instead. The mainte-
nance currents, ��� , of simulated neurons in PFC are computed by:
��� ����� ��� ������� �������� ���(2)
��� ������� � ��� �����"� � ������������� (3)
����� � ������ � ������� �! �"� � �#�%$&� �#�(' $&� ) �*� '��,+.-./ �� � �10
Therefore, a positive�������
will result in an increase in active maintenance of PFC rep-
resentations, while a negative�������
will destabilize PFC. The value�
represents a threshold
value for the ionic currents. If the TD error,�������
, exceeds this amount (�� 243
in all
simulations), then the maintenance currents, �5� , are effectively reset.
28

Using this mechanism and a unified computational framework, XT has been success-
ful in providing strong quantitative fits to human performance on tasks measuring both
cognitive control and flexibility.
Figure 5: XT Model Architecture
29

Figure 6: Stimulus Input Layer: Caricature of input to the XT model, with rows portrayingstimulus dimension (color, shape, size, etc) and columns indexing feature values acrossdimensions (small, medium, large, etc.)
30

CHAPTER III
METHODS
PFC is believed to play a crucial role in the cognitive control and cognitive flexibility of
our behavior. For cognitive control, PFC provides an important role in online maintenance
of contextually relevant information used to appropriately bias more posterior brain areas
to respond in a situationally appropriate manner. Cognitive flexibility is enacted via DA’s
modulatory gating effect on PFC. Coupled together, the PFC / DA system appears to be
vital to our ability to fluently adapt actively maintained control representations to deal with
changes in task contingencies. The distinct pattern of reduced cognitive flexibility but rel-
atively retained cognitive control found in people with autism is very different than many
patterns of executive dysfunction exhibited in other disorders. This suggests that mod-
els of the performance deficits seen in autism may need to focus on neural mechanisms
that are distinct from those that are central to models of the executive control problems
exhibited in other disorders. For instance, in Schizophrenia, control is shown to be im-
paired in tasks such as Stroop. Some accounts have attributed this deficit to an inability
to actively maintain the proper contextual information in PFC, resulting in a lack of the
critical top-down influence used to overcome more prepotent processing pathways (Cohen
and Servan-Schrieber, 1992; McGrath et al., 1997). In frontally damaged patients, both
control and flexibility are impaired as compared to controls (Stuss et al., 2000; Stuss et al.,
2001), while in Attention Deficit Hyperactivity Disorder (ADHD) a deficit is found only in
inhibitory control with no significant deficits in cognitive flexibility (Ozonoff and Jensen,
1999). Accounting for the unusual cognitive profile in autism may involve a frontal deficit
per se, rather impaired cognitive flexibility and intact cognitive control in autism could be
the result of a dysfunctional DA based adaptive gating mechanism.
There is clear evidence of abnormalities in the DA system in people with autism. Stud-
ies have shown different levels of DA activity using PET brain imaging (Fernell et al.,
31

1997), and increased HVA (a dopamine metabolite) has been found in urinalysis stud-
ies (Martineau et al., 1992). Moderate clinical benefits from the administration of DA
antagonists such as Haloperidol and Risperidone have also been found (Posey and Mc-
Dougle, 2000). Motivated by these findings, we will explore whether reducing the effect
of the DA signal in frontal models of cognitive control and cognitive flexibility is sufficient
to capture the cognitive profile found in people with ASD. Using the XT framework, we
test this hypothesis by reducing the effect of the DA signal in the model by scaling the TD
Error,�������
, by a constant factor � , where � � � for normally functioning individuals and
� # � when attempting to capture the performance of people with autism1. The TD Error�������
now becomes:
��������� �� ������ � ������� �!� � ��� �������
(4)
� # ��� �
Qualitatively, this can be viewed as scaling the overall effect of the phasic DA signal on
frontal functioning. If the efficacy of the DA signal is reduced, the active maintenance of
information in PFC should be relatively unaffected, leaving the PFC functionally intact and
able to properly influence subsequent processing according to the currently maintained goal
representation. However, the ability of PFC to gate in new information would be reduced,
resulting in incorrect information being actively maintained and a decrease in the overall
flexibility of the system.
Two computational models have been used to explore our DA hypothesis. Both the
full XT model of PFC function and a simplified and scaled-down version of this model
have been employed. Multiple models were used in order to demonstrate that the general
underlying, biologically based mechanisms of PFC / DA interaction (outlined below) are
driving observed effects — that critical simulation results are not artifacts of idiosyncratic
1The scaling of ����� by is the only parameter modified from the original XT model to capture autisticperformance.
32

implementation details of a particular model. However it will be argued that the more
complex version of these models (the full XT model) will provide additional benefits which
the simplified model will be unable to provide as this research endeavor is continued.
Simple XT Model
A less complex version of the original XT model was developed using the same func-
tional mechanisms of the full XT model, but with a greatly simplified network struc-
ture (See Figure 7.) In the simplified model, all of the neural representations make use
of localist codes, and every connection weight between the network’s layers was hand-
coded and static. There is no need for a period of initial training (simulating development)
in the simple model due to the model’s synaptic weights being pre-specified and unable to
adapt. It is worth noting that many of the hidden layers used in the full XT model have
been removed in the simpler version. Since the simple model relies on purely localist rep-
resentations, the advantages provided by the distributed hidden layer representations in the
full XT model are of little use.
The major difference between the simplified version of XT and the full version is that
all of the representations in the simple model being pre-specified by the modeler. In con-
trast, the original XT model learns the necessary PFC representations (and representations
at other hidden layers) through repeated exposure to, and experience with, the stimuli. This
provides the added benefit of allowing for the modeling of how these representations de-
velop over time and under varying conditions, such as under the condition of an impaired
DA system. This ability to learn PFC representations will provide a key reason to prefer
the full XT model to the simplified one.
Basic Mechanisms
In order to simulate performance of both WCST and Stroop tasks both the simple ver-
sion and the full version of XT require certain biologically grounded mechanisms. Each
33

Figure 7: Simplified XT Model
of the mechanisms described below were previously described in the Background chapter,
but are briefly mentioned here for convenience.
PFC Layer - both models required a PFC layer to provide appropriate top down biasing
of processing. The ability to bias processing persistently over time is accomplished by
building into the PFC layer an ionic maintenance current, which permits the representations
to be actively and robustly maintained in the face of competing inputs.
Adaptive Gating Mechanism - A DA based, adaptive gating mechanism (AG), which
either strengthens or weakens the ionic maintenance currents in PFC based on network per-
formance, is included in both models. Using the temporal difference learning paradigm,
the AG computes changes in expected reward (the TD Error,�������
), and strengthens PFC’s
intrinsic maintenance currents when the network is performing better than expected. Con-
versely when the network is performing substantially worse than expected, the AG will
clear the ionic currents allowing a new, and hopefully more appropriate PFC representation
34

to be actively maintained. Initially, before the network receives any reward, a random trial-
and-error search strategy is employed by the network. During the random search rapidly
decaying negative only bias weights are used in order to provide an inhibition of return
mechanism for recent task representations. This results in the network performing a ran-
dom sampling with delayed replacement search strategy until reward is received.
Dimension Cue Layer - The Dimension Cue provides the model with information as to
what stimulus dimension (e.g., color) is currently relevant.
Scaling of TD Error - In order to capture performance of people with autism, the DA
signal analog,�������
, was scaled by a constant factor of � in both models. The values of �
for the simple and full versions of the XT model were held constant in all simulations of
autistic performance at 0.56 and 0.53 respectively. Values for � were chosen using a linear
grid search method in order to maximize fits of model performance to actual quantitative
behavioral data. To capture the behavior of normally functioning individuals, � was set to
1.00 for both the simple and full version of the XT model in all simulations.
These basic neural mechanisms are not the only ones employed in these models (for a
more complete description, see Appendix A), but they do entail the most important mech-
anisms for the purpose of our investigation of cognitive control and cognitive flexibility in
ASD.
Modeling WCST
WCST (Berg, 1948) is a psychological test used to measure ones ability to implicitly
learn a rule, maintain and apply this rule, and to flexibly adapt your behavior when the
task contingencies change2. In order to analyze behavior on WCST we need to establish a
collection of relevant error measures. The measures of performance which will be used for
this task are:
2For a detailed account of WCST please see the “Cognitive Flexibility and Control in ASD” section ofchapter II - Background
35

Figure 8: XT WCST example stimulus input
1. Categories completed : Number of 10 consecutive correct sorts in a row, maximum
of 6 (i.e., maximum of 5 rule switches)
2. Total Errors : Number of mistakes made by the subject when attempting to sort the
WCST cards
3. % Total Errors : Total Errors divided by the number of trials the subject requires to
meet criterion (or 127 if the 6 total categories are not achieved)
4. Perseverative Errors : Errors in which the previously correct sorting rule is used
5. % Perseverative Errors : Perseverative Errors divided by the number of trials the
subject requires to meet criterion (or 127 if the 6 total categories are not achieved)
The network was presented with stimuli at the input or “stimulus array” layer by activat-
ing individual units, one for a single feature across each of three dimensions (See Figure 8.)
This input represented the current card to be sorted. The task of the network was to name
the currently relevant feature (e.g., the feature “red” if color is the currently relevant sorting
dimension). No information is provided via the Dimension Cue layer concerning which di-
mension should be used as the currently correct sorting rule, leaving the network to use a
more-or-less random search strategy until the correct rule is discovered. The network only
receives sparse feedback — “reward” or “no reward” — receiving reward on trials when
36

correct performance is achieved, and no reward when an incorrect guess is made. Left to
the random search strategy, the network’s performance would tend towards chance, leading
to grossly deficient performance on WCST. XT is able to leverage the DA based AG mech-
anism coupled with the active maintenance and top-down influencing properties of the PFC
layer in order to successfully perform the task. The AG mechanism strengthens the PFC’s
intrinsic ionic maintenance currents when the network is performing well, allowing PFC
to actively maintain currently relevant information (e.g., pay attention to the color dimen-
sion), biasing the processing pathways which are part of the currently maintained stimulus
dimension so as to give them a competitive advantage over rival pathways. The actively
maintained PFC representations form a “memory” of the rule. When the rule switches (e.g.,
after 10 consecutive correct sorts), the actively maintained representation becomes invalid.
If the network allows the invalid representation to influence subsequent processing, a large
amount of perseverative errors will result. The AG prevents this by providing a gating sig-
nal to PFC when reward is expected but not delivered, allowing a new representation to be
acquired by PFC.
All of the performance measures mentioned above were recorded during simulations
of WCST for both the normally functioning DA model and the models with reduced DA
efficacy, used to simulate performance of people with autism.
Modeling Stroop
Cohen and Servan-Schreiber (1990) provide a computational account of the Stroop
task, positing that the greater overall strength of the word reading pathway is due to greater
experience with word reading, making this pathway stronger and more automatic compared
to the color naming pathway. In their model, a PFC-like mechanism provides top-down
biasing on the respective pathways based on the current goal (e.g., “read the word” or
“name the color”). The control provided from PFC is necessary to overcome the prepotent
word reading pathway during the incongruent trials when the network is required to name
the color. This results in an increase in reaction time in the color naming incongruent
37
condition, but not in the word reading incongruent condition. This is attributed to the
greater overall competition created when the network needs to overcome the stronger word
reading pathway3.
In order to simulate this imbalance of processing strengths in our model, we manipu-
lated the frequency with which one dimension was experienced as relevant during initial-
ization training of the full XT model, making the dimension relevant only 25% as often as
the other dimensions. This frequently irrelevant dimension corresponds to the font color
in the classic Stroop task. In the simple model the processing imbalance was simply hand
coded via weaker connection weights for the pathway corresponding to the color nam-
ing pathway. (This hand-coding strategy was used in early Stroop models of Cohen and
Servan-Schreiber (1992).) The competition between the color naming and word reading
pathways is simulated by co-activating features in this weaker dimension, corresponding
to the color naming pathway, and a strong dimension, representing the word reading path-
way. The PFC layer provides the crucial top-down biasing mechanism, consistent with the
model of Cohen & Servan-Schreiber, to help resolve the competition appropriately based
on the goal of the task. The settling time of the network resulting from this competition is
used as an analog to reaction time, and is scaled using a single free parameter allowing us
to directly compare model results to human data4. The settling time of is the time needed
by the network to resolve the competition between the pathways and produce a coherent
output response. The single free parameter is computed by taking a single data point, the
average settling time of the congruent “word reading” condition, and calculating the scalar
value required to map the settling time to actual reaction time data. This scalar is the “sin-
gle free parameter” and was subsequently used to scale all other data points to reaction time
(milliseconds).
3For a detailed account of Stroop please see the “Cognitive Flexibility and Control in ASD” section ofchapter II - Background
4Due to an overly large baseline settling time difference between “word reading” and “color naming”conditions using the simplified XT model, this analysis was only possible for the full version of the XTmodel.
38

Network Training
To facilitate comparisons between WCST and Stroop performance, 100 networks were
trained using the full XT model framework, employing the training procedure used by
Rougier et al. (in press). The training continued for 100 epochs, where one epoch consits
of 2000 training trials, or until a stringent performance criteria was met during validation
test trials. The performance criterion required a maximum of 25 errors to be committed out
of a possible 250 during a test phase which occurred after every other training block. The
simple XT model required zero training since all of the representations were hand coded
and the weight were pre-specified and non-plastic (not adjustable). Following training,
each network was tested under conditions of DA modulation, � � � to simulate normal
function and � # � to simulate the performance of individuals with autism, on the WCST
and Stroop tasks. Separate networks where treated as individual subjects when using the
full XT framework for the purpose of data analysis (n = 100 for the control group and n
= 100 for the autism group). The simple XT framework did not require separate networks
since strengths of the connection weights are not allowed to adapt their values. Instead,
one network was used in all simulations of control group performance (n=100) and autistic
performance (n=100).
39

CHAPTER IV
RESULTS
Simple Model Stroop Results
The simple XT model’s performance on the the Stroop task is able to qualitatively, but
not quantitatively, fit human performance. (See Figure 9.) The model of intact DA function
shows the classic pattern of Stroop reaction time results. The pre-potent word reading di-
mension shows uniform reaction times across both congruent and conflict conditions, while
the weaker color naming dimension shows a slowing in reaction times when the stimuli are
incongruent. Autistic performance, obtained by scaling the strength of the DA signal in the
model, showed the same pattern of results with no significant increase in the overall Stroop
effect (F(1,198) = 1.88; ��"� 2 ���
) consistent with past findings (Ozonoff and Jensen, 1999).
However, a good quantitative fit to human data was not possible with this simple model.
This fit is a result of the large baseline difference in the reaction time measure for color
naming and word reading. With such a large difference, it was not possible to provide the
simple single free parameter fit to actual reaction time data that is described in the meth-
ods section using the full XT model structure. It is possible, however, to provide a better
quantitative fit if we were to attempt a scaling of the simple model results using a more
complex data fitting routine. It should be pointed out that even without a tight quantita-
tive fit, the model still captured an extremely important portion of the pattern of results for
the Stroop task, namely the selective slowing in reaction times for the incongruent color
naming condition.
It is apparent from the above results that the reduction in DA efficacy had little if any
effect on cognitive control as measured by the simulated Stroop task. The ability of the
PFC to actively maintain abstract stimulus dimensions continued to be able to effectively
influence processing, bootstrapping the weaker “color-naming” pathway when appropriate,
40

neutral conflictCondition
0
5
10
15
20
25
Cyc
les
to S
ettl
e
Stroop Reaction Time
Control Network - Word ReadingAutism Network - Word ReadingControl Network - Color NamingAutism Network - Color Naming
Figure 9: Simple XT model: Stroop results
allowing this pathway to compete with the stronger and more automatic “word-reading”
pathway.
Simple Model WCST Results
Simulations using the simplified version of XT were able to capture the pattern of
WCST behavior, exhibited by autistic subjects and healthy controls, with one notable ex-
ception. (See Table 1.) The “number of categories completed” measure of performance,
was at the ceiling level of 6 categories, which is much better than performance exhibited
by many people with ASD. The model’s performance on this measure will be discussed
further in the section titled “XT Model WCST Results”. The total number of errors and the
percentage of total errors were both significantly increased in the DA modulated model of
autistic performance, consistent with results from previous studies. Importantly, the num-
ber of perseverative errors measure were also higher and statistically reliable, matching
41

Table 1: WCST Simple Model Results
WCST Measure Normal Autism F(1,198) ���Total Errors 25.94 41.78 182.29 .001% Total Errors 30.48% 39.85% 181.15 .001Total Perseverative Errors 14.85 27.99 548.26 .001% Perseverative Errors 17.17% 26.89% 574.19 .001Categories 6.00 5.98 2.02 .16
findings from a number of previous studies (Prior and Hoffman, 1990; Ozonoff and Jensen,
1999; Minshew et al., 2002; Bennetto et al., 1996). (See Figure 10.) Reducing the effect of
the DA signal has a marked effect on the total number and types of errors while performing
the WCST task, which is in stark contrast to the results in simulations of the Stroop task.
Modulating the DA signal appears to have direct implications for cognitive flexibility in
our model.
XT Model Stroop Results
The full XT model’s performance on the Stroop task is able to both qualitatively and
quantitatively match human performance. (See Figure 11.) The model of intact DA func-
tion again shows the classic pattern of Stroop reaction time results. Autistic performance
showed the same pattern of results with no significant increase in the overall Stroop effect
(F(1,198) = 0.62; ��"� 2����
) consistent with past findings (Ozonoff and Jensen, 1999). The
lack of effect when reducing the phasic DA signal reproduces the results from the “Sim-
ple XT” model, showing again that the manipulation was of little functional consequence
for the cognitive control needed to successfully perform of the Stroop task. The additional
flexibility of the full model allowed us to vary the training of the model to fit healthy human
reaction time data, where the simple model was more limited. The constrained structure
of the simple model made it difficult to find connection weight values that afforded good
42
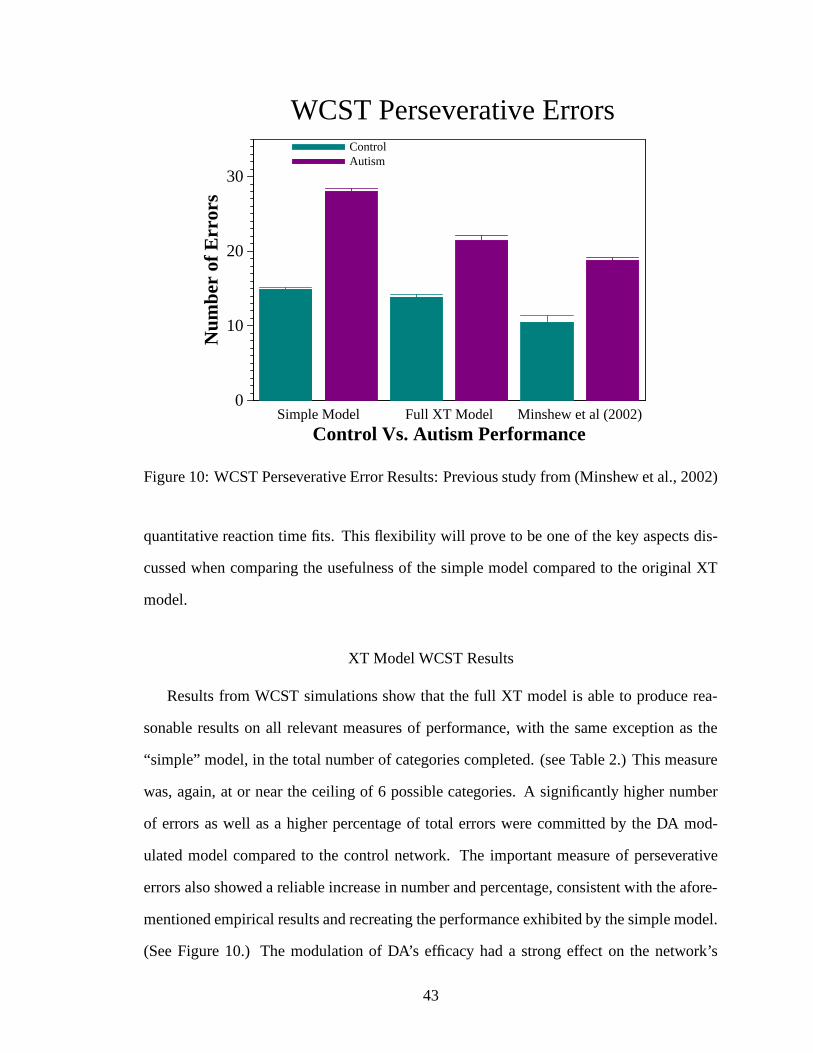
Simple Model Full XT Model Minshew et al (2002)
Control Vs. Autism Performance
0
10
20
30
Num
ber
of E
rror
s
WCST Perseverative ErrorsControlAutism
Figure 10: WCST Perseverative Error Results: Previous study from (Minshew et al., 2002)
quantitative reaction time fits. This flexibility will prove to be one of the key aspects dis-
cussed when comparing the usefulness of the simple model compared to the original XT
model.
XT Model WCST Results
Results from WCST simulations show that the full XT model is able to produce rea-
sonable results on all relevant measures of performance, with the same exception as the
“simple” model, in the total number of categories completed. (see Table 2.) This measure
was, again, at or near the ceiling of 6 possible categories. A significantly higher number
of errors as well as a higher percentage of total errors were committed by the DA mod-
ulated model compared to the control network. The important measure of perseverative
errors also showed a reliable increase in number and percentage, consistent with the afore-
mentioned empirical results and recreating the performance exhibited by the simple model.
(See Figure 10.) The modulation of DA’s efficacy had a strong effect on the network’s
43

neutral conflictCondition
500
600
700
800
900
Rea
ctio
n T
ime
(mse
c)
Stroop Reaction TimeControl Network - Word ReadingAutism Network - Word ReadingHuman Data - Word ReadingControl Network - Color NamingAutism Network - Color NamingHuman Data - Color Naming
Figure 11: Full XT model: Stroop reaction time results, human data from (Dunbar andMacleod, 1984)
ability to flexibly adapt its behavior as the task contingencies of WCST changed. It is not
readily apparent what is causing the model to demonstrate relatively no sensitivity to the
DA modulation for the total number of categories measure of performance. A study by
Ozonoff (1995) found the mean number of total categories achieved for normally function-
ing individuals to be 4.9 with a standard deviation of 1.7, and 3.0 with a standard deviation
of 2.1 for people with autism. The model’s mean performance of 5.74 when simulating
the behavior of normally developing individuals and 5.58 for autistic performance demon-
strates that the model is performing this aspect of the WCST too well. However, both the
simple and full versions of XT show the same pattern of results, likely pointing to a similar
mechanism underlying the problem in each model.
44
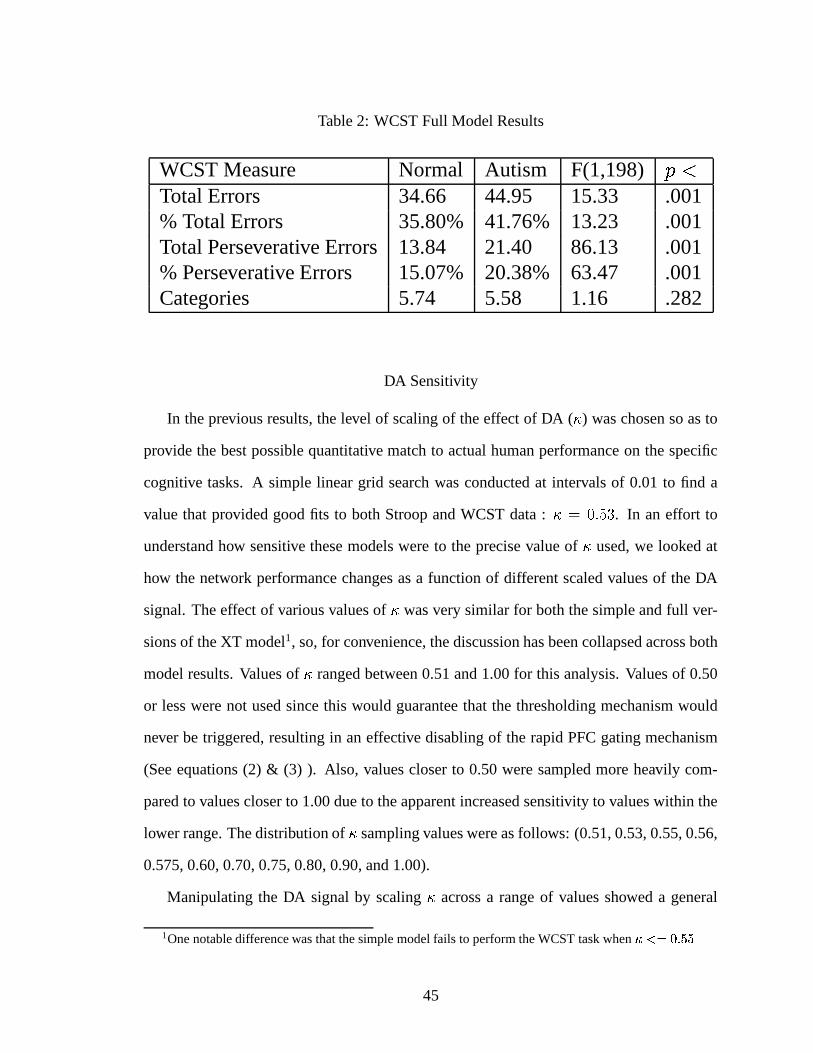
Table 2: WCST Full Model Results
WCST Measure Normal Autism F(1,198) ���Total Errors 34.66 44.95 15.33 .001% Total Errors 35.80% 41.76% 13.23 .001Total Perseverative Errors 13.84 21.40 86.13 .001% Perseverative Errors 15.07% 20.38% 63.47 .001Categories 5.74 5.58 1.16 .282
DA Sensitivity
In the previous results, the level of scaling of the effect of DA ( � ) was chosen so as to
provide the best possible quantitative match to actual human performance on the specific
cognitive tasks. A simple linear grid search was conducted at intervals of 0.01 to find a
value that provided good fits to both Stroop and WCST data : � ��� 2 3 � . In an effort to
understand how sensitive these models were to the precise value of � used, we looked at
how the network performance changes as a function of different scaled values of the DA
signal. The effect of various values of � was very similar for both the simple and full ver-
sions of the XT model1, so, for convenience, the discussion has been collapsed across both
model results. Values of � ranged between 0.51 and 1.00 for this analysis. Values of 0.50
or less were not used since this would guarantee that the thresholding mechanism would
never be triggered, resulting in an effective disabling of the rapid PFC gating mechanism
(See equations (2) & (3) ). Also, values closer to 0.50 were sampled more heavily com-
pared to values closer to 1.00 due to the apparent increased sensitivity to values within the
lower range. The distribution of � sampling values were as follows: (0.51, 0.53, 0.55, 0.56,
0.575, 0.60, 0.70, 0.75, 0.80, 0.90, and 1.00).
Manipulating the DA signal by scaling � across a range of values showed a general
1One notable difference was that the simple model fails to perform the WCST task when ���������
45

lack of sensitivity to the DA signal during simulations of the Stroop task. (See Figures 12
& 13.) These results are in accordance with the observation that active maintenance and
PFC-based biasing are unaffected by reductions in the DA signal. Also, the Stroop task
requires very little cognitive flexibility, and should therefore not be overly sensitive to the
model analog of the phasic DA signal, with its role as a gating signal.
Manipulating the DA signal during the simulations of WCST revealed a sharp sensitiv-
ity to the scaling of the DA signal. (See Figures 14, 15, & 16.) Both versions of the XT
model show an increase in the total number of errors and the number of perseverative errors
as a function of the DA scale, as predicted. The number of categories completed was at or
near ceiling for all tested values of � for both the full XT model, and for � � � 243 3using
the simple XT model. In the simple model, values of � � � 24353 result in a basic failure of
the network to accomplish the task, with only a single category achieved on average. With
��� � 2 � � , model performance is equivalent to no scaling of the DA signal: � ���52 � � . A
similar pattern is found in the full XT model, with values of ��� � 2 353 showing little if any
change in performance as � increases.
Performance on WCST with various values of DA efficacy shows a definite effect on
cognitive flexibility. There is a significant increase in the number of perseverative errors
as the DA signal is weakened. It is interesting to note that there is a restricted range of
graded degradation in performance for both the full and simplified version of the XT model.
The simplified version shows graded levels of sensitivity to changes in the strength of
the DA signal within the interval:� 2 3 �53 � � � � 2 � � . Similarly, the full version of XT
shows a similar restricted range of smooth changes in effect of scaling the DA signal when� 2 3�� � ��� � 2 3 �53 . Outside the respective ranges which show a graded change of sensitivity
to scaling the DA signal, the patterns flattens out, showing little to no change in effect of
different values of � .
46

neutral conflictCondition
5
10
15
20
Rea
ctio
n T
ime
(cyc
les)
Stroop Reaction Time0.51 - Word Reading0.53 - Word Reading0.55 - Word Reading0.56 - Word Reading0.575 - Word Reading0.60 - Word Reading0.70 - Word Reading0.75 - Word Reading0.80 - Word Reading0.90 - Word Reading1.00 - Word Reading0.51 - Color Naming0.53 - Color Naming0.55 - Color Naming0.56 - Color Naming0.575 - Color Naming0.60 - Color Naming0.70 - Color Naming0.75 - Color Naming0.80 - Color Naming0.90 - Color Naming1.00 - Color Naming
Figure 12: DA Sensitivity: Stroop Task (Simple XT Model)
neutral conflictCondition
500
600
700
800
900
Rea
ctio
n T
ime
(cyc
les)
Stroop Reaction Time 0.51 - Word Reading0.53 - Word Reading0.55 - Word Reading0.56 - Word Reading0.575 - Word Reading0.60 - Word Reading0.70 - Word Reading0.75 - Word Reading0.80 - Word Reading0.90 - Word Reading1.00 - Word Reading0.51 - Color Naming0.53 - Color Naming0.55 - Color Naming0.56 - Color Naming0.575 - Color Naming0.60 - Color Naming0.70 - Color Naming0.75 - Color Naming0.80 - Color Naming0.90 - Color Naming1.00 - Color Naming
Figure 13: DA Sensitivity: Stroop Task (Full XT Model)
47

0.51 0.53 0.55 0.56 0.575 0.60 0.70 0.75 0.80 0.90 1.00
Dopamine Scaling
0
20
40
60
80
# of
Err
ors
WCST Total ErrorsFull XT ModelSimple XT Model
Figure 14: DA Sensitivity : WCST Total Errors
0.51 0.53 0.55 0.56 0.575 0.60 0.70 0.75 0.80 0.90 1.00
Dopamine Scaling
0
10
20
30
# of
Err
ors
WCST Perseverative ErrorsFull XT ModelSimple XT Model
Figure 15: DA Sensitivity : WCST Perseverative Errors
48

0.51 0.53 0.55 0.56 0.575 0.60 0.70 0.75 0.80 0.90 1.00
Dopamine Scaling
0
2
4
6
Cat
egor
ies
Com
plet
ed
WCST Categories CompletedFull XT Model Simple XT Model
Figure 16: DA Sensitivity : WCST Categories Achieved
49
CHAPTER V
DISCUSSION & FUTURE WORK
By using a formal characterization of the effect of DA on PFC we have shown that a
single manipulation —reducing the efficacy of the DA signal— is sufficient to capture the
performance of people with autism on basic tests of cognitive flexibility (WCST), and cog-
nitive control (Stroop). In WCST, our models of autistic performance commit significantly
more errors and, importantly, more perseverative errors when compared to simulated per-
formance of normally functioning controls. This pattern of errors indicates that by scaling
the DA signal, the ability of the model to flexibly adapt its behavior as task contingencies
change is greatly reduced. In the simulations of Stroop performance, on the other hand,
there is no significant change in performance when comparing the models with a reduced
DA signal to those with no DA deficit. This indicates that there is no reduction in the
amount of cognitive control, as measured by the classic Stroop paradigm, in simulated
performance of people with autism. The Stroop model results indicate that reducing the
phasic DA signal’s effect on PFC functioning does not appear to affect the ability of PFC
to actively maintain representations which can be used to influence subsequent processing
in more posterior pathways. However, the WCST results point to a strong effect on the gat-
ing mechanism of PFC, resulting in a reduced ability to switch contexts in an appropriate
manner. This results in the last correct representation being actively maintained in PFC and
influencing subsequent processing according to this now outdated rule, resulting in incor-
rect perseverative responses during WCST. Performance during Stroop is not affected by
the deficient gating mechanism, since the task does not require any rapid gating of new in-
formation in order to succeed. The task always requires the subject to either “pay attention
to color” or “pay attention to the word”, and never requires a rapid switch between the two
goals.
Two different models were employed in this investigation. Both models contained a
50
PFC layer which was able to encode abstract stimulus dimensions (such as color) in order
to appropriately influence processing. This PFC layer was modulated by an adaptive gat-
ing mechanism, which was formalized in terms of a contemporary reinforcement learning
account of phasic DA’s effect on PFC functioning. The main differences between the two
models were that the “simple XT” model used a purely localist code across all layers, and
all connections in the model were pre-specified and non-plastic, prohibiting the model from
learning new stimulus mappings from inputs to outputs. By using both of these models, we
are able to argue that the important mechanisms for capturing performance of people with
autism lies in the mechanisms underlying the effect of DA on frontal functioning, and not
some other hidden aspect of the model. Going forward with our research, however, it will
make sense to use the “full XT” framework and not the “Simple XT” version. This original
version of the XT framework was able to provide tighter quantitative fits to actual human
data, and more importantly, there are large possible advantages to be gained from this ver-
sion’s ability to learn the PFC representations through a protracted development period.
The utility of modeling this developmental process is described in more depth below.
A sensitivity analysis of different scalings of the efficacy of DA found that the models,
while sensitive to this scaling, showed an intriguing pattern of sensitivity. Both models
demonstrated a restricted range of gradual sensitivity, with little change in the amount of
sensitivity outside of this range. There are many possible reasons why this is behavior is
observed in the models, one possible candidate involves the mechanisms used to simulate
the adaptive gating mechanism. Another reason could be the model is predicting actual
patterns of human behavior. This later claim is a testable prediction of the model, which
will need to investigated further with well designed behavioral experiments.
A major contribution of the presented research is how our model ties a difference in
DA function to frontal lobe dysfunction in people with autism. This provides a previously
unelaborated bridge to the Executive Dysfunction Theory (traditionally linked directly to
51
frontal dysfunction), DA differences found in autism, and observed behavior in people with
autism (Hughes et al., 1994).
Our initial results using computational cognitive neuroscience models to investigate
cognitive deficits found in people with ASD are encouraging, but there are many ques-
tions and many avenues for future research left to explore. Remaining questions such as
if the formal account of DA function, and reduction of the effect of this function, will ex-
pand to easily and elegantly capture other patterns of behavior found in people with ASD.
Deficits have been found in tasks involving planning (Bennetto et al., 1996), the ability to
attribute mental states to others (TOM) (Baron-Cohen et al., 1985), and generating novel
responses (Turner, 1999) to name only some of the areas. Along with tasks in which perfor-
mance by people with autism is deficient, there are many tasks which people with autism
excel at as well. It is important for any account, including ours, to be able to account
for these spared abilities, as well (Happe, 1999). By expanding our framework to demon-
strate that spared or possibly even improved performance is achieved on tasks such as the
Embedded Figures Task, we strengthen the possibility that we are capturing a true causal
relationship rather than merely a coincidence.
An extremely interesting, albeit casual, observation lies in a number of similarities
found between autism and Parkinson’s disease (PD). Vilensky et al (1981) noted similar-
ities between the gaits of people with autism and individuals with PD. Both have trouble
initiating motor movements as well as in tasks which involve learning sequences of motor
movements. The most intriguing similarity for present discussion is that people with PD
show poor cognitive flexibility on tasks such as WCST (Nieoullon, 2002), but are unaf-
fected on tests of cognitive control such as Stroop (Henik et al., 1993). This is of inter-
est since this is the same cognitive profile on these tasks as found in people with autism.
Parkinson’s is believed to be a function of the degeneration of DA producing areas in the
basal ganglia, make this a compelling link to investigate further.
One of the largest weaknesses of our model is, at the same time, the most exciting
52
avenue for future research. Autism is a developmental disorder, but in the present inves-
tigation we do not manipulate the effect of DA until after the networks are fully trained.
By taking this approach we cannot make any predictions as to how the system will develop
over time. This is invaluable information when trying to understand the mechanisms under-
lying a complex developmental disorder such as autism. For instance, a small change early
in development could have unintuitive and magnified results by the end of the developmen-
tal process. XT has the exciting and unique feature that the receptive field properties of the
PFC neurons are being determined through a learning process. For example, in Stroop it
is important for the PFC to represent the abstract notion of “color” in order to properly in-
fluence processing. This encoding of “color” is learned through experience with a range of
tasks for which success is helped by paying attention to color. Using the learning properties
of XT we will be able to analyze how manipulating the effect of DA early in development
affects the nature of PFC representations, as well as how these changes affect behavioral
performance. By examining differences throughout development, it may be possible to pro-
vide an account explaining why executive dysfunction is only found later in development
in people with ASD, as well as providing a means of predicting how different intervention
techniques could affect subsequent development.
Using computational models inspired and constrained by our existing knowledge of bi-
ology is a relatively untapped resource in the exploration of the neurological underpinnings
of autism. The tools provided by computational cognitive neuroscience have the potential
of building conceptual bridges between the domains of cognitive psychology and cognitive
neuroscience, requiring behavior to be explained in terms of biologically justified mecha-
nisms. Our initial results using these tools are encouraging and show a promising future
direction for research on autism spectrum disorders.
53

APPENDIX A
LEABRA MODEL EQUATIONS
Leabra (O’Reilly, 1996) is a biologically based computational modeling framework
which has been used to explain the neural basis of cognition in a wide range of different
domains. Leabra incorporates many biologically inspired mechanisms including a bio-
physical neural activation function, lateral excitatory connections, inhibitory competition,
as well as both a Hebbian learning and an error-driven mechanism for synaptic plasticity.
In the following sections, the model equations used to implement these features will be
briefly described. Please see (O’Reilly, 1996) for a more in depth analysis of the mecha-
nisms described below (adapted from Rougier et al., in press) .
Activation Function
Leabra uses a point neuron activation function based on biophysical properties of actual
neurons, with the spatial extent of the neurons shrunk down to single point for computa-
tional efficiency. The point neuron activation function possess many of the same properties
as the traditional connectionist sigmoidal activation function (such as its saturating non-
linearities), but is also grounded in the biophysical properties of actual neurons.
The point neuron activation function can be broken into three different components: the
ionic conductances ( ��� ����� ), the membrane potential (� � ), and the actual firing-rate output
from the point neuron ( ���� ��� � ). The first component, the ionic conductances ��� ����� , are
updated at each time step (t) and incorporated in every neuron-like unit. There are three
conductance channels which comprise ��� ����� . The first is considered to be the excitatory
influence on the neuron, ��� ����� , and is computed as the standard weighted sum of sending
unit activations (firing-rates):
� � �� ��������
��� � � � (5)
54

The inhibitory component, � �����
, is computed via a K-Winner-Take-All mechanism de-
scribed in the next section. The third component of the conductance channels is ��� ����� , a
constant leak current. Each simulated neuron maintains its own values for these conduc-
tances, encoding the current state of ionic channels in the cell’s membrane.
These conductance channels are used at every time step to update the membrane poten-
tial of the simulated cell:
� � ����� ��� �� � � �������� � ��� � � � � ����� � (6)
Where � � ����� is simply the proportion of conductance channels of type c that are open,�� � is the maximum conductance of channels of a given type.� � is the reversal potential for
type c channels, and�
is a time constant.
The activation function of �1 � � � � is computed by:
� � ����� � �� � � �� ���������������� � (7)
where� � ���
is a thresholding function returning 0 if�"#'�
, and returning x if� � �
.
The value of�
affects the gain of the functional relationship between the cell’s membrane
potential and its firing rate, and�
shifts the effective threshold of firing.
The current activation function, � � ����� , has a very sharp threshold which is both bio-
logically unrealistic and can cause problems for the gradient-based learning mechanisms.
Therefore, � � ����� is convolved with gaussian noise to help smooth and soften the function,
giving us the final activation equation:
� �� ��� �����! � �
"$#&% �('*),++.- + � � ��/ � � �10�/(8)
where � �� � � � is the noise-convolved activation function for� � � � � ����� � � �.�
.
55

Inhibition and Competition
Leabra uses a K-Winners-Take-All (KWTA) function to simulate fast inhibitory com-
petition between units within a layer of neurons. While biologically implausible in its
implementation in Leabra, it provides a good approximation of actual inhibitory dynamics
found in neural systems. KWTA is computed as a uniform amount of inhibition across all
units in a given layer. This inhibition is computed in a manner to ensure that only approx-
imately K units have sufficient excitation in order to reach their firing threshold. All units
in this layer will have their inhibitory conductance set by:
� � � �� � ����� � �� � � �� � � (9)
where� #��$#'�
is a parameter whose function is to ensure that the amount of ionic
inhibition is set to fall between the upper bound of � �� and the lower bound of � �� � . These
boundary inhibition values are computed in a manner that keep all units (�52 2��
) above their
firing threshold, with the� � � unit right at its firing threshold.
Weight Update Equations (Learning)
The efficacy of synaptic connections is modeled by real-valued connection weights.
These weights may be adapted with experience. Weight updates in Leabra consist of an
additive combination of two different learning rules: a gradient descent and a Hebbian
learning rule. The learning rules are combined in the following manner to arrive at the
overall weight update equation:
� � � ��� � �� ��� � � � ��� � � � � � � ����� ��� � � ��� ������ �
� ���
(10)
where�
is the learning rate and��� ��� is a mixing constant (between 0 and 1). For both
learning rules the network settles in two different phases, a minus phase where the actual
56

output of the network is produced, and a plus (outcome) phase where the expected or target
output is clamped to the appropriate value.
The error driven component of the learning rule,� � � � , essentially computes the first
derivative of the error function as in the ubiquitous backpropagation of error algorithm, but
using biologically plausible bidirectional activation flow in order to compute this derivative,
as opposed to the seemingly biologically implausible backward propagation of an error
signal along the axon of a neuron. The difference between the pre- and post-synaptic
activation (input activation values and output activation values) across the minus and plus
phases provide the learning gradient:
� ��� � � � � � � � � �� ����� � � � �� � (11)
which is then soft-weight bounded to ensure that the weights stay in the range of 0 - 1:
� ����� � �
� � � � ����� �.� � � � �
� � � � � ��� � � � � � 0 (12)
A normalized version of Hebbian learning is computed as follows:
��� ��� � � � � � � �� � � � � �� � � � � �� � � � � �
� �
(13)
The combination of these two weight update equations results in weight changes that
mirror long-term potentiation (LTP) and long-term depression (LTD) effects observed in
biological synapses.
Temporal Difference Learning and Adaptive Gating of PFC
The adaptive gating mechanism is reified as an adaptive critic unit (AG in Figure 5)
which updates its activation based on the temporal differences (TD) algorithm. The AG
computes change in expected future rewards, which can then be used to update intrinsic
57

ionic maintenance currents in the PFC (PFC) layer, simulating an intelligent gating mech-
anism. The idea is as follows: when the network performs better than expected, the AG
unit will compute a positive “delta”, or positive going change in expected future reward.
This delta can be used as a modulatory signal on the ionic maintenance currents in PFC,
strengthening these currents and stabilizing the current PFC representations. Conversely,
when the network is performing worse than expected, the AG unit will compute as nega-
tive delta, or negative going change in expected future reward. This negative delta can be
used as a modulatory signal to weaken the maintenance currents, destabilizing the repre-
sentations PFC is currently maintaining, which are not leading to reward. The maintenance
currents are computed as follows:
��� ��� �"� � � � �� �������� � �� (14)
��� ������� � ��� ��� �"� � �&������� � � (15)
The AG unit uses the TD Error,�������
, in order to modify and improve its predictions of
expected future rewards as follows:
����� � � ������� �
(16)
This represents modifying weights projecting from the PFC layer to the AG layer in
proportion to the TD Error and the firing rate of the responsible simulated PFC neuron,�
.
The result is an increase in the activation value of the AG unit, representing the prediction
of expected future reward, for PFC representations actively maintained when the network
performs better than expected. Conversely, the expectation of future reward encoded by the
AG unit will be lessened when driven by PFC units actively maintaining representations
which lead to worse than predicted network performance.
Two additional mechanisms are included. The first will reset the maintenance currents
if the magnitude of the delta signal is larger than the reset threshold�� , where
��� � 2 3
for
58

our simulations. The second mechanism is a fault tolerance device, which will ensure that
the maintenance currents do not get cleared on purely random errors. This is accomplished
by only delivering a reward of 0 to the AG unit when the network commits at least two
errors in a row.
59
APPENDIX B
NAV: NODE ACTIVITY VISUALIZER
Introduction
NAV (Kriete et al, in press) is a visualization tool intended to help facilitate presenta-
tions of the extremely rich and complex dynamics exhibited by computational models of
human cognition. The complexity of computational models of cognition is not frivolous.
Rather, it is often the case that this richness is crucial for capturing the nuances of human
performance. Computational models are, in fact, often used because the dynamics of com-
plex systems often resist more analytical approaches. This complex dynamical behavior
can, unfortunately, also hinder the ability to develop a deep understanding of the cognitive
model. Simulation packages provide a wide range of tools to help the modeler monitor
performance as it unfolds over time. However, these tools are developed with the expert
in mind, with rich and vast amounts of data concerning various aspects of the model’s
performance displayed. Rarely are these tools of use when attempting to convey, to the
non-expert, the dynamics of cognitive models. Instead, cartoons of network performance
are sometimes used when presenting to the modeling novices. These caricatures of network
performance, while convenient, have a few drawbacks. For instance, these cartoons can be
time consuming and tedious to prepare. More importantly, they can hide actual model be-
havior from the audience and rely instead on the interpretation of the presenter to convey
the model’s behavior. NAV addresses these issues by giving the researcher an easy-to-use
tool to build custom animations of actual model behavior, which can then be transformed
into an easily embedded standard movie file (e.g., MPEG) for presentation purposes. NAV
was designed be general in nature, not having any preference from one particular simula-
tion package to any other. This generality allows NAV to be used to illustrate any model
that both possesses a graphical structure and relies on numerical values associated with
graph nodes (e.g., node activation levels) in order to function. For example, NAV supports
60

a wide range of types of models including spreading activation networks and computational
neuroscience models.
Features
NAV employs an intuitive “drawing program”-like interface, allowing for the creation
and placement of graphical objects such as nodes, layers (groups of nodes), and arrows
or “links” that can be conceptualized as connections between nodes or layers. These ob-
jects, alone, are simple graphical items, without intrinsic function. The user can associate
the nodes with entries in an actual simulation data file (generated outside of NAV in the
user’s simulation package of choice). Once the association between graphical objects and
model data has been accomplished, NAV provides a wide range of graphical display op-
tions which can be used to control how the graphical properties of the nodes will change
over time —governed by each nodes associated activity from the uploaded simulation data
file. NAV can be used to generate animations of actual activation dynamics of model per-
formance, which can then be exported to a standard movie file format (e.g., MPEG) for
easy embedding in presentation slides.
An important feature of NAV is the ability to generate time-varying graphical objects
besides a simple set of connected nodes, allowing for multiple views on the cognitive
model (Wejchert and Tesauro, 1990). The user has the option of adding textual labels and
graphical “sprites” (images) to help further explain features of the model as they develop
over time. As an example, a computational model of face recognition may have inputs
which are some encoding of the features of different faces. This input by itself, would be
unintelligible to a novice, as well as hard to grasp with a simple verbal description. In-
stead, NAV provides a way to associate and display an actual image of the face which is
being encoded across the inputs of the network. By showing actual images of the faces, a
non-expert will likely gain a better understanding of the information processing dynamics
of this system.
The arrows or “links” within NAV are used to represent weighted connections between
61

nodes and layers of nodes. In many computational models, such as connectionist archi-
tectures, these weights will adjust and change their values as the model develops. NAV
supports the animation of weight changes over time in much the same manner that it sup-
ports the display of node activation dynamics. Connection weight dynamics can be visu-
alized within NAV by associating a file of connection weight values (produced from the
users simulation package of choice), and then associating the appropriate graphical “link”
in NAV with the corresponding value from the data file, via an easy-to-use point-and-click
interface. Currently, arrow thickness and color may track dynamic changes in weight val-
ues.
NAV’s main design goals include ensuring that NAV is easy to learn and use, as well
as affording a certain amount of flexibility to the user by not relying on any particular
modeling framework or simulation software for effective use. NAV was developed within
C++ using the Qt user interface tools (Blanchette and Summerfield, 2004). The open source
NAV software runs under Windows, Mac OS X, Linux, and Unix.
User Evaluations
In order to assess the facility with which users learned and manipulated the NAV inter-
face, two user evaluation studies were conducted. The first addressed the overall ease-of-
use and ease of learning of NAV, and was conducted using participants who were novices
in the area of computational modeling. The second study was used to gain insights into the
future development of NAV, as well as its current value as a software tool for visualizing
the activation dynamics of computational cognitive models. In this study, five expert users
were asked to give feedback after using NAV in a tutorial setting.
Novice Study
In the novice study, ten participants who lacked any background in computational mod-
eling of cognitive processes, were asked to complete a tutorial and a small task using the
NAV application. Of this group of ten, 6 were female and 4 were male with a mean age of
62
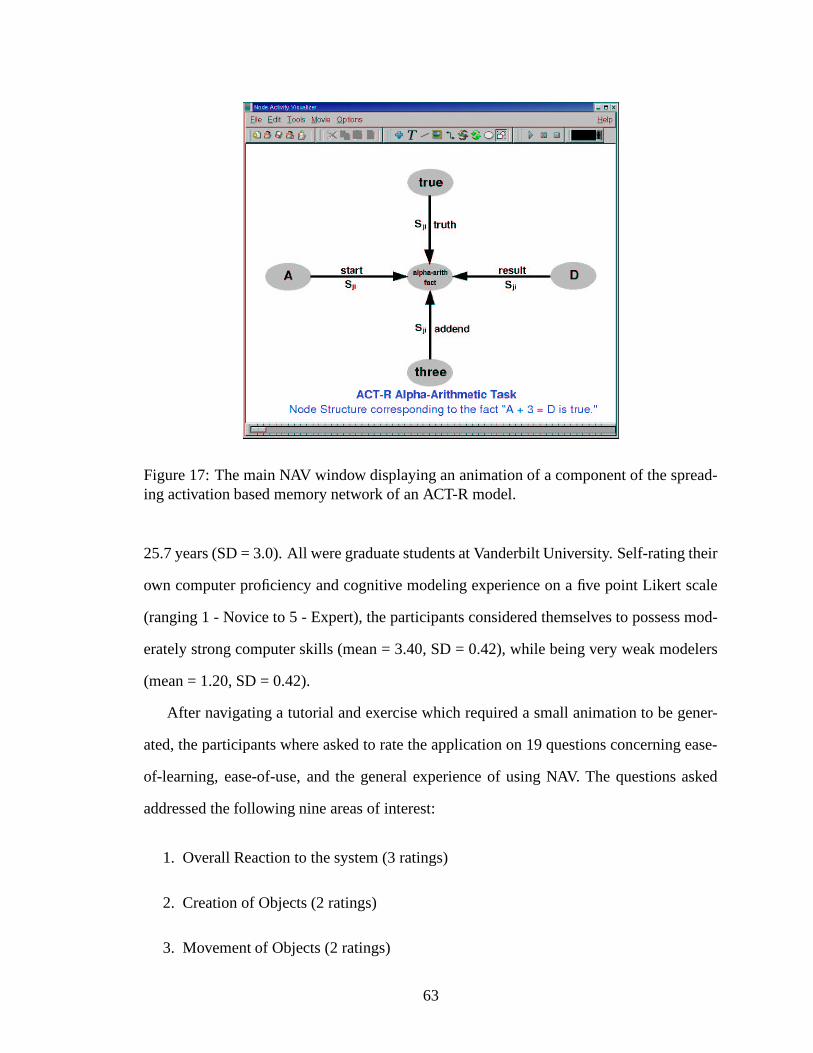
Figure 17: The main NAV window displaying an animation of a component of the spread-ing activation based memory network of an ACT-R model.
25.7 years (SD = 3.0). All were graduate students at Vanderbilt University. Self-rating their
own computer proficiency and cognitive modeling experience on a five point Likert scale
(ranging 1 - Novice to 5 - Expert), the participants considered themselves to possess mod-
erately strong computer skills (mean = 3.40, SD = 0.42), while being very weak modelers
(mean = 1.20, SD = 0.42).
After navigating a tutorial and exercise which required a small animation to be gener-
ated, the participants where asked to rate the application on 19 questions concerning ease-
of-learning, ease-of-use, and the general experience of using NAV. The questions asked
addressed the following nine areas of interest:
1. Overall Reaction to the system (3 ratings)
2. Creation of Objects (2 ratings)
3. Movement of Objects (2 ratings)
63

Figure 18: Novice user evaluation results, broken down by topic area. Each rating is ona five point Likert scale, ranging from “Difficult” (1) to “Easy” (5). Error bars displaystandard errors of the mean.
4. Modifying the Properties of Objects (2 ratings)
5. Associating Activation Data with Nodes (2 ratings)
6. File Management (2 ratings)
7. Building a Movie (2 ratings)
8. Scrolling Through Movie Frames (2 ratings)
9. Learning to Use the Application (2 ratings)
Each rating, was again, on a five point Likert scale ranging from 1 - Difficult to 5 - Easy.
The results across all participants were extremely similar for all questions concerning both
ease-of-use and ease-of-learning. For simplicity, we collapsed the results across both of
these groups in our analysis. The mean results are show in Figure 18. Note that NAV was
rated very highly in all categories for ease-of-use and ease-of-learning.
Expert Study
In an effort to gather information and guidance for future development directions of
NAV, five participants possessing substantial experience with cognitive models were asked
64

to provide feedback after completing the same NAV tutorial and animation construction
task that the novices completed. Each participant was a graduate student at Vanderbilt
University and, at minimum, were required to have completed a course on computational
cognitive modeling or computational neuroscience. After completing the tutorial and task,
each participant was given a questionnaire containing eight fairly general questions. The
responses provided indicate the NAV met its design goals of being easy-to-use and easy-
to-learn, but the experts also had suggested some opportunities for improvement.
All five experts rated the application overall very easy-to-use and easy-to-learn, and also
found the tool useful for visualizing and presenting the activation dynamics of cognitive
models. When asked to volunteer some of the specific benefits of NAV, three of the five
experts pointed to the ability to add dynamic text and images to the animation as a way of
bootstrapping the understanding of a model in a constrained time period. The experts also
pointed out ways in which NAV is different compared to the visualization tools available in
simulation packages with which they were familiar. Two experts asserted that other tools
tend to be more cumbersome than NAV, and three called attention to the inflexibility of
other tools, pointing to the fact that they did not provide expressive enough features to
display the information in the ways which they desired.
The experts made a number of suggestions for future versions, which they felt would
help the usefulness of NAV. Two experts suggested including the ability to generate dy-
namic graphs and plots of the activation in addition to the visualization options available
— a feature currently available in some simulation software. Two of the experts requested
greater support for “undoing” interface actions, as well as the construction of “templates”
which could be used a starting point for common model animations. Other suggestions
concentrated on increasing the amount of on-line help and documentation available, as
well as saving the application upon closing.
All five experts did indicate that they would use the current version of NAV in order
to produce animations for presentations. Two of the five experts also indicated that other
65

simulation packages were needed for a deeper understanding of model dynamics. This fits
into the design goals of NAV, as NAV was intended to help convey useful information of
model dynamics to non-experts through animations, while the simulation tools are geared
more towards the modeling expert.
Conclusion
NAV is an open source software package designed to provide an easy and intuitive way
to build presentation quality animations of actual model dynamics of computational models
of cognitive phenomena. User studies indicate that NAV is indeed easy-to-use and easy-to-
learn, and it provides a novel tool for illustrating these dynamics not available in features of
current simulation packages. NAV has been used to embed animations of model dynamics
in professional presentations.
The current release of NAV, including executables, source code, and documentation,
can be downloaded from the NAV web site:
http://www.vuse.vanderbilt.edu/ noelledc/resources/NAV/
66

BIBLIOGRAPHY
Akshoomoff, N. A. (2000). Neurological underpinnings of autism. In Wetherby, A. M. andPrizant, B. M., editors, Autism Spectrum Disorders: A Transactional DevelopmentalPerspective, volume 9, chapter 8, pages 167–190. Brookes, Baltimore.
Asperger, H. (1991). Autistic psychopathy in childhood. In Frith, U., editor, Autism andAsperger’s Syndrome. Cambridge University Press, Cambridge, UK.
Bachevalier, J. (1994). Medial temporal lobe structures in autism: A review of clinical andexperimental findings. Neuropsychologia, 32:627–648.
Baron-Cohen, S., Leslie, A. M., and Frith, U. (1985). Does the autistic child have a theoryof mind. Cognition, 21:37–46.
Barto, A. G. (1994). Adaptive critics and the basal ganglia. In Houk, J. C., Davis, J. L., andBeiser, D. G., editors, Models of Information Processing in the Basal Ganglia, pages215–232. MIT Press, MIT.
Bennetto, L., Pennington, B. F., and Rogers, S. J. (1996). Intact and impaired memoryfunctions in autism. Child Development, 67:1816–1835.
Berg, E. A. (1948). A simple objective test for measuring flexibility in thinking. Journalof General Psychology, 39:15–22.
Blanchette, J. and Summerfield, M. (2004). C++ GUI programming with QT 3. PrenticeHall, Englewood Cliffs, New Jersey.
Bleuler, E. (1950). Dementia praecox or the group of schizophrenias (j. zinkin trans.). NewYork: International Universities Press. Original work published 1911.
Braver, T. S. and Cohen, J. D. (1999). Dopamine, cognitive control, and schizophrenia:The gating model. Progress in Brain Research, 121:327–349.
Braver, T. S. and Cohen, J. D. (2000). On the control of control: The role of dopaminein regulating prefrontal function and working memory. In Monsell, S. and Driver, J.,editors, Control of Cognitive Processes: Attention and Performance XVIII, chapter 31,pages 713–737. MIT Press, Cambridge, Massachusetts.
Casanova, M., Buuxhoeveden, D., and Gomez, J. (2003). Disruption in the inhibitory ar-chitecture of the cell minicolumn: Implications for autism. The Neuroscientist, 6:209–224.
Chugani, D. C. (2004). Serotonin in autism and pediatric epilepsies. Mental Retardationand Developmental Disabilities Research Reviews, 10(2):112–116.
Cohen, I. L. (1994). An artificial neural network analogue of learning in autism. BiologicalPsychiatry, 36(1):5–20.
67

Cohen, J. D., Dunbar, K., and L., M. J. (1990). On the control of automatic processes:A parallel distributed processing model of the stroop effect. Psychological Review,97(3):332–361.
Cohen, J. D. and Servan-Schrieber, D. (1992). Context, cortex, and dopamine: A con-nectionist approach to behavior and biology in schizophrenia. Psychological Review,99(1):45–77.
Courchesne, E. (1987). A neurophysiological view of autism. In Schopler, E. and Mesibov,G. B., editors, Neurobiological Issues in Autism, pages 258–324. Plenum, New York.
Cushing, P., Adams, A., and Rincover, A. (1983). Research on the education of autisticchildren. Progress in Behavior Modification, 14:1–48.
Dunbar, K. and Macleod, C. M. (1984). Human perception and performance. Journal ofExperimental Psychology, 10:622.
Durstewitz, D., Seamans, J. K., and Sejnowski, T. J. (2000). Dopamine-mediated stabi-lization of delayperiod activity in a network model of prefrontal cortex. Journal ofNeurophysiology, 83:1733–1733.
Eigsti, I.-M. and Shapiro, T. (1995). A systems neuroscience approach to autism: biologi-cal, cognitive, and clinical perspectives. Current Opinion in Neurology, 8:134–138.
Fellous, J. M., Wang, X. J., and Lisman, J. E. (1998). A role for nmda-receptor channels inworking memory. Nature Neuroscience, 1:273–275.
Fernell, E., Watanabe, Y., Adolfsson, I., Tani, Y., Bergstrom, M., Hartvig, P., Lilja, A.,von Knorring, A. L., Gillberg, C., and Langstrom, B. (1997). Possible effects oftetrahydrobiopterin treatment in six children with autism–clinical and positron emis-sion tomography data: a pilot study. Developmental Medicine and Child Neurology,39(5):313–318.
Filipek, P. A. (1995). Quantitative magnetic resonance imaging in autism: The cerebelarvermis. Current Opinion in Neurology, 8:134–138.
Frith, U. (1989). Autism: Explaining the Enigma. Blackwell, Oxford.
Frith, U. and Hill, E. (2003). Understanding autism: insights from mind and brain. Philo-sophical Transactions: Biological Sciences, 358(1430):281–289.
Goldman-Rakic, P. S. (1987). Circuitry of primate prefrontal cortex and regulation ofbehavior by representational memory. In Plum, F., editor, Handbook of Pysiology -The nervous system, pages 373–417. American Physiological Society, Bethesda, MD.
Gustafsson, L. (1997). Inadequate cortical feature maps: A neural circuit theory of autism.Biological Psychiatry, 42(12):1138–1147.
Happe, F. (1997). Central coherence and theory of mind in autism: reading homographs incontext. Journal of Developmental Psychology, 15:1–12.
68

Happe, F. (1999). Autism: Cognitive deficit or cognitive style? Trends in CognitiveSciences, 3(6):216–222.
Henik, A., Singh, J., Beckley, D. J., and Rafal, R. (1993). Disinhibition of automatic wordreading in parkinson’s disease. Cortex, 29(4):589–599.
Hill, E. (2004). Executive dysfunction in autism. Trends in Cognitive Sciences, 8(1):26–32.
Hughes, C., Russell, J., and Robbins, T. W. (1994). Evidence for executive dysfunction inautism. Neuropsychologia, 32(4):477–492.
Joseph, R. M. (1999). Neuopsychological frameworks for understanding autism. Interna-tional Review of Psychiatry, 11:309–325.
Kanner, L. (1943). Autistic disturbances of affective contact. Nervous Child, 2:217–250.
Kohonen, T. (1984). Self-Organization and Associative Memory. Berlin: Springer Verlag.
Kriete, T., House, M., Bodenheimer, B., and Noelle, D. C. (in press). Nav: A tool for pro-ducing presentation-quality animations of graphical cognitive model dynamics. Be-havior Research Methods, Intruments, and Computers. in press.
MacDonald, A. W. I., Cohen, J., Stenger, V., and Carter, C. S. (2000). Dissociating therole of the dorsolateral prefrontal and anterior cingulate cortex in cognitive control.Science, 288(5472):1835–1838.
Martineau, J., Barthelemy, C., Jouve, J., Muh, J. P., and Lelord, G. (1992). Monoamines(serotonin and catecholamines) and their derivatives in infantile autism: age-relatedchanges and drug effects. Developmental Medicine and Child Neurology, 34(7):593–603.
McClelland, J. L. (2000). The basis of hyperspecificity in autism: A preliminary suggestionbased on properties of neural nets. Journal of Autism and Developmental Disorders,30(5):497–502.
McGrath, J., Scheldt, S., Welham, J., and Clair, A. (1997). Performance on tests sensitiveto impaired executive ability in schizophrenia, mania and well controls: acute andsubacute phases. Schizophrenia Reseach, 26:127–137.
Miller, E. K. and Cohen, J. (2001). An integrative theory of prefrontal cortex function.Annual Review of Neuroscience, 24:167–202.
Minshew, N. J., Meyer, J., and Goldstein, G. (2002). Abstract reasoning in autism: adissociation between concept formation and concept identification. Neuropsychology,16(3):327–334.
Montague, P. R., Dayan, P., and Sejnowski, T. J. (1996). A framework for mesencephalicdopamine systems based on predictive hebbian learning. Journal of Neuroscience,16:1936–1947.
69

Nieoullon, A. (2002). Dopamine and the regulation of cognition and attention. Progress inNeurobiology, 67(1):53–83.
O’Loughlin, C. and Thagard, P. (2000). Autism and coherence: A computational model.Mind and Language, 15(4):375–392.
O’Reilly, R. C. (1996). The Leabra Model of Neural Interactions and Learning in theNeocortex. PhD thesis, Carnegie Mellon University, Pittsburgh.
O’Reilly, R. C. and Munakata, Y. (2000). Computational Explorations in Cognitive Neu-roscience: Understanding the Mind by Simulating the Brain. MIT Press, Cambridge,Massachusetts.
O’Reilly, R. C., Noelle, D. C., Braver, T. S., and Cohen, J. D. (2002). Prefrontal cortexand dynamic categorization tasks: Representational organization and neuromodula-tory control. Cerebral Cortex, 12(3):246–257.
Ozonoff, S. and Jensen, J. (1999). Specific executive function profiles in three neurodevel-opmental disorders. Journal of Autism and Developmental Disorders, 29(2):171–177.
Ozonoff, S., Pennington, B. F., and Rogers, S. J. (1991). Executive function deficits inhigh-functioning autistic individuals: Relationship to theory of mind. Journal of ChildPsychology and Psychiatry and Allied Disciplines, 32:1081–1105.
Ozonoff, S. and Strayer, D. (1997). Inhibitory function in non-retarded children withautism. Journal of Autism and Developmental Disorders, 27(1):59–77.
Piven, J., Arndt, S., Bailey, J., and Andreasen, N. (1996). Regional brain enlargementin autism: a magnetic resonance imaging study. Journal American Academy ChildAdolescent Psychiatry, 35(4):530–536.
Posey, D. J. and McDougle, C. J. (2000). The pharmacotherapy of target symptoms as-sociated with autistic disorder and other pervasive developmental disorders. HarvardReview of Psychiatry, 8(2):45–63.
Prior, M. R. and Hoffman, W. (1990). Neuropsychological testing of autistic childrenthrough an exploration with frontal lobe tests. Journal of Autism and DevelopmentalDisorders, 20:581–590.
Robbins, T. W. (1997). Integrating the neurobiological and neuropsychological dimensionsof autism. In Russell, J., editor, Autism as an Executive Disorder, chapter 2, pages 21–53. Oxford University Press, Oxford.
Rodier, P. M., Ingram, J. L., Tisdale, B., Nelson, S., and Romana, J. (1996). Embryologicalorigin for autism: Developmental anomalies of the cranial nerve motor neclei. Journalof Comparative Neurology, 370:247–261.
Rougier, N. P., Noelle, D. C., Braver, T. S., Cohen, J. D., and O’Reilly, R. C. (in press).Prefrontal cortex and flexible cognitive control: Rules without symbols. in press.
70

Russell, J., Jarrold, C., and Hood, B. (1999). Two intact executive capacities in childrenwith autism: implications for the core executive dysfunctions in the disorder. Journalof Autism and Developmental Disorders, 2:103–112.
Shah, A. and Frith, U. (1983). An islet of ability in autistic children: a research note.Journal of Child Psychology and Psychiatry, 24(4):613–20.
Shultz, W., Dayan, P., and Montague, P. R. (1997). A neural substrate of prediction andreward. Science, 275:1593–1599.
Stroop, J. R. (1935). Studies of interference in serial verbal reactions. Journal of Experi-mental Psychology, 28:643–662.
Stuss, D. T., Floden, D., Alexander, M. P., Levine, B., and Katz, D. (2001). Stroop per-formance in focal lesion patients: dissociation of processes and frontal lobe lesionlocation. Neuropsychologia, 39(8):771–786.
Stuss, D. T., Levine, B., Alexander, M. P., Hong, J., Palumbo, C., Hamer, L., Murphy, K. J.,and Izukawa, D. (2000). Wisconsin card sorting test performance in patients withfocal frontal and posterior brain damage: effects of lesion location and test structureon separable cognitive processes. Neuropsychologia, 38(4):388–402.
Turner, M. (1999). Generating novel ideas: Fluency performance in high-functioning andlearning disabled individuals with autism. Journal of Child Psychology and Psychia-try, 40:189–201.
Vilensky, J. A., Damasio, A. R., and Maurer, R. G. (1981). Gait disturbances in patientswith autistic behavior: a preliminary study. Archives of Neurology, 38(10):646–649.
Vogeley, K., Bussfeld, P., Newen, A., Herrmann, S., Happe, F., Falkai, P., Maier, W., Shah,N., Fink, G. R., and Zilles, K. (2001). Mind reading: neural mechanisms of theory ofmind and self-perspective. Neuroimage, 14(1):170–181.
von der Malsburg, C. (1973). Self-organization of orientation sensitive cells in the striatecortex. Kybernetik, 14:85–100.
Wejchert, J. and Tesauro, G. (1990). Neural network visualiztion. In Touretzky, D. S.,editor, Advances in neural information processing systems 2, pages 456–472. MorganKaufmann, Denver.
Witkin, H. A., Oltman, P. K., Raskin, E., and Karp, S. (1971). A Manual for the EmbeddedFigures Test. Consulting Psychologists Press, Palo Alto, California.
71