Embed Size (px)
Citation preview

COMPUTER SIMULATION TO GUIDE CHOICE OF BREEDING STRATEGIES FOR
MARKER-AIDED MULTIPLE TRAIT INTEGRATION IN MAIZE
BY
TING PENG
THESIS
Submitted in partial fulfillment of the requirements
for the degree of Master of Science in Crop Sciences
in the Graduate College of the
University of Illinois at Urbana-Champaign, 2012
Urbana, Illinois
Adviser:
Associate Professor Rita H. Mumm

ii
ABSTRACT
With the rapid rate of adoption by farmers worldwide of crop varieties containing
multiple value-added traits, mainly genetically modified traits, as many as 15 to 20 transgenic
events may be offered in new maize hybrids by 2030 (Que et al. 2010; Fraley 2012). Multiple
Trait Integration (MTI) is designed to integrate the specific transgenic events conferring the
value-added trait phenotypes into the elite genetic package represented by the target hybrid,
regaining the performance attributes of the target hybrid along with reliable expression of the
value-added traits. From a breeding standpoint, MTI involves four steps: Single Event
Introgression, Event Pyramiding, Trait Fixation, and Version Testing. We considered the
breeding process to introgress 15 transgenic events into a target maize hybrid, incorporating 8
into the female parent and 7 into the male parent, to design a comprehensive and efficient
approach to MTI overall.
Focusing on the first step, Single Event Introgression which is conducted in parallel
streams to convert a given recurrent parent for individual events, the primary breeding goal is
to minimize residual non-recurrent parent germplasm remaining from the trait donor,
especially in the chromosomal proximity to the event (i.e. linkage drag). Setting a defined
lower limit of 96.66% recurrent parent (RP) germplasm recovery (i.e. ≤ 120 cM non-recurrent
parent germplasm), conversion for 15 events requires the final selections in Single Event
Introgression to have < 8 cM total amount of non-recurrent parent germplasm across the
genome with ~ 1 cM non-recurrent parent germplasm in the 20 cM region flanking the event.
Using computer simulation, we sought to identify optimal breeding strategies for Single Event
Introgression in terms of selection scheme, required population size, and selection intensity.

iii
In addition, strategies for choice of donor parent to facilitate conversion efficiency and quality
were evaluated. Selection schemes classified as three-stage, modified two-stage, and
combined selection conducted from BC1 through BC3, BC4, or BC5 were compared using a
moderate constant population size. Criteria for evaluating efficiency included amount of total
residual non-recurrent parent germplasm, amount of non-recurrent parent germplasm
remaining in the chromosomal region flanking the event in the finished conversion, total
number of marker data points required, total population size across generations, and total
number of generations. One selection scheme successfully met the defined goals for this
breeding step. It involved five generations of marker-aided backcrossing, with BC1 through
BC3 selected for the event of interest and minimal linkage drag at population size of 600, and
BC4 and BC5 selected for the event of interest and recovery of the RP germplasm across the
genome at population size of 400; selection intensity was set at 0.01 for all generations.
Furthermore, two essential criteria for choosing an optimal donor parent for a given RP were
established: introgression history showing reduction of linkage drag to ~ 1 cM in the 20 cM
region flanking the event and genetic similarity between the RP and potential donor parents.
Computer simulation demonstrated that a ‘quality’ single event conversion can be
accomplished earlier than BC5 given a donor parent with modest levels of genetic similarity.
This study lays the groundwork for a comprehensive approach to MTI by providing
appropriate starting materials with which to proceed with Event Pyramiding and Trait
Fixation.
Next, we focused on the second and third steps in MTI: Event Pyramiding and Trait
Fixation. Using computer simulation, we aimed to 1) identify an optimal breeding strategy for

iv
pyramiding of 8 events into the female RP (and 7 in the male RP), and 2) evaluate breeding
strategies for Trait Fixation to create a ‘finished’ conversion of each RP homozygous for all
events in an efficient and effective manner. Building on work by Ishii and Yonezawa (2007a),
a symmetric crossing/selfing schedule for Event Pyramiding was devised for stacking 8/7
events in a target RP. Trait Fixation breeding strategies considered self-pollination and
doubled haploidy approaches to achieve homozygosity as well as seed chipping and tissue
sampling approaches to facilitate genotyping. With self-pollination approaches, 2 generations
of selfing rather than 1 for Trait Fixation (i.e. ‘F2 enrichment’ as per Bonnett et al. (2005))
were utilized to eliminate bottlenecking due to extremely low frequencies of desired
genotypes in the population. The efficiency indicators such as total number of population size
across generations (NT), total number of marker data points (MDP), total number of
generations (GEN), number of seeds sampled by seed chipping (NSC), and number of plants
requiring tissue sampling (NTS), number of pollinations (NP) (i.e. selfing and crossing) were
considered in comparisons of breeding strategies. A breeding strategy involving seed chipping
and two-generation self-pollination approaches (SC+SELF) was determined to be the most
efficient breeding strategy considering GEN and resource requirements such as MDP, NT,
NSC, NTS, and NP. Doubled haploid may have limited utility in Trait Fixation for MTI under
the defined breeding scenario. This outcome paves the way for optimizing the last step in the
MTI process, Version Testing, which involves hybridization of female and male RP
conversions to create versions of the converted hybrid for performance evaluation and
commercial release.

v
ACKNOWLEDGMENTS
I would like first thanK Dr. Rita H. Mumm for acting as my advisor and for her
committed guidance and assistance during the research and preparation of my thesis. I would
also like to thank Dr. Richard Johnson, Dr. Mark Mikel and Dr. Jack Juvik for serving on my
graduate committee and providing helpful suggestions and comments on this project.
Secondly, I would like to extend my thanks to Monsanto Company for supporting my
graduate study as Monsanto Fellows in Plant Breeding through a gift of Monsanto Company
to the University of Illinois. I also want to thank Dr. Jason Bull, Dr. Andrew Davis, Dr. Asif
Chinwalla and Dr Christopher Lockwood from Monsanto for their time and insightful input in
this project. I want to thank my labmates Xiaochun Sun, Brian Mansfield, and Joshua Macke
for their help with this project and other events. Last but not least, I want to thank my family
and friends for their support and love.

vi
TABLE OF CONTENTS
PREFACE ................................................................................................................................. vii
CHAPTER 1 – COMPUTER SIMULATION FOR MARKER-AIDED MULTIPLE TRAIT
INTEGRATION IN MAIZE I) SINGLE EVENT INTROGRESSION .................................... 1
1.1 Introduction ....................................................................................................................... 1
1.2 Materials and Methods ................................................................................................... 11
1.3 Results and Discussion ................................................................................................... 18
1.4 Conclusions ..................................................................................................................... 27
CHAPTER 2 – COMPUTER SIMULATION FOR MARKER-AIDED MULTIPLE TRAIT
INTEGRATION IN MAIZE II) EVENT PYRAMIDING AND TRAIT FIXATION ............ 30
2.1 Introduction ..................................................................................................................... 30
2.2 Materials and Methods ................................................................................................... 37
2.3 Results and Discussion ................................................................................................... 43
2.4 Conclusions ..................................................................................................................... 48
REFERENCES ......................................................................................................................... 49
ABBREVIATIONS .................................................................................................................. 53
FIGURES ................................................................................................................................. 55
TABLES ................................................................................................................................... 62

vii
PREFACE
The advantages and popularity of transgenic traits have fueled the fast-growing trend
to ‘stack’ more and more valued-added traits, especially transgenic traits, into new maize
hybrids. In developing a comprehensive and optimized breeding process to integrate the
specific transgenic events conferring the value-added trait phenotypes into the elite genetic
package represented by the target hybrid, regaining the performance attributes of the target
hybrid along with reliable expression of the value-added traits is critical, especially for the
seed industry. Using maize as a model crop, this thesis is the first work of its kind, aiming to
develop an optimal and comprehensive system for Multiple Trait Integration (MTI) under a
realistic breeding scenario on an industrial scale. Given the MTI breeding process with four
steps we have defined as Single Event Introgression, Event Pyramiding, Trait Fixation, and
Version Testing, this thesis focused on optimization of the first three breeding steps using
computer simulation and numerical methodology. The research project out of which this
thesis originated also delved into Version Testing, the outcome of which was reported by
another graduate student involved in the project (Sun 2012 Chapter 4).
Chapter 1 of this thesis mainly centers on exploring the optimal breeding strategy for
the first and most crucial step of MTI – Single Event Introgression. This step is critical in
MTI because success is dependent upon elimination of the vast majority of residual
germplasm from the event donor which can hamper recovery of equivalent performance in the
converted hybrid. Chapter 2 mainly centers on the optimized breeding strategies for
pyramiding events in the parents of the target hybrid and then recovering versions of the
recurrent parent conversions that are homozygous for all events.

viii
This work employed a realistic case study in maize. Its outcome demonstrates the
feasibility of integrating as many as 15 events in a target hybrid and lays a solid theoretical
foundation for future breeding practices employable in industry, academia, or government.

1
CHAPTER 1 – COMPUTER SIMULATION FOR MARKER-AIDED MULTIPLE
TRAIT INTEGRATION IN MAIZE I) SINGLE EVENT INTROGRESSION
1.1 Introduction
Since the commercial debut of transgenic crops in the 1990s (Koziel et al. 1993;
Delannay et al. 1995; Spencer et al. 2000), the demand for genetically modified (GM) crops
has risen dramatically, driven mainly by rapid adoption by U.S. farmers. The adoption rate for
GM corn increased from 25% in 2000 to 88% in 2010 in U.S. (USDA ERS 2012). In addition,
we have witnessed a general trend toward GM crops that offer more than one value-added
trait per cultivar. For example, historical data provided by USDA indicates that the prevalence
of ‘stacked’ trait corn hybrids has increased from 1% in 2000 to 49% in 2010 in the U.S.
(USDA ERS 2012). Beyond the U.S., the adoption rates in other countries, especially in some
developing countries, such as China and Brazil, are also very high as the benefits of increased
farm income (e.g. $5 billion globally in 2005) and the decreased environment impact
associated with pesticide usage and greenhouse gas emission from agriculture (e.g. GM crop
adoption helped with 4 million cars removing globally in 2005) are quite attractive (Brookes
and Barfoot 2006).
The array of value-added traits has been expanding and now includes herbicide
tolerances, insect resistances, drought tolerance, nitrogen use efficiency, yield enhancement,
grain composition modification (e.g. amino acid composition, protein content, and oil
composition), disease resistances, grain processing (e.g. phytase for animal feed and amylase
for corn ethanol), and others (Information Systems for Biotechnology, 2012). Furthermore,

2
for traits which may elicit a resistance response such as insect resistance, the trend has been to
combine multiple modes of action to stave off development of resistance (Que et al. 2010).
This trend toward stacking of more and more value-added traits is expected to continue and
even escalate. By 2030, it is predicted that as many as 15 to 20 value-added traits may be
offered in new corn varieties (Que et al. 2010; Fraley 2012).
With such great benefits both economically and environmentally, transgenic trait
options will be an important component in crop genetic improvement to close the yield gap.
To feed the global population of 9 billion people using essentially the same amount of land
and less water, the scientific community has committed to double or even triple various crop
yields in next few decades. GM traits will be a key component to achieving this goal, along
with conventional breeding practices, advanced breeding technologies (e.g. QTL mapping,
genomic-assisted selection), and improved agricultural practices (e.g. increased plant density,
optimized tillage practices) (Monsanto Company 2012).
Nowadays, marker technology is a widely used as an aid in introgressing target
genes/events (an event is defined as the unique DNA sequence inserted in the host genome
through transformation and the precise point of insertion (Mumm and Walters 2001)) into a
target hybrid or, more specifically, the recurrent parent (RP) lines used to produce the hybrid.
In this study, with maize as a model crop, we evaluate breeding strategies for integrating up to
15 transgenic events in a given hybrid via computer simulation. Although we have focused on
transgenic events, the results could be easily extended to other types to target genes including
major quantitative trait loci (QTL) (Ribaut and Ragot 2007) and genes from exotic sources
(Young and Tanksley 1989; Bernardo 2009). The overall objective of MTI is to integrate the

3
specific transgenic events conferring the value-added trait phenotypes into the elite genetic
package represented by the target hybrid, regaining the performance attributes of the target
hybrid along with reliable expression of the value-added traits. Typically, molecular markers
are utilized in MTI for efficiency, speed, and improved probability of recovering equivalent
performance in the converted hybrid relative to the unconverted target hybrid.
The MTI process in maize is comprised of four essential steps: Single Event
Introgression, Event Pyramiding, Trait Fixation, and Version Testing (performance testing of
various versions of a given target hybrid conversion) (Figure 1). For Single Event
Introgression, the breeding goal is to introgress a single event from a donor parent into the
RP, achieving a high rate of recovery of RP germplasm. With MTI, Single Event
Introgression streams for a target RP are designed to be conducted in parallel. The goal for
Event Pyramiding is to assemble all the specified events in the target RP by crossing single
event conversions. All event loci are in heterozygous state at the close of the first two steps.
The goal for Trait Fixation is to recover at least one line which is homozygous for all events
loci to ensure stable expression of value-added traits. In order to minimize the risk of failure
to recover the target hybrid performance, typically multiple versions of the RP conversions
are generated and yield tested (Mumm and Walters 2001). Conversions of the parent lines are
hybridized to produce various versions of the converted target hybrid, which are then
evaluated as to performance relative to the unconverted target hybrid. The goal for Version
Testing is to ensure that all the characteristics of the target hybrid have been recovered in at
least one version of the converted target hybrid.
4
Success of MTI is achieved with the recovery of at least one version of the converted
target hybrid with equivalent performance to the unconverted target hybrid and stable
expression of all the value-added traits. Thus, a ‘quality’ conversion is necessary. Without
achieving this outcome, all upstream efforts and resource investments are of no/limited usage.
The probability of success depends greatly on the amount of non-recurrent parent (NRP)
germplasm that can be eliminated in MTI process. Several studies (Stam and Zeven 1981;
Young and Tanksley 1989; Hospital et al. 2001) have shown that the majority of the residual
NRP germplasm in given RP conversion is closely linked to the target gene (or event) being
introgressed, a phenomenon known as linkage drag due to the low probability of double
recombinant very near the target loci. For this reason, a number of studies e.g. Ishii and
Yonezawa (2007a) and Frisch and Melchinger (2001), have emphasized the need for single
event introgression prior to stacking. Our simulation study confirmed this finding. Computer
simulation demonstrated that the effectiveness of linkage drag elimination is much less when
donors carrying multiple events are utilized, holding effective population size and number of
generations of breeding equal (data not shown).
With MTI, the issue of linkage drag is magnified in proportion to the number of events
being introgressed. The residual NRP germplasm may contain the deleterious genes, genes
associated with negative interactions, or germplasm composition from a different heterotic
group that may impact expression of heterosis in the converted hybrid. There are three
potential scenarios that can affect the ability to achieve this goal: use of a non-elite
transformation line, e.g. Hi-II derived from A188 and B73 (Armstrong et al. 1991);
somaclonal variation resulting from tissue culture during the transformation process; and use

5
of a donor parent from the opposite heterotic group (e.g. donor from the female heterotic
group to convert a line from the male heterotic group). Nowadays, elite transformation lines
are largely used in industry introgression breeding programs. The latter situation is
particularly pertinent to the development of new events. Since all events originate from a
single T0 plant, if some traits are to be introgressed into the opposite heterotic group, there is
a greater risk of failure to recover a RP conversion with equivalent performance. One
approach is to designate an upper bound for the amount of residual NRP germplasm in the
converted target hybrid consistent with a high probability of recovering equivalent yield
performance. For example, if conversion for a lone event demands 97.5% RP germplasm
recovery to obtain equivalent yield performance, this equates to approximately 89.9 cM NRP
germplasm in heterozygous state in the final selected conversion (Equation 5). If the same
breeding strategy is used for stacking 15 target events, the final selected conversion genotype
from Single Event Introgression would have 15 times of the NRP germplasm, i.e. 1348.5 cM
of NRP in heterozygous state overall, which is likely to impact recovery of the target hybrid
performance. Thus, when stacking events, a stricter selection requirement relative to single
trait conversion is demanded to have a high likelihood of recovering equivalent performance.
This translates to high stringency applied in Single Event Integration in MTI. For example, if
a threshold of ≥ 96.66% RP germplasm recovery (~ 120 cM of NRP germplasm) is required
to achieve equivalent performance in the converted hybrid, the outcome of the Single Event
Introgression of the RP which is conducted in parallel streams must achieve ≤ 8 cM NRP
germplasm, which is consistent with 99.78% RP germplasm recovery. Under such strict

6
selection criterion, reduction of linkage drag becomes the hurdle to fully recover the RP
germplasm.
Some studies have proposed to select against linkage drag in early backcross
generations to take advantage of the relatively larger genetic variation (Frisch et al. 1999a;
Herzog and Frisch 2011). Frisch (2005) proposed various selection schemes for use in
marker-aided backcross breeding, mainly two-stage selection, three-stage selection and four-
stage selection. Two-stage selection is the selection scheme consisting of selection for the
target gene or event of interest and for RP germplasm recovery (background selection).
Three-stage selection strategy consists of one step of target gene selection; one step of
selection against linkage drag in the 20 cM region flanking the transgenic event (LDS)
facilitated by two markers flanking the target gene and last step of RP germplasm recovery
selection by markers across the genome. Four-stage selection dissects the background
selection in the three-stage selection into two steps: RP germplasm recovery selection on the
carrier chromosome (chromosome with the target gene) and RP germplasm recovery selection
on non-carrier chromosomes (all chromosomes in the genome except the carrier
chromosome). Comparing with two-stage selection, the three-stage and four-stage selection
methods result in the same or slightly smaller RP germplasm recovery but can help with
saving marker data points (if single marker system is used and only un-recovered markers are
genotyped in RP germplasm recovery selection). Frisch et al. (1999a) recommended using a
three-stage selection or four-stage selection method to reduce the linkage drag. Likewise,
Falke et al. (2009) concluded that a three-stage selection method is the most efficient in
reducing linkage drag.
7
Population size and selection intensity per cycle also impact the ability to recover a
‘quality’ conversion. Generally, the higher the population size and selection intensity are, the
greater the response to selection. Ribaut et al. (2002) found that the optimal selection response
occurs when the effective population size is smaller than 100 in BC1 with one target gene for
two-stage selection method, and the selection response is diminished when the effective
population size over 100. Frisch et al. (1999a) favored high selection intensities and tightly
associated markers for the gene (or event) to be introgressed, especially if selection against
linkage drag is a priority.
Introgressing as many as 15 events is complicated as there are numerous ways to
achieve this breeding goal. In addition to a high probability of success in recovering a
converted target hybrid with equivalent performance to its unconverted counterpart, other
considerations, namely time to market and resource allocation, must be considered in
choosing a breeding strategies for MTI. A breeding strategy, therefore, must address
parameters including desired outcomes each generation, selection scheme, number of
backcross generations, number of marker data points required, population size, and selection
intensity in each generation. We aim to identify an optimal overall breeding strategy for a
comprehensive approach across the entire process of MTI for 15 events.
Computer simulation is widely used in plant breeding to facilitate the selection of
breeding parents, predict line performance, and guide the choice of breeding strategies.
Computer simulation can be useful in identifying optimal breeding strategies to efficiently
deal with critical issues and meet the specified breeding goals and allows for tailoring to
address critical issues pertinent to each step in the MTI process. It facilitates comparisons to

8
evaluate overall efficiencies in breeding strategies, which then can be incorporated into
product pipeline operations to improve speed to market, rate of gain, resource savings, and
innovative outcomes (Sun et al. 2011).
Numerous computer simulation studies have been conducted to optimize breeding
strategies for marker-aided backcross breeding, with the aim to reduce the number of
generations required, minimize total population size, and minimize the number of marker data
points (see reviews by Visscher et al. 1996; Ribaut et al. 2002; Frisch 2005). Ribaut et al.
(2002) concluded that to achieve more than 99% of RP germplasm recovery, marker-aided
selection must be applied to all backcross generations. Others highlighted the value of
applying marker-aided selection in later backcross generations rather than earlier (Hospital et
al. 1992; Frisch et al. 1999a; Ribaut et al. 2002). However, most studies have not considered
MTI and none to date have considered the scenario involving introgression of 15 events.
Furthermore, previous studies may not have taken into account the availability of very dense
marker coverage of the genome, allowing for deployment of strategies that might not
otherwise be possible, such as intense selection in the chromosomal region flanking the event
insertion by dense markers. In addition, there has been little work published to assess choice
of donor parent in trait integration. Yet, within a seed company, there may be numerous
options available to a breeder in choosing a donor for a particular event, particularly as time
from market launch of the event increases.
The objectives of this study were two-fold, first, to identify optimal breeding strategies
for MTI using computer simulation, mainly focusing on efficiencies for Single Event
Introgression to achieve successful conversion of a target hybrid for 15 events. Criteria for

9
evaluating efficiency include amount of total residual NRP germplasm in the finished
conversion (Total NRP) , amount of NRP germplasm remaining in the chromosomal region
flanking the event insertion site (FR NRP),total number of marker data points (MDP), total
population size across generations (NT), and total number of generations. Two other papers
which consider other steps in the MTI process (see Chapter 2; Sun 2012 Chapter 4) are
included in this series that centers on a comprehensive approach to MTI of 15 events, a
realistic objective for the not-too-distant future in plant breeding. Secondly, we proposed to
evaluate strategies for choice of donor parent to facilitate conversion efficiency and quality
based on introgression history and genetic similarity between donor parent and recurrent
parent. Criteria for evaluating efficiencies relate to time and resource investment.
We developed a realistic breeding scenario that might be encountered in the seed
industry which assumes that 1) the transformation line is considered to be related to the
female side of the heterotic pattern, 2) some events are required on the male side of the target
hybrid; therefore, to balance out the number of events for introgression into each parent, 8
events will be introgressed in the female RP and 7 events into the male RP; 3) all events are
new so conversions for each event are required; 4) events are not linked genetically (i.e. each
event is locating on different chromosome); 5) FR NRP will be virtually unalterable after
Single Event Introgression step is completed and Event Pyramiding begins; 6) 120 cM of
NRP germplasm (~ 96.66% RP recovery) is the upper limit of residual NRP germplasm
consistent with recapturing target hybrid performance (see Sun 2012 Chapter 4). With 15
events overall, this requires < 8 cM NRP in each Single Event Introgression. Furthermore,
because we assumed that FR NRP will be unalterable after Single Event Introgression step is

10
completed and Event Pyramiding begins, we arbitrarily designated that the threshold for FR
NRP for each Single Event Introgression at ~ 1 cM.

11
1.2 Materials and Methods
Genetic Simulation
Computer simulations in this study were conducted using R statistical software
(2.10.1). Together with Xiaochun Sun working as a PhD student, models of the genome and
the MTI process were developed. The genome model for simulation was constructed
according to the published maize ISU–IBM genetic map, with a total length of 1788 cM (Fu
et al. 2006). Genetic recombination was simulated by Haldane’s mapping function (Haldane
1919; Prigge et al. 2008) and the random walk algorithm (Crosby 1973), assuming no
crossover interference. Genetic markers were evenly spaced across the chromosomes every 1
cM, for a total of 1798 markers across the genome (two end markers were simulated at ends
of each chromosome).
To facilitate selection for each event, a single marker serving as a perfect marker for
the event was utilized. To select against linkage drag, 10 markers spaced 1 cM apart on each
side of every event locus were utilized. This 20 cM region was considered as flanking region
(FR). To track NRP germplasm in selection for RP germplasm recovery, markers distributed
uniformly at 20 cM intervals were utilized. For selection schemes involving more than 1
element of selection in a given generation, event selection (ES), selection against linkage drag
in the 20 cM region flanking the transgenic event (LDS), and selection for the recurrent parent
germplasm recovery (RPS) were conducted in tandem.
Individual plant scores for LDS were calculated according to the Equations 1 and 2
below. The linkage score for one genotype is calculated as the summation across all marker

12
loci i through n of the product of the weight for each LDS marker in the flanking regions
(W_LD) and individual marker genotypic score (G_LD) (Equation 2). The weight of each
LDS marker is calculated by the portion of adjusted distance (Di) (10 cM minus the absolute
distance from the marker to the event loci) to the total markers adjusted distance to the event
position at each side of the event loci (Equation 1).
( ) ( )
∑ ( ( )
(1)
∑ ( ) (2)
In this way, all the marker weights for one side of the flanking region around the event
can be summed to 1 as a way to standardize the LDS scores for each genotype being screened.
And occurrences of recombination which happen near to the event can be given more weight
than occurrences of recombination which happen relatively far from the event. A similar
calculation was used by Hospital et al. (1992). The genotypic score for each individual LDS
marker is counted as 1 if the LDS marker locus is homozygous (1, 1), or 0 if the LDS marker
loci is heterozygous (0, 1). The backcross progeny will be ranked according to the calculated
LDS scores, and then in accordance with the selection intensity, a certain number of
individuals with highest LDS scores will be selected.
Individual plant scores for RPS were calculated as the summation across all marker
loci i through n of the product of the weight (W_RP) and the genotypic score (G_RP) for each
RPS marker (Equation 4). The weight is calculated by the average coverage of the total
genome based on the mean of the distances (left marker interval distance Dil and right marker
interval distance Dir) to the two adjacent markers (Equation 3). As the same with the LDS

13
score calculation, the genotypic value for each RPS markers is counted as 1 if the RPS marker
locus is homozygous (1, 1) and 0 if the RPS marker locus is heterozygous (0, 1).
( )
(3)
∑ ( ) (4)
Various levels of genetic similarity were simulated by adjusting the number of
polymorphic markers and monomorphic markers in the full set. In the study of optimized
breeding strategies for Single Event Introgression, 100% polymorphic markers were used for
simulation and calculation. For choice of donor parent with different genetic similarity level
with recurrent parent, different percentages of polymorphic markers were simulated. Marker
values were set as outlined below for the donor parent and the recurrent parent at each locus.
In order to track event presence among the backcross progeny, the event marker value is set to
1 in the donor parent and 0 in the recurrent parent. For the convenience of tracking the
recurrent parent germplasm recovery in later marker-aided backcross simulation, if the marker
is polymorphic, then the donor parent marker value is 0 and the recurrent parent marker value
is 1. If the marker is monomorphic, then both of the donor parent marker and recurrent parent
marker are 1. Thus, in later backcross progeny population, the desired genotype would be
homozygous (1, 1) for every marker locus except the event marker locus which would be
heterozygous (1, 0).
The process model was used to create progeny genotypes produced through crossing,
backcrossing, or self-pollination and accounts for results of selection in each generation. The
default for population size was 400 progeny, with selection of 4 individuals as parents for the

14
next generation in generations involving LDS or RPS and population size of 8 was simulated
if applying event selection only. To evaluate the effect of population size on efficiency in
Single Event Introgression, population sizes of 20, 50, 100, 200, 400, 600, 800, 1000, 1500
and 2000 were considered. To evaluate the effect of selection intensity on efficiency in Single
Event Introgression, the number of selected individuals was varied. For breeding strategy,
1000 repeats were simulated and the mean was calculated in order to minimize the random
error.
Developing a Reference Population
Before the comparison of breeding strategies, a reference population was created to
serve as a baseline for relative efficacy. We simulated a six generations of backcrossing with
1000 individuals per generation, with selection for only the event of interest, and computed
the mean and the standard deviation of the residual NRP germplasm across the whole
genome, the carrier chromosome (chromosome with the event), the non-carrier chromosomes
(chromosomes other than the one with event) and 20 cM flanking region around the event.
Furthermore, in order to observe the effectiveness of the RPS on linkage drag elimination, we
simulated ten generations of backcrossing with 1000 individuals in each generation, applying
event selection plus recurrent parent (ES+RPS) selection. Likewise, event selection plus
selection against linkage drag (ES+LDS) was applied for 10 backcross generations with 1000
individuals per generation.

15
Comparison of Selection Schemes
Single Event Introgression was simulated using a number of different selection
schemes, including three-stage selection, modified two-stage selection, and combined
selection methods. Three-stage selection (Frisch 2005) features tandem selection first for
event presence, then for favorable recombinants in the flanking region around the event, and
lastly for RP germplasm recovery across the entire genome (ES+LDS+RPS), all in the same
backcross generation. However, while Frisch (2005) chose all the favorable recombinants in
the flanking region and selected one best genotype with highest RP germplasm recovery, our
approach is to select a certain number of best lines based on LDS scores and, out of those
lines, select a certain number of best lines based on RPS scores. To facilitate comparisons one
to another, all selection schemes involve selection of top 2% for LDS scores, from which the
best 50% of individuals for RPS scores would be selected. Modified two-stage selection also
follows Frisch (2005), who proposed to select for event presence and the RP germplasm
recovery in one backcross generation (ES+RPS). In our study, we implemented a modified
two-stage selection which includes either selection for RP germplasm recovery after event
selection (ES+RPS) or linkage drag selection after event selection (ES+LDS). The combined
selection method involves the combination of the modified two-stage selection of linkage
drag selection (ES+LDS) and the three-stage selection method (ES+LDS+RPS) across various
generations of selection. Various selection schemes for three to five backcross generations of
marker-aided backcross breeding program with constant population size of 400 were
evaluated.

16
Criteria considered in comparing efficiencies among selection schemes included: total
amount of residual NRP germplasm in total genome (Total NRP), amount of residual NRP in
the FR (FR NRP), total number of marker data points required (MDP), and total population
size (NT) and number of generations required. Ribaut et al. (2002) defined the efficiency
indicator for each marker-aided backcross breeding program as the ratio between the
resources that need to be invested at each generation and the number of generations required
in order to achieve the selection goal. Other simulation studies (Frisch et al. 1999a; Frisch et
al. 1999b) defined the percentage of the RP germplasm recovered across the genome (RP%)
in selected genotypes as the efficiency indicator. Here, we utilized a similar efficiency
indicator; however, we measured residual non-recurrent parent germplasm and expressed this
statistic as a length in cM rather than a percentage of RP recovery. This addressed our
concerns about the accumulation of NRP germplasm particularly that which originates from
donor parents on the opposite side of the heterotic pattern, in integrating multiple events into
one maize hybrid. For convenience, a formula for conversions between RP% and Total NRP
was created:
Total ( ) ( ) (5)
Also, when we compared results from different selection schemes, we considered NRP
in the flanking region (FR NRP) as the first comparison criterion and NRP in the total genome
(Total NRP) as the second comparison criterion. The reason is that large NRP in the total
genome can be easily reduced by one more generation of backcrossing even without marker-
aided selection whereas large NRP in the flanking region is harder to reduce, requiring large
population sizes and marker-aided selection i.e. more resource expenditure. Finally, we also

17
estimated the total marker data points (MDP) required and total population size (NT) for each
breeding strategy in order to facilitate comparison of the total resource requirement for each
breeding strategy. For each breeding scheme, Total NRP, FR NRP, MDP, and NT were
computed based on 1000 repeats.
Choice of Donor Parent
Introgression history of the target event and genetic similarity between donor parent
and RP were the two main factors evaluated for their impact on choice of donor parent. In
order to observe the impact of the introgression history on linkage drag elimination when
choosing optimal donor parent, ten generations of backcrossing with constant population size
400 by applying only event selection and linkage drag selection were simulated. FR NRP
(cM) in each backcross generation was recorded to observe the linkage drag in the flanking
region. Two levels of genetic similarity between the donor parent and the RP (low genetic
similarity = 0.00, 0.10, 0.20, 0.30, 0.40, 0.50, 0.60, 0.70, and high genetic similarity = 0.80,
0.83, 0.86, 0.89, 0.90, 0.92, 0.95, 0.98) were simulated.
18
1.3 Results and Discussion
Reference Population Baseline
Before the comparison of selection schemes, a reference population comprised of 1000
individuals was created to serve as a baseline for relative efficacy in evaluating breeding
strategies. According to quantitative genetic theory, the residual NRP germplasm decreases by
half with each successive backcross generation while the proportion of recovered RP
germplasm increases in step. Considering a genetic map of 1788 cM length in total (Fu et al.
2006), the mean amount of NRP germplasm (in cM) can be related to the percentage of RP
germplasm recovered in each generation (Table 1). Here, Total NRP is expressed more
conservatively than percentage of RP germplasm, as it considered marker loci for which the
RP conversion in heterozygous state as unconverted loci rather than half converted as with
RP% germplasm recovered. For example, in the BC1 generation, the mean percentage of RP
germplasm recovered is 75% whereas a mean total of 899 cM of the genome still contains
residual NRP germplasm.
Applying selection for only the event to be introgressed (ES) from BC1 through BC10
in the reference population (population size=1000 in each generation, repeats=1000),
computer simulation demonstrated the mean Total NRP is higher than the amount expected
without selection (Tables 1, Table 2a). Furthermore, comparing the amount of NRP
germplasm on the carrier chromosome (chromosome with the event insertion), non-carrier
chromosomes (all other chromosomes except the one with event), and 20 cM flanking region
around the event, the carrier chromosome has a disproportionate amount of residual NRP

19
germplasm (Table 2a). Moreover, the rate at which the NRP decreases with backcrossing was
much slower for the carrier chromosome, particularly for the chromosomal region flanking
the event insertion site (Table 2a). Clearly, selection for the event only, either by perfect
marker or by phenotype, is ineffective in reducing linkage drag as suggested in earlier studies
(e.g. Young and Tanksley 1989). However, marker-aided selection in the flanking region
should be helpful in targeting and eliminating linkage drag.
Applying selection for the event and the RP germplasm recovery in tandem (ES+RPS)
from BC1 through BC10 in the reference population (population size=1000 in each
generation, repeats=1000), computer simulation indicated the effectiveness in reducing the
Total NRP (Table 2b). However, only a small portion of the NRP germplasm decreased
through selection was in the flanking region (Table 2b). A large amount of residual NRP
germplasm remained in the flanking region even at BC10, i.e. of the total residual NRP of
12.07 cM in the genome, 10.72 cM was situated in the flanking region. Thus, marker-aided
selection for ES+RPS was also ineffective in reducing the NRP in the flanking region. Again
it is apparent that marker-aided selection in the flanking region is necessary to effectively
address linkage drag, particularly if there is to be any possibility of achieving the defined
breeding goal of ~1 cM NRP in the flanking region.
Applying selection for the event and against the linkage drag in tandem (ES+LDS)
from BC1 through BC10 in the reference population (population size=1000 at each
generation, repeats=1000), computer simulation demonstrated that if dense markers in the
flanking region around the event (i.e. 1 per cM in the 20 cM region) are used to facilitate the
elimination of linkage drag, the linkage drag can be decreased to approximately 1 cM by BC6

20
or BC7 (Table 2c). However, it is also apparent that the linkage drag is difficult to reduce
further even after many more backcrosses to the RP (data not shown); at BC10, 0.97 cM of
NRP remains in the flanking region on average. Thus, it is clearly possible to reduce linkage
drag to 1 cM in the region flanking the event insertion with marker-aided selection but
difficult to reduce it much beyond 1 cM due to the low chance of recombination and the set
marker solution. Considering the results in Table 2 as baselines and examples of lower
bounds in response to selection against NRP germplasm, a balance between selection for ES,
RPS, and LDS will be crucial to successfully converting a maize hybrid for 15 events with
defined selection goal.
Breeding Strategy Comparison
Optimal Selection Scheme
For simulation, we considered selection schemes classified as three-stage, modified
two-stage, and combined selection conducted from BC1 through BC3, BC4, or BC5 with
constant population size (8/400 individuals) and selection intensity (4 individuals) at each
generation. With three-stage selection, selection for ES, LDS, and RPS were conducted in
tandem in the same generation. With modified two-stage selection, either LDS or RPS was
selected within a generation after ES selection, but not both. With combined selection, one
type of scheme or the other might be conducted within a generation (Tables 3, 4, 5).
Typically, LDS is conducted prior to RPS to take advantage of greater genetic variation in
earlier BC generations and/or in first step of tandem selection (Tanksley et al. 1989; Frisch et

21
al. 1999a; Ribaut et al. 2002). Three generations of marker-aided backcross selection have
been espoused for adequate recovery of the RP genome (Ribaut et al. 2002). However, given
the stringent breeding goal to recover a RP conversion with < 8 cM NRP with ~ 1 cM NRP in
the flanking region at the close of Single Event Introgression, it is apparent that 3 generations
of selection is not sufficient with any selection scheme (Table 3). Among all 9 proposed
breeding schemes implemented through BC3, Total NRP across breeding schemes ranges
from 244.12 cM to 28.75 cM (equivalent to 93.21% RP recovery to 99.20% RP recovery) and
FR NRP across breeding schemes ranges from 10.78 cM to 2.02 cM. Minimal Total NRP
(28.75 cM) was obtained using the modified two-stage breeding scheme
ES+LDS/ES+RPS/ES+RPS from BC1 to BC3 whereas minimal FR NRP (2.02 cM) was
obtained with the combined breeding scheme ES+LDS/ES+LDS/ES+LDS+RPS from BC1 to
BC3 (Table 3). However, none of the 3-generation breeding schemes met the defined
breeding target.
Considering selection schemes involving selection through BC4, 16 breeding schemes were
evaluated (Table 4). The mean Total NRP across breeding schemes ranges from 210.74 cM to
10.62 cM (equivalent to 94.14% RP recovery to 99.70% RP recovery) and FR NRP across
breeding schemes ranges from 10.49 cM to 1.45 cM. Minimal Total NRP (10.62 cM) was
obtained with the modified two-stage breeding scheme ES+LDS/ES+LDS/ES+RPS/ES+RPS
from BC1 to BC4 whereas the minimal FR NRP (1.45 cM) was obtained with the combined
breeding scheme ES+LDS/ES+LDS/ES+LDS/ES+LDS+RPS from BC1 to BC4. Again, with
up to 4 generations of marker-aided selection conducted with constant population size of 400,
the specified breeding target was not realized.

22
Considering selection schemes involving selection for five backcross generations
(Table 5), simulation results from 25 breeding schemes were evaluated for Total NRP, FR
NRP, MDP and N. As shown in the table, Total NRP ranges from 148.28 cM to 7.86 cM
(equivalent to 95.88% RP recovery to 99.78% RP recovery) and FR NRP ranges from 9.73
cM to 1.15 cM. One selection scheme meets the breeding goal of < 8 cM Total NRP (marked
with star in Table 5); however FR NRP is estimated at 1.68 cM. Although there are several
selection schemes that meet the breeding goal of ~ 1 cM FR NRP (the minimal FR NRP is
1.15 cM), none of these is adequate to reduce the Total NRP to <8cM.
Even though the difference between 1 cM and 1.68 cM seems small, if we convert
centimorgan into base pairs of DNA sequence, the small differential would represent
thousands of base pairs. Thus, we consider two strategies to improve this situation: 1) add one
more backcross generation; 2) increase the population size and/or selection intensity. By
adding one more backcross generation of event and linkage drag selection, the breeding goal
for FR NRP could certainly be met (data not shown). However, sometimes adding one more
backcross generation can lead to a year delay in commercial release of the new value-added
product. Thus, we also pursued the latter, evaluating the impact of increased population size
and selection intensity. We simulated the ‘best’ BC5 selection scheme using larger population
sizes in the generations from BC1 to BC3 (population size=600, 800, 1000 per generation)
and population size in the BC4 and BC5 generations at 400 since the Total NRP breeding goal
had been met. As the BC1-BC3 population size was increased to 600, the FR NRP decreased
from 1.68 cM (with population size 400) to 1.18 cM (Table 6). At BC1-BC3 population size
of 1000, the FR NRP was decreased to 1.07 cM. Thus, we concluded that with the modified

23
two-stage selection scheme ES+LDS/ES+LDS/ES+LDS/ES+RPS/ES+RPS from BC1 to BC5
and population sizes of 600 and above for BC1-BC3 and 400 for BC4-BC5, the breeding goal
of < 8 cM Total NRP and ~ 1 cM FR NRP for Single Event Introgression of each of 15 events
could be achieved. To meet the defined breeding goal in this manner, resource requirements
would be increased modestly; MDPs were increased by 6600 and the total population size
(NT) was increased from 2000 to 2600.
Impact of Population Size and Selection Intensity
In general, as population size increases through the backcross process, the Total NRP
and the FR NRP decrease more rapidly. Given the selection scheme
ES+LDS/ES+LDS/ES+LDS/ES+RPS/ES+RPS with 0.01 selection intensity each generation,
the Total NRP target is reached at BC5 with a population size of 400 (Table 5). However,
holding population size constant across backcross generations, the FR NRP target is not
achieved until BC5 with population size of 400 (1.68 cM), until BC3 with population size of
600 (1.20 cM) and 800 (1.15 cM), and until BC2 with population size 2000 (1.23 cM) (Figure
2). Thus, increasing population size could help the breeder to accelerate the conversion
process and save time to market in release of new value-added cultivars, especially when
linkage drag elimination is the defined breeding target. Designing the appropriate breeding
strategy is a choice between resource and time saving. By balancing the resource requirement
and time, one can design the optimal breeding plan based on specific objectives of the actual
breeding program.

24
Likewise, increasing selection intensity is yet another way to hasten recovery of the
RP germplasm. We assumed 4 chosen individuals each generation of selection, which is
reasonable in real life scenarios yet rigorous. Increasing selection intensity to 1 or 2 selected
individuals does result in a more rapid decrease in Total NRP and FR NRP, generally
speaking especially with a large population size (data not shown). However, one has to take
into the consideration of the related risk associated with a single individual selection
(plant/seed) from which to produce the next generation (e.g. germination failure). What’s
more, the seed needs to generate the desired population size in the next generation must be
taken into account. Therefore, for marker-aided backcross breeding program with large
population size in each generation, multiple desired genotypes are suggested to select rather
than single one.
Choice of Donor Parent
Up to this point, we have considered only first-wave conversions, that is, conversions
using the transformant line as the donor as with new events in the product pipeline. Once first-
wave conversions have been completed, these converted RPs represent additional potential
choices of donor parents to use with second-wave conversions (Figure 3). Several years after
creation of a new transgenic event that is trekking toward commercial release, industry
breeders face numerous choices of donor parents for a certain transgenic event. We
hypothesized that the ideal donor parent is one that offers quality in terms of less linkage drag,
particularly linkage drag representing germplasm from the opposite heterotic group, and
25
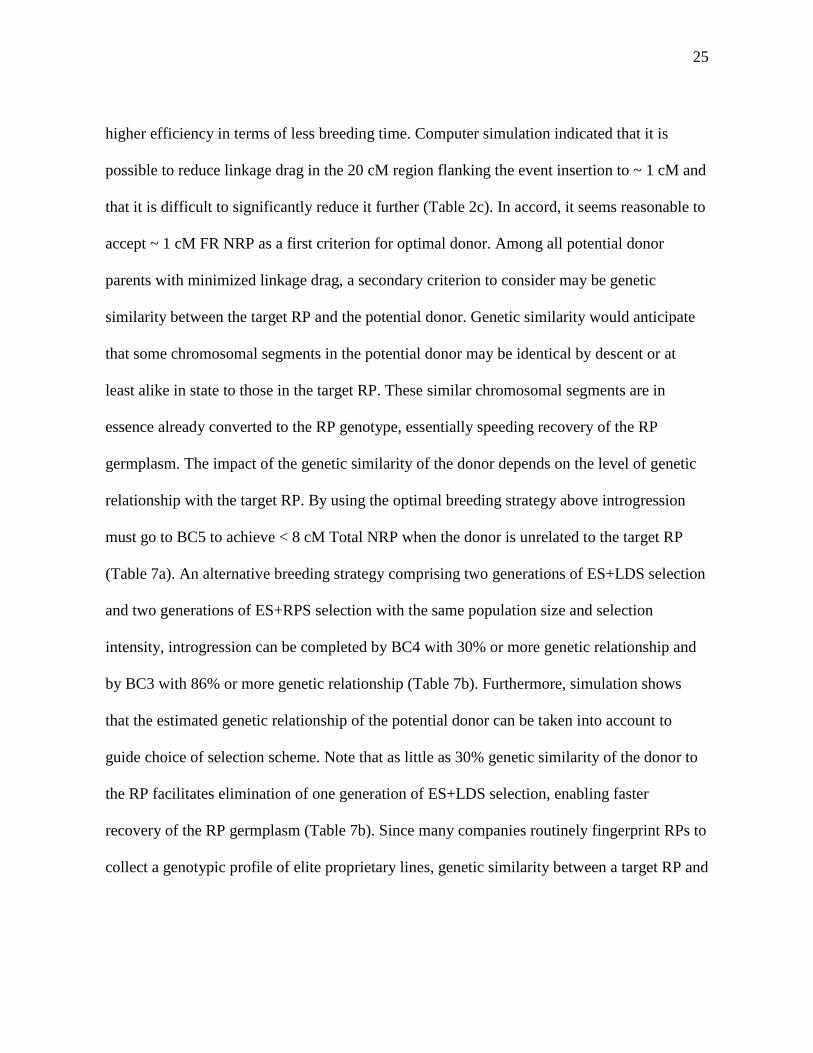
higher efficiency in terms of less breeding time. Computer simulation indicated that it is
possible to reduce linkage drag in the 20 cM region flanking the event insertion to ~ 1 cM and
that it is difficult to significantly reduce it further (Table 2c). In accord, it seems reasonable to
accept ~ 1 cM FR NRP as a first criterion for optimal donor. Among all potential donor
parents with minimized linkage drag, a secondary criterion to consider may be genetic
similarity between the target RP and the potential donor. Genetic similarity would anticipate
that some chromosomal segments in the potential donor may be identical by descent or at
least alike in state to those in the target RP. These similar chromosomal segments are in
essence already converted to the RP genotype, essentially speeding recovery of the RP
germplasm. The impact of the genetic similarity of the donor depends on the level of genetic
relationship with the target RP. By using the optimal breeding strategy above introgression
must go to BC5 to achieve < 8 cM Total NRP when the donor is unrelated to the target RP
(Table 7a). An alternative breeding strategy comprising two generations of ES+LDS selection
and two generations of ES+RPS selection with the same population size and selection
intensity, introgression can be completed by BC4 with 30% or more genetic relationship and
by BC3 with 86% or more genetic relationship (Table 7b). Furthermore, simulation shows
that the estimated genetic relationship of the potential donor can be taken into account to
guide choice of selection scheme. Note that as little as 30% genetic similarity of the donor to
the RP facilitates elimination of one generation of ES+LDS selection, enabling faster
recovery of the RP germplasm (Table 7b). Since many companies routinely fingerprint RPs to
collect a genotypic profile of elite proprietary lines, genetic similarity between a target RP and

26
the RPs of previous conversions for the event of interest could be easily calculated and used
to guide choice of donor parent for greater efficiency in MTI.

27
1.4 Conclusions
Following the trend of adding more and more value-added traits, especially transgenic
traits, to newly developed cultivars, it is not unrealistic to anticipate a breeding program in
future integrating up to 15 transgenic events in a single maize hybrid in an effort to protect the
genetic potential of the hybrid and fill the yield gap. Furthermore, to meet the defined
breeding goal of < 120 cM NRP in a converted target hybrid (Sun 2012, Chapter 4), each
single event introgression must meet the standards of < 8 cM residual NRP germplasm in total
across the genome with only ~ 1cM NRP germplasm in the region flanking the event
insertion. Exploring various breeding strategies through computer simulation to determine
whether this ambitious breeding goal is achievable, we have determined that indeed it is. One
breeding selection scheme which comprises three generations of selection for the event and
against linkage drag in the 20 cM flanking region around the event and two generations of
selection for event and the recurrent parent germplasm recovery throughout the genome
brings the desired result in the selected BC5 generation genotypes. This is a modified two-
stage selection scheme which efficiently achieves the goal with modest resource investment.
It represents a good balance between selection for elimination of linkage drag and RP
recovery across the genome compared with other selection schemes. Furthermore, it takes
advantage of the greater genetic variation in the earlier backcross generations to focus
selection against linkage drag which has less probability of success than minimization of NRP
germplasm throughout the genome. We further conclude that, with the same number of
generations of marker-aided selection, gain from RPS is best implemented in later backcross
generations to take advantage of gains from backcross breeding per se. Moreover, compared

28
to three-stage selection schemes, two-stage schemes are generally more efficient because the
separation of LDS and RPS by generation allows for higher selection intensity per generation
per type of selection without wasting much genotyping cost for RPS at earlier backcross
generations. In addition, the selection scheme was harmonized with appropriate population
size and selection intensity to accomplish the breeding goal. The optimal breeding strategy
featured populations of at least 600 in BC1 through BC3 and populations of 400 in BC4 and
BC5, with 6/4 selected individuals to move forward to the next generation. Although selection
of fewer individuals each generation does show some advantage in speeding recovery of the
RP germplasm especially in small population, the advantage is diminished once the
population size gets large. Also, there is more risk involved with such intense selection and
typically seed needs for the next generation cannot be met. Thus, in our proposed breeding
strategy, multiple individuals were selected to create the next breeding generation. This
optimized breeding strategy confirms the conclusions from Herzog and Frisch (2011),
highlighting a larger population size in early generations for linkage drag elimination and a
smaller population size in later generations for recurrent parent germplasm recovery.
Results of this study can be used a direct reference for designing a trait integration
breeding program aimed at minimizing the risk associated with linkage drag. Under such
general guidance, one can customize the optimal breeding strategy based on available
resources and specific breeding goals. Also, while we used introgression of transgenic events
in the case study presented here, the optimial breeding strategy would similarly apply to
introgressing other genetic factors such as QTLs and endogenous genes. For these,

29
modifications such as use of flanking markers or haplotypes to track the QTL or gene to be
introgressed are envisioned.
By computer simulation, we have also established two criteria for choosing an optimal
donor parent for a given RP: introgression history showing reduction of linkage drag to ~1 cM
in the 20 cM region flanking the event insertion and genetic similarity between the RP and
potential donor parents. Simulation demonstrated that a ‘quality’ single event conversion can
be accomplished by BC5 with no genetic similarity, by BC4 with 30% genetic similarity, and
by BC3 with 86% genetic similarity. In a large scale trait integration program especially in
industry, with these two criterions, appropriate IT tool could be created that would
systematically manage the donor parent pool and direct the choice of a donor parent resulting
a faster introgression with higher quality.
This study focused on the first step in MTI, Single Event Introgression. It lays the
groundwork for a comprehensive approach to MTI from Single Event Introgression, to Event
Pyramiding, to Trait Fixation, to Version Testing in order to recover a 15-event conversion of
a target hybrid with equivalent performance. The reader is referred to Chapter 2 and Sun
(2012, Chapter 4) following consecutively to this one for simulation results pertaining to the
other steps in MTI. Finally, the conclusions of this work offer a direct reference for maize
breeding and can also help with formulation of conversion strategies in other crops (either
inbred or hybrid) to meet defined breeding goals.

30
CHAPTER 2 – COMPUTER SIMULATION FOR MARKER-AIDED MULTIPLE
TRAIT INTEGRATION IN MAIZE II) EVENT PYRAMIDING AND TRAIT
FIXATION
2.1 Introduction
Biotechnology has become an important component in the development of new and
improved cultivars (Moose and Mumm 2008). The array of value-added traits created through
the use of genetic modification has been expanding since genetically modified (GM) traits
debuted in the mid-1990s, with events for herbicide tolerances, insect resistances, drought
tolerance, nitrogen use efficiency, yield enhancement, grain composition modification (amino
acid composition, protein content, and oil composition), disease resistances, grain processing
enhancements (phytase for animal feed and amylase for corn ethanol), and other useful traits
which may be helpful to close the yield gap (Que et al. 2010). Furthermore, GM traits have
been rapidly adopted by U.S. farmers as economic and environmental benefits have been
realized (Brooks and Barfoot 2006). This has fueled the trend to include more and more GM
traits in new cultivars, a practice referred to as ‘stacking ’. It is predicted that as many as 15 to
20 value-added traits may be stacked in new cultivars by 2030 (Que et al. 2010; Fraley 2012).
The process of converting a target cultivar for multiple traits (or transgenic events), i.e.
Multiple Trait Introgression (MTI), has been widely practiced in maize breeding. This process
usually consists of four steps: Single Event Introgression, Event Pyramiding, Trait Fixation,
and Version Testing (performance testing of various versions of a given target hybrid
conversion). The overall aim of MTI is to recover at least one version of the converted target
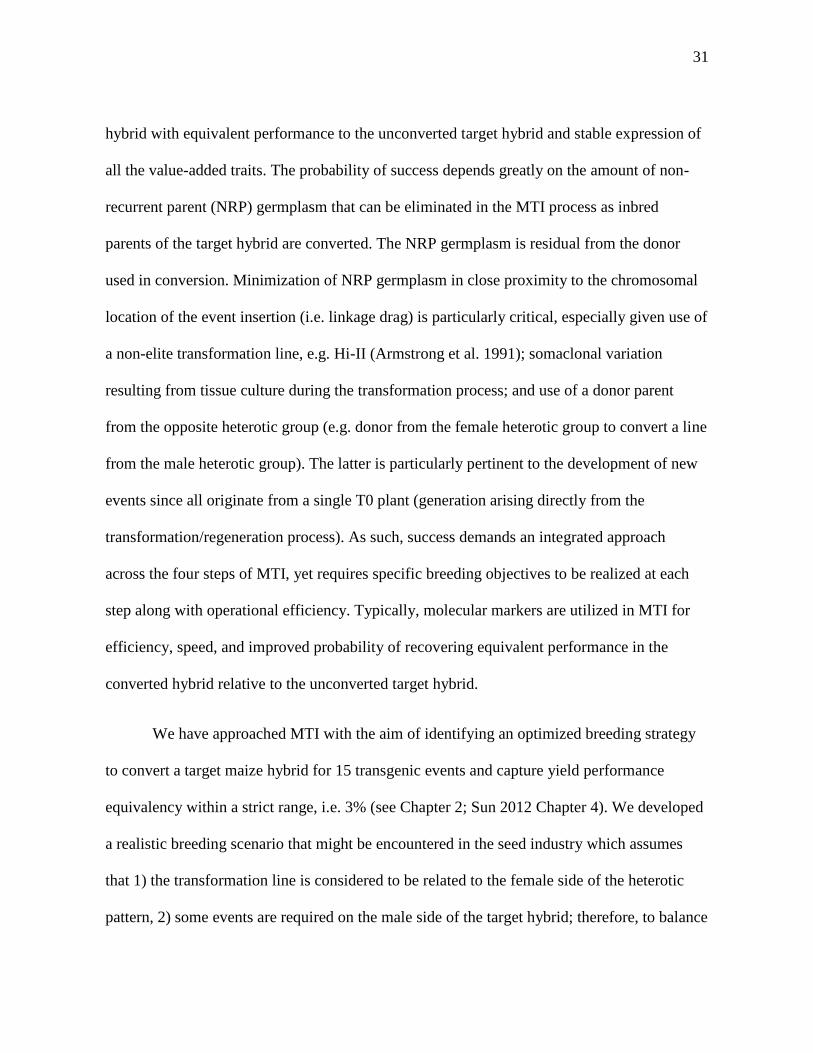
31
hybrid with equivalent performance to the unconverted target hybrid and stable expression of
all the value-added traits. The probability of success depends greatly on the amount of non-
recurrent parent (NRP) germplasm that can be eliminated in the MTI process as inbred
parents of the target hybrid are converted. The NRP germplasm is residual from the donor
used in conversion. Minimization of NRP germplasm in close proximity to the chromosomal
location of the event insertion (i.e. linkage drag) is particularly critical, especially given use of
a non-elite transformation line, e.g. Hi-II (Armstrong et al. 1991); somaclonal variation
resulting from tissue culture during the transformation process; and use of a donor parent
from the opposite heterotic group (e.g. donor from the female heterotic group to convert a line
from the male heterotic group). The latter is particularly pertinent to the development of new
events since all originate from a single T0 plant (generation arising directly from the
transformation/regeneration process). As such, success demands an integrated approach
across the four steps of MTI, yet requires specific breeding objectives to be realized at each
step along with operational efficiency. Typically, molecular markers are utilized in MTI for
efficiency, speed, and improved probability of recovering equivalent performance in the
converted hybrid relative to the unconverted target hybrid.
We have approached MTI with the aim of identifying an optimized breeding strategy
to convert a target maize hybrid for 15 transgenic events and capture yield performance
equivalency within a strict range, i.e. 3% (see Chapter 2; Sun 2012 Chapter 4). We developed
a realistic breeding scenario that might be encountered in the seed industry which assumes
that 1) the transformation line is considered to be related to the female side of the heterotic
pattern, 2) some events are required on the male side of the target hybrid; therefore, to balance

32
out the number of events for introgression into each parent, 8 events will be introgressed in
the female RP and 7 events into the male RP; 3) all events are new so conversions for each
event are required; 4) events are not linked genetically; 5) residual NRP germplasm in the
20cM region flanking the event insertion (FR NRP) will be unalterable after Single Event
Introgression step is completed and Event Pyramiding begins; 6) 120 cM of NRP germplasm
(~ 96.66% RP recovery) is the maximal amount of residual NRP germplasm consistent with
recapturing target hybrid performance (as per Sun 2012 Chapter 4). With 15 events overall,
this requires < 8 cM Total NRP in each Single Event Introgression. Furthermore, because we
assumed that FR NRP will be unalterable after Single Event Introgression step is completed
and Event Pyramiding begins, we arbitrarily designated that the threshold for FR NRP for
each Single Event Introgression at ~ 1 cM.
Using computer simulation, an optimal breeding strategy for the first step in MTI to
accomplish breeding objectives specific for Single Event Introgression was identified (see
Chapter 1). This strategy involved a selection scheme featuring five backcross generations of
marker-aided backcrossing, with selection against linkage drag in the flanking region for 3
generations followed by selection for RP germplasm recovery across the genome for 2
generations. The population size was set at 600 in BC1 through BC3 and relaxed to 400 in
BC4 and BC5. In each generation, selection intensity was held constant at 0.01. Besides
achievement of the breeding objectives, other parameters relevant to process efficiency were
considered in comparing selection schemes including total generation number (GEN) and
total number of marker data points (MDP) required. Also, we defined two criteria to guide
choice of donor parent for Single Event Introgression (see Chapter 1): introgression history

33
which pertains to linkage drag elimination, and genetic similarity between donor parent and
RP which influences the speed at which the RP germplasm can be recovered.
Now, with this study, we turned our attention to optimization of the next two steps in
MTI: Event Pyramiding and Trait Fixation. The breeding goal for Event Pyramiding was to
combine all target events through crossing to create stacked versions of each RP with all
target events in a heterozygous state. Then for Trait Fixation, the breeding goal was to recover
at least one line which is homozygous for all event loci to ensure stable expression of value-
added traits (Figure 4).
Several studies have considered optimal approaches for Event Pyramiding. Servin et
al. (2004) pointed out that as the number of target genes to be pyramided increases, the
number of ways to arrange the crossing schedule increases dramatically; they provided an
algorithm to calculate the optimal crossing schedule for a given number of target gene to be
pyramided. Ishii and Yonezawa (2007b) concluded that the crossing schedule should be as
symmetrical as possible, assuming the crossing schedule features parallel streams to
ultimately assemble all events in the target RP. Further, Ye and Smith (2010) specified
several guidelines for marker-assisted gene pyramiding: 1) founding parents with fewer genes
for introgression enter the schedule at earlier stages; 2) a cross that invokes a strong repulsion
linkage should be performed as early as possible in the introgression process; 3) more crosses
should be conducted at each generation if genotyping costs are low and the practically
appreciable population size is large; 4) one cross per generation is required if the practically
applicable population size is small or the genotyping cost is high. Guidelines to deal with
linked target genes (or events) were provided in several studies (Servin et al 2004; Ishii and

34
Yonezawa 2007a; Wang et al. 2007; Ye and Smith 2010). In our study, we proposed to
conduct Single Event Introgression prior to the Event Pyramiding step. Furthermore, we
assumed no linkage between events (i.e. for each RP, events to be stacked are located on
different chromosomes),
Other studies have suggested ways to optimize the Trait Fixation step in MTI. The
goal to recover ≥ 1 family homozygous for all events is simple when few events are involved,
typically requiring only one generation of self-pollination with reasonable population size to
achieve. However, once the number of target events exceeds 5, the frequency of individuals
with all target events loci in homozygous state within one selfing generation is extremely low.
For example, the frequency of individuals with 8 events in homozygous state equals
0.25^8=0.00001526. With such a low probability, the minimal number of families required to
find ≥ 1 with the desired genotype is 301803 (Mainland’s 1951), which is beyond the
population size that could realistically be accommodated resource-wise in a real breeding
program. To add to the complexity, usually multiple versions of the stacked RP conversion
are created in order to recover ≥1 version with equivalent performance to the unconverted
target hybrid. Thus, given the need for n versions of the RP, each with a minuscule
probability, the total minimal population could be even larger.
Bonnett et al. (2005) proposed an’F2 enrichment’ strategy to counter the large
population sizes demanded by low frequency of the desired genotype, suggesting a two-
generation approach to fix all the targeted trait (or event) loci. With this approach, in the first
selfing generation (i.e. S1), genotypes with all target events either in heterozygous or
homozygous (i.e. AA and Aa) are selected with expected probability of 0.75 per locus. And in

35
the second selfing generation, genotypes with all target events in homozygous are recovered
with expected probability of 0.5 per locus. For example, using this ’F2 enrichment’ strategy,
if the breeding goal is to fix 8 target events loci, the frequency of the desired genotype in first
generation (S1) is 0.75^8=0.1001129 and in second generation (S2) is 0.5^8=0.00390625.
Thus, the minimal population size to find ≥1desired genotype in first generation is only 44
and in second generation is only 1177 (Mainland’s 1951), which dramatically decreases the
total population size necessary to achieve the breeding goal from 301803 to 1221; however,
the trade-off is an extra generation. Wang et al. (2007) confirmed the superiority of this
approach with their simulation study. Likewise, Ishii and Yonezawa (2007b) compared four
different selection strategies for Trait Fixation with multiple target genes in heterozygous
state using computer simulation, some involving doubled haploid and others involving crosses
among ‘most complete’ selections when the desired genotype was not recovered. However,
Ishii and Yonezawa (2007b) concluded that recurrent selection (crossing among selections) is
not necessary if the total number of target events is less than 10 (which includes the case
involving 8 or 7 targeted trait loci for fixation in our breeding program).
In light of the need for an integrated breeding strategy across MTI to achieve success
in the conversion of a target corn hybrid for 15 transgenic events, the objectives of this work
were to 1) identify optimal breeding strategies for pyramiding of 8 events into the female RP
(and 7 in the male RP), and 2) evaluate optimal breeding strategies for Trait Fixation to create
a ‘finished’ conversion of each RP homozygous for all events. The latter considered selfing
and doubled haploid approaches to achieve homozygosity as well as seed chipping and tissue
sampling approaches to facilitate genotyping since technologies such as seed chipping and

36
doubled haploid are assumed to be accessible in the seed industry. In both steps, efficiency
indicators such as total number of population size across generations (NT), total number of
marker data points (MDP), total number of generations (GEN), number of seeds sampled by
seed chipping (NSC), and number of plants requiring tissue sampling (NTS), number of
pollinations (NP) (i.e. selfing and crossing) were considered in comparisons of breeding
strategies. Computer simulation was used to explore the myriad of potential options based on
numerical estimations for these efficiency indicators.

37
2.2 Materials and Methods
Computer simulation
Computer simulations in this study were conducted using R statistical software.
Models of the genome and the MTI process were developed as outlined in Chapter 1. The
genome model for simulation was constructed according to the published maize ISU–IBM
genetic map, with a total of 1788cM (Fu et al. 2006). Genetic recombination was simulated by
Haldane’s mapping function (Haldane 1919; Prigge et al. 2008) and the random walk
algorithm (Crosby 1973), assuming no crossover interference. With the focus of this study on
Event Pyramiding and Trait Fixation, marker tracking only involved detection of each event
and distinction between heterozygous and homozygous state. To facilitate selection for each
event, a single marker serving as a perfect marker for the event was simulated.
The process model was used to create progeny genotypes produced through crossing,
backcrossing, self-pollination, or doubled haploid and accounted for results of selection in
each generation.
Building on work by Ishii and Yonezawa (2007a), a symmetric crossing/selfing
schedule for Event Pyramiding was devised for stacking 8 events in a target RP (Figure 5).
This schedule emulates the conversion of the female parent of the target hybrid and, with
minor adjustments, also emulates the stacking of 7 events in male RP. The single event
conversions of each RP produced according to method proposed in Chapter 1 served as the
starting point. For Trait Fixation, 6 breeding strategies for recovering multiple families of a
version of the target RP fixed for the 8/7 events were devised based on variations of self-

38
pollination (SELF) or use of doubled haploid (DH) as well as seed chipping (SC) or tissue
sampling (TS). Seed chipping technology facilitates automated collection of plant tissue from
a single seed in a non-destructive fashion, from which DNA will be extracted for marker
genotyping (e.g. http://www.monsanto.com/products/Pages/breeding.aspx). This method of
tissue collection is currently used not only with corn, but with a wide array of grain and
vegetable crops (Monsanto 2012). In modern plant breeding, DH breeding technology shows
great advantage in producing ‘instant inbreds’, that is, fully homozygous lines with only 1-2
generations. It is commonly used in the seed industry to accelerate line development (Gallais
and Bordes 2007; Choe et al. 2012) and has been implicated as a potential advantage in MTI,
although it is not clear that it is currently being used for this purpose. With selfing
approaches, the ‘F2 enrichment’ strategy proposed by Bonnett et al. (2005) was included in
the model to overcome the bottleneck represented with only 1 generation of selfing and
extremely low frequency of desired individuals mandating huge population size.
The 6 breeding strategies evaluated in this study include SC+SELF, TS+SELF,
SC+DH-I, SC+DH-II, TS+DH-I, TS+DH-II, which are depicted in detail in Figure 6.
SC+SELF is a breeding strategy involving two generations of self pollination incorporating
the ‘F2 enrichment’ approach (Bonnett et al. 2005) and utilizing SC for tissue collection
(Figure 6a). TS+SELF is a breeding strategy involving two generations of self pollination
incorporating the ‘F2 enrichment’ approach (Bonnett et al. 2005) and utilizing TS for tissue
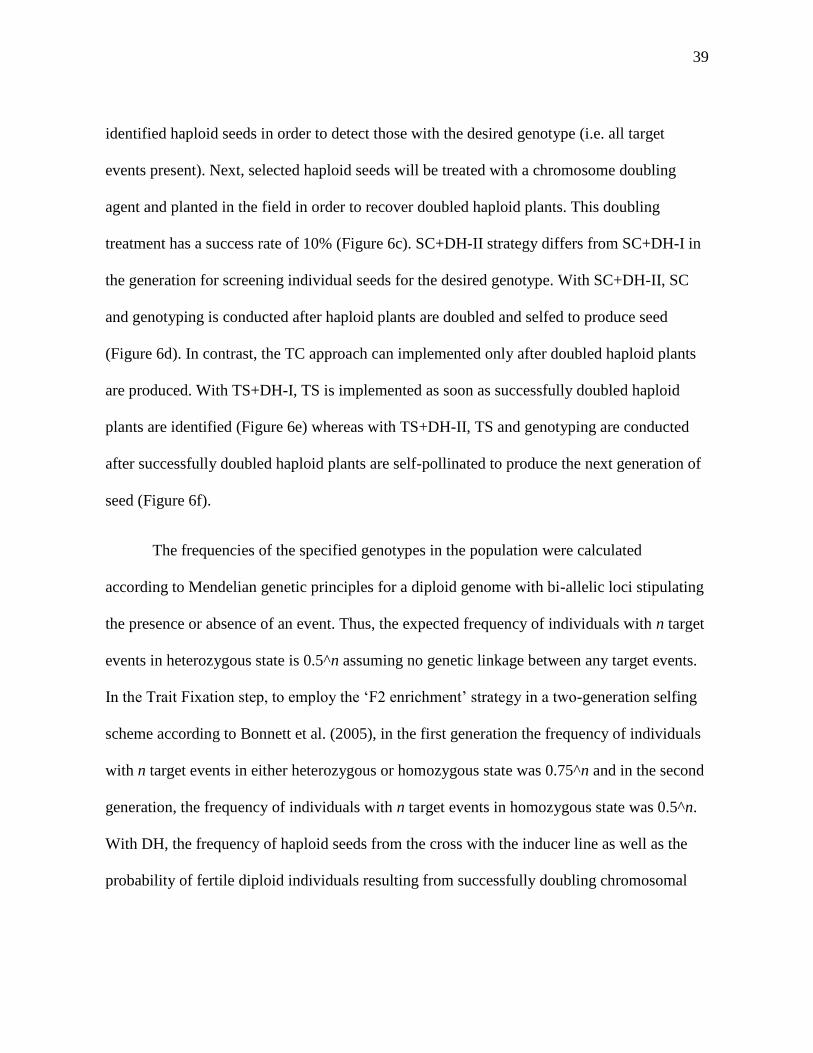
collection (Figure 6b). SC+DH-I involves crosses between the Event Pyramiding selections
and a haploid inducer in order to generate haploid seeds. Resulting haploid seeds are
anticipated at a 10% frequency in the seed bulk. SC genotyping will be applied to the
39
identified haploid seeds in order to detect those with the desired genotype (i.e. all target
events present). Next, selected haploid seeds will be treated with a chromosome doubling
agent and planted in the field in order to recover doubled haploid plants. This doubling
treatment has a success rate of 10% (Figure 6c). SC+DH-II strategy differs from SC+DH-I in
the generation for screening individual seeds for the desired genotype. With SC+DH-II, SC
and genotyping is conducted after haploid plants are doubled and selfed to produce seed
(Figure 6d). In contrast, the TC approach can implemented only after doubled haploid plants
are produced. With TS+DH-I, TS is implemented as soon as successfully doubled haploid
plants are identified (Figure 6e) whereas with TS+DH-II, TS and genotyping are conducted
after successfully doubled haploid plants are self-pollinated to produce the next generation of
seed (Figure 6f).
The frequencies of the specified genotypes in the population were calculated
according to Mendelian genetic principles for a diploid genome with bi-allelic loci stipulating
the presence or absence of an event. Thus, the expected frequency of individuals with n target
events in heterozygous state is 0.5^n assuming no genetic linkage between any target events.
In the Trait Fixation step, to employ the ‘F2 enrichment’ strategy in a two-generation selfing
scheme according to Bonnett et al. (2005), in the first generation the frequency of individuals
with n target events in either heterozygous or homozygous state was 0.75^n and in the second
generation, the frequency of individuals with n target events in homozygous state was 0.5^n.
With DH, the frequency of haploid seeds from the cross with the inducer line as well as the
probability of fertile diploid individuals resulting from successfully doubling chromosomal

40
content with the application of a doubling agent was set to 0.10 in keeping with reports from
Choe et al. (2012).
Minimum population size required in a given generation in keeping with a specified
genotypic frequency and probability of success was computed in R based on the binomial
distribution (Sedcole 1977):
∑ ( )
( ) (6)
where
N refers to the minimal population size
x is the number of recovered individuals with the desired genotype
p is the frequency of the desired genotype in the population
q is the probability of achieving the breeding goal.
The special case involving x=1 is consistent with the goal of recovering at least1
individual (e.g. ≥ 1 seed/plant/family) and the following simplified version of Equation 6 by
Mainland (1951) can be utilized:
( ) ( ) (7)
However, in real life, recovery of more than 1 individual is typically desired to manage risks
(e.g. germination failure) and often required to meet seed needs for the next generation.

41
Numerical estimation of the minimal population size (N) is estimated from the last
generation in Trait Fixation back toward to the first generation in Event Pyramiding through
Equation 6. And we set the breeding goal at the last generation in Trait Fixation is to recover
≥ 1 family with all target events loci in homozygous state in RP. In each generation, the
probabilities of achieving the desired outcome were computed for each generation and used to
estimate the minimum population size (N) needed to achieve the specified goal in each
breeding step (Table 8). The minimum population size was later adjusted (NA) to take the seed
needs for next generation into consideration. In calculating estimates of NA, we assumed that
an inbred plant produced 100 seeds on a single ear through self-pollination and that a DH
plant produced 50 seeds according our observation in the nursery field. These assumptions are
conservative estimates based on our observations in the Mumm Lab nursery over years.
Comparison Criteria
The 6 breeding strategies for Trait Fixation of 8 target events were compared based on
recovery of ≥ 1family (i.e. 1 seed SC and 1 plant for TS). Due to differences in the
developmental stage in which tissue collection is performed, the desired genotypes being
identified from SC genotyping method were seeds while the desired genotypes being
identified from TS genotyping method were plants. We also assumed that the genotyping
results were available before pollination for the strategies involving TS. Moreover, we
defined 1 generation as the interval from harvested seed to plant maturity/death. For example,
S1 plants bearing S2 seed were not considered advanced to the next generation until S2 seed

42
was harvested. However, selections based on S2 seed through SC were considered a half
generation ahead of S2 plants resulting from S2 seed that had been planted and germinated as
in TS.
Several criteria were considered to compare the efficiency of each breeding strategy.
The comparison parameters include NT for estimating the field resource requirements; MDP
for estimating the genotyping demands; GEN for estimating the time requirement; NSC and
NTS for estimating capital investment and labor requirements; and NP for estimating the
nursery requirements. These statistics can then be used by readers to estimate resource costs
associated with specific breeding strategies based on resource charges specific to their
organization.
43
2.3 Results and Discussion
Breeding strategy options were considered based on 99% probability of achieving
breeding objectives in each generation and recovery of 1 family of the stacked RP conversion
(i.e. 1 seed for breeding strategies involving seed chipping ; 1 S1 plant or S2 family for
breeding strategies involving tissue sampling) homozygous for all events at the close of Trait
Fixation. Regardless of the breeding strategy, the need to increase the seed of the recovered
family prior to Version Testing was recognized as the outcome with all options considered a
small number of seed (e.g. 1 to 100 depending on the particular breeding strategy option).
Event Pyramiding Breeding Strategy
Event Pyramiding was initiated using the single-event conversions of the RP described
by Chapter 1 as starting materials (Figure 5). Consistent with the breeding goal of integrating
15 transgenic events in the target hybrid, 8 events were pyramided into the parent from the
female heterotic group and 7 other events were pyramided into the parent from the male
heterotic group. Each of the RP conversions contained one of 8/7 events with < 8 cM Total
NRP germplasm including ~ 1 cM in the 20 cM region of the genome flanking the event.
Thus, Event Pyramiding was initiated with quality conversions with minimal linkage drag.
The breeding methodology for Event Pyramiding was adopted from Ishii and
Yonezawa (2007a). With the goal for this step in MTI to create a stacked version of the RP
with all target events in a heterozygous state, a symmetrical structure was employed in the
design of the Event Pyramiding crossing schedule (Figure 5). To introgress 8 events into
44
female RP, a completely symmetrical crossing structure was used. To introgress 7 events into
the male RP, a combined crossing structure was used; a tandem structure was used in the first
generation of crossing, followed by a symmetrical structure in later generations (not shown).
No comparisons among crossing schedule options were necessary as Ishii and Yonezawa
(2007a) already established the efficiency of the symmetrical approach to this step in MTI in
requiring the fewest total number of population size, total number of generations, total
number of marker data points, and total number of pollinations. Nonetheless, to craft an
overall breeding strategy for successful MTI, this step represents an important component of
the overall breeding plan.
Comparison of Trait Fixation Breeding Strategies
Six breeding strategies for Trait Fixation of 8 events in a given RP were compared for
NT, MDP, GEN, NSC, NTS, and NP. All six breeding strategy options require only 1-2
generations, which is reasonable in industrial scale breeding programs. Comparisons among
the 6 breeding strategies facilitated evaluation of SC versus TS as the method of collecting
materials for genotypic analysis; SELF approaches versus DH approaches; SC with haploid
seeds versus SC with doubled haploid seeds; TS in the same generation as doubled haploid
plants screening versus TS one generation after doubled haploid plants screening.
Comparing SC with TS to collect materials for genotyping, the SC option showed
great advantage with both SELF and DH breeding strategies (Table 9). SC enabled reduction
of numbers of plants in the field since individual seed selections are made before planting; NT

45
was decreased more than 92- fold (1390 versus 15). Furthermore, TS requires a significant
number of NTS and therefore considerable human labor resources to accomplish. With the
SELF approach, SC and TS options require the same MDPs. However, with DH, SC of
haploid seeds requires substantially more marker data points (MDP=24624) than other
breeding strategies as well as much larger total population size across generations (NT=6368).
SC with doubled haploid seeds requires the same total marker data points (MDP=9416) as
TS+DH-I and TS+DH-II breeding strategies but much smaller total population size in the
field (NT=562). In general, TS requires fewer marker data points but generally larger NT than
SC and huge human labor for tissue sampling process and pollination needs; this is especially
the case with TS+DH-I. Overall, SC shows tremendous advantages for Trait Fixation in MTI
in terms of NT saving and NTS, with both SELF and DH approaches. Furthermore, use of SC
resulted in 0.5-1 fewer generations to realize the breeding goal compared to TS options.
However, this may not translate to a meaningful advantage considering that sufficient seed
must be produced with either method to proceed to the next step in MTI.
Comparing the SELF and DH approaches, SELF proved more efficient than the DH
breeding method under the defined breeding scenario (Table 9). Using SC, the SELF option
requires only 15 plants in the field while the DH option requires many more (NT=6368 for
SC+DH-I and NT=562 for SC+DH-II). More than twice the MDP is needed with the SC+DH-
I versus the SC+SELF. With SC+DH-II, the marker data point requirement is slightly fewer
than with SC+SELF (9416 versus 11096). However, the nursery demand (NP) would be still
larger than with SC+SELF. Thus, benefit from DH is questionable under such a breeding
scenario. Furthermore, the DH platform demands special knowledge and capital investment to

46
develop and operate. Overall, the SC+SELF breeding strategy was determined as more
efficient than the SC+DH-I and SC+DH-II breeding strategies. If only TS is available, DH
required larger NT than SELF methods, even though slightly smaller MDP (9416 versus
11096) and smaller NTS were needed. Also, DH methods exhibited much larger nursery
demands (NP) than SELF options.
Comparing SC with haploid seeds (SC+DH-I) with SC with doubled haploid seeds
(SC+DH-II), with the same total generation number (GEN), SC with haploid seeds requires
more than 10 times NT than SC with doubled haploid seeds (6368 versus 562). SC+DH-I also
results much larger MDP, NSC and NP than SC+DH-II. SC+DH-I shows a 0.5 generation
advantage over SC+DH-II; however, this may not impact the timing of product release.
Clearly, SC+DH-I incorporates two probabilities involving the desired genotype: the
frequency of haploid seeds resulting from the cross to the inducer line (0.10) and the
frequency of individuals containing all events (0.5^8=0.00390625) into one step, thus leading
to large NT, MDP, NSC and NP. Also, one concern is whether seed chipping is workable with
haploid seeds. If, for example, the seed chipping contributed to decreased germination, the
efficiency of the DH system would be compromised.
Comparing TS in TS+DH-I with TS in TS+DH-II, TS+DH-I needs much larger NT
and NP than TS+DH-II to achieve the benefit of saving one breeding generation. If time is
critical in the whole breeding program and TS genotyping is the only option, the TS+DH-I
breeding strategy may be preferable despite with the large NT and NP requirements.

47
Overall, the SC+SELF Trait Fixation breeding strategy was determined to be the
optimal breeding strategy to fix 8 target event loci in terms of efficiency. It combines the SC
advantage point (versus TS) and the benefits of SELF (versus DH). Although selections are
identified in the seed stage, this does not necessarily translate to time savings in product
development and release. It does however enable conditions promoting seed set to be
maximized at/after planting the identified seed(s).
In this study, we considered use of various breeding technologies. However, with the
information provided, individual programs can tailor a breeding strategy for Trait Fixation
based on access their unique situation with respect to technologies, facilities, and corporate
objectives. Of course, our calculations are based on the reproduction rate of maize (i.e. the
seeds number being generated by one cross) and the success rates at various points in the DH
system (i.e. the frequency of haploid seeds from the cross with the inducer line and the
success rate for doubling haploid plants and restoring fertility). Thus, inferences pertaining to
other plant species (e.g. soybean) or different success rates for DH platform may be different
from those stated here.

48
2.4 Conclusions
A symetrical crossing schedule for Event Pyramiding and an optimal breeding strategy
for Trait Fixation within the context of converting a target hybrid for 15 transgenic events
have been identified. According to the numerical analysis , SC+SELF was determined to be
the most efficient breeding strategy considering GEN and resource requirements such as
MDP, NT, NSC, NTS, and NP. DH may have limited utility in Trait Fixation for MTI under
the defined breeding scenario.
This outcome paves the way for optimizing the last step in the MTI process, Version
Testing, which involves hybridization of female and male RP conversions to create versions
of the converted hybrid for performance evaluation. This practice minimizes the risk of failure
to recover the target hybrid field performance after effort and investment in MTI.

49
REFERENCES
Armstrong CL, Green CE, Phillips RL (1991) Development and availability of germplasm
with high type II culture formation response. Maize Genetics Cooperation Newsletter
65: 92–93.
Bernardo R (2009) Genomewide selection for rapid introgression of exotic germplasm in
maize. Crop Sci. 49(2): 419-425.
Brookes G and Barfoot P (2006) Global impact of biotech crops: socio-economic and
environmental effects in the first ten years of commercial use. AgBioForum, 9(3):139-
151.
Choe E, Carbonero CH, Mulvaney K, Rayburn AL, and Mumm RH (2012) Improving in vivo
maize doubled haploid production efficiency through early detection of false positives.
Plant Breeding doi:10.1111/j.1439-0523.2012.01962.x
Crosby JL (1973) Computer simulation in genetics. New York: John Wlley & Sons.
Falke KC, Miedaner T, Frisch M (2009). Selection strategies for the development of rye
introgression libraries. TAG Theoretical and Applied Genetics 119(4): 595-603.
Fraley R (2012) A tale of two farms. Food & Agricultural Communications: The next frontier.
University of Illinois Agricultural Communications, February 17, 2012.
Frisch M, Bohn M and Melchinger AE (1999a) Comparison of selection strategies for
marker-assisted backcrossing of a gene. Crop Sci. 39:1295-1301.
Frisch M and Melchinger A E (2001) Marker-assisted backcrossing for simultaneous
introgression of two genes. Crop Sci. 41:1716-1725.
Frisch M (2005) Breeding strategies: optimum design of marker-assisted backcross programs
in biotechnology in agriculture and forestry volume 55: molecular marker systems in
plant breeding and crop improvement. Springer-Verlag Berlin Heidelberg New York,
Germany, pp:319-333.
Fu Y, Wen TJ, Ronin YI, Chen HD, Guo L, Mester DI, Yang Y, Lee M, Korol AB, Ashlock
DA and Schnable PS (2006) Genetic dissection of intermated recombinant inbred lines
using a new genetic map of maize. Genetics 174(3): 1671-1683.
Gallais A and Bordes J (2007) The use of doubled haploids in recurrent selection and hybrid
development in maize. Crop Sci. 47(S3) S190-S201.

50
Haldane, JBS (1919) The combination of linkage values and the calculation of distance
between the loci of linkage factors. J. Genet. 8:299-309.
Herzog E and Frisch M (2011) Selection strategies for marker-assisted backcrossing with
high-throughput marker systems. TAG Theoretical and Applied Genetics 123(2): 251-
260.
Hospital F, Chevalet C and Mulsant P (1992) Using markers in gene introgression breeding
programs. Genetics 132(4): 1199-1210.
Hospital F (2001) Size of donor chromosome segments around introgressed loci and reduction
of linkage drag in marker-assisted backcross programs. Genetics 158(3): 1363-137.
Information Systems for Biotechnology (2012) Release summary data and charts (1987-
present). Information Systems for Biotechnology website:
http://www.isb.vt.edu/Default.aspx Acessed 18 July 2012.
Ishii T and Yonezawa K (2007a) Optimization of the marker-based procedures for
pyramiding genes from multiple donor lines: I. Schedule of crossing between the
donor lines. Crop Sci. 47:537-546.
Ishii T and Yonezawa K (2007b) Optimization of the marker-based procedures for
pyramiding genes from multiple donor lines: II. Strategies for selecting the objective
homozygous plant. Crop Sci. 47:1878-1886.
Koziel MG, Beland GL, Bowman C, Carozzi NB, Crenshaw R, Crossland L, Dawson J, Desai
N, Hill M, Kadwell S, Launis K, Lewis K, Maddox D, McPherson K, Meghji MR,
Merlin E, Rhodes R, Warren GW, Wright M and Evola SV (1993) Field performance
of elite transgenic maize plants expressing an insecticidal protein derived from bacillus
thuringiensis. Nat Biotech 11(2): 194-200.
Monsanto Company (2012) Monsanto Breeding Technologies. Monsanto website:
http://www.monsanto.com/products/Pages/breeding.aspx Accessed 19 June 2012.
Monsanto Company (2012) How can agriculture help feed 9 billion people? Monsanto
website: http://www.monsanto.com/ourcommitments/Pages/agricultures-role-in-
feeding-nine-billion.aspx Accessed 28 June 2012.
Moose SP and Mumm RH (2008) Molecular plant breeding as the foundation for 21st century
crop improvement. Plant Physiology 147(3): 969-977.
Mumm R H and Walters DS (2001) Quality control in the development of transgenic crop
seed products. Crop Sci. 41(5).

51
Prigge V, Maurer HP, Mackill DJ, Melchinger AE and Frisch M (2008) Comparison of the
observed with the simulated distributions of the parental genome contribution in two
marker-assisted backcross programs in rice. TAG Theoretical and Applied Genetics
116(5): 739-744.
Que Q, Chilton MM, Fontes CM, He C, Nuccio M, Zhu T, Wu Y, Chen JS and Shi L (2010)
Trait stacking in transgenic crops: Challenges and opportunities. GM Crops 1(4): 220-
229.
Ribaut JM, Jiang C and Hoisington D (2002) Simulation experiments on efficiencies of gene
introgression by backcrossing. Crop Sci. 42(2): 557-565.
Ribaut JM and Ragot M (2007) Marker-assisted selection to improve drought adaptation in
maize: the backcross approach, perspectives, limitations, and alternatives. Journal of
Experimental Botany 58(2): 351-360.
Sedcole JR (1977) Number of Plants Necessary to Recover a Trait. Crop Sci. 17(4): 667-668.
Servin B, Martin OC, Mezard M and Hospital F (2004) Toward a theory of maker-assited
gene pyramiding. Genetics 168: 513-523.
Stam P and Zeven AC (1981) The theoretical proportion of the donor genome in near-
isogenic lines of self-fertilizers bred by backcrossing. Euphytica; Netherlands journal
of plant breeding 30(2): 227-238.
Sun X, Peng T and Mumm RH (2011) The role and basics of computer simulation in support
of critical decisions in plant breeding. Molecular Breeding 28(4): 421-436.
Sun X (2012) Models and methods for computer simulations as a resource in plant breeding.
PhD dissertation, University of Illinois at Urbana-Champaign.
United States Department of Agriculture (USDA) Economic Research Service (ERS) (2012)
Adoption of genetically engineered crops in the U.S.: recent trends in GE adoption.
USDA ERS Web. http://www.ers.usda.gov/data-products/adoption-of-genetically-
engineered-crops-in-the-us/recent-trends-in-ge-adoption.aspx Accessed 28 June 2012.
Visscher PM, Haley CS and Thompson R (1996) Marker-assisted introgression in backcross
breeding programs. Genetics 144(4): 1923-1932.
Wang J, Chapma SC, Bonnett DG, Rebetzke GJ and Crouch J (2007) Application of
population genetic theory and simulation models to efficiently pyramid multiple genes
via marker-assisted selection. Crop Sic. 47: 582-590.

52
Ye G and Smith KF (2010) Marker-assited gene pyramiding for cultivar development. In:
Janick J (ed) Plan breeding reviews. Wiley-Balckwell, New Jersey, pp 219-256.
Young ND and Tanksley SD (1989) RFLP analysis of the size of chromosomal segments
retained around the <i>Tm-2 locus of tomato during backcross breeding. TAG
Theoretical and Applied Genetics 77(3): 353-359.

53
ABBREVIATIONS
DH Doubled haploid
FR NRP Amount of non-recurrent parent germplasm in the 20 cM region flanking the
transgenic event
GEN Total generation number
GM Genetic modified
LDS Selection against linkage drag in the 20 cM region flanking the
transgenic event
MDP Total number of marker data points
MTI Multiple trait integration
NP Total number of pollinations (i.e. selfing or crossing)
NRP Non-recurrent parent
NSC Total number of seeds sampled by seed chipping
NT Total population size across generations
NTS Total number of plants requiring tissue sampling
QTL Quantitative trait loci
RP Recurrent parent

54
RPS Selection for the recurrent parent germplasm recovery
SC Seed chipping
SELF Self pollination
TS Tissue sampling
Total NRP Total amount of non-recurrent parent germplasm across the genome

55
FIGURES
Figure 1 Four breeding steps involved in Multiple Trait Integration (MTI) in maize: Single
Event Introgression, Event Pyramiding, Trait Fixation and Version Testing (performance
testing of various versions of a given target hybrid version)

56
Figure 2 Impact of population size (population size=20, 50, 100, 200, 400, 600, 800, 1000,
1500, 2000) per generation on the rate of decrease in amount of linkage drag (FR NRP) with
selection scheme ES+LDS/ES+LDS/ES+LDS/ES+RPS/ES+RPS from BC1 to BC5 with
constant selection intensity 0.01.

57
Figure 3 With a transformant line from the female heterotic group, conversions of male
inbred RPs would generally take place in waves, with the first-wave utilizing the T0 plant
representing the new event (or a T1, T2 descendant) as a donor parent and second-wave
conversions having more options as donor parents including previous conversions with
different levels of genetic similarity with male inbred RPs.

58
Figure 4 Breeding goals for some of the activities/steps in Multiple Trait Introgression (MTI)
(adapted from Ishii and Yonezawa (2007a, Figure1).

59
Figure 5 Using the SC+SELF breeding strategy as an example, the crossing schedule for Event Pyramiding and Trait Fixation is
shown along with frequencies of the desired genotype (p), required population size adjusted for seed needs in the next
generation (NA), and the number of selected individuals (x) each generation (also adjusted for seed needs in the next generation),
assuming a 99% success rate (q), NA was calculated using Equation 6.

60
Figure 6 Descriptions of the 6 breeding strategies for Trait Fixation involving variations of
self-pollination (SELF) versus use of doubled haploid (DH), and seed chipping (SC) versus
tissue sampling (TS) to collect material for genotypic analysis.
a) Selfing with seed-chipping (SC+SELF)
b) Selfing with tissue-sampling (TS+SELF)
c) Doubled haploid with seed-chipping of haploid seeds (SC+DH-I)
d) Doubled haploid with seed-chipping of seeds from doubled haploid plants
(SC+DH-II)
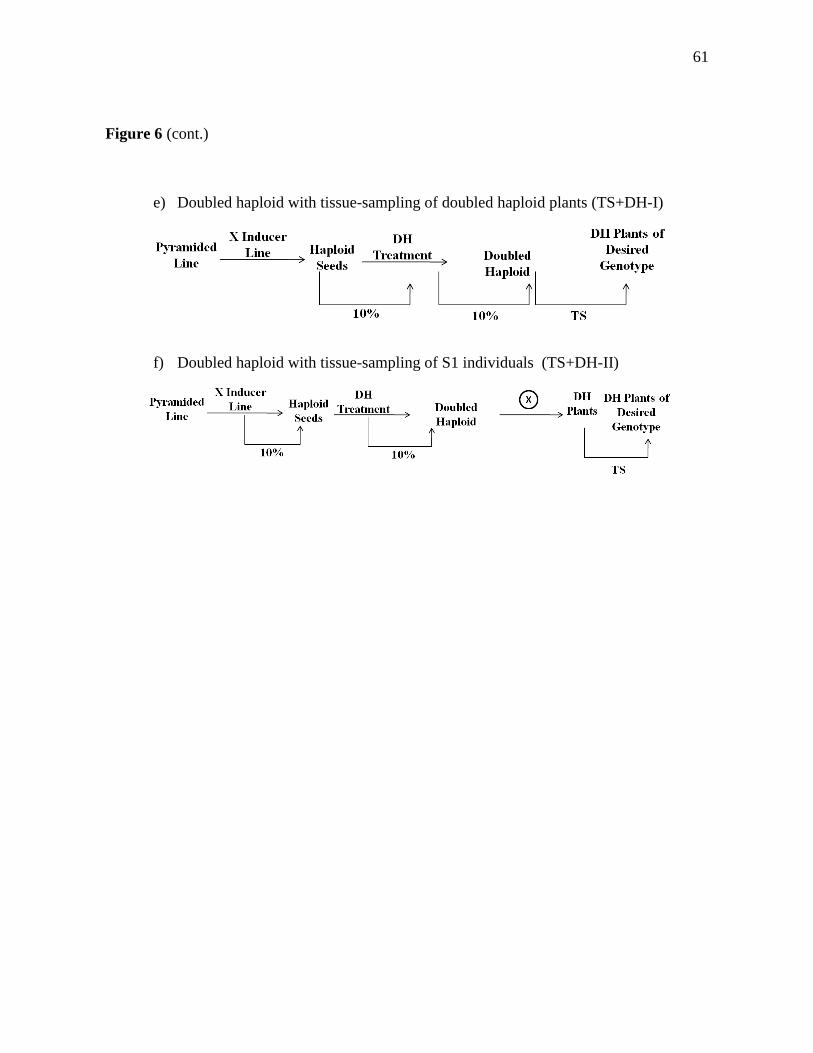
61
Figure 6 (cont.)
e) Doubled haploid with tissue-sampling of doubled haploid plants (TS+DH-I)
f) Doubled haploid with tissue-sampling of S1 individuals (TS+DH-II)

62
TABLES
Table 1 In the absence of selection, the theoretical mean percentage of recurrent parent germplasm recovered (RP%) in
successive backcross generations versus the mean total amount of non-recurrent parent germplasm (Total NRP) (length in cM)
based on formula given below. Note that the number of marker loci = 1798 (i.e. 1 marker per cM) based on the maize map by Fu
et al. (2006).
Generation BC1 BC2 BC3 BC4 BC5 BC6 BC7 BC8 BC9 BC10
RP% 75.0000 87.5000 93.7500 96.8750 98.4375 99.2188 99.6094 99.8047 99.9023 99.9512
Total NRP (cM) 899.0000 449.5000 224.7500 112.3750 56.1875 28.0938 14.0469 7.0234 3.5117 1.7559
Total ( ) ( )
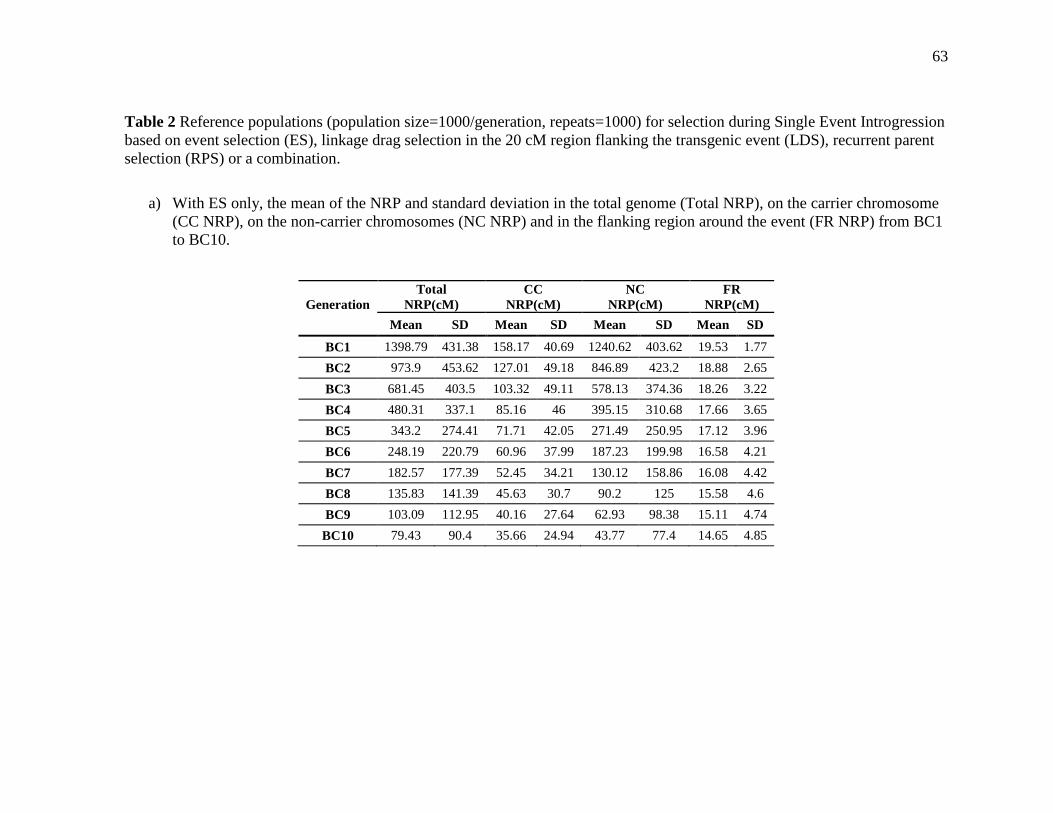
63
Table 2 Reference populations (population size=1000/generation, repeats=1000) for selection during Single Event Introgression
based on event selection (ES), linkage drag selection in the 20 cM region flanking the transgenic event (LDS), recurrent parent
selection (RPS) or a combination.
a) With ES only, the mean of the NRP and standard deviation in the total genome (Total NRP), on the carrier chromosome
(CC NRP), on the non-carrier chromosomes (NC NRP) and in the flanking region around the event (FR NRP) from BC1
to BC10.
Generation
Total
NRP(cM)
CC
NRP(cM)
NC
NRP(cM)
FR
NRP(cM)
Mean SD Mean SD Mean SD Mean SD
BC1 1398.79 431.38 158.17 40.69 1240.62 403.62 19.53 1.77
BC2 973.9 453.62 127.01 49.18 846.89 423.2 18.88 2.65
BC3 681.45 403.5 103.32 49.11 578.13 374.36 18.26 3.22
BC4 480.31 337.1 85.16 46 395.15 310.68 17.66 3.65
BC5 343.2 274.41 71.71 42.05 271.49 250.95 17.12 3.96
BC6 248.19 220.79 60.96 37.99 187.23 199.98 16.58 4.21
BC7 182.57 177.39 52.45 34.21 130.12 158.86 16.08 4.42
BC8 135.83 141.39 45.63 30.7 90.2 125 15.58 4.6
BC9 103.09 112.95 40.16 27.64 62.93 98.38 15.11 4.74
BC10 79.43 90.4 35.66 24.94 43.77 77.4 14.65 4.85
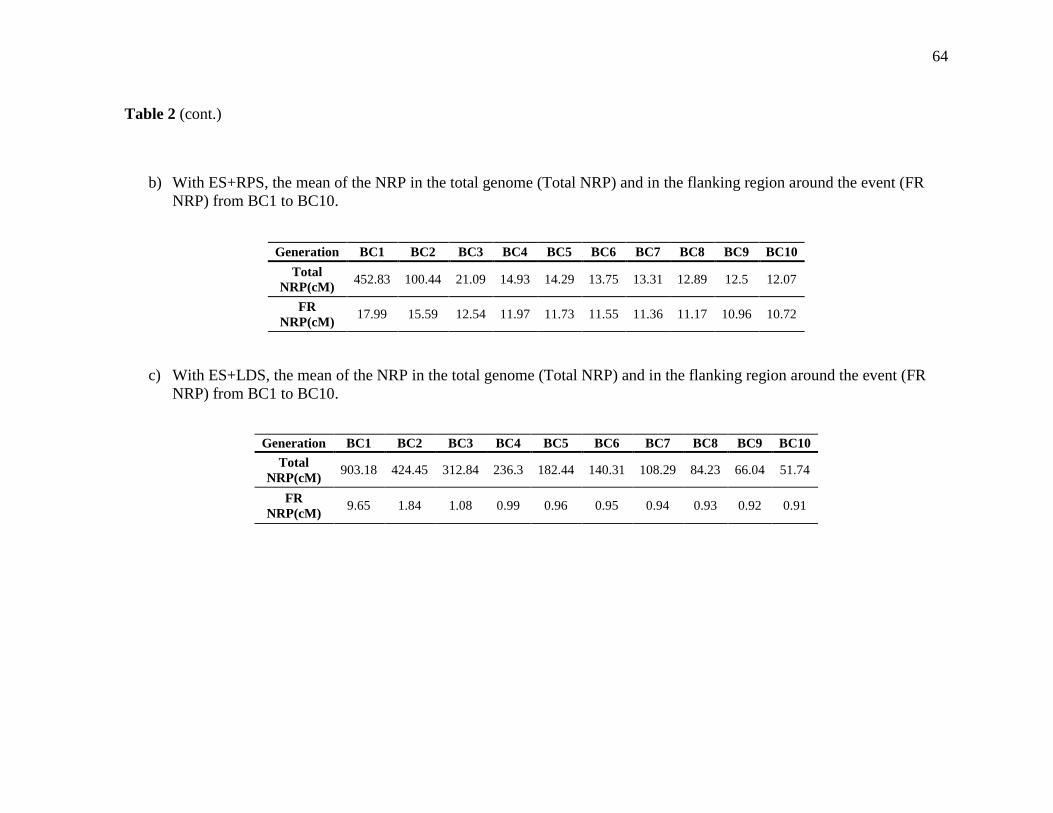
64
Table 2 (cont.)
b) With ES+RPS, the mean of the NRP in the total genome (Total NRP) and in the flanking region around the event (FR
NRP) from BC1 to BC10.
Generation BC1 BC2 BC3 BC4 BC5 BC6 BC7 BC8 BC9 BC10
Total
NRP(cM) 452.83 100.44 21.09 14.93 14.29 13.75 13.31 12.89 12.5 12.07
FR
NRP(cM) 17.99 15.59 12.54 11.97 11.73 11.55 11.36 11.17 10.96 10.72
c) With ES+LDS, the mean of the NRP in the total genome (Total NRP) and in the flanking region around the event (FR
NRP) from BC1 to BC10.
Generation BC1 BC2 BC3 BC4 BC5 BC6 BC7 BC8 BC9 BC10
Total
NRP(cM) 903.18 424.45 312.84 236.3 182.44 140.31 108.29 84.23 66.04 51.74
FR
NRP(cM) 9.65 1.84 1.08 0.99 0.96 0.95 0.94 0.93 0.92 0.91

65
Table 3 Simulation results comparing breeding strategies for Single Event Introgression under constant population size 400 and
4 selected genotypes per generation for three backcross generations based on selection for event selection (ES), linkage drag
selection in the 20 cM region flanking the transgenic event (LDS), recurrent parent selection (RPS), displaying the mean of total
non-recurrent parent germplasm length in cM (Total NRP), flanking region non-recurrent parent germplasm length in cM (FR
NRP), the genotyped marker data points in thousands (MDP) and total population size (NT) (1000 repeats).
Selection Schemes BC1 BC2 BC3 Total
Non-RP(cM)
FR
Non-RP(cM)
MDP
(K) NT
Three-Stage
ES+LDS+RPS ES+LDS+RPS ES+LDS+RPS 120.65 2.91 133.2 1200
ES ES+LDS+RPS ES+LDS+RPS 178.36 5.93 88.808 808
ES ES ES+LDS+RPS 299.8 10.78 44.416 416
Modified
Two-Stage
ES+LDS ES+RPS ES+RPS 28.75 8.48 85.2 1200
ES+LDS ES+LDS ES+RPS 51.87 3.61 49.2 1200
ES ES+LDS ES+RPS 101.33 9.16 44.808 808
Combined
ES+LDS ES+LDS+RPS ES+LDS+RPS 152.03 2.49 93.2 1200
ES+LDS ES+LDS ES+LDS+RPS 221.43 2.02 53.2 1200
ES ES+LDS ES+LDS+RPS 244.12 4.99 48.808 808

66
Table 4 Simulation results comparing breeding strategies for Single Event Introgression under constant population size 400 and
4 selected genotypes per generation for four backcross generations based on selection for event selection (ES), linkage drag
selection in the 20 cM region flanking the transgenic event (LDS), recurrent parent selection (RPS), displaying the mean of total
non-recurrent parent germplasm length in cM (Total NRP), flanking region non-recurrent parent germplasm length in cM (FR
NRP), the genotyped marker data points in thousands (MDP) and total population size (NT) (1000 repeats).
Selection
Schemes BC1 BC2 BC3 BC4
Total
NRP(cM)
FR
NRP(cM)
MDP
(K) NT
Three-
Stage
ES+LDS+RPS ES+LDS+RPS ES+LDS+RPS ES+LDS+RPS 48.94 1.88 177.6 1600
ES ES+LDS+RPS ES+LDS+RPS ES+LDS+RPS 75.76 2.87 133.208 1208
ES ES ES+LDS+RPS ES+LDS+RPS 112.53 5.53 88.816 816
ES ES ES ES+LDS+RPS 210.74 10.49 44.424 424
Modified
Two-
Stage
ES+LDS ES+RPS ES+RPS ES+RPS 16.35 8.03 125.6 1600
ES+LDS ES+LDS ES+RPS ES+RPS 10.62 3.66 89.6 1600
ES+LDS ES+LDS ES+LDS ES+RPS 29.2 1.83 53.6 1600
ES ES+LDS ES+RPS ES+RPS 20.33 8.01 85.208 1208
ES ES+LDS ES+LDS ES+RPS 33.86 3.5 49.208 1208
ES ES ES+LDS ES+RPS 55.46 9.76 44.816 816
Combined
ES+LDS ES+LDS+RPS ES+LDS+RPS ES+LDS+RPS 59.69 1.69 137.6 1600
ES+LDS ES+LDS ES+LDS+RPS ES+LDS+RPS 85.41 1.49 97.6 1600
ES+LDS ES+LDS ES+LDS ES+LDS+RPS 150.58 1.45 57.6 1600
ES ES+LDS ES+LDS+RPS ES+LDS+RPS 108.03 2.38 93.208 1208
ES ES+LDS ES+LDS ES+LDS+RPS 167.22 2.06 53.208 1208
ES ES ES+LDS ES+LDS+RPS 161.44 4.65 48.816 816

67
Table 5 Simulation results comparing breeding strategies for Single Event Introgression under constant population size 400 and
4 selected genotypes per generation for five backcross generations based on selection for event event selection (ES), linkage
drag selection in the 20 cM region flanking the transgenic event (LDS), recurrent parent selection (RPS), displaying the mean of
total non-recurrent parent germplasm length in cM (Total NRP), flanking region non-recurrent parent germplasm length in cM
(FR NRP), the genotyped marker data points in thousands (MDP) and total population size (NT) (1000 repeats). The breeding
strategy marked with * shows the potential to meet the defined breeding goal for < 8cM Total NRP and FR NRP ~ 1 cM.
Selection
Schemes BC1 BC2 BC3 BC4 BC5
Total
NRP(cM)
FR
NRP(cM)
MDP
(K) NT
Three
-Stage
ES+LDS+RPS ES+LDS+RPS ES+LDS+RPS ES+LDS+RPS ES+LDS+RPS 17.85 1.42 222 2000
ES ES+LDS+RPS ES+LDS+RPS ES+LDS+RPS ES+LDS+RPS 31.02 1.8 177.608 1608
ES ES ES+LDS+RPS ES+LDS+RPS ES+LDS+RPS 47.7 2.67 133.216 1216
ES ES ES ES+LDS+RPS ES+LDS+RPS 75.68 5.17 88.824 824
ES ES ES ES ES+LDS+RPS 148.28 9.73 44.432 432
Modified
Two
-Stage
ES+LDS ES+RPS ES+RPS ES+RPS ES+RPS 14.83 7.81 166 2000
ES+LDS ES+LDS ES+RPS ES+RPS ES+RPS 8.65 3.43 130 2000
*ES+LDS ES+LDS ES+LDS ES+RPS ES+RPS 7.86 1.68 94 2000
ES+LDS ES+LDS ES+LDS ES+LDS ES+RPS 19.17 1.27 58 2000
ES ES+LDS ES+RPS ES+RPS ES+RPS 14.68 7.5 125.608 1608
ES ES+LDS ES+LDS ES+RPS ES+RPS 9.59 3.09 89.608 1608
ES ES+LDS ES+LDS ES+LDS ES+RPS 21.86 1.69 53.608 1608
ES ES ES+LDS ES+RPS ES+RPS 16.38 7.54 85.216 1216
ES ES ES+LDS ES+LDS ES+RPS 21.47 3.13 49.216 1216
ES ES ES ES+LDS ES+RPS 39.27 7.94 44.824 824

68
Table 5 (cont.)
Selection
Schemes BC1 BC2 BC3 BC4 BC5
Total
NRP(cM)
FR
NRP(cM)
MDP
(K) NT
Combined
ES+LDS ES+LDS+RPS ES+LDS+RPS ES+LDS+RPS ES+LDS+RPS 21.16 1.33 182 2000
ES+LDS ES+LDS ES+LDS+RPS ES+LDS+RPS ES+LDS+RPS 30.99 1.26 142 2000
ES+LDS ES+LDS ES+LDS ES+LDS+RPS ES+LDS+RPS 54.87 1.19 102 2000
ES+LDS ES+LDS ES+LDS ES+LDS ES+LDS+RPS 108.24 1.15 62 2000
ES ES+LDS ES+LDS+RPS ES+LDS+RPS ES+LDS+RPS 40.53 1.61 137.608 1608
ES ES+LDS ES+LDS ES+LDS+RPS ES+LDS+RPS 64.04 1.49 97.608 1608
ES ES+LDS ES+LDS ES+LDS ES+LDS+RPS 117.18 1.38 57.608 1608
ES ES ES+LDS ES+LDS+RPS ES+LDS+RPS 69.41 2.25 93.216 1216
ES ES ES+LDS ES+LDS ES+LDS+RPS 117.05 1.94 53.216 1216
ES ES ES ES+LDS ES+LDS+RPS 113.32 4.63 48.824 824

69
Table 6 The effect of increased population size in BC1 through BC3 on the mean of total non-recurrent parent germplasm
length in cM (Total NRP), flanking region non-recurrent parent germplasm length in cM (FR NRP), the genotyped marker data
points in thousands (MDP) and total population size (NT) in achieving the specified breeding goal in Single Event Introgression
of < 8 cM Total NRP and ~1 cM FR NRP with constant selection intensity 0.01.
Generations BC1 BC2 BC3 BC4 BC5 Total
NRP
(cM)
FR
NRP
(cM)
MDP
(K) NT Selection
Scheme (ES+LDS) (ES+LDS) (ES+LDS) (ES+RPS) (ES+RPS)
Population
Size per
generation
400 400 400 400 400 7.86 1.68 94 2000
600 600 600 400 400 6.57 1.18 100.6 2600
800 800 800 400 400 6.1 1.13 107.2 3200
1000 1000 1000 400 400 5.96 1.07 113.8 3800

70
Table 7 The impact of genetic similarity between the target recurrent parent (RP) and donor parent in reducing total residual
non-recurrent parent germplasm (Total NRP) in a conversion to < 8 cM, given 2 selection schemes: a) involving 3 generations
of E+LD selection and 2 generations of E+RP selection and b) involving 2 generations of E+LD selection and 2 generations of
E+RP selection.
a)
b)
Similarity Range Low Genetic Similarity High Genetic Similarity
Generation Selection Scheme 0% 10% 20% 30% 40% 50% 60% 70% 80% 83% 86% 89% 90% 92% 95% 98%
BC1 ES+LDS 882.23 793.19 702.43 624.31 526.21 441.47 347.82 268.35 178.79 154.68 117.27 100.08 87.97 73.42 46.55 15.48
BC2 ES+LDS 440.85 392.58 348.22 310.51 265.98 228.7 175.76 138.18 89.49 75.21 60.29 50.47 44.54 36.01 23.53 11.36
BC3 ES+RPS 54.04 47.64 41.42 38.97 32.2 27.22 20.89 17.24 10.85 9.4 7.96 6.26 5.46 4.26 2.89 1.75
BC4 ES+RPS 10.55 9.39 8.18 7.79 6.57 5.62 4.02 3.31 2.07 1.72 1.59 1.21 1.04 0.76 0.61 0.31
Similarity Range Low Genetic Similarity High Genetic Similarity
Generation Selection
Scheme 0% 10% 20% 30% 40% 50% 60% 70% 80% 83% 86% 89% 90% 92% 95% 98%
BC1 ES+LDS 885.45 798.46 701.99 624.31 526.21 441.47 347.82 268.35 178.79 154.68 117.27 100.08 87.97 73.42 46.55 15.48
BC2 ES+LDS 442.35 391.38 344.34 310.51 265.98 228.7 175.76 138.18 89.49 75.21 60.29 50.47 44.54 36.01 23.53 11.36
BC3 ES+LDS 290.53 256.42 228.11 195.08 169.56 145.61 116.42 88.43 58.62 50.8 39.76 32.45 30.73 24.44 16.11 8.73
BC4 ES+RPS 29.15 24.32 22.19 18.86 16.25 14.51 11.79 8.87 5.68 5.11 4.1 3.38 3.17 2.49 1.86 1.31
BC5 ES+RPS 7.86 7.38 6.24 5.76 4.98 4.24 2.96 2.33 1.54 1.33 1.19 0.86 0.8 0.58 0.48 0.28
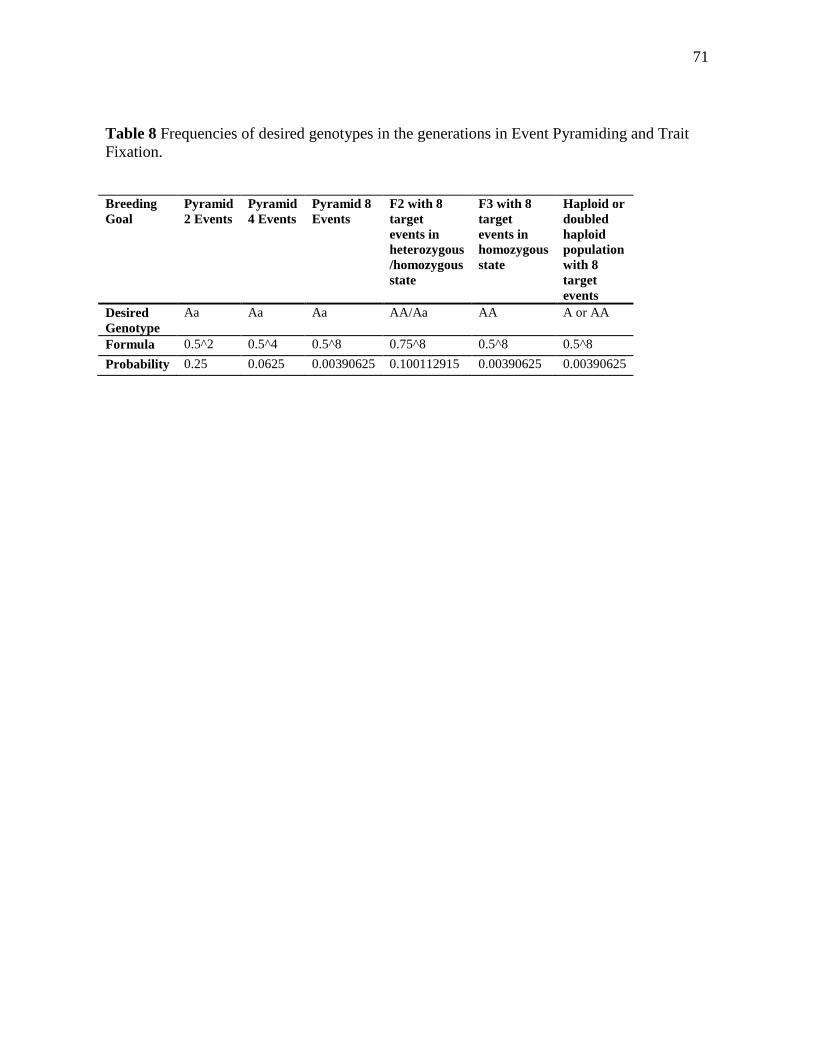
71
Table 8 Frequencies of desired genotypes in the generations in Event Pyramiding and Trait
Fixation.
Breeding
Goal
Pyramid
2 Events
Pyramid
4 Events
Pyramid 8
Events
F2 with 8
target
events in
heterozygous
/homozygous
state
F3 with 8
target
events in
homozygous
state
Haploid or
doubled
haploid
population
with 8
target
events
Desired
Genotype
Aa Aa Aa AA/Aa AA A or AA
Formula 0.5^2 0.5^4 0.5^8 0.75^8 0.5^8 0.5^8
Probability 0.25 0.0625 0.00390625 0.100112915 0.00390625 0.00390625
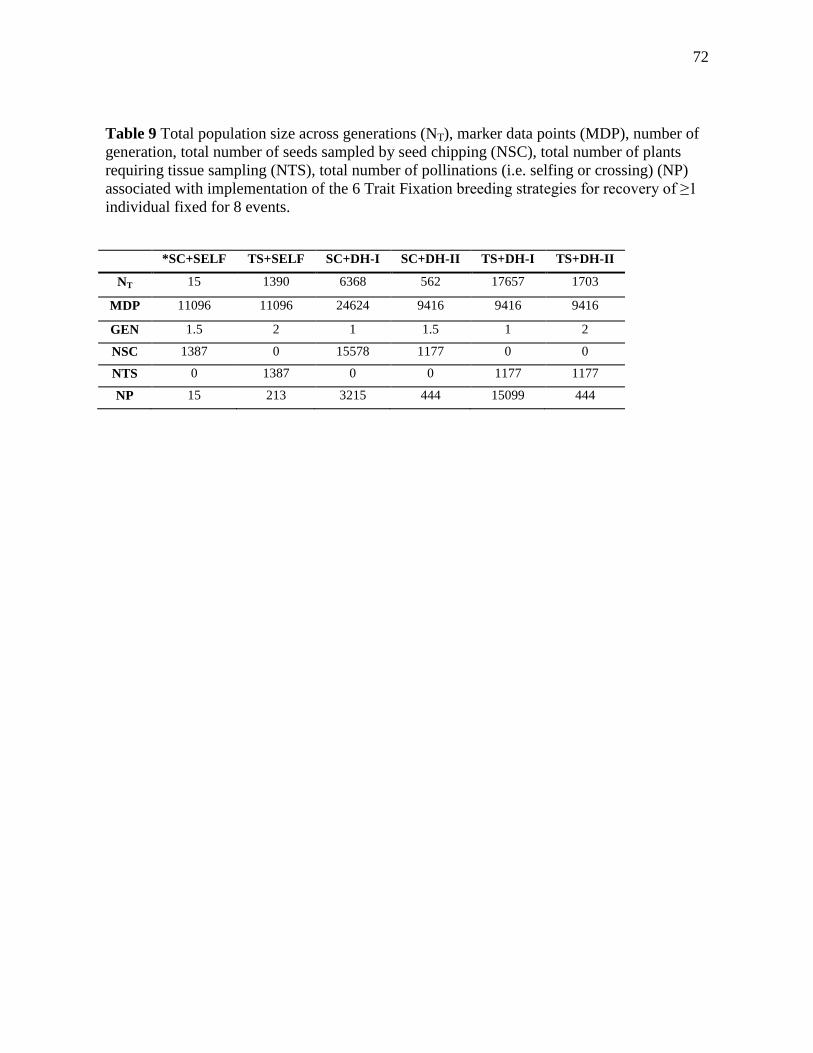
72
Table 9 Total population size across generations (NT), marker data points (MDP), number of
generation, total number of seeds sampled by seed chipping (NSC), total number of plants
requiring tissue sampling (NTS), total number of pollinations (i.e. selfing or crossing) (NP)
associated with implementation of the 6 Trait Fixation breeding strategies for recovery of ≥1
individual fixed for 8 events.
*SC+SELF TS+SELF SC+DH-I SC+DH-II TS+DH-I TS+DH-II
NT 15 1390 6368 562 17657 1703
MDP 11096 11096 24624 9416 9416 9416
GEN 1.5 2 1 1.5 1 2
NSC 1387 0 15578 1177 0 0
NTS 0 1387 0 0 1177 1177
NP 15 213 3215 444 15099 444