Embed Size (px)
Citation preview

Computer SystemPerformance Analysis
andBenchmarking
Winter Semester 1997-1998
by Marko AhoChristopher Vinckier
2
Part I
I/O Subsystem Performance Analysis
by Christopher Vinckier
3
Table of Contents
• Introduction p. 4• The Art of Benchmarking p. 5• Why benchmark results may not be what we expect p. 6• The Benchmarks p. 10• The Systems p. 14• The Benchmark Results p. 16• Conclusion p. 23
4
Introduction
When we consider the current evolution in the computing industry, there are a few aspects that immediatelydraw one’s attention. Computing power is increasing at a tremendous rate. This has been nicely capturedby Gordon Moore : ‘Expect a doubling in processor power every 18 months.’, an expression now referredto as Moore’s Law. One can also easily observe that no other component follows this growth rate.Memory, RAM and storage, are becoming ever cheaper. However, what is not occurring is that access timeand throughput are decreasing resp. increasing at exponential rates. Considering magnetic disk technologyspecifically we see that disk density has been improving by about 50% per year, almost quadrupling in threeyears. Access time has only improved by one-third in 10 years. Taking this into account, we have decidedto concentrate our attention on the performance analysis of currently available magnetic disk storage. Ifcurrent trends continue, magnetic disk storage is bound to become the bottleneck of most systems. Superfast processors and huge memories have to be ‘fed’ and a system is only as fast as it’s slowest component,currently the disk.In our analysis we shall consider the advantages and disadvantages of currently available technologies andtheir impact on system performance and effectiveness. To narrow down this still very broad subject evenmore, we shall focus our attention on standard Personal Computers. The reason being that 90% ofcomputers used world wide are of this type. Along the way we shall try to demystify the difference betweenthe currently used interfaces, EIDE (Enhanced Integrated Drive Electronics) and SCSI (Small ComputerSystem Interface) as well as their cost-performance correlation.We shall try to analyze the performance of different drives by means of several benchmarks. The reason forusing multiple benchmark programs being that performance bottlenecks may be easier to detect bycomparing the results from different benchmarks. Each benchmark tells part of the story, and together amore complete picture can be drawn.
5
The Art of BenchmarkingWithout a doubt, benchmarking is one of the most controversial subjects in the computer industry. This isunderstandable, given the number of exaggerated performance claims that consumers are exposed to on adaily basis. As a result, the process of benchmarking is often viewed with doubt and suspicion.So how can we make a distinction between questionable and valid benchmarks ? Benchmarks can be fair,but most of all useful, if the test are understood and a few simple strategies are followed. We shall examinecommon issues affecting disk benchmarks as well as discuss reasons why results may not always be whatone expects.
Two basic types of benchmarks exist in the computer industry : those that run a real-world workload (ex.Winstone 97® and Winbench 97®), and those that simulate a workload (ex. ThreadMark). Each have theirstrength and weaknesses, and it often works well to run both types.Real-world benchmarks may be as simple as timing how long it takes to copy a file, or they may involveexecuting complex scripts that perform functions in many different applications. The main advantage ofthese benchmarks is they measure performance using real applications. In doing so, they often exercise allthe components in a system, so the effect that any one component has on overall system performance can bemeasured. However, this same advantage can also be a limitation, since the performance of one componentmay be artificially limited by another. For example, we may be interested in disk performance, but a slowvideo accelerator will slow down a benchmark that has a high proportion of video content. This in turncould affect the workload presented to the disk drives.Simulated benchmarks usually target a specific system component, and are not as sensitive to the effects ofother components. The function of simulated benchmarks is to measure how well the targeted componenthandles periods of high activity. Performance in periods of high activity is critical, since the user will feelhis machine is sluggish during these periods. The better these ‘hot spots’ are handled, the more responsivethe system will be.Care should be taken in choosing simulated benchmarks, since some may be designed to present a workloadthat does not relate to the intended system application. Likewise, certain benchmarks may bypass criticalcomponents of the operating system or measure aspects of performance that don’t relate to a given user.The documentation included with the benchmark should give a detailed description of its operation.Otherwise, experimentation will be necessary to find out how the benchmark makes measurements.
Considering the myriad of benchmarks available on the market today, it is not uncommon to obtain entirelydifferent or even conflicting results depending on which benchmark you run. That can make it very difficultto draw any concrete conclusions on performance. The solution to this problem consists of a few basicstrategies.The first is to understand what each benchmark you run measures, and how it makes those measurements.Armed with this knowledge, the discrepancies and anomalies that invariably arise can often be explained.Take the case of the disk benchmark that repeatedly reads the content of one sector. The goal may be tomeasure disk performance, but if the drive or operating system uses cache, the result is a measurement ofhow fast the cache is instead of how fast the drive is. Other disk benchmarks may bypass he operatingsystem cache all together, or a drive may have caching disabled. All of these situations may lead tounexpected results, but can be explained by how the benchmark operates and how the system is configured.The next step is closely related to the first, and that is to obtain as many reference points as possible byusing several different benchmarks and comparing results.When running benchmarks, as with any scientific experiment, it is best to change only one variable at atime. In reality, this often proves to be difficult. For example, when comparing two host adapters, bothhost adapters and drive software will need to change. In situations like this it is important to document thedifferences so that those who examine the results can understand the factors involved.Thorough documentation of the test environment and a detailed explanation of how the benchmarks wererun will help avoid confusion and misinterpreted results.
6
Why Benchmark results may not be what we expectEven if everything is done correctly, there will still be some odd results. Sometimes the reason isstraightforward, while other times there might be no apparent reason. In this section we go into some detailas to why the disk drive benchmarks may turn out differently than originally expected.
• Mechanical Latencies
The single largest contributor to low performance is the disk drive mechanical overhead. Themechanical overhead consists of drive head seeks and rotational latencies. Rotational latency is thetime it takes for a sector on the disk media to rotate to the point under the read/write head. It isinversely proportional to the rotational speed of the disk : the faster the disk spins, the shorter therotational latency. The mechanical overhead is significant because it is measured in milliseconds,while most of the other overheads are measured 3 orders of magnitude smaller.
• Software and Firmware Overheads
Software overhead is the time it takes for commands to be passed through the operating system andsoftware drivers. Firmware overhead relates to the time it takes for the host adapter and disk drive toprocess the commands. Both are substantially smaller than the mechanical overhead, and usually fallunder 100 microseconds.
• Data Transfer Rates
Compared to the mechanical overheads, the data transfer periods are also very short. For example, itonly takes approximately 200 microseconds to transfer a typical 4 KB block of data at the 20 MB/sUltra SCSI rate.To illustrate how the different overheads affect performance, consider this example. A good 7200 rpmhard drive will have an average seek time of 8 milliseconds, and a rotational latency of 4.2milliseconds. The combined soft- and firmware overheads will only add 100 microseconds, and thedata transfer time for 4 KB of data will be about 200 microseconds. All the factors together amount to13.5 milliseconds of overhead. The soft- and firmware overheads together with the data transfer timeonly account for 2.4 % of the total overhead. From this it would appear that it doesn’t really matterhow low the soft- and firmware overheads are, or how fast the data transfers are, since the mechanicaloverheads are much larger. In reality, these factors do matter, depending on what type of I/O occurs.With random I/O, where the data is not on contiguous areas of the disk, seeks and rotational latenciesare encountered with almost every command. Thus, here the mechanical overheads become the mostimportant component of disk performance, and data transfer rates are minor contributors. Whenconsidering sequential I/O however, the requested data is laid out contiguously. A consequence is thatmultiple commands can often be performed after the initial seek to the first sector of the requested data.Eliminating long seeks and rotational latencies increases the percentage of time spent transferring data,hence the data rates become more important.Data rates are also important in environments where there are multiple SCSI disk drives processingmultiple commands simultaneously. In these situations, two or more drives may be attempting totransfer data across the bus at the same time. Since only one drive can transfer data across the SCSIbus at a time, the faster a drive can transfer its data and free the bus for other drives, the faster theoverall data transfer rate will be.
• Hard Disk Organization
In the pictures we can see the several ways how data can be stored physically on the harddisk. With abenchmark program that calculates the transfer rate or seek time of the whole harddisk we can see if thedrive is using a 'vertical' or a 'horizontal' mapping. Depending on what kind of read/write heads andservo-motors (for positioning the actuator arm) are used it is faster to switch heads or to change tracks.

7
• Vertical mapping
Traditional harddisks orders their capacity in ‘vertical’ mapping. The data is read/written from onecylinder first, starting at the top track down to the bottom, before the heads are moved to the nextcylinder.
• Horizontal mapping
The ‘horizontal’ mapping. The data is read/written starting from the outer cylinder to the innercylinder, before switching the heads to the next track.
• Vertical and horizontal mapping
Some harddisks use a combination of ‘vertical’ and ‘horizontal’ mapping.
As we can see in the above pictures, transfer rate is higher when data is read or written to the outerparts of a disk. The reason is that there is more space for sectors. The number of sectors varies in steps.Usually on a disk there are 10 to 20 zones (called 'notches') with a constant sector number. That is thereason why we see the steps in the transfer rates. Some harddisk use the combination of 'vertical' and'horizontal' mapping. The 'horizontal' mapping is used inside the zones, the 'vertical' mapping betweenthe zones. However, transfer rate and seek time look the same to 'vertical' mapping. Modern harddisksuse different track sizes. The outer parts of a disk have more space for sectors than the inner parts.Usually, HD’s begin to write from the outside to the inside of a disk. Hence, data written or read at thebeginning of a HD are accessed faster and transferred at a higher rate.

8
If we are going to buy a HD we have may need to know what kind of mapping the drive does. If weneed constant transfer rates (for video, audio) we should get a drive which doesn’t do the horizontalmapping. However, drives with horizontal mapping are not very common.What this section has as goal is to show to the reader that the transfer rate and seek time can beinfluenced not only by the organization of the data on the hard disk but also by the presence of ‘other’data on the disk. This means that a disk benchmark measuring the two aforementioned quantities willreturn different results depending on how much data is already present on the drive prior to running thebenchmark. If one would push the performance measuring to the extreme, we would have to run thebenchmark several times with the drive filled to different degrees. Having the results of the tests, itwould suffice to take the arithmetic mean as a good approximation of the average disk performance.As we did not have access to virgin disks, we we’re not able to perform these extensive measurements.
• Other Factors
Drive media rates, spindle speeds, buffer sizes, system bus speeds and bus chipsets are important itemsthat can have a major effect on the overall data transfer rate. The higher the drive’s media rate, thefaster the data can be read into or written from the drive’s buffer. The drive’s media rate is closely tiedto its spindle speed, since the faster the disk platters spin, the more data passes the drive heads in agiven time. Today’s high-end SCSI drives spin at rates up to 10000 rpm while EIDE drives seem totop out at 5400 rpm.The size of a drive’s cache buffer is dictated by a number of factors, including the drive’s media rate,data transfer rate and the system bus speed. The function of the buffer is to allow data transfers toproceed smoothly and minimize costly mechanical latencies. For example, I/O and system bus speedsare generally faster than drive media rates. On write commands, the buffer serves to store incomingdata from the host until the drive can write the data onto the media. If the cache buffer fills up, the hostmust suspend data transfers while the drive writes the data in the buffer to the disk. On readcommands, the drive can read additional sectors of data into its buffer in anticipation that they will berequested later. If a command requests data that already exists in the drive’s buffer, it can be sentdirectly, eliminating mechanical latencies and boosting performance. SCSI drives tend to have largerbuffers than EIDE drives, since many SCSI drives can handle multiple commands at the same time andthe SCSI spec higher data transfer rates.
The type of I/O request determines which of the above factors come into effect. As discussed above,with the sequential I/O a high proportion of time is spent transferring data and relatively little time isspent on mechanical overhead. Because of this, the drive’s media rate is ultimately the determiningfactor in overall performance. The I/O bus speed is also an important factor if high performance drivesare used. A large drive cache coupled with a good caching algorithm will allow the drive to stay on thebus longer, transferring data at the I/O bus burst rate. On the other hand, random I/O performance isdominated by drive mechanical latencies. In this case the bus transfer rate have little effect and seektimes and rotational speeds are the most important specs to look at. The rotational speed is importantbecause it determines the rotational latency.
From our discussion above, it becomes clear that just because a drive spec sheet states the drive has anx MB/s burst rate, it doesn’t mean a benchmark will show the same rate. Benchmark results are acomplex combination of hardware and software performance characteristics and I/O types. Often thesecomponents can interact I strange ways, producing numbers that don’t seem to make sense.Sometimes, when there are no specific hardware or software limitations that account for odd results,they may be the result of timing situations that cause additional mechanical latencies. Bus analyzerscould be used to show where the delays are occurring and to track down problems.
A final note on SCSI drives. Targeting the high-end drive market, SCSI drives have been designed toovercome mechanical overheads with two unique features. The first is called disconnect/reconnect.While one drive is busy seeking or reading data into its buffer, it can electrically disconnect from thebus. While it is disconnected, another drive can connect and receive commands or transfer data. Theend result is better bus utilization and higher overall throughput because the time spent waiting for
9
mechanical latencies can be put to use by other peripherals. The second feature is called taggedqueuing. This feature allows a drive to accept and queue up multiple commands while processing anactive command. The drive can then sort the commands and process them in the order that minimizeshead seeks and rotational latencies. These added features to SCSI drives as well as the higherrotational speeds are just some of the reasons why SCSI drives outperform their EIDE counterparts andis naturally reflected in their higher cost.

10
The BenchmarksIn this section we shall briefly discuss the benchmarks we used for doing the performance analysis. Inaddition to analyzing just what these benchmarks do, we shall also mention how they calculate theirrespective scores. This is done to create a clear and concise picture of the whole process of theperformance analysis. Two out of the three benchmarks used were provided to us courtesy of Mr.Kurmann. They are Winstone 97® and Winbench 97®. The third benchmark has been downloaded fromthe Web, is called Threadmark and was developed by Adaptec. After having looked at Threadmark’stechnical specifications, we decided to use it. The reason for this being that we could check if the results ofbenchmarks from different vendors are consistent with each other.
• Winstone 97®
Winstone 97® is a system-level, application-based benchmark that measure’s a PC’s overall performancewhen running today’s top-selling Windows-based applications. The Business WinStone Benchmark Suitecontains the following applications :
• Word-processing/Spreadsheet- Excel 7.0- Word 7.0- Word Pro 7.0
• Database- Paradox 7.0- Access 7.0
• Businessgraphics/ Desktop Publishing- PageMaker 6.0- CorelDRAW! 6.0- PowerPoint 7.0
The HighEnd WinStone Benchmark Suite contains the following applications :• Imageprocessing
- Photoshop 3.0.5- Picture Publisher 6.0
• CAD / 3-D- Microstation 95- PV-WAVE 6.0- AVS 3.0
• Application Development- Visual C++ 4.1
Winstone 97® uses scripts to execute commands within an application and stores the time it took the PC toexecute them. After all the applications have run, Winstone 97® uses each application’s elapsed run timeto calculate a score. They way this score is calculated is as follows :
1. Winstone 97® computes the application’s execution speed on the test PC relative to theapplication’s actual execution speed on the base machine. This is done to remove an undueinfluence an application may have the script for that application took longer to execute than thescripts of the another applications.

11
The basemachine used for the normalization process in Winstone 97® as well as for Winbench97® has the following configuration :
Gateway 2000 4Dx2-66V
Processor Intel 486DX2, 66MHzOperating System Windows 95, Enhanced Mode with Paging
Memory 16 MBLevel-1 Cache 8 KBLevel-2 Cache 64 KB
Virtual memory 64 to 96 MBGraphics- accelerator ATI Graphix Ultra Pro, 1024x768x16, 1MB VRAM
IDE-controller On BoardHard Disk Western Digital Caviar 2250
2. Winstone 97® combines the relative speed for applications in a category suite. This is done with
use of a weighted harmonic mean, producing a relative speed for the entire category. The weightassigned to each applications is its unit market share in the category and is kept secret. To computethe weighted harmonic mean, Winstone 97® divides the weight of each application by theapplication’s relative speed to produce a workload execution time for the application. Thebenchmark then uses a weighted harmonic mean to combine those application numbers to get anumber for each category.
3. The same formula is used to compute an overall score, but the final number is multiplied by 10.
Interpreting the results is straightforward : Higher numbers mean better performance.
• Winbench 97®
Winbench 97® is a subsystem-level benchmark that measures the performance of the followingsubsystems in a Windows-based environment:• Graphics• Disk• Processor• CD-ROM• Video• DirectDrawOf these, only the first two shall be used. Concerning the disk benchmarks, Winbench 97® returns thefollowing results that provide an overview of the disk performance:• High End Disk Winmark 97• Business Disk Winmark 97• Disk Winmark 97The synthetic disk tests consist of the following accesses to a 90 MB file:• Disk/Read, CPU Utilization (%)• Disk/Read, Sequential 200, 512, 2048, 4096 Bytes blocksize• Disk/Read, Random 200, 512, 2048, 4096 Bytes blocksize• Disk/Write, CPU Utilization (%)• Disk/Write, Sequential 200, 512, 2048, 4096 Bytes block size• Disk/Write, Random 200, 512, 2048, 4096 Bytes block sizeThe three elements : mode of operation (read/write), the type of access (sequential/random) and thedifferent block sizes, make a Full Factorial Design out of these synthetic tests. One can easily calculate

12
that the total number of combinations of the three factors is 16 (2 x 2 x 4) giving us some more insightinto the performance characteristics of the system. For these tests, bigger numbers mean betterperformance.The Disk Winmark 97 tests can also produce CPU utilization results, a measure of the percentage ofthe processor that disk usage consumes. For this test, the lower the result the better, because moreprocessor time is then available for other activities. The Disk Winmark 97 test executes the same seriesof disk operations Winstone 97®’s business and high-end applications perform. The results arecomputed in the following manner :1. During the Disk WinMark test, Winbench 97® plays back the logs we recorded for each Winstone
97® Business or High-End application.2. The benchmark times how long the test machine plays back each application log.3. Winbench 97® calculates the transfer rate (how many thousands, not 1024 but 1000, of bytes per
second the system read or wrote to the disk) for each application.4. Winbench 97® uses a weighted harmonic mean of transfer rates (using the Winstone 97®
application weights) to produce the Disk WinMark 97 result. The result is the number ofthousands of bytes (1000, not 1024) per second transferred.
Note that a transfer rate test actually stresses the whole disk subsystem, which includes:• the disk drive• the pathway between the hard disk and the controller• the pathway between the disk controller and the main memory• the disk device drivers• the interaction of the disk subsystem with the OSBecause the test reproduces the kind of disk activities applications carry out, we can use the results as aguide to the kind of throughput we can expect to see when working with the PC’s disk subsystem.
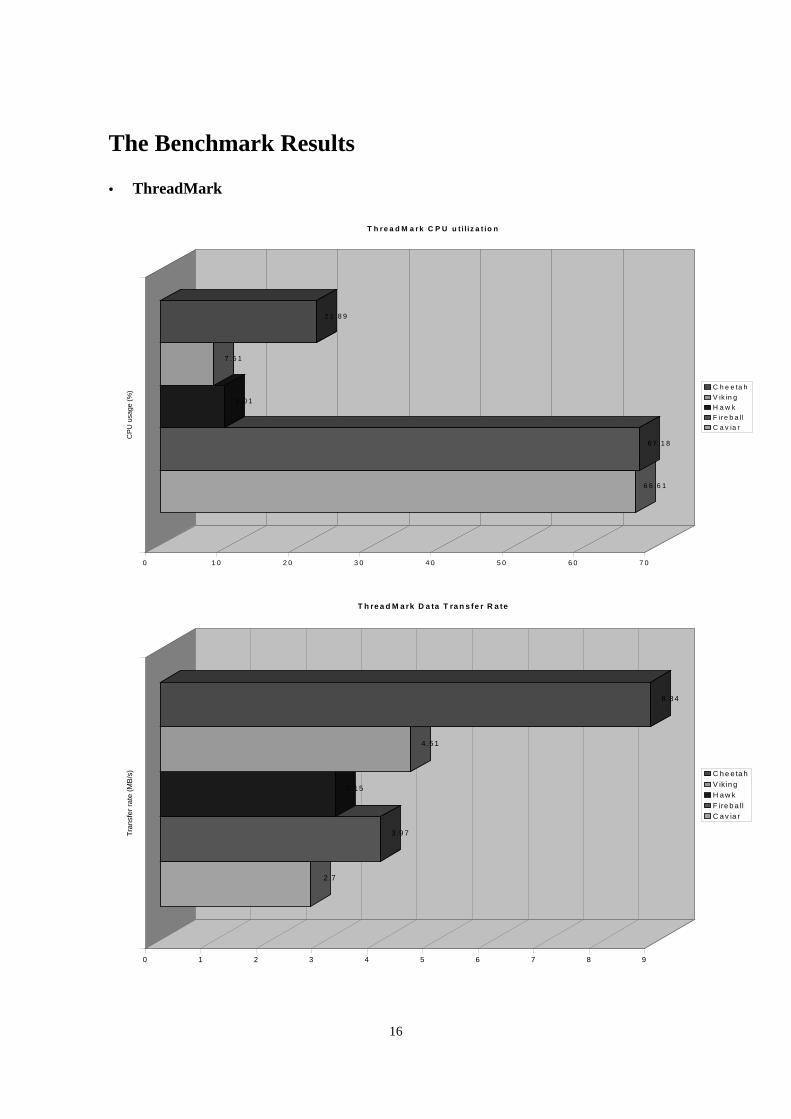
• Threadmark
ThreadMark is a standard 32-bit application that measures two key disk performance indicators : datatransfer rate in MB/s and percent CPU utilization. It makes a comprehensive series of measurementsusing a mixture of single and multithreaded requests across a range of request block sizes. Themeasurements results in 128 individual data points, which are weighted according to a profile thatrepresents typical I/O behaviour in a Windows dektop system. After the measurements are weighted,they are averaged together to arrive to a single-number data transfer rate and CPU utilization scires.This is done in the following way. When ThreadMark is executed for the first time, a CPU baselinenumber is established for use in calculating the amount of CPU utilization required to perform the I/Otasks. The CPU baseline is established by calculating prime numbers while there is no other systemactivity. The number of calculations completed over a pre-defined period of time is recorded, with theresult representing 100% CPU utilization.Once the baseline is established the benchmark will begin taking I/O measurements. During this time,the benchmark will continue to calculate prime numbers in the background using a thread with idlepriority. Because the thread has idle priority, it will only be active if there is no other system activity,and it will not affect I/O measurements. When the measurements are finished, the number ofcompleted prime number calculations is scaled to match the time frame of the original CPU baseline.The scaled number is then compared with the original according to the formula:
CPU utilization = 100 - scaled number of calculations during I/O measurements x 100 baseline number
Test files for read measurements are created before taking each measurement so the files are notaccessed out of operating system cache. Each file is twice the size of the system RAM to furtherminimize caching effects. Test files are created one at a time to minimize fragmentation. Once the testfiles are created, the benchmark starts taking I/O measurements. Each file is accessed using a singlethread. Threads are permitted to begin I/O as soon as they are created, and all thread management ishandled through the operating system scheduler. The measurements stop at the time when any threadreaches the end of its file. The benchmark calculates the data transfer rate by measuring the number of

13
bytes transferred and the transfer time. It also performs the calculations used to determine CPUutilization. The results are stored in system memory to avoid influencing disk performance.ThreadMark runs a series of measurements using one to four threads. Both read and write requests aregenerated using 512 Bytes, 1 KB, 2 KB, 4 KB, 8, KB, 16 KB, 32 KB and 64 KB block sizes. Theresult is 64 individual test passes, with each pass recording the data transfer rate and the percent ofCPU utilization. When all measurements are complete, the results are weighted using the profilebelow.
Overall Thread Type Block Size
% % Read or Write 512 1K 2K 4K 8K 16K 32K 64K
50 1 Thread Reads - 80 % 10% 2% 2% 40% 2% 4% 10% 30%
% 1 Thread Writes - 20 % 10% 5% 5% 60% 2% 4% 4% 10%
35 2 Thread Reads - 80 % 10% 2% 2% 40% 2% 4% 10% 30%
% 2 Thread Writes - 20 % 10% 5% 5% 60% 2% 4% 4% 10%
10 3 Thread Reads - 80 % 10% 2% 2% 40% 2% 4% 10% 30%
% 3 Thread Writes - 20 % 10% 5% 5% 60% 2% 4% 4% 10%
5 4 Thread Reads - 80 % 10% 2% 2% 40% 2% 4% 10% 30%
% 4 Thread Writes - 20 % 10% 5% 5% 60% 2% 4% 4% 10%
Each transfer rate and CPU measurement is weighted according to the block size and the results aresummed according to thread type. The eight resulting numbers are then multiplied by the percentage inthe ‘Thread Type’ column and the read and write results for each thread count are added together. Theresulting four numbers are then multiplied by the percentages in the ‘Overall’ column and addedtogether to arrive at the single-number result.

14
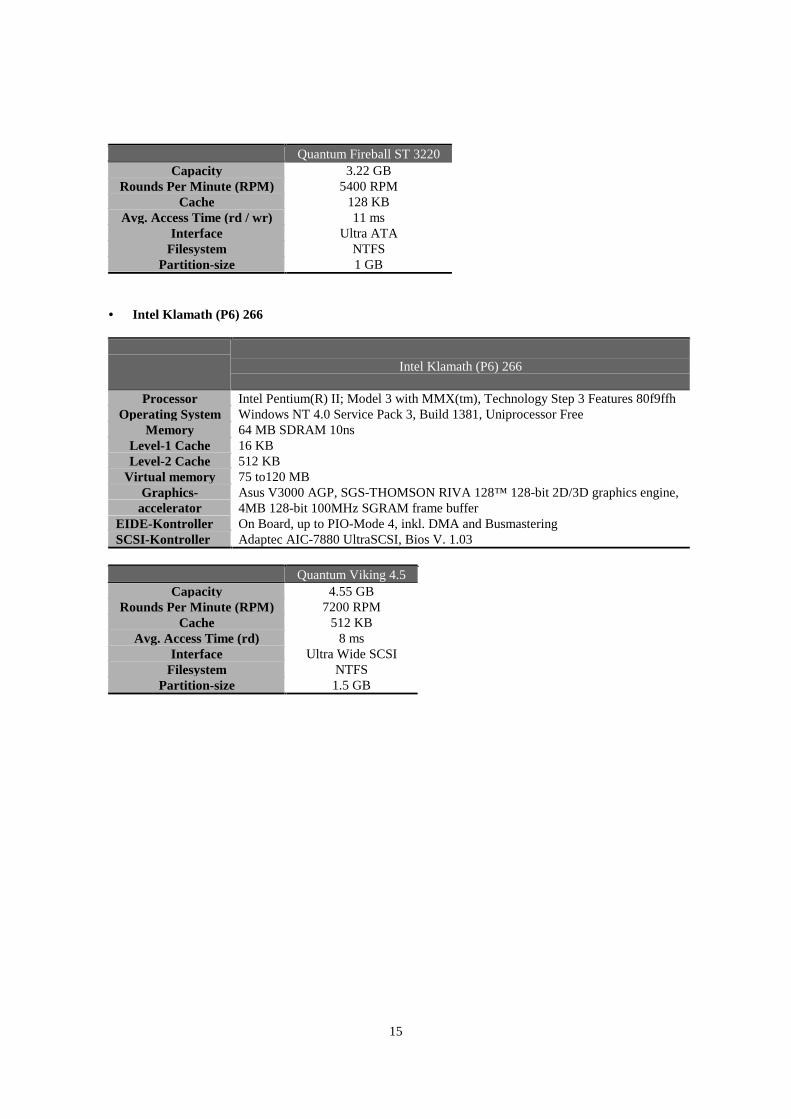
The SystemsA specification of the machines we have used for our performance analysis can be found below. The first ofthese machines, a Dell computer, can be found in the lab for Computer Systems (RZ J-Stock, ETH). Theother machines tested have no brandname as they have been assembled by Christopher. The latter of thetwo is still in his possesion.
• Dell System OptiPlex GXpro 200USD Enhanced
Dell System OptiPlex GXpro 200USD Enhanced
Processor Intel Pentium Pro 200 MHz, Step 9 Features fbffhOperating System Windows NT 4.0 Service Pack 3, Build 1381, Uniprocessor Free
Memory 64 MB EDO 60nsLevel-1 Cache 16 KBLevel-2 Cache 256 KB
Virtual memory 64 to 96 MBGraphics-
acceleratorMatrox Power Graphics Accelerator, MGA-2064W B4 R2, DAC: TI TVP3026(220MHz), 4 MB DRAM
EIDE-Kontroller On Board, bis PIO-Mode 4, inkl. DMASCSI-Kontroller Adaptec AHA-2940 Ultra Wide SCSI, Bios V. 1.03
The disks that were benchmarked using this machine are the following :
Cheetah Hawk 4 CaviarCapacity 4.55 GB 4.294 GB 3.166 GB
Rounds Per Minute (RPM) 10033 RPM 5411 RPM 5200 RPMCache 512 KB 512 KB 128 KB
Avg. Access Time (rd / wr) 7.7 / 8.7 ms 10.4 / 11.4 ms 12 msInterface Ultra Wide SCSI SCSI-2 Fast EIDE
Filesystem NTFS NTFS FATPartition-size 2 GB 2 GB 1 GB
• Intel Pentium 200 MMX
Intel Pentium 200 MMX
Processor Intel Pentium MMX 200 MHz, Step 9 Features fbffhOperating System Windows NT 4.0 Service Pack 3, Build 1381, Uniprocessor Free
Memory 64 MB EDO 60nsLevel-1 Cache 16 KBLevel-2 Cache 512 KB
Virtual memory 75 to 120 MBGraphics-
acceleratorMatrox Millenium II, MGA-2064W B4 R2, DAC: TI TVP3026 (220MHz), 4 MBWRAM
EIDE-Kontroller On Board, up to PIO-Mode 4, inkl. DMA and BusmasteringSCSI-Kontroller None
15
Quantum Fireball ST 3220Capacity 3.22 GB
Rounds Per Minute (RPM) 5400 RPMCache 128 KB
Avg. Access Time (rd / wr) 11 msInterface Ultra ATA
Filesystem NTFSPartition-size 1 GB
• Intel Klamath (P6) 266
Intel Klamath (P6) 266
Processor Intel Pentium(R) II; Model 3 with MMX(tm), Technology Step 3 Features 80f9ffhOperating System Windows NT 4.0 Service Pack 3, Build 1381, Uniprocessor Free
Memory 64 MB SDRAM 10nsLevel-1 Cache 16 KBLevel-2 Cache 512 KB
Virtual memory 75 to120 MBGraphics-
acceleratorAsus V3000 AGP, SGS-THOMSON RIVA 128™ 128-bit 2D/3D graphics engine,4MB 128-bit 100MHz SGRAM frame buffer
EIDE-Kontroller On Board, up to PIO-Mode 4, inkl. DMA and BusmasteringSCSI-Kontroller Adaptec AIC-7880 UltraSCSI, Bios V. 1.03
Quantum Viking 4.5Capacity 4.55 GB
Rounds Per Minute (RPM) 7200 RPMCache 512 KB
Avg. Access Time (rd) 8 msInterface Ultra Wide SCSI
Filesystem NTFSPartition-size 1.5 GB
16
The Benchmark Results
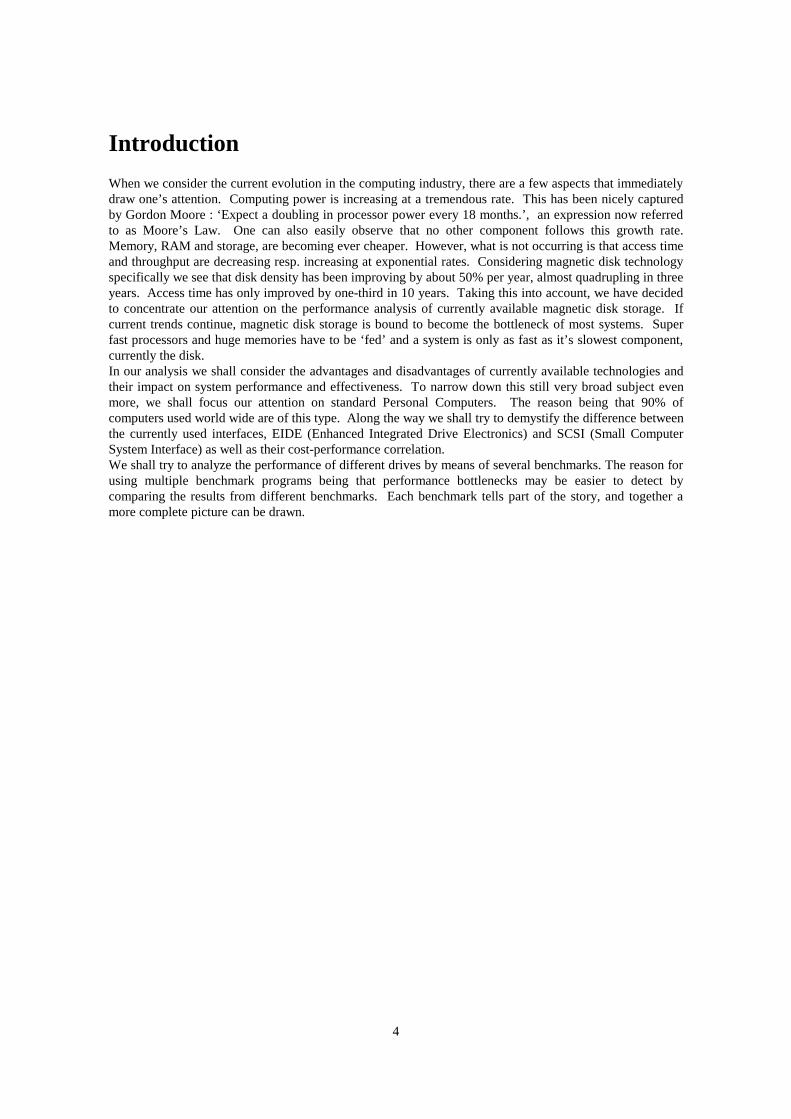
• ThreadMark
6 6 .6 1
6 7 .1 8
9 .0 1
7 .5 1
2 1 .8 9
0 1 0 2 0 3 0 4 0 5 0 6 0 7 0
CP
U u
sage
(%
)
T h r e a d M a r k C P U u t i l iz a t io n
C h e e ta h
V ik in gH a w k F ire b a llC a v ia r
2 .7
3 .9 7
3 .1 5
4 .5 1
8 .8 4
0 1 2 3 4 5 6 7 8 9
Tra
nsfe
r ra
te (
MB
/s)
T h re a d M a rk D a ta T ra n s fe r R a te
C h e e ta h
V ik in g
H a w k
F ire b a llC a v ia r

17
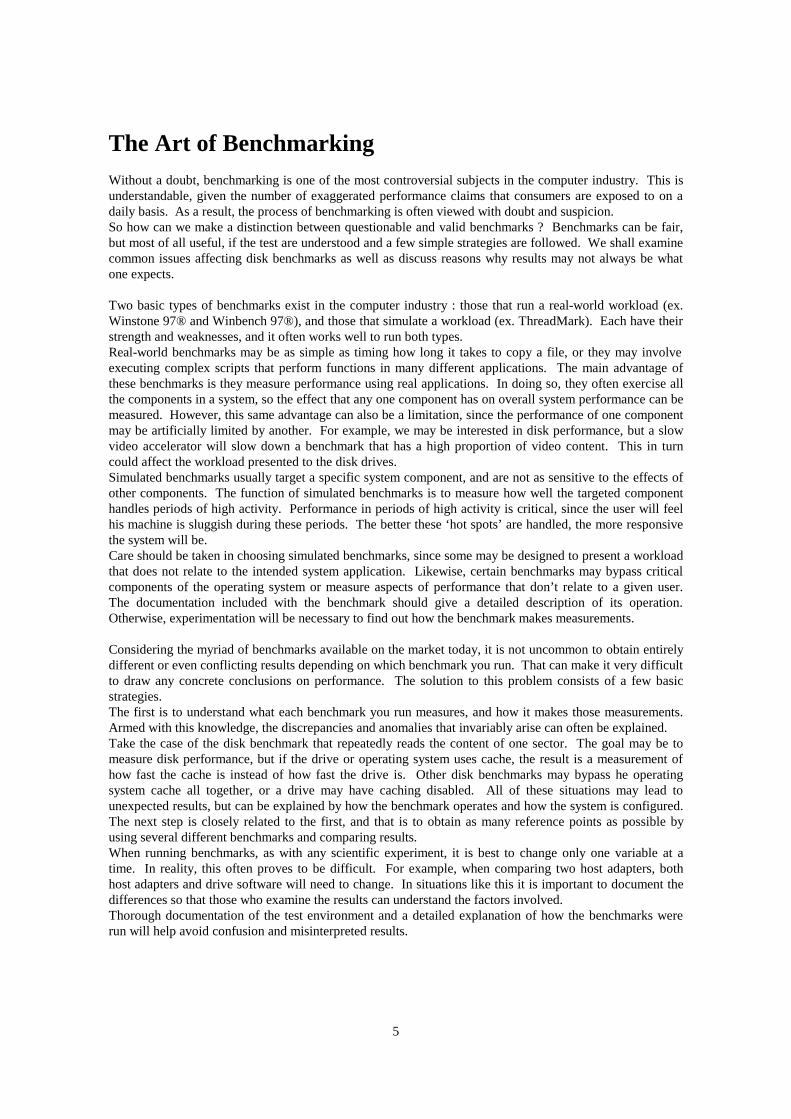
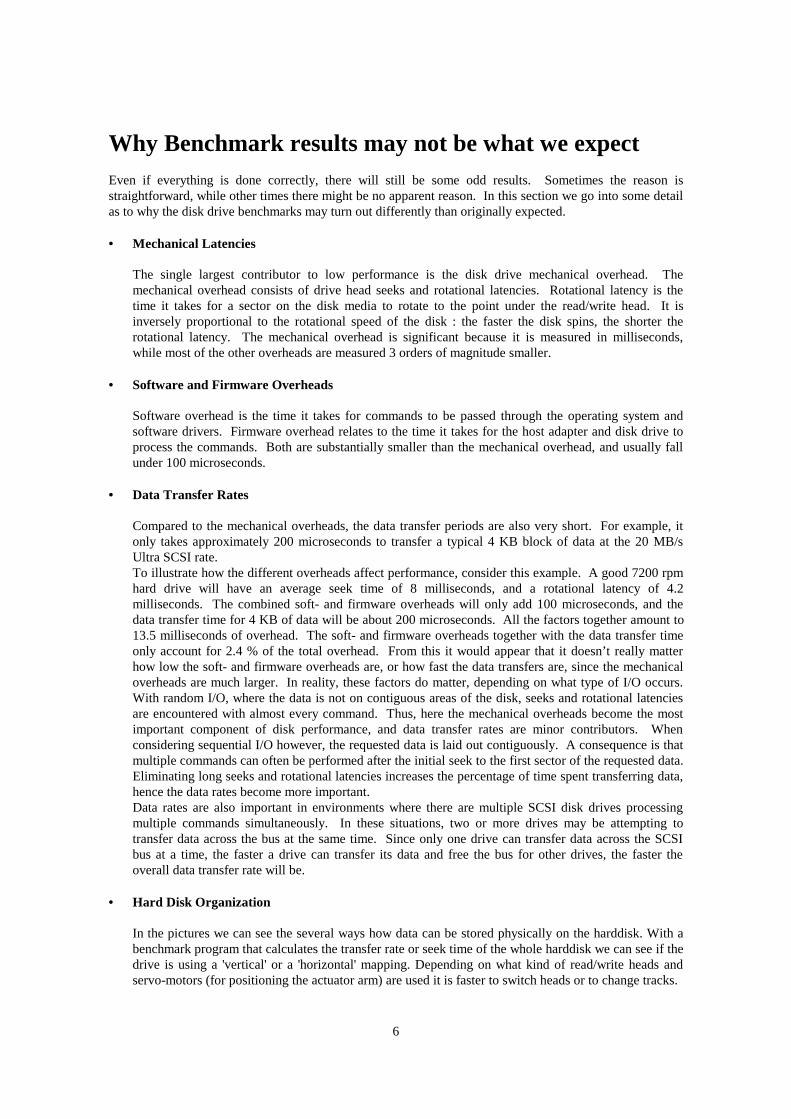
• Winbench 97®
16.2 16.1 22.9 23.536.8 43.2 47.5
58.6 62.5
93.1
171194
227207
358340
377
470 477
730
0
100
200
300
400
500
600
700
800
200 bytes 512 bytes 2048 bytes 4096 bytes
Disk/Read Random
Cav iarF ireball
Hawk
Viking
Cheetah
3140
7050
3630
8580
9270
3710
8260
4300
9789
13700
4050
7400
3860
8660
13800
4020
8610
4230
9989
13700
0
2000
4000
6000
8000
10000
12000
14000
200 bytes 512 bytes 2048 bytes 4096 bytes
D isk/R ead S eq uentia l
C av iar
F ireball
H awk
V ik ing
C heetah

18
5.81 9.46 11 13.3 19.5 15 24.1 28.1 33.7 43.260
93.7115
132
199
250
550
434
608
976
0
100
200
300
400
500
600
700
800
900
1000
200 bytes 512 bytes 2048 bytes 4096 bytes
Disk/Write Random
Caviar
Fireball
Hawk
Viking
Cheetah
943
1750
1240
24402450
990
1860
1210
26602760
1020
1900
1160
31103090
2130
4050
2630
5800
6110
0
1000
2000
3000
4000
5000
6000
7000
200 bytes 512 bytes 2048 bytes 4096 bytes
Disk/W rite Sequential
Caviar
Fireball
Hawk
Viking
Cheetah

19
95.6 94.1
11.4
16.2
38 37.934.9
9.95
22.220.3
0
10
20
30
40
50
60
70
80
90
100
CPU Read CPU W rite
CPU Usage
Caviar
Fireball
Hawk
Viking
Cheetah
8691060
824940
1420
2031
2990
2340
3250
4580
746
957 931
1150
1550
8691060
824940
1420
0
500
1000
1500
2000
2500
3000
3500
4000
4500
5000
Business Disk W inmark 97 High-End Disk W inmark 97 Bus : Database Bus : Overall
Disk Playback
Caviar
Fireball
Hawk
Viking
Cheetah

20
1170145010791280
2000
818 976 721 7961230 143116701459
21402830
9140
1070010199
11100
16400
0
2000
4000
6000
8000
10000
12000
14000
16000
18000
Bus : Publishing Bus : W P/SS He : AVS HE : APP Dev
Disk Playback
Caviar
Fireball
Hawk
Viking
Cheetah
20412420
2143
3010
4160
1459
2970
1880
2640
3780
4629
59105890
8420
10000
2028
2990
2342
3250
4581
0
1000
2000
3000
4000
5000
6000
7000
8000
9000
10000
HE : CAD/3D HE : Im age Editing HE : Microstation HE : Overall
Disk Playback
Caviar
Fireball
Hawk
Viking
Cheetah
21
18 002110
1 815244 0
3730
286 2
4940
29 80357 0
6330
98 0
2120
13 702090
2 690
9140
1070010 200
1110 0
1 6400
0
200 0
400 0
600 0
800 0
1000 0
1200 0
1400 0
1600 0
1800 0
H E : P V -W av e H E : P ho to sh op H E : P ic tu re P ub lisher H E : V isu a l C + +
D isk P layb ac k
C av ia r
F ireb a ll
H aw k
V ik ing
C he etah
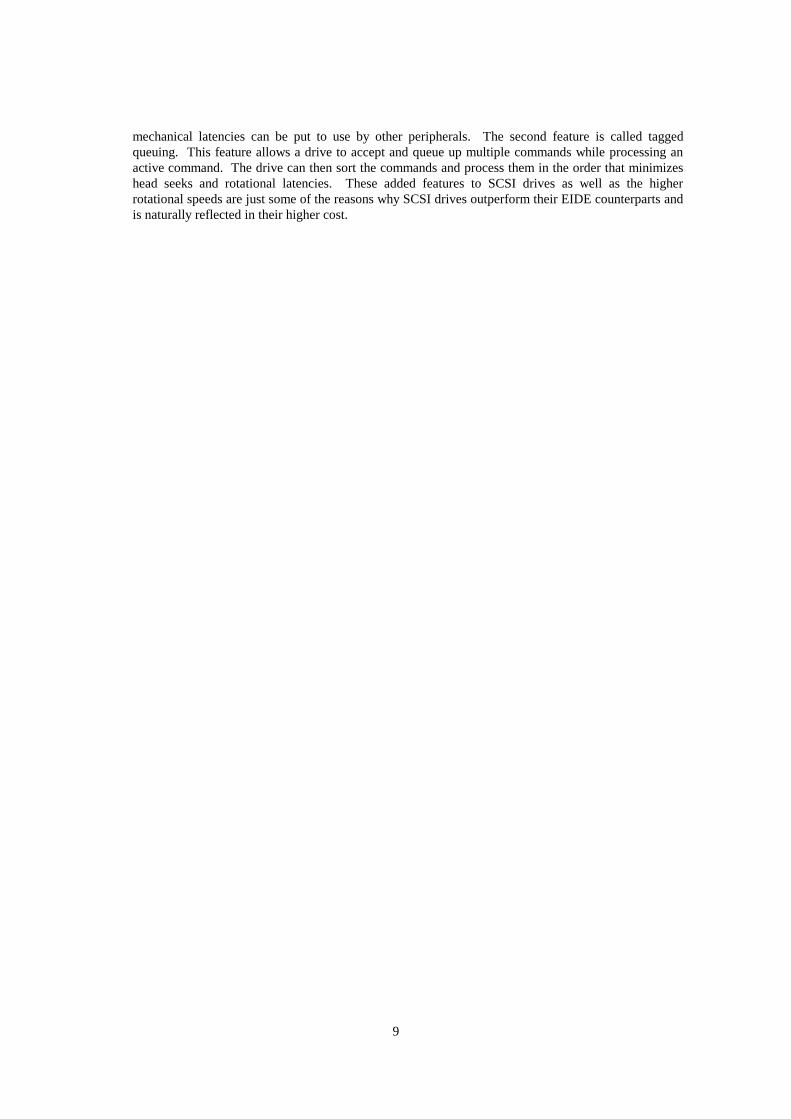
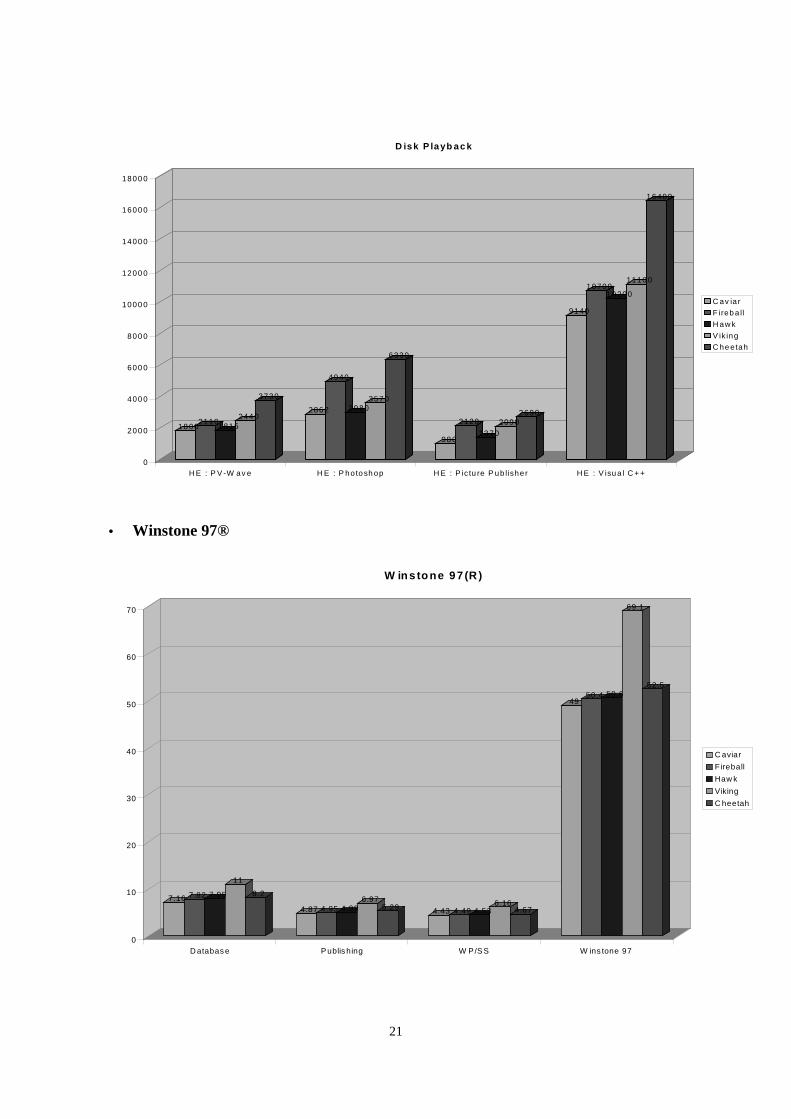
• Winstone 97®
7.16 7.82 7.95
11
8.2
4.87 4.95 4.996.97
5.29 4.43 4.49 4.536.16
4.67
4950.4 50.6
69.1
52.5
0
10
20
30
40
50
60
70
D atabas e P ublis hing W P/S S W ins tone 97
W instone 97 (R )
C aviar
F ireball
Haw k
Viking
C heetah

22
After having compared the ThreadMark results to the ones returned by Winbench®, we can draw theconclusion that EIDE-drives will become the bottlenecks in multitasking, multi-user or server systems.Both benchmarks return similar results. The EIDE-I/O consumes more than 68% of processor resources.A detail that should be mentioned is the impact of processor speed when using EIDE–drives. Taking intoaccount the amount of CPU resources that these drives consume, it is clear that a faster processor will beable to handle I/O traffic more efficiently than a slower one. On the machines using EIDE-drives that wetested, the processor performance difference is not very big. However, if we were to test the same drive onfor example a Pentium II 266 and a Pentium Classic 133, we would expect to see a difference in transferrate although we are testing exactly the same drive. How big this difference would be is unclear.Concerning SCSI drives, CPU speed should not have a very great impact because the CPU load of the I/Ooperations remains under 10%. This is one of the characteristics that make SCSI-drives great for disk-intensive environments such as multi-tasking systems or disk intensive applications such as image and audioediting. The read or write operation is submitted and the SCSI controller handles most of the overheadmaking the CPU available for other operations. The data transfer rates returned by ThreadMark aredifficult to compare to the tranfer rates returned by Winbench as both programs use totally differentblocksizes. What’s more, ThreadMark returns only a single value having been calculated in the waymentioned above. The global trend is however comparable.
The Winbench 97® results give us some more insight into the behaviours of the different drives whenreading and writing varying amounts of data. What we are forced to mention is that contrary toThreadmark, Winbench 97® uses rather small blocksizes for its tests. Knowing that Windows NTTM
operates on blocksizes of 4096 bytes, we can expect some considerable caching effects when performingsequential reads on smaller data units. At this point, we are not evaluating drive performance anymore butrather cache performance. Personally, we find the approach of using much larger data units, asimplemented by ThreadMark, a better approach since it tries to minimize the influence of caching. Whatcan be deduced from the Winbench 97® results is that for small data units (200 bytes), the data transferrates we measure are extremely low. The mechanical overhead when performing random reads and writesbecomes dominant. Looking at the sequential operations for the same block size, we find data transfer ratesthat are up to 300 times higher. This can probably be attributed to caching. As the block sizes increase, theinfluence of mechanical overhead decreases and we notice a corresponding increase in data transfer rate.When looking at block sizes of 4096, NT’s operating mode, the difference between random and sequentialwrites falls back to a mere factor of 6. Another striking feature is the near lacking in difference betweensequential read performance of blocks of size 512 KB, 2048 KB and 4096 KB. Once again the probablereason being caching of the data.There are also however some results that we don’t fully understand such as the Quantum Fireball scoring ahigher Business Disk Winmark than the Quantum Viking, the more performing drive when we look at boththeir specifications. Technicaly and theoretically this should not be such. If it it due to the testing beingdone on two very different machines or if it simply due to measurement errors remains a mistery. Moreextensive testing would be required to solve this dilemma.
The Winstone 97® results are somewhat peculiar. We see that drive performance does not have a greatimpact on global system performance. We do not get a factor two speed up by using a super fast UltraWide SCSI drive in stead of a EIDE-drive. The slightly higher performance of the Dell machine usingSCSI drives can be explained by the aforementioned reduced CPU load of the I/O operations. Thedifference between the different SCSI-drive configurations can in its turn be explained by the highertroughput that the Cheetah drive has, thus pumping the data into memory at a higher rate. The Winstone97® result for the Pentium II 266 machine has been added to show that a slightly lower performing drive,i.e. the Viking compared to Cheetah, can be more than compensated by building an overall well balancedsystem. It is very hard to determine the exact reasons why the Klamath configuration shows such anadvantage over the Pentium Pro machine, but this is certainlz not because of the CPU. Other factors thatare very likely to play a role are different motherboard chipsets, different SCSI-controller chips and drivers(AHA-2940 UW vs. AIC-7880), different types of RAM (EDO DRAM vs. SDRAM), different graphicssubsystems, etc.
Conclusion

23
As mentioned in the introduction, the goal of this paper was to compare the performance of several diskdrives using benchmarks. Although we have focused our attention on subsystem level performance of thedifferent drives, we have included the results for the Winstone 97® benchmark suite. This has been done toshow the impact of the disk drives performance on global system performance. The reader should howevertake care when reading the Winstone 97® results. These results only indicate the influence of the drive ifthe benchmark has been run on the same or identical systems, except for the disk drive. This is due to thefact that system-level performance is determined by many more factors than merely the disk drive.Processor type, amount of memory, operating system, system bus chipset, graphics accelerator and manyothers contribute to the systems performance. Knowing this, the reader can use the Winstone 97® resultsfor the Dell machine to compare disk drive performance impact on global performance.
Taking into account the arguments put forward in the previous chapters, it becomes clear that measuringreal drive-performance is not a trivial task just consisting of installing a program, running it and publishingthe results. In this paper we have tried to tackle the problem of comparing different drives and drive-typesin an intelligent and organized fashion, pointing out some of the factors one should consider… and there area lot.

24
Part II
Graphics Subsystem PerformanceAnalysis
by Marko Aho
Part II
Graphics Subsystem PerformanceAnalysis
by Marko Aho

2
Table of Contents
I. Introduction p. 3II. Tested subsystems and test configurations p. 3III. Discussion of parameters p. 4IV. The applied tests p. 6V. Summary of results p. 7VI. Discussion of overall performance effects p. 10VII. Conclusions about the results p. 11VIII. Literature p. 12

3
I. Introduction
The monitor is the primary output device of a modern day computer system. In the last decade theprocessing power has increased rapidly and ever increasing resolutions and color depths have becomecommon on the mainstream PC or workstation. This imposes growing demands on the performance andthroughput of the graphics subsystem. As the quality of visual output is important for both professional andhome users, this sector of technology has grown into a major industry with considerable research anddevelopment.
The components that build up the graphics subsystem, or have a direct impact on it, are:
• the internal bus• graphics adapter• graphics adapter driver• the monitor
This paper will discuss the comparison of four conventional graphics subsystems and give an indication oftheir effect on the overall system performance. Specialized 3D capabilities are not benchmarked. A moderngraphics subsystem based on the Advanced Graphics Port has been included as reference point to thenewest technologies used on the desktop market.
II. Tested subsystems and test configurations
The following table summarizes the properties of the tested graphics subsystems:
Adapter Graphics chip Driver / Date Memory RAMDAC Bus
Matrox Millenium MGA-2064W mga_mil.sys, 14.10.1996, 2.20.1371.01mga.dll, 30.4.1997, 4.00.1381.04
4 MB WRAM 220 Mhz PCI
STB PowerGraph S3 Trio64 s3.sys, 30.4.1997, 4.00.1381.04s3.dll, 30.4.1997 4.00.1381.04
2 MB DRAM N/A PCI
S3 ViRGE/DX S3 3D s3virge.sys, 21.11.1996, 3.51.1057.01S3Virge.dll, 2.11.1996
2 MB EDO DRAM 170Mhz PCI
ASUS V-3000 AGP Riva 128 nv_disp.dll, 05.9.1997, 4.00.1381.01 4 MB VRAM 230 Mhz AGP
The following machines were used to perform the tests:
• 2 Dell OptiPlex GXpro / Pentium Pro 200MHz (Matrox Millenium I, STB PowerGraph)• AMD 200MMX (S3 ViRGE/DX)
Exact configuration descriptions of all systems can be found from the tables on page 14 of Part I. To ensurecomparability of the graphics subsystem results, all machines were equipped with:
• 64 MB of RAM• a 17 inch monitor• Windows NT 4.0• PCI bus running at 33MHz
For the reference AGP system, the following configuration was used :
• Pentium II 266MHz AGP (ASUS V-3000 AGP)

4
III. Discussion of parameters
Numerous characteristics of the graphic subsystem contribute towards the perceived speed and versatilityof use. The following section explains the effects of the various factors and technical implementations.
Technical factors:
• Graphics chip Several manufacturers develop special chip sets to accelerate graphics rendition.Modern chips implement many functions in hardware making them faster whilelifting the load off the CPU. The number of hardware supported functions playsa decisive role especially in the 3D world, and most of the development work iscurrently being conducted in this field.
Manufacturers are developing new accelerated chip sets at product cycles asshort as a half a year, while more complex functions are developed and takeninto use by updated Application Programming Interfaces (API).
• System bus The system bus type and speed control the available bandwidth between theCPU, main memory and the graphics adapter. Current desktop configurationsuse almost exclusively a PCI bus, as older and slower ISA and VESA cards aredisappearing from the market. Older Pentium class configurations (P75 – P150)run the PCI bus at 25 or 30MHz, whereas all the current marketed systems areable to run the PCI bus at 33MHz. The new Advanced Graphics Port (AGP)available e.g. on the Intel 440LX chip set can quadruple the bandwidth as itoperates at 66Mhz and can transfer data at the rising and falling slope of thetrigger signal. The down side of AGP is that is not an actual bus architecture buta port, and can run only one device on it.
The motherboard chip set that controls the bus can also affect its performance,and better performance can be achieved using the more current chip setsavailable on the market.
• Adapter internal bus The internal bus needs to transfer data between the graphics chip, video memoryand the RAMDAC. Since both the chip and the RAMDAC need to access thevideo memory virtually simultaneously the bandwidth of the internal bus caneasily become a bottleneck. One way of improving the performance is to makethe bus wider. Only a few years ago 32 bit buses were the top of the technologybeing able to transfer 4 bytes per cycle. Nowadays current adapters feature64 and 128 bit wide buses, being able to simultaneously transfer blocks of 8 and16 bytes, respectively.
It is important to notice though, that the data bus of the most commonly used8x1Mbit memory chip is only 32 bits wide. This means that to get the benefit ofa 64 or 128 bit wide bus, 2 or 4 such chips need to be used parallel. Hence anadapter with a 128 bit bus should not be equipped with less than 4 MB of videomemory.
• RAMDAC RAMDAC is the component responsible for translating digital information to ananalog form that can be sent to the monitor. A screen includes a certain amountof pixels depending on the resolution, and this amount of data has to betransferred to the monitor several times a second depending on the used refreshrate. From an ergonomic point of view, the refresh rate should be over 75Hz,which means that the RAMDAC needs to operate at a very high frequency. Afew years old RAMDAC operate at 120-140MHz, while the newer ones achieverate in excess of 200MHz.
5
The newest chips have an integrated RAMDAC in an effort to lower costs, butexternal ones are usually of higher quality.
The speed of the RAMDAC constricts the available refresh rates, which explainswhy at higher resolutions and color depths, sometimes only mediocre refreshrates can be achieved. It must be carefully checked that the adapter is able toprovide sufficiently high non-interlaced refresh rates at the screen modes thatare planned to be used.
• Refresh rate The higher the screen redraw rate is, the higher throughput is needed, whichstresses the RAMDAC. To cancel out this factor, these tests have been run usingan ergonomically recommendable refresh rate of 75Hz.
Software related factors:
• Driver The driver is responsible for translating graphical API calls to the correspondingfunctions of the chip. The drivers can also emulate (especially 3D) functions thatare not supported at hardware level by the chip. For CAD and high endrendering, conformity of the driver to the HEIDI and OpenGL standards can bea decisive factor, whereas for gaming the compatibility with Direct3D is fairlycrucial. A driver not implementing emulation or whose API translation is doneinefficiently will reduce the overall efficiency, cause incompatibility problemsand will be unable to display functions not implemented at hardware level.
Memory related factors:
• Amount of memory The amount of memory determines the maximum resolutions and color depthsthat can be used. In 2D use the needed amount of memory is easy to calculate bymultiplying the screen width, height and color depth in bytes. In 3D a lot morevideo memory is needed to store the front, back and z-buffer color values. Insome modern 3D cards there is also additional memory for texture maps.
Following calculations show the memory requirements of some commonly usedvideo modes:
800 pixels x 600 pixels x 256 colors (8bit) = 0.46M800 pixels x 600 pixels x 65K colors (16bit) = 0.92M1024 pixels x 768 pixels x 65K colors (16bit) = 1.5M1024 pixels x 768 pixels x 16.7M colors (24bit) = 2.25M1024 pixels x 768 pixels x 65K + Z-buffer (32bit) = 3.0M1280 pixels x 1024 pixels x 65K (16bit) = 2.5M
• Memory type The video memory is situated between the graphics chip and the RAMDAC.The chip reads and writes data from the memory, and the RAMDAC would needto simultaneously read the data to send it to the monitor. With conventionalDRAM only one of these two components can access the memory at a time,which causes a lot of latency. Due to the extremely high frequency demands thehigh resolutions and refresh rates impose on the RAMDAC, dual portedsolutions have been developed that enable both components to simultaneouslyand independently access the video memory. Two of the most used dual portedmemory types are VRAM and WRAM, of which WRAM has an improvedinternal structure making it slightly faster than VRAM. Because of their morecomplex architecture they are more expensive than single ported memory butoffer higher performance.

6
• Memory speed Video memory performance can be improved also by higher frequencies as isthe case with synchronous memory chips SDRAM and SGRAM that can run atfrequencies of 100MHz or higher.
IV. The applied tests
The graphics subsystems have nowadays several tasks to handle, including business graphics, high endpicture processing and 3D rendition. This test will focus itself on 2D performance for several reasons. Firstof all none of these cards, except for the ASUS AGP card, have significant built-in 3D capabilities. 3Drendition is also still limited to a rather narrow application area consisting mainly of games, CAD andprofessional image editing. Current 3D engines are also reliant on specialized APIs or drivers like DirectX5, which are not currently available for Windows NT 4.0.
For testing the cards, Ziff-Davies’ WinBench 97 was used. WinBench 97 is a complete suite of systembenchmarks including benchmarks to measure the graphics subsystem performance with workloadsemulating some of the most widely used business and image editing packages. For this comparison, bothBusiness Graphics WinMark and High End Graphics WinMark were run to widely simulate the various reallife workloads of professional and home users.
The following is a list of the components of the two benchmarks:
Business Graphics WinMark High End Graphics WinMark
Access AVSCorelDRAW! MicroStationExcel PhotoshopParadox Picture PublisherPowerPoint PV-WAVEWord Visual C++Word Pro
Considering the most often used resolutions and the limitations imposed by some cards being equippedonly with 2 MB of video memory, every card was subjected to the following tests:
• Business WinMark 800 x 600 x 8 bit color• Business WinMark 1024 x 768 x 16 bit color• High End WinMark 1024 x 768 x 16 bit color• High End WinMark 1280 x 1024 x 8 bit color
All tests were carried out using a refresh rate of 75 Hz.
To investigate the impact of the graphics subsystem performance on the overall system performance, thetwo otherwise identically equipped Pentium Pro 200MHz systems were benchmarked with WinStone 97suite. This benchmark is described in detail on page 10 of Part I.
The WinStone 97 suite was run using resolution 800x600x8bits and 1024x768x16bits, which correspond tothe resolutions used for the WinBench 97 Business Graphics WinMark.

7
V. Summary of results
Business Graphics WinMark at 800x600x8bits
Business Graphics WinMark at 1024x768x16bits
From these results we can see how the Millenium chip clearly outperforms the S3 chips. Interesting to notethough is the fact how the STB PowerGraph chip has trouble with the higher resolution, and ends up theslowest of the tested adapters even though it had a healthy marginal over the S3 ViRGE at the lowerresolution. On the contrary Matrox Millenium I adapter actually closes the gap to the reference ASUS carda bit at the higher resolution.
0 20 40 60 80 100 120 140
Business DatabaseG
4.8312.39.468.91
Business Graphics WinMark
58.2153117
80.5
Business PublishingG
7.4416.612.5
10
AMD200MMX S3 ViRGE/DX800 600 8
PII 266, Asus V-3000 AGP,800 600 8
PPro200 Matrox Millenium I800 600 8
PPro200 STB PowerGraph800 600 8
WinBench® 97 Version
Worse Better
0 20 40 60 80 100
Business Database Graphics
4.0511.89.175.09
Business Graphics WinMark 97
41.5117
93.540
Business Publishing Graphics
4.3710.18.655.26
AMD200MMX S3 ViRGE/DX1024 68 16
PII 266, Asus V-3000 AGP,1024 768 16
PPro200 Matrox Millenium I1024 68 16
PPro200 STB PowerGraph1024 68 16
WinBench® 97 Version 1.0
Worse Better
8
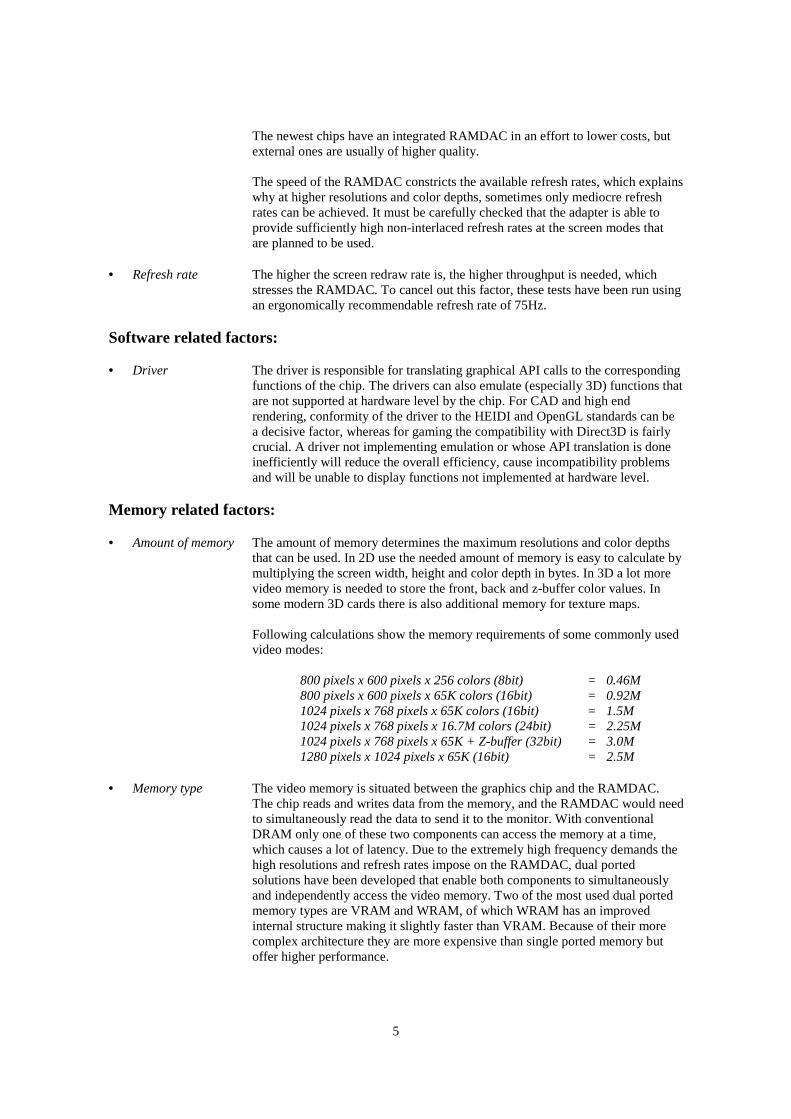
High End Graphics WinMark at 1024x768x16bits
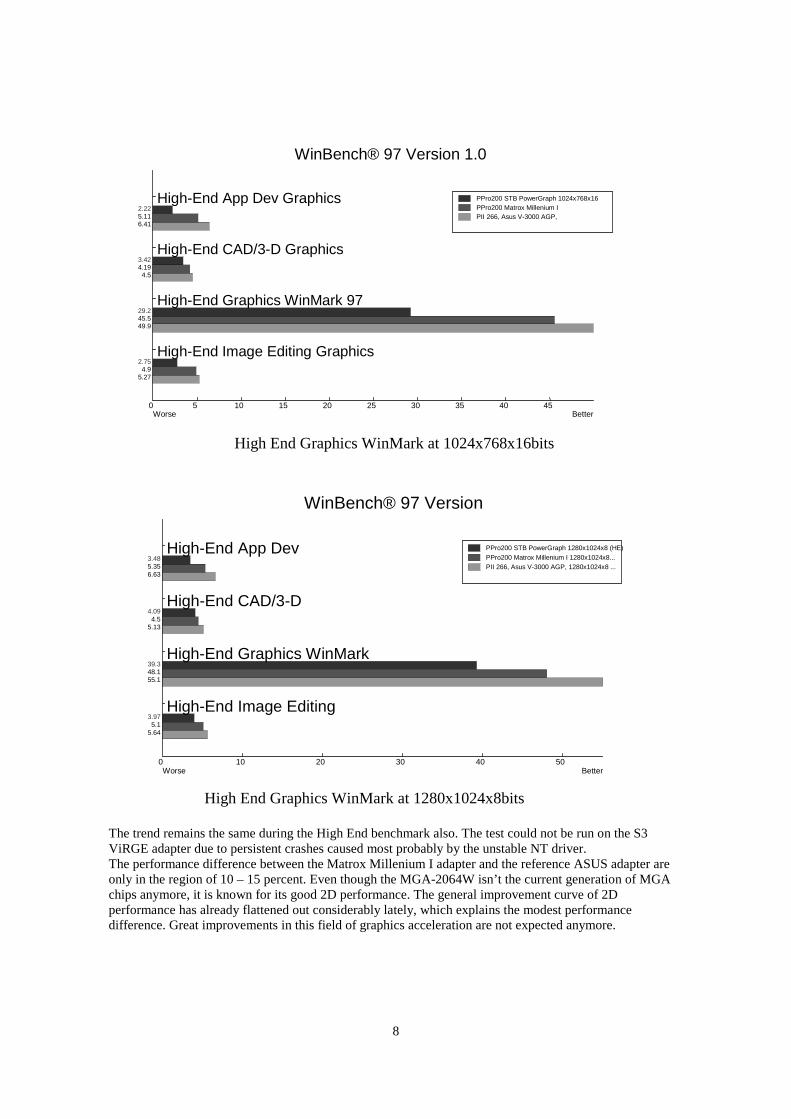
High End Graphics WinMark at 1280x1024x8bits
The trend remains the same during the High End benchmark also. The test could not be run on the S3ViRGE adapter due to persistent crashes caused most probably by the unstable NT driver.The performance difference between the Matrox Millenium I adapter and the reference ASUS adapter areonly in the region of 10 – 15 percent. Even though the MGA-2064W isn’t the current generation of MGAchips anymore, it is known for its good 2D performance. The general improvement curve of 2Dperformance has already flattened out considerably lately, which explains the modest performancedifference. Great improvements in this field of graphics acceleration are not expected anymore.
0 10 20 30 40 50
High-End App DevG
6.635.353.48
High-End CAD/3-DG
5.134.5
4.09
High-End Graphics WinMark55.148.139.3
High-End Image EditingG
5.645.1
3.97
PII 266, Asus V-3000 AGP, 1280x1024x8 ...PPro200 Matrox Millenium I 1280x1024x8...PPro200 STB PowerGraph 1280x1024x8 (HE)
WinBench® 97 Version
Worse Better
0 5 10 15 20 25 30 35 40 45
High-End App Dev Graphics
6.415.112.22
High-End CAD/3-D Graphics
4.54.193.42
High-End Graphics WinMark 97
49.945.529.2
High-End Image Editing Graphics
5.274.9
2.75
PII 266, Asus V-3000 AGP,PPro200 Matrox Millenium IPPro200 STB PowerGraph 1024x768x16( )
WinBench® 97 Version 1.0
Worse Better

9
WinStone 97 at 800x600x8bits
WinStone 97 at 1024x768x16bits
0 10 20 30 40 50
Business Database:Winstone 97 scores
7.98 6.71
Business Publishing :Winstone 97 scores
5.98 5.24
Business WP/SS:Winstone 97 scores
5.44 4.09
Business Winstone 97:Winstone 97 scores
59.3 47
Winstone units
PPro200 Matrox Millenium 1024x768x16it
PPro200 STB PowerGraph 1024x768x16bit
Winstone® 97 Version 1.0
W orse Better
0 10 20 30 40 50 60
Bus iness Database:W ins tone 97 scores
8.08 7.92
Bus iness Publ ishing:W ins tone 97 scores
6.32 6.04
Bus iness W P/SS:W ins tone 97 scores
5.63 5.07
Bus iness W ins tone 97:W ins tone 97 scores
61.6 56.9
W instone units
PPro200 Matrox Millenium 800x600x8bit
PPro200 STB PowerGraph 800x600x8bit
Winstone® 97 Version 1.0
Worse Better

10
VI. Discussion of overall performance effects
The graphics subsystem is only one component of the complete system. The CPU and the disk system alsohave a decisive role in determining the overall performance of a computer system, so a twofoldperformance edge of the graphics subsystem will never translate into a twice faster overall system.
The effect of the graphics subsystem depends also on how screen intensive the application is. In the case ofpurely mathematical applications or database functions, the performance of the graphical subsystem doesn’treally make a difference. The most common desktop applications are fairly screen intensive with frequentredraws due to screen scrolling and windowing. When working with image editing tools, the graphicssubsystem is heavily loaded and will have a noticeable effect on the overall performance.
The results of the WinStone benchmarks illustrate both of these points. The machines tested are identicalsystems apart from the graphics subsystem. Still the results differ by margins of 8 and 25 percent,depending on the used resolution, to the favor of the system with the faster graphics subsystem. Aperformance boost of one quarter using a common 1024x768x16bit resolution shows clearly the importanceof the graphics subsystem on the overall performance.
On the other hand we can refer to WinBench Business WinMark results. From there we can easily calculatethat the Matrox Millenium I card performed 45 and 133 percent better when running the tests at the sameresolution as the WinStone tests. Still the WinStone figures showed the aforementioned margins of 8 and25 percent. This clearly shows that the other components of the system have a major influence on theoverall performance and performance improvements of single subsystems do not directly translate intocorrespondingly big overall performance improvements.
CPU Utilization
The CPU utilization was measured for every benchmark that was performed. The tested adapters did notshow significant differences in CPU utilization, as all result values were within 96 and 100 percent.

11
VII. Conclusions about the results
Both in business and high end performance the cards equipped with Matrox’ chips clearly outperform thecards equipped with chips manufactured by S3. Since the resolutions and the refresh rates were selected tobe such that all cards were capable of handling them, the amount of video memory did not play a decisiverole within these results. All graphics subsystems were also running on a 33MHz PCI system bus, and hada 64 bit wide internal video bus. Any 3D functionality built in to the cards was also ignored by theperformed tests. Nevertheless several other factors can be pointed out when to explain the measured results.
• Accelerator chip The MGA chip is a few generations newer than the S3 chips, and deliverconsiderably higher 2D acceleration.
• Memory type The Matrox card is equipped with dual ported WRAM, which is fasterthan the conventional DRAM. The effects of the WRAM architecture, whichallows simultaneous video memory accesses for the chip and RAMDAC, andthe speed of the RAMDAC, can be seen when inspecting how big of an impactthe increase of resolution or color depth has on performance. In the case of aDRAM memory system, with larger amounts of data to be transferred per screenredraw, the RAMDAC reserves more and more video access time, decreasingthe overall performance. In WRAM systems the performance is slowed downonly due to the increased amount data that needs to be transferred.
This point is clearly demonstrated by the Business Graphics WinMark resultsfor the different resolutions. The Millenium I card is about 1.4 times faster thanthe STB card when using the resolution 800x600x8bits, but the advantage is 2.3fold, when the same test is run at a resolution of 1024x768x16bits. Themachines are otherwise identically configured.
• Driver The newer drivers also play a significant role. The importance of fine tuneddrivers became painfully evident through the persistent crashes of the S3 ViRGEduring the High End Graphics WinMark.
Matrox Millenium I
The Millenium adapter was the clear performance winner of this comparison. The card is equipped withthe MGA-2064W chip, which has already been replaced by the newer generation chip MGA 2164W. Inaddition to good results in this comparison, the card offers higher resolutions, larger color palettes andhigher refresh rates than the ones used in these tests, being able to display video modes up to1280x1024x24bit and 1600x1200x16bit.
The performance figures of the High End Graphics WinMark are quite impressive as they lag only 10-15percent behind the reference ASUS adapter with a brand new accelerator chip and that was connected to anAGP port of a powerful Pentium II 266MHz machine. This shows how the level of 2D performance isnearing its maximum, which means that for a business user a Matrox Millenium adapter will be suitable forquite a long time even though the marketplace generally speaks of very short product lifecycles in thisfield.

12
STB PowerGraph
The STB PowerGraph is already a two years old adapter equipped with the 64 bit Trio64V+ acceleratorchip from S3. The older generation chip cannot keep up with the competition from current chips. ThePowerGraph did clearly outperform the S3 ViRGE when using a low resolution, only to be eclipsed by it onthe Business WinMark at the 1024x768x16bits resolution. The PowerGraphs 2 MB of DRAM memorydoes not allow higher resolutions or color depths than the ones used in these tests and higher refresh ratesthan 75Hz are not available. There are also no builtin 3D capabilities.
S3 ViRGE /DX
The ViRGE /DX is another adapter equipped by a S3 accelerator, the S3D in this case. The performancein 800x600x8bit Business Graphics WinMark was the lowest of the bunch, but the low impact of increasedresolution allowed it to win the STB PowerGraph by a fraction in the 1024x768x16bit Business GraphicWinMark. The performance of the drivers let the card down badly, causing persistent crashes when tryingto run the high end tests. As with the STB PowerGraph, the 2 MB of DRAM memory does not allow higherresolutions than the ones used in this test.
ASUS V-3000 AGP
The brand new ASUS card used as a reference point was expectedly the winner of all performance tests.The performance margin against the winning Matrox Millenium card lies between 10-30% depending onthe test. But a slight improvement in speed is not at all the only advantage of the ASUS card. Containingone of newest 3D capable accelerator chip, this adapter can offer numerous hardware accelerated specialgraphics functions commonly used in the 3D field. This combined with the ability to benefit from the AGPconnection, enables this card to cover by far the broadest spectrum of usage needs.
VIII. Literature:
• Patterson and Hennessy, Computer Organization & Design - ISBN 1-55860-281-X• WinBench 97 User documentation• WinStone 97 User documentation• ThreadMark User documentation• Excerpts from manufacturers homepages,
e.g. www.matrox.com, www.adaptec.com, www.stb.com, www.zdnet.com