Embed Size (px)
Citation preview
Computers and Electronics in Agriculture
22 (1999) 51–69
Computerised image analysis of biocrystallogramsoriginating from agricultural products
J.-O. Andersen a,*, C.B. Henriksen a, J. Laursen b, A.A. Nielsen c
a Department of Agricultural Sciences, The Royal Veterinary and Agricultural Uni6ersity, Agro6ej 10,DK-2630 Taastrup, Denmark
b Department of Mathematics and Physics, The Royal Veterinary and Agricultural Uni6ersity,Thor6aldgens6ej 40, DK-1871 Frederiksberg C, Denmark
c Department of Mathematical Modelling, The Technical Uni6ersity of Denmark,DK-2800 Lyngby, Denmark
Accepted 30 October 1998
Abstract
Procedures are presented for computerised image analysis of biocrystallogram images,originating from biocrystallization investigations of agricultural products. The biocrystalliza-tion method is based on the crystallographic phenomenon that when adding biologicalsubstances, such as plant extracts, to aqueous solutions of dihydrate CuCl2, biocrystallo-grams with reproducible dendritic crystal structures are formed during crystallisation. Themorphological features found in the structures are traditionally applied for visual ranking orclassification, e.g. in comparative studies of the effects of farming systems on crop quality.The circular structures contain predominantly a single centre from where ramificationsexpand in a zonal structure. In previous studies primarily texture analysis was applied, andthe images analysed and classified by means of a circular region-of-interest (ROI), i.e. theregion specified for analysis. In the present study the objective was to examine how thediscriminative information relevant for classification purposes is distributed over the zonalstructure, and how the information is affected by the varying location of the crystallisationcentre. The texture analysis procedures were applied to a so-called degradation series of 33images, including seven groups representing discrete ‘treatment levels’. The biocrystallogramswere produced over seven consecutive days, on the basis of a single carrot extract degradingwhile stored at 6°C. This degradation is known to induce systematic changes in morpholog-
* Corresponding author. Tel.: +45-35-283520; fax: +45-35-282175; e-mail: [email protected].
0168-1699/99/$ - see front matter © 1999 Elsevier Science B.V. All rights reserved.
PII: S0168 -1699 (98 )00043 -X
J.-O. Andersen et al. / Computers and Electronics in Agriculture 22 (1999) 51–6952
ical features over a number of successive days. The biocrystallograms were scanned at 600dpi, with 256 grey levels. Eight first-order statistical parameters were calculated for fourresolution scales, and 15 second-order parameters for five scales, giving a total of 107observations for each image. Classification of an individual image was performed by meansof stepwise discriminant analysis. Four main types, and several subtypes and sizes of ROIwere examined. The 33 images as well as a subset of 21 images were examined. Whenimposing a restriction on the centre location in the subset, thereby reducing the within-groupvariance, the scores were markedly improved. Classifications of the total set and the subsetshowed scores up to 84.8 and 100%, respectively. A number of parameters showed amonotonic relationship with degradation day number. Multiple linear regressions based onup to eight parameters indicated strong relationships, with R2 up to 0.98. It is concluded thatthe procedures were able to discriminate the seven groups of images, and are applicable forbiocrystallization investigations of agricultural products. Perspectives for the application ofimage analysis are briefly mentioned. © 1999 Elsevier Science B.V. All rights reserved.
Keywords: Image analysis; Texture analysis; Biocrystallization; Copper chloride crystallisa-tion; Quality assessment
1. Introduction
The biocrystallization method, also termed ‘sensitive crystallisation’ and ‘copperchloride crystallisation’, was originally introduced by Pfeiffer (1931). The method isbased on the crystallographic phenomenon that when adding specific ionic sub-stances, and generally all organic substances, to an aqueous solution of dihydrateCuCl2, biocrystallograms with reproducible dendritic structures are formed duringcrystallisation (Kleber and Steinike-Hartung, 1959). It is applied primarily inagricultural research concerning crop quality, complementary to chemical analysesof vitamins, proteins etc. A favoured field of application is comparative studies ofthe effects of different farming systems and fertilisation practices on the morpholog-ical features found in the crystal structures (Engqvist, 1989; Balzer and Balzer,1993).
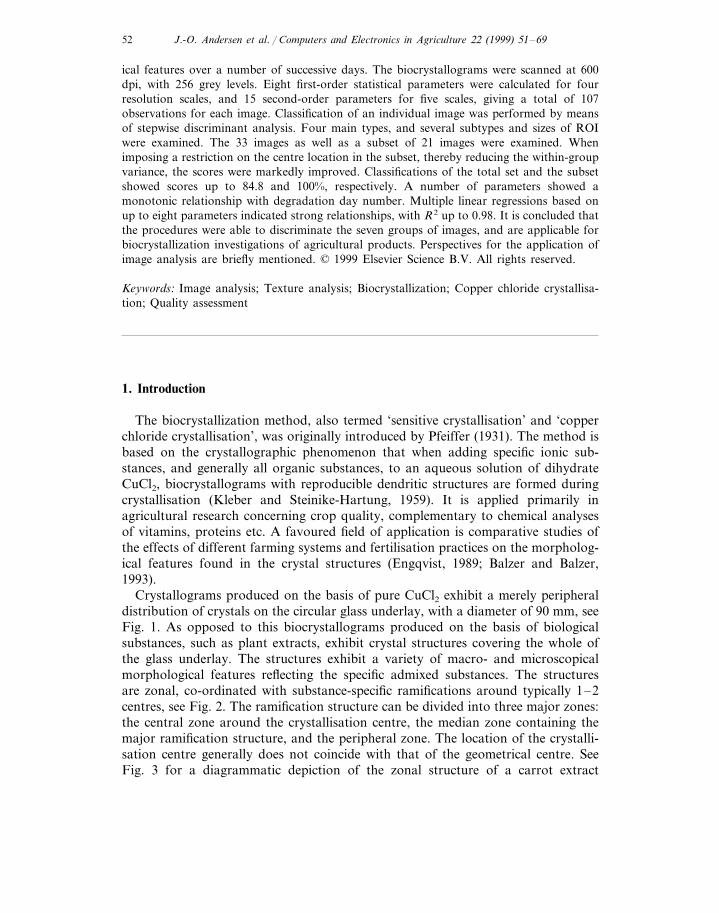
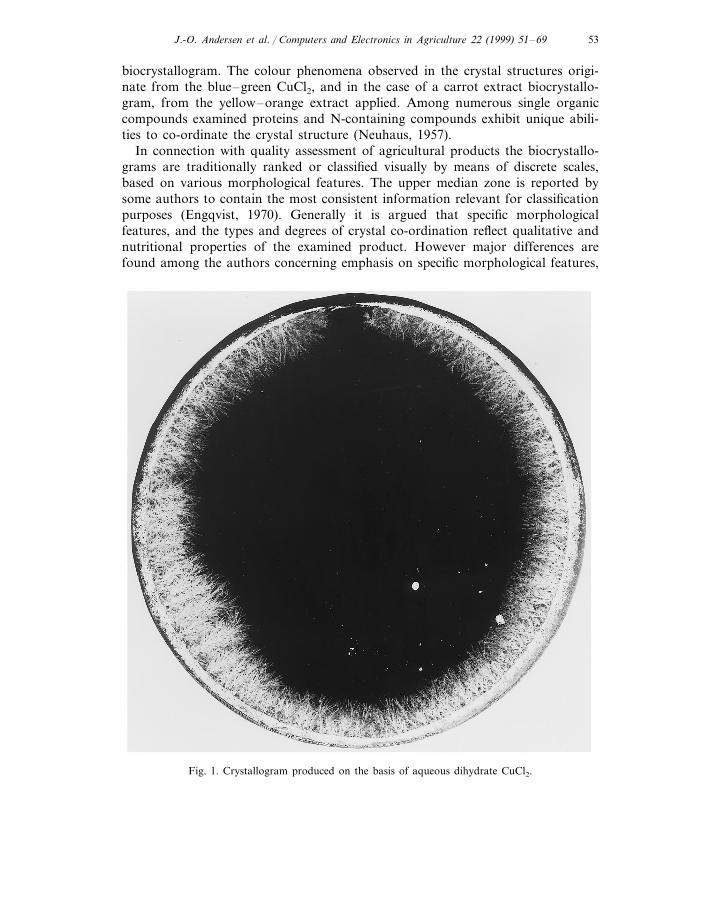
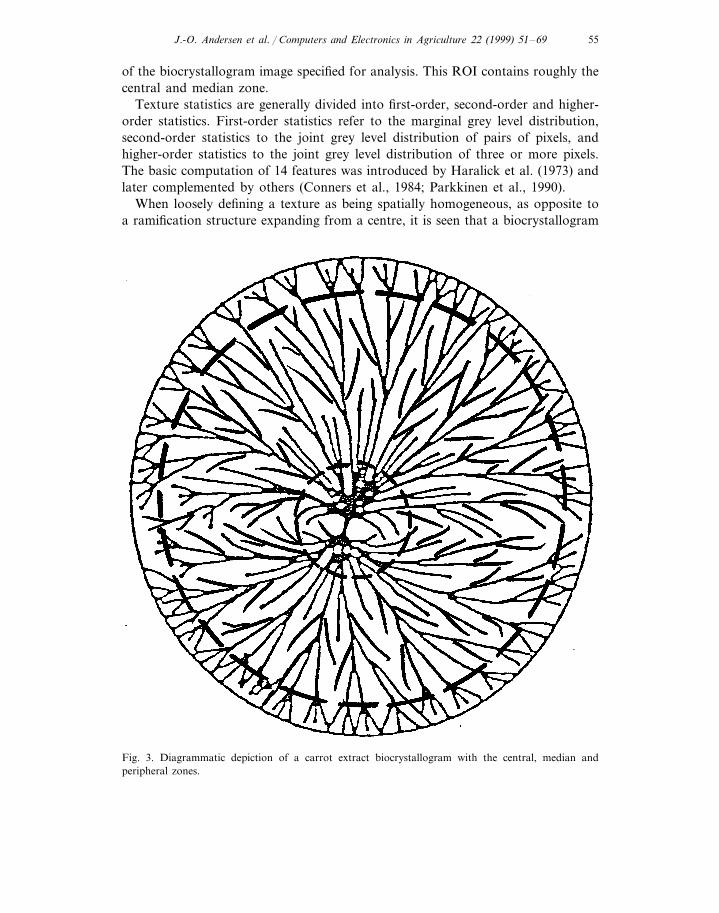
Crystallograms produced on the basis of pure CuCl2 exhibit a merely peripheraldistribution of crystals on the circular glass underlay, with a diameter of 90 mm, seeFig. 1. As opposed to this biocrystallograms produced on the basis of biologicalsubstances, such as plant extracts, exhibit crystal structures covering the whole ofthe glass underlay. The structures exhibit a variety of macro- and microscopicalmorphological features reflecting the specific admixed substances. The structuresare zonal, co-ordinated with substance-specific ramifications around typically 1–2centres, see Fig. 2. The ramification structure can be divided into three major zones:the central zone around the crystallisation centre, the median zone containing themajor ramification structure, and the peripheral zone. The location of the crystalli-sation centre generally does not coincide with that of the geometrical centre. SeeFig. 3 for a diagrammatic depiction of the zonal structure of a carrot extract
J.-O. Andersen et al. / Computers and Electronics in Agriculture 22 (1999) 51–69 53
biocrystallogram. The colour phenomena observed in the crystal structures origi-nate from the blue–green CuCl2, and in the case of a carrot extract biocrystallo-gram, from the yellow–orange extract applied. Among numerous single organiccompounds examined proteins and N-containing compounds exhibit unique abili-ties to co-ordinate the crystal structure (Neuhaus, 1957).
In connection with quality assessment of agricultural products the biocrystallo-grams are traditionally ranked or classified visually by means of discrete scales,based on various morphological features. The upper median zone is reported bysome authors to contain the most consistent information relevant for classificationpurposes (Engqvist, 1970). Generally it is argued that specific morphologicalfeatures, and the types and degrees of crystal co-ordination reflect qualitative andnutritional properties of the examined product. However major differences arefound among the authors concerning emphasis on specific morphological features,
Fig. 1. Crystallogram produced on the basis of aqueous dihydrate CuCl2.
J.-O. Andersen et al. / Computers and Electronics in Agriculture 22 (1999) 51–6954
Fig. 2. Biocrystallogram produced on the basis of an aqueous carrot extract.
see e.g. v. Hahn (1962) and Engqvist (1970). It can be argued that a majorlimitation for a wider application of the biocrystallization method is the lack ofstandardised and objective methods of quantifying and classifying the morphologi-cal features.
Computerized image analysis techniques may meet the demand for such methods.Ideally an image analysis procedure should reflect all the characteristics of abiocrystallogram as a three-dimensional, coloured ramification structure, co-ordi-nated with zones relative to a centre. However due to the present limitations set bycomputational capacity and speed more simple approaches are preferable. In alimited number of previous studies encouraging results are reported (Le Gia, 1996;Le Gia et al., 1996). The studies are based on primarily texture analysis procedures,32 grey levels, and a single type of circular region-of-interest (ROI), i.e. the region
J.-O. Andersen et al. / Computers and Electronics in Agriculture 22 (1999) 51–69 55
of the biocrystallogram image specified for analysis. This ROI contains roughly thecentral and median zone.
Texture statistics are generally divided into first-order, second-order and higher-order statistics. First-order statistics refer to the marginal grey level distribution,second-order statistics to the joint grey level distribution of pairs of pixels, andhigher-order statistics to the joint grey level distribution of three or more pixels.The basic computation of 14 features was introduced by Haralick et al. (1973) andlater complemented by others (Conners et al., 1984; Parkkinen et al., 1990).
When loosely defining a texture as being spatially homogeneous, as opposite toa ramification structure expanding from a centre, it is seen that a biocrystallogram
Fig. 3. Diagrammatic depiction of a carrot extract biocrystallogram with the central, median andperipheral zones.
J.-O. Andersen et al. / Computers and Electronics in Agriculture 22 (1999) 51–6956
image is inherently not a texture. Consequently it would be desirable to includestructural aspects into the texture analysis, taking into consideration the zonalstructure of a biocrystallogram. Since the centre location affects the zonal structure,it may be hypothesised that reducing the within- group variation in centre locationin different groups of images will affect the image analysis parameters, and therebylead to an improved classification.
2. Objective
The objective of the present study was to develop procedures for image analysisof biocrystallogram images, based on texture analysis including parameters fromfirst- and second-order grey level statistics. The objective was specifically to examinethe distribution of textural information, relevant for classification purposes, overthe biocrystallogram image, thereby taking into consideration the zonal structure ofa biocrystallogram.
The effects of applying various types and sizes of ROI on the image analysisparameters, and thereby on classification, were examined. Furthermore the effectsof reducing the within-group variation in centre location were examined.
A so-called degradation series including seven groups of images, representingdiscrete ‘treatment levels’, was applied as the basis of the image analysis.
3. Materials and methods
3.1. Carrot extract degradation series
In biocrystallization investigations degradation series have been applied in con-nection with assessing the quality of agricultural products. A plant extract isproduced on the basis of e.g. a carrot sample, and stored at 6°C, thereby exposedto a non-specific autolytic and microbial degradation. When producing biocrystal-lograms over a number of successive days systematic progressive changes inmorphological features are observed, specifically a dissolution of the originalco-ordinated structure. This is a parallel to the chemical degradation of macro-molecules such as proteins into smaller molecules which can be followed analyti-cally. The speed with which this dissolution takes place is regarded a qualitativeparameter, analogous to storage ability (Engqvist, 1970).
In the actual series 59 biocrystallograms were produced on the basis of a carrotextract over 7 consecutive days. From each day nine biocrystallograms wereavailable, except for day 6 with only five. For each biocrystallogram was applied2.0 ml 10% aqueous extract, 0.8 ml of a 10% aqueous solution of dihydrated CuCl2,and distilled water added up to a total volume of 6.5 ml/biocrystallogram. Thecrystallisation underlay was supplied by circular glass plates, thickness 2 mm,diameter 90 mm. The combined evaporation and actual crystallisation took placeover approximately 17 h. For a detailed description of techniques and experimentalconditions applied, see Andersen et al. (1998).
J.-O. Andersen et al. / Computers and Electronics in Agriculture 22 (1999) 51–69 57
The biocrystallograms contained 1–3 distinct centres. The centres were locatedanywhere between the geometric centre and the periphery. As the image analysisprocedures were designed exclusively for single-centred biocrystallograms, out ofthe 59 biocrystallograms produced 26 were multi-centered and were discarded,leaving 33 for further investigation. From each of the 7 days 3, 8, 5, 6, 4, 3 and 4,biocrystallograms were available. It was presupposed that the number and locationof the centres held no discriminative information concerning the samples.
In order to specify subsets based on a reduction in the within-group variation incentre location, the smallest distance in mm from the crystallisation centre to theperiphery of the image along the vertical axis was measured, and the averagedistance was computed. From each of the 7 days the three images having a distanceclosest to the average were selected for a subset of 21 images. Due to theavailability of only three single-centred biocrystallograms from day 1 and 6, thesesubsets were identical to the corresponding total sets.
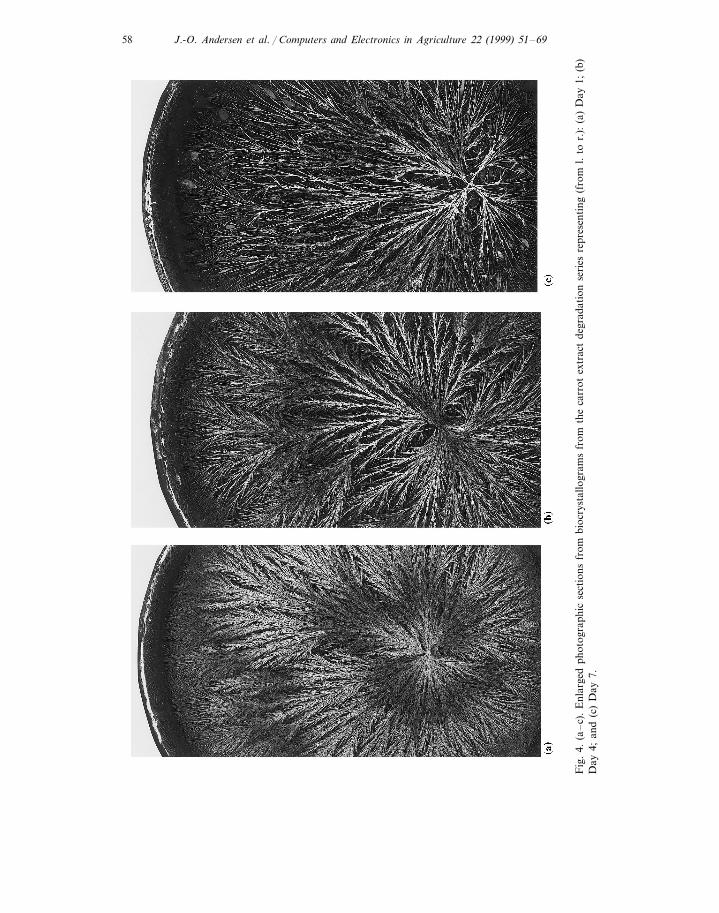
On the basis of visual examination the biocrystallograms from the first degrada-tion day could be divided into three zones: the central, the median zone, and theperipheral zone. The centre area exhibited a relatively large variation in size andmorphological features within that day, some centres being characterised by across-like formation of crystals, others being masked by a dense structure of moreor less curved crystal formations. The overall co-ordination of the median zonedecreased gradually from day 1 to 7, and the outer part of the zone graduallydissolved, whereby an expanding crystal-free transition zone appeared between themedian and the peripheral zone, see Fig. 4a–c. As a result the radial extension ofthe combined central and median zones gradually decreased from approximately90% at day 1 to approximately 80% at day 7, and the extension of the transitionzone increased correspondingly. No marked differences in morphological featureswere observed in the peripheral zone (approx. 90–100%) during the degradationseries.
3.2. Image analysis software
The applied image analysis software termed ACTA (Applied CrystallisationTexture Analysis) was developed in co-operation between the Department ofMathematical Modelling at The Technical University of Denmark, and the Depart-ments of Mathematics and Physics, and Agricultural Science, at The RoyalVeterinary and Agricultural University. Procedures from BMDP Statistical Soft-ware (Dixon, 1985) were included in connection with the classification procedures.The hardware employed was a PC (Pentium 100 MHz, 64 MB RAM, 2 GBharddisk) running under the Linux operating system. For a detailed software andapplication instruction see Henriksen (1998).
The image analysis procedures consisted of the following five steps:1. Preparation of biocrystallograms for analysis.2. Specification of ROI.3. Calculation of first-order grey level statistics.4. Calculation of second-order grey level statistics.
J.-O. Andersen et al. / Computers and Electronics in Agriculture 22 (1999) 51–6958
Fig
.4.
(a–
c).
Enl
arge
dph
otog
raph
icse
ctio
nsfr
ombi
ocry
stal
logr
ams
from
the
carr
otex
trac
tde
grad
atio
nse
ries
repr
esen
ting
(fro
ml.
tor.
):(a
)D
ay1;
(b)
Day
4;an
d(c
)D
ay7.
J.-O. Andersen et al. / Computers and Electronics in Agriculture 22 (1999) 51–69 59
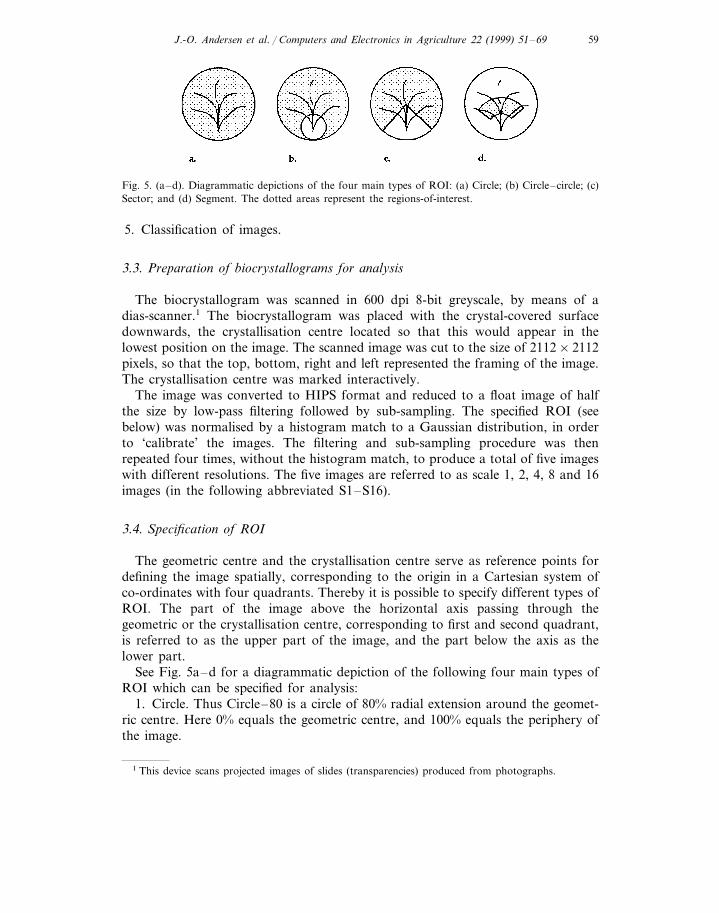
Fig. 5. (a–d). Diagrammatic depictions of the four main types of ROI: (a) Circle; (b) Circle–circle; (c)Sector; and (d) Segment. The dotted areas represent the regions-of-interest.
5. Classification of images.
3.3. Preparation of biocrystallograms for analysis
The biocrystallogram was scanned in 600 dpi 8-bit greyscale, by means of adias-scanner.1 The biocrystallogram was placed with the crystal-covered surfacedownwards, the crystallisation centre located so that this would appear in thelowest position on the image. The scanned image was cut to the size of 2112×2112pixels, so that the top, bottom, right and left represented the framing of the image.The crystallisation centre was marked interactively.
The image was converted to HIPS format and reduced to a float image of halfthe size by low-pass filtering followed by sub-sampling. The specified ROI (seebelow) was normalised by a histogram match to a Gaussian distribution, in orderto ‘calibrate’ the images. The filtering and sub-sampling procedure was thenrepeated four times, without the histogram match, to produce a total of five imageswith different resolutions. The five images are referred to as scale 1, 2, 4, 8 and 16images (in the following abbreviated S1–S16).
3.4. Specification of ROI
The geometric centre and the crystallisation centre serve as reference points fordefining the image spatially, corresponding to the origin in a Cartesian system ofco-ordinates with four quadrants. Thereby it is possible to specify different types ofROI. The part of the image above the horizontal axis passing through thegeometric or the crystallisation centre, corresponding to first and second quadrant,is referred to as the upper part of the image, and the part below the axis as thelower part.
See Fig. 5a–d for a diagrammatic depiction of the following four main types ofROI which can be specified for analysis:
1. Circle. Thus Circle–80 is a circle of 80% radial extension around the geomet-ric centre. Here 0% equals the geometric centre, and 100% equals the periphery ofthe image.
1 This device scans projected images of slides (transparencies) produced from photographs.
J.-O. Andersen et al. / Computers and Electronics in Agriculture 22 (1999) 51–6960
2. Circle–circle. Thus Circle–circle–80–20 is a circle of 80% radial extensionaround the geometric centre, minus a circle of 20% radial extension around thecrystallisation centre, divided by the vertical axis. In the latter percentage measure0% equals the crystallisation centre, and 100% the periphery of the image on theupper vertical axis.
3. Sector. Thus Sector 80–90 is a circle of 80% radial extension around thegeometric centre, minus a radial section of 90° in the lower part of the image,divided by the vertical axis.
4. Segment. Thus Segment 30–60–90 is a circle segment specified relative to thecrystallisation centre, in the upper part of the image. The first two numbers specifya radial interval on the upper vertical axis. Here 0% equals the crystallisationcentre, and 100% the periphery of the image on the upper vertical axis. The thirdnumber represents the angle at the crystallisation centre, divided by the uppervertical axis.
The first three main ROIs are referred to as circular.
3.5. Calculation of first-order statistical parameters
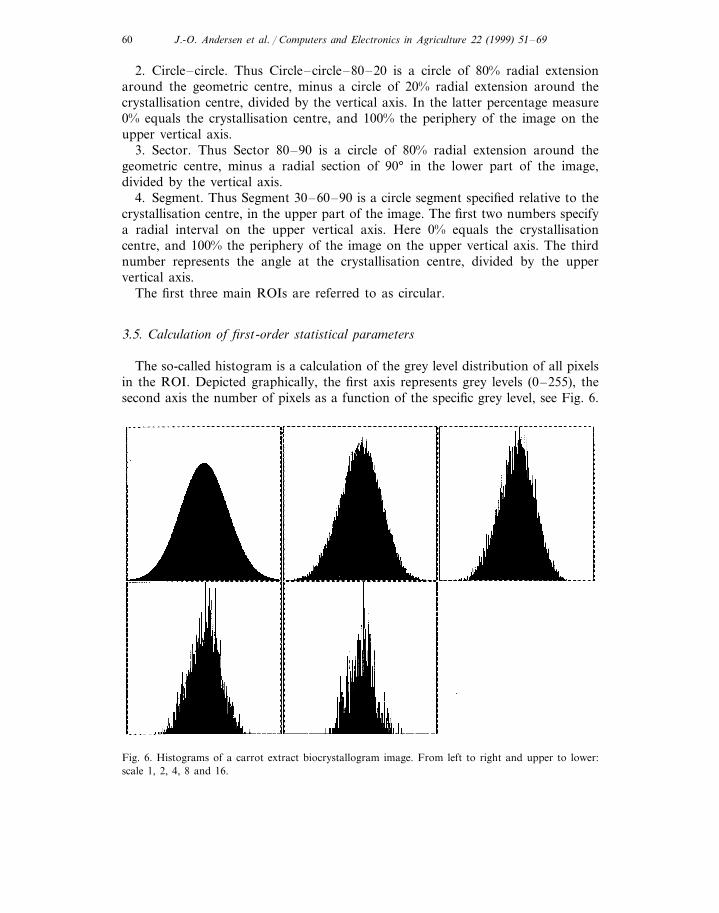
The so-called histogram is a calculation of the grey level distribution of all pixelsin the ROI. Depicted graphically, the first axis represents grey levels (0–255), thesecond axis the number of pixels as a function of the specific grey level, see Fig. 6.
Fig. 6. Histograms of a carrot extract biocrystallogram image. From left to right and upper to lower:scale 1, 2, 4, 8 and 16.
J.-O. Andersen et al. / Computers and Electronics in Agriculture 22 (1999) 51–69 61
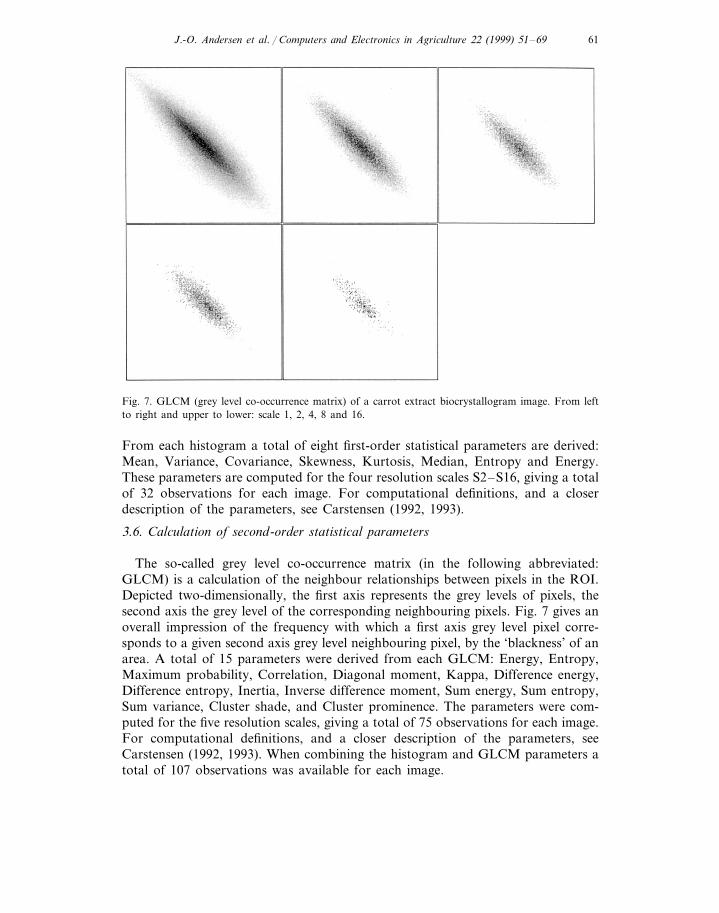
Fig. 7. GLCM (grey level co-occurrence matrix) of a carrot extract biocrystallogram image. From leftto right and upper to lower: scale 1, 2, 4, 8 and 16.
From each histogram a total of eight first-order statistical parameters are derived:Mean, Variance, Covariance, Skewness, Kurtosis, Median, Entropy and Energy.These parameters are computed for the four resolution scales S2–S16, giving a totalof 32 observations for each image. For computational definitions, and a closerdescription of the parameters, see Carstensen (1992, 1993).
3.6. Calculation of second-order statistical parameters
The so-called grey level co-occurrence matrix (in the following abbreviated:GLCM) is a calculation of the neighbour relationships between pixels in the ROI.Depicted two-dimensionally, the first axis represents the grey levels of pixels, thesecond axis the grey level of the corresponding neighbouring pixels. Fig. 7 gives anoverall impression of the frequency with which a first axis grey level pixel corre-sponds to a given second axis grey level neighbouring pixel, by the ‘blackness’ of anarea. A total of 15 parameters were derived from each GLCM: Energy, Entropy,Maximum probability, Correlation, Diagonal moment, Kappa, Difference energy,Difference entropy, Inertia, Inverse difference moment, Sum energy, Sum entropy,Sum variance, Cluster shade, and Cluster prominence. The parameters were com-puted for the five resolution scales, giving a total of 75 observations for each image.For computational definitions, and a closer description of the parameters, seeCarstensen (1992, 1993). When combining the histogram and GLCM parameters atotal of 107 observations was available for each image.
J.-O. Andersen et al. / Computers and Electronics in Agriculture 22 (1999) 51–6962
3.7. Classification of images
By means of stepwise discriminant analysis, based on the 107 observations, aspecific set of histogram and GLCM parameters was selected which provided thebest discrimination relative to the original 7 degradation days. The selectioncriterion, by which a parameter was included in the final set of parameters, was anF-test comparing the two sets which, respectively, included and excluded theparameter in question. An F-value of 4.0 was applied, which can be regarded anon-restrictive ‘standard’ value.
Two types of classification were performed:1. An ordinary classification in which the individual image was classified on the
basis of all images included in the analysis.2. A jack-knifed classification in which the image was classified on the basis of all
images except the image in question.The posterior probabilities with which an image belonged to each of the original
groups were computed. The individual image was then classified as belongingspecifically to that original group to which it had the highest posterior probabilityof belonging. By matching the number of correct classifications made in each of thegroups with the number of images in the original groups, a classification score wascomputed for each group. Subsequently the summarised classification score wascomputed, involving all correct classifications relative to the total number of imagesin the original groups.
In the following the summarised score, if not otherwise specified, is listed asordinary/jack-knifed, e.g. 74.5/82.6 (in%). Comparing the ordinary and jack-knifedclassification scores gives a general impression of the degree to which the image inquestion contributes to the group characteristics, and thereby an impression of thehomogeneity of the images in a specific group.
3.8. Classification of images
A total of 18 sub-ROIs from the four main ROIs were specified, in order toexamine which zones contained relevant information for classification purposes,and to examine the respective effects of including and excluding the centre area.Four recurring radial extensions of 70, 80, 90 and 100% were defined on the basisof the geometric centre, corresponding approximately to the radial extensions of thezones, including the transition zone. These radial extensions were applied for Circle,for Circle–circle–xx–15, and for Sector–xx–90. From visual observation it wasestimated that subtraction of a minor circle of 15% and a sector of 90° wouldeffectively remove the morphological characteristics of the centre area.
Segment–30–60–90, with a radial extension from 30 to 60% and a 90° angle,approximately corresponds to the area reported by some authors to contain themost consistent information for classification purposes (Engqvist, 1970). Using thisROI as a basis, the following ROIs with equal radial extensions were applied:Segment–00–30–90, Segment–30–60–90, and Segment–60–90–90. To test combi-nations of these segments, Segment–00–60–90, Segment–30–90–90, and Seg-
J.-O. Andersen et al. / Computers and Electronics in Agriculture 22 (1999) 51–69 63
ment–00–90–90 were additionally included. The total set as well as the subset wereanalysed and classified.
In addition to the classifications performed by means of stepwise discriminantanalysis, for a limited number of parameters, showing a monotonic relationshipwith degradation day number, linear regressions were performed. Furthermore anumber of multiple linear regressions were performed. These were based on a set ofparameters, selected on the basis of an F-test, comparing the two sets whichrespectively included and excluded the parameter in question. For the selectioncriterion, by which a parameter was included in the final set of parameters, anF-value of 4.0 was applied.
4. Results
4.1. Circle, circle–circle and sector
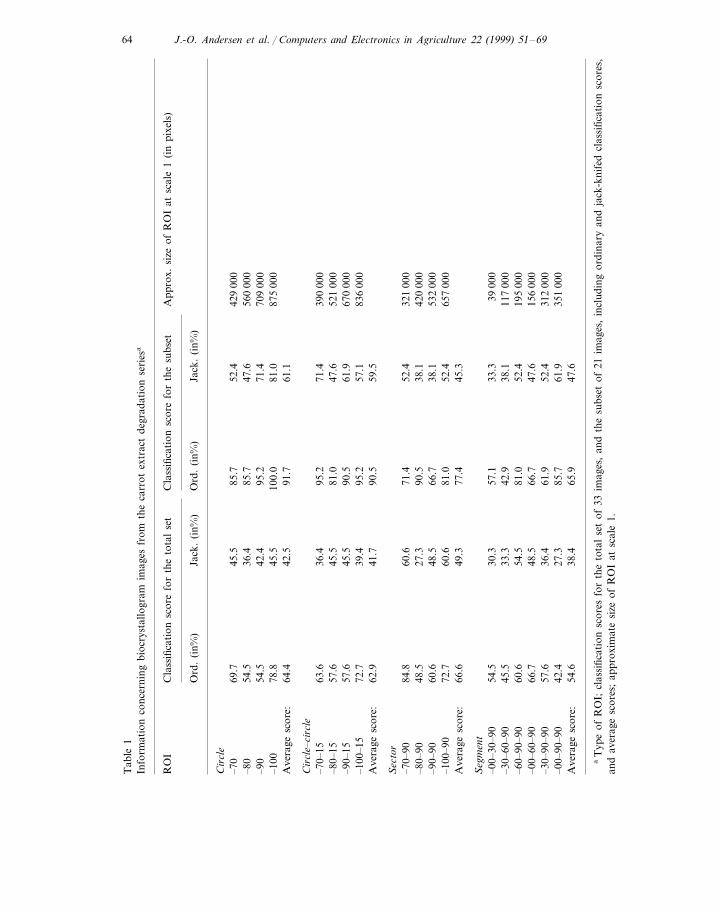
See Table 1 for classification scores, and the approximate sizes of the 12 circularsub-ROIs. When comparing the classification scores based on the total set weobserve the highest score in Sector 70–90: 84.8/60.6. A jack-knifed score of 60.6 isalso found in Sector–100–90. When comparing the scores based on the subset weobserve the highest score in Circle 100: 100.0/81.0.
When comparing the average ordinary scores based on the total set and thesubset, from the three main types of ROI, the total set scores are, respectively, 42,44 and 16% lower than the subset scores. In the case of Circle and Circle–circle,when comparing the average jack-knifed scores based on the total set and thesubset, the total set scores are, respectively, 44 and 43% lower than the subsetscores. In the case of Sector the average jack-knifed score based on the subset is 9%higher than the total set score.
When comparing the average ordinary and jack-knifed scores based on the totalset, from the three types of ROI, the ordinary scores are, respectively, 52, 51 and35% higher than the jack-knifed scores. When comparing the scores based on thesubset the ordinary scores are, respectively, 50, 52 and 71% higher than thejack-knifed scores.
The following four parameters were used for classification of the subset ofCircle–100:
S2 Histogram energy, S4 Histogram median, S8 Histogram mean and S16GLCM Diagonal moment. No single one of these parameters was able to discrim-inate more than two blocks of days, and correspondingly none of the parametersshowed a strong linear relationship to degradation day number.
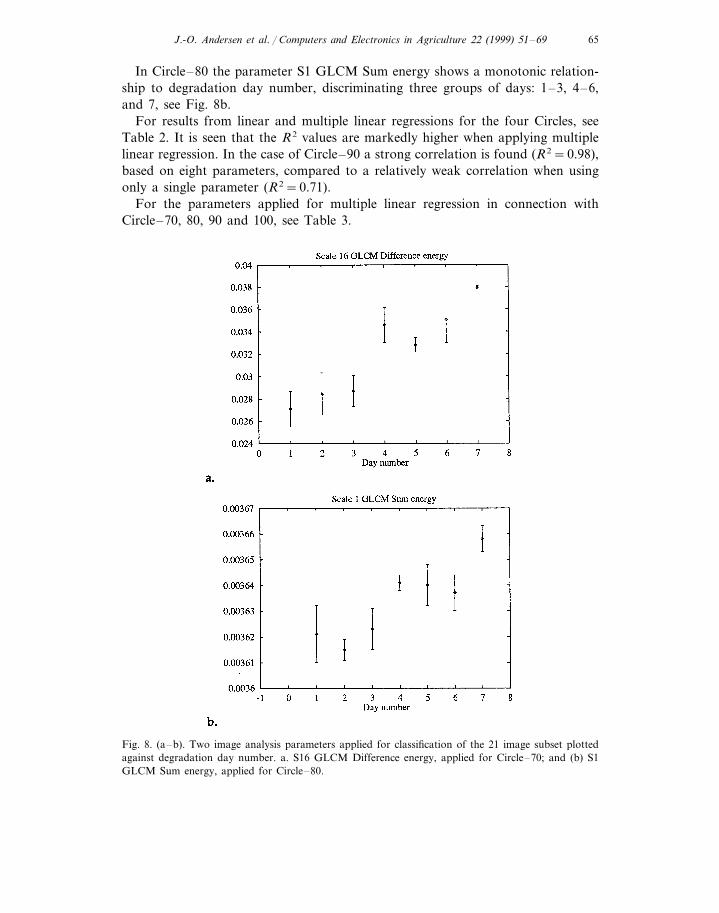
In Circle–70 the parameter S16 GLCM Difference energy shows an overallmonotonic relationship with degradation day number, see Fig. 8a. A linear regres-sion was performed with the following estimated formula and R2:
S16 GLCM Difference energy=2.99*10−3 * (degradation day no.)
−2.25*10−2; R2=0.81.
J.-O. Andersen et al. / Computers and Electronics in Agriculture 22 (1999) 51–6964
Tab
le1
Info
rmat
ion
conc
erni
ngbi
ocry
stal
logr
amim
ages
from
the
carr
otex
trac
tde
grad
atio
nse
ries
a
RO
IC
lass
ifica
tion
scor
efo
rth
eto
tal
set
Cla
ssifi
cati
onsc
ore
for
the
subs
etA
ppro
x.si
zeof
RO
Iat
scal
e1
(in
pixe
ls)
Ord
.(i
n%)
Jack
.(i
n%)
Ord
.(i
n%)
Jack
.(i
n%)
Cir
cle
69.7
45.5
–70
85.7
52.4
429
000
54.5
36.4
–80
85.7
47.6
560
000
54.5
42.4
95.2
–90
71.4
709
000
78.8
45.5
–100
100.
081
.087
500
064
.442
.591
.7A
vera
gesc
ore:
61.1
Cir
cle–
circ
le63
.636
.4–7
0–15
95.2
71.4
390
000
57.6
45.5
–80–
1581
.047
.652
100
057
.645
.5–9
0–15
90.5
61.9
670
000
72.7
39.4
–100
–15
95.2
57.1
836
000
62.9
Ave
rage
scor
e:41
.790
.559
.5
Sec
tor
84.8
60.6
–70–
9071
.452
.432
100
048
.527
.3–8
0–90
90.5
38.1
420
000
60.6
48.5
–90–
9066
.738
.153
200
072
.760
.6–1
00–9
081
.052
.465
700
066
.649
.377
.4A
vera
gesc
ore:
45.3
Seg
men
t–0
0–30
–90
54.5
30.3
57.1
33.3
3900
045
.533
.3–3
0–60
–90
42.9
38.1
117
000
60.6
54.5
–60–
90–9
081
.052
.419
500
066
.748
.5–0
0–60
–90
66.7
47.6
156
000
57.6
–30–
90–9
036
.461
.952
.431
200
042
.427
.3–0
0–90
–90
85.7
61.9
351
000
54.6
Ave
rage
scor
e:38
.465
.947
.6
aT
ype
ofR
OI;
clas
sific
atio
nsc
ores
for
the
tota
lse
tof
33im
ages
,an
dth
esu
bset
of21
imag
es,
incl
udin
gor
dina
ryan
dja
ck-k
nife
dcl
assi
ficat
ion
scor
es,
and
aver
age
scor
es;
appr
oxim
ate
size
ofR
OI
atsc
ale
1.
J.-O. Andersen et al. / Computers and Electronics in Agriculture 22 (1999) 51–69 65
In Circle–80 the parameter S1 GLCM Sum energy shows a monotonic relation-ship to degradation day number, discriminating three groups of days: 1–3, 4–6,and 7, see Fig. 8b.
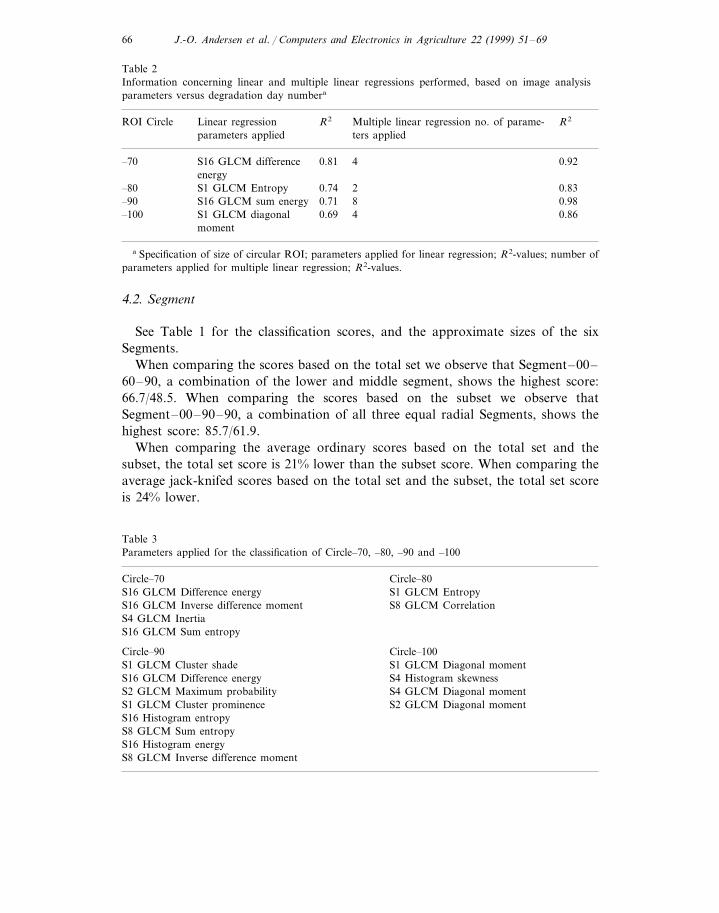
For results from linear and multiple linear regressions for the four Circles, seeTable 2. It is seen that the R2 values are markedly higher when applying multiplelinear regression. In the case of Circle–90 a strong correlation is found (R2=0.98),based on eight parameters, compared to a relatively weak correlation when usingonly a single parameter (R2=0.71).
For the parameters applied for multiple linear regression in connection withCircle–70, 80, 90 and 100, see Table 3.
Fig. 8. (a–b). Two image analysis parameters applied for classification of the 21 image subset plottedagainst degradation day number. a. S16 GLCM Difference energy, applied for Circle–70; and (b) S1GLCM Sum energy, applied for Circle–80.
J.-O. Andersen et al. / Computers and Electronics in Agriculture 22 (1999) 51–6966
Table 2Information concerning linear and multiple linear regressions performed, based on image analysisparameters versus degradation day numbera
R2R2ROI Circle Multiple linear regression no. of parame-Linear regressionparameters applied ters applied
0.924–70 0.81S16 GLCM differenceenergy
0.83–80 S1 GLCM Entropy 0.74 28–90 S16 GLCM sum energy 0.71 0.984 0.86–100 0.69S1 GLCM diagonal
moment
a Specification of size of circular ROI; parameters applied for linear regression; R2-values; number ofparameters applied for multiple linear regression; R2-values.
4.2. Segment
See Table 1 for the classification scores, and the approximate sizes of the sixSegments.
When comparing the scores based on the total set we observe that Segment–00–60–90, a combination of the lower and middle segment, shows the highest score:66.7/48.5. When comparing the scores based on the subset we observe thatSegment–00–90–90, a combination of all three equal radial Segments, shows thehighest score: 85.7/61.9.
When comparing the average ordinary scores based on the total set and thesubset, the total set score is 21% lower than the subset score. When comparing theaverage jack-knifed scores based on the total set and the subset, the total set scoreis 24% lower.
Table 3Parameters applied for the classification of Circle–70, –80, –90 and –100
Circle–70 Circle–80S1 GLCM EntropyS16 GLCM Difference energyS8 GLCM CorrelationS16 GLCM Inverse difference moment
S4 GLCM InertiaS16 GLCM Sum entropy
Circle–90 Circle–100S1 GLCM Cluster shade S1 GLCM Diagonal momentS16 GLCM Difference energy S4 Histogram skewnessS2 GLCM Maximum probability S4 GLCM Diagonal momentS1 GLCM Cluster prominence S2 GLCM Diagonal momentS16 Histogram entropyS8 GLCM Sum entropyS16 Histogram energyS8 GLCM Inverse difference moment
J.-O. Andersen et al. / Computers and Electronics in Agriculture 22 (1999) 51–69 67
When comparing the average ordinary and jack-knifed scores based on the totalset the ordinary score is 42% higher than the jack-knifed. In the case of the subsetthe ordinary score is 38% higher.
5. Conclusion
It was demonstrated in the present study that by means of the developed imageanalysis procedures termed ACTA, it was possible to classify correctly the applied21 biocrystallogram images, originating from a carrot extract degradation seriesincluding seven groups.
The applied images represent biocrystallograms typically found in biocrystalliza-tion investigations of agricultural products reported in the literature, concerning therange in morphological features found in the seven groups, and concerning therange in morphological features found in each group. Concerning the number ofreplicates in each group, i.e. three, this represented the lowest possible number as abasis of classification, performed by means of stepwise discriminant analysis.
Earlier studies have been based on a circular ROI, with no restrictions on thenumber of centres or their location. The high classification scores seen in thepresent study, based on single-centred images with a restriction on the variation incentre location, emphasise the fact that a biocrystallogram is inherently not atexture which can be perceived as having a spatially homogeneous distribution ofmorphological features. Indeed the textural information relevant for classificationpurposes is dependent on the location of the centre from where the ramificationstructure expands in all directions. Thus when applying the subset of 21 images, inwhich the within-group variance is reduced, markedly higher classification scoresare found. Thus out of the 72 scores listed, six scores ranging from 90 to 100% areall found in the subset. For future studies it may therefore be recommended toimpose a restriction on the variation in centre location, since this variation is aphenomenon which may be expected to appear in biocrystallograms from allagricultural products.
The relatively large pairwise differences in scores between the ordinary andjack-knifed scores in favour of the ordinary, in both the total set and the subset,indicate inhomogeneity among the images in the individual groups. However adetailed interpretation is not possible on the basis of the present study.
We found that discriminative information was present in all zones. Thus theexperience of some authors applying visual classification, that the most consistentand discriminative information is found in the upper median zone, correspondingapproximately to Segment–60–90–90, was not confirmed. When comparing thefour main types of ROI we found that the three circular ROIs generally showedhigher scores than Segment, i.e. the larger ROIs performed better than the smallerones. In fact we found the single 100% score in Circle–100, and no general increasein score was found when excluding the centre.
J.-O. Andersen et al. / Computers and Electronics in Agriculture 22 (1999) 51–6968
The procedure of applying five resolution scales, in combination with a totalof 23 first- and second-order parameters, appears relevant, and there are noindications of marked superiority of individual parameters in classifying the im-ages. We observe that five out of eight histogram parameters, and 11 out of 15GLCM parameters are applied for classification in connection with the fewresults listed here. Similarly parameters are applied from all five scales, in thecase of GLCM Diagonal moment indeed four out of five scales are applied.
The developed image analysis procedures can provide reproducible data inconnection with biocrystallization investigations of agricultural products, whichcan be statistically correlated to other experimental data. Thereby they mayincrease our understanding of the qualitative information obtained from biocrys-tallization investigations of the quality of agricultural products, concerning e.g.the effects of farming systems, fertilisation, storage ability and processing.
The fact that only single-centred images can be applied represents a limitation.However out of the 26 initially discarded multi-centered images, the majoritywere two-centred, and again the majority of these contained one dominant cen-tre, i.e. the second centre only occupied a minor part of the overall ramificationstructure. Including these images, based on relevant restrictions on the locationand the relative dominance of the second centre, may increase considerably thenumber of images available as a basis of classification.
For future studies it may be recommended to introduce polar, non-Cartesiansystems of co-ordinates which to a higher degree reflect the zonal structure ofbiocrystallograms. Besides the type of classification presented here, whereby theimage in question and the images constituting the classification groups originatedfrom the same investigation, other types of classification might be developed.Thereby individual images originating from separate investigations might beclassified and compared relative to a set of standard scales, each containing arelevant number of discrete groups. Thus images originating from a carrot sam-ple might be classified relative to scales, produced on the basis of carrot samplesdistinguished by experimental factors such as physiological maturity, post-harvestdegradation, and destructive processing by means of e.g. irradiation. Actualstructure analysis procedures, whereby the crystal structure is analysed relative toa crystal-free background, will no doubt improve the discriminative and classifi-catory power of the image analysis. Finally the progress in hardware technology,with ever increasing computational capacity and speed, may prove it advanta-geous to include colours without unduly time-consuming procedures.
Acknowledgements
We thank the Danish Agricultural Ministry for the fundings which made thepresent study possible. We thank Jens Michael Carstensen, Department of Math-ematical Modelling, The Technical University of Denmark, for valuable adviceand comments throughout the study.
J.-O. Andersen et al. / Computers and Electronics in Agriculture 22 (1999) 51–69 69
References
Andersen, J-O., Laursen, J., Kølster, P., 1998. A refined biocrystallization method applied in apictomorphological investigation of a polymer. Elemente Natur. 68, 1–20.
Balzer, U., Balzer, F., 1993. Picture-developing methods. Effect of three farming systems (bio-dynamic,bio-organic conventional) on yield and quality of beetroot (Beta Vulgaris L.Var. Esculenta L.) in aseven year crop rotation. Acta Horticult. 339, 11–31.
Carstensen, J.M., 1992. Description and simulation of visual texture. Ph.D. thesis. Department ofMathematical Modelling, Technical University of Denmark.
Carstensen, J.M., 1993. Co-occurrence feature performance in texture classification. In: Høgda et al.(Eds.), Proceedings of the Eight Scandinavian Conference on Image Analysis. University of Tromsø,Tromsø, Denmark, pp. 831–838.
Conners, R., Trivedi, M., Harlow, C., 1984. Segmentation of a high-resolution urban scene using textureoperators. Comput Vis. Graphics Image Proc. 25, 273–310.
Dixon, W.J. (Ed.), 1985. BMDP Statistical Software. University of California Press, Berkeley, CA.Engqvist, M., 1970. Gestaltkrafte des Lebendigen. Klostermann, Frankfurt am Main.Engqvist, M., 1989. Qualitetsprufung an Gemuse durch die Kupferchlorid-Kristallizationsmethode.
Jarna.Haralick, R., Shanmugam, K., Dinstein, I., 1973. Textural features for image classification. IEEE Trans.
Syst. Man Cybernet. 3 (6), 610–621.Henriksen, C.B., 1998. ACTA 1.0. User’s Manual. Internal Report, Department of Agricultural Science,
The Royal Veterinary and Agricultural University. Copenhagen.Kleber, W., Steinike-Hartung, U., 1959. Ein Betrag zur Kristallization von Kupfer(II)–Chlorid–Dihy-
drat aus Losungen. Zeitschr. Kristallogr. 111, 213–234.Le Gia, V., Teisseron, G., Michel, M.C., Cauffet, G., 1996. Application of texture analysis for the
crystallisation image characterisation. In: Grossmann, H. et al. (Eds.), Proceedings from the ThirdEuropean Research Symposium: Image Analysis for Pulp and Paper Research and Production,Stockholm 1995.
Le Gia, V., 1996. Extraction de parametres de texture d’images de croissance cristalline dendritique.Doctoral thesis. Lime, UJF/IUT de Grenoble.
Neuhaus, A., 1957. Die Kristallographischen Grundlagen der Diagnostischen Kristallizationen. In:Selawry, A., O. (Eds.), Die Kupferchlorid-Kristallization in Naturwissenschaft und Medizin. FischerVerlag, Stuttgart, pp. I–XXXV.
Parkkinen, J., Selkainaho, K., Oja, E., 1990. Detecting texture periodicity from the co-occurrencematrix. Pattern Recogn. Lett. 11 (1), 43–50.
Pfeiffer, E., 1931. Studium von Formkraften an Kristallizationen. Naturwissenschaftliche Sektion amGoetheanum, Dornach.
V. Hahn, F.V., 1962. Thesigraphie. Franz Steiner Verlag, Wiesbaden.
.