Embed Size (px)
Citation preview
ARTICLE
Social Aspects of Computing COMPUTERIZATION, Rob Klirzg Editor PRODUCTIVITY, AND QUALITY
OF WORKLIFE
The impact of a computerized record system on the work lives of cu.stomer service representatives in a large utility company is examined. The results suggest alternate methods for thinking about and measuring technoi!ogical impact.
ROBERT KRAUT, SUSAN DUMAIS, and SUSAN KOCH
The rapid spread of computer and telecommunication technologies throughout white-collar work has forced social scientists to consider the impact of these technol- ogies on the people who use them directly and on the work force and economy as a whole. Questions about the effects of these technologies on employment levels and organizational efficiency arose in earlier discus- sions of the impact of automation [52]. Now researchers are also asking about the effects of information technol- ogy on the social experience of individuals who use it, i.e., the nature of their jobs and the quality of their working lives. But the answers to these questions are not straightforward. As Attewell and Rule note, the “research literature on the impact of new information technologies on job content and job satisfaction pro- vides a mass of contradictory findings [5, p. 1185].”
Both economic and social theory as well as a rich case study literature suggest that while information technology may increase productivity it can degrade the work lives of those who use it. One way for-em- ployers to cut labor costs is to substitute less experi- enced, educated, and skilled employees for more skilled employees by using technology. Information technology can aid this process in at least two ways. First, it can incorporate some skill and knowledge directly, requir- ing the user to have less. Much special purpose expert system software avowedly has this aim [Z]. More gener- ally available technology on both the shop floor and in the office, including numerically controlled machine tools, spelling checkers, and syntax-directed program- ming editors, can also be used in this way. Second, information technology can complement Taylorism-
c'l!XU ACM 0001.0782/89/0200-0220 51 50
the fragmentation of an integrated job into relatively autonomous components, with different laborers per- forming different components-by aiding in the reas- sembling of information that is generated by separate individuals. Case studies and analyses by Glenn and Feldberg [23], Gregory and Nussbaum [Xi], and Murphree [43] document occasions in which informa- tion technology has been used to incorporate workers’ skills and to reintegrate information produced through fragmented jobs.
On the other hand, some researchers and analysts have argued that computerized work i’s manifestly more fulfilling than conventional work [22, 501. Ac- cording to this position, the most routinized work is most likely to be automated, eliminating jobs requiring low skill and eliminating the most boring and repetitive tasks within more skilled jobs [I]. Poppel’s an.alysis of the benefits of office automation for sales and informa- tion workers is typical [48]. After studying 15 large U.S. organizations, he concluded that a salesperson’s time is wasted on travel, missing contacts, finding out informa- tion, and filling out forms, while the time of many managers and professionals is similarly wasted on meetings and clerical work. According to his ianalysis, office automation technology can rescue some of that wasted time and make jobs more rewarding. In a more sophisticated and balanced analysis, Attewell [4] has shown how computerization has eliminated some of the routine work of insurance examiners, such as cal- culating of deductibles or identifying of potential dupli- cate payments, while at the same time leaving exam- iners more time to make decisions about dubious claims. Zuboff [53] has argued that computeri:zation has added intellectual content to work by making activities
220 Communications of the ACM Februa y 1989 Volume 32 Number 2
more abstract. (See also Baran [S] for ways in which intellectual content is being reintroduced into white collar work.)
What leads to these contradictory results? The do- main is far more complex than the idealized rhetoric of deskilling or upgrading imply. As Attewell and Rule [5] point out, the large number of variables moderating the effects of technology imply that both deskilling and up- grading are occurring within white-collar occupations. To determine which tendency predominates would re- quire quantitative studies that sample representatively from firms and workers.
But even within a single organization, researchers often reach oversimplified and sometimes erroneous conclusions because of methodological and conceptual flaws in their research. Empirically, researchers often use inappropriate methodologies that confound the ef- fects of technological change with preexisting differ- ences between workers or concomitant historical events. Conceptually, the models they use to assess the effects of technology are often too simple to capture the range and variety of variables implicated in the techno- logical change process. Kling and Scacchi’s phrase “web of computing” emphasizes the complexity and subtlety of the model one needs to understand the impact of information technology [36].
This article examines in detail what happened to pro- ductivity and quality of working life when a large com- pany introduced a computerized record system. An overarching goal is to illustrate via this case study the methodological and conceptual complexities involved in assessing technological effects. After a brief discus- sion of the research setting, we review some problems with common methods for assessing the effects of tech- nologies and present a lagged, time-series design that overcomes some of these problems. Using it, we present evidence that the computerized record system had powerful but varied effects on productivity and quality of work life.
Because we studied a large, geographically dispersed company over time using both qualitative and quantita- tive research methods, we obtained an unusually rich picture of technological change in this company. The data led us to elaborate the simple technological impact model we developed initially. They caused us to chal- lenge an assumption of monolithic change common in technological impact studies by showing that the com- puter system had different effects depending on work- ers’ job category, the tasks they performed, and the types of offices they worked in. They also caused us to challenge our assumption of one-way causation. The technology evolved as workers used it in innovative ways. We conclude with a richer conceptual model of the processes of technological change.
THE RESEARCH SETTING The focus of the study is the work lives of customer service representatives in a large public utility. The customer service department in this company deals with orders for service and billing inquiries for over
Articles
2.5 million customers, making 5 million customer con- tacts per year. Service representatives are the highest- paid nonmanagement workers in the company. Most have been with the company for several years and were promoted from lower-level, clerical positions. They are the primary contact point between the com- pany and customers, providing information, solving customers’ problems, collecting overdue bills, and selling new services. Our study includes 10 offices employing a total of 485 service representatives in 6 cities.
Top management decided to automate the customer service department to increase efficiency and cut labor costs. They installed equipment that would computer- ize information that service representatives had previ- ously viewed on microfiche and altered by completing paper transaction records. Compared to the microfiche system it replaced, the interactive computer system was to provide service representatives with more re- cent billing information in a more convenient way and to allow interactive updating of customers’ accounts. No attempt was intentionally made to alter the service representatives’ work processes more extensively. In particular, the technology did not alter the range of tasks that they performed and the importance of inter- action with customers while performing these tasks.
The managerial goals that initiated the computerized record system-reducing labor costs while maintaining service quality-placed only loose constraints on the technology that was developed. The record system was only one type of computer technology that could have met these goals. Other options include expert systems that would automate credit decisions [3, 61, and tool- based systems that would provide service representa- tives with more information for making decisions, an- swering questions, or providing additional services [16]. In many respects, the record system was very similar to a commercial product used by sister utilities since the mid-1970s. By deciding to mimic an available system, which in turn had mimicked the paper and microfiche system, the design team turned the computer, a poten- tially innovative tool, into a relatively passive device for retrieving and displaying information. Although this decision minimized the disruption caused by automa- tion, the utility inherited a set of work procedures and management philosophies that had been in place since the early 1976s.
At the outset, the computerized record system was one element of a labor-reduction strategy that called for consolidation of offices from six cities to two. However, halfway through the implementation, this decision was reversed: management decided that offices in all six cities would remain open. Instead, the company would rely on an “electronic consolidation,” in which work overloads in one office would be transferred via tele- communications to other offices around the state. This change was determined by a number of factors, includ- ing rapid reduction in computing and telecommunica- tion costs; resistance from service representatives (espe- cially those from the smaller offices whose jobs were at
February 1989 Volume 32 Number 2 Communications of the ACM 221
Articles
stake), their union, and first-line supervisors; and the greater efficiency, quality of service, and labor stability of the small offices.
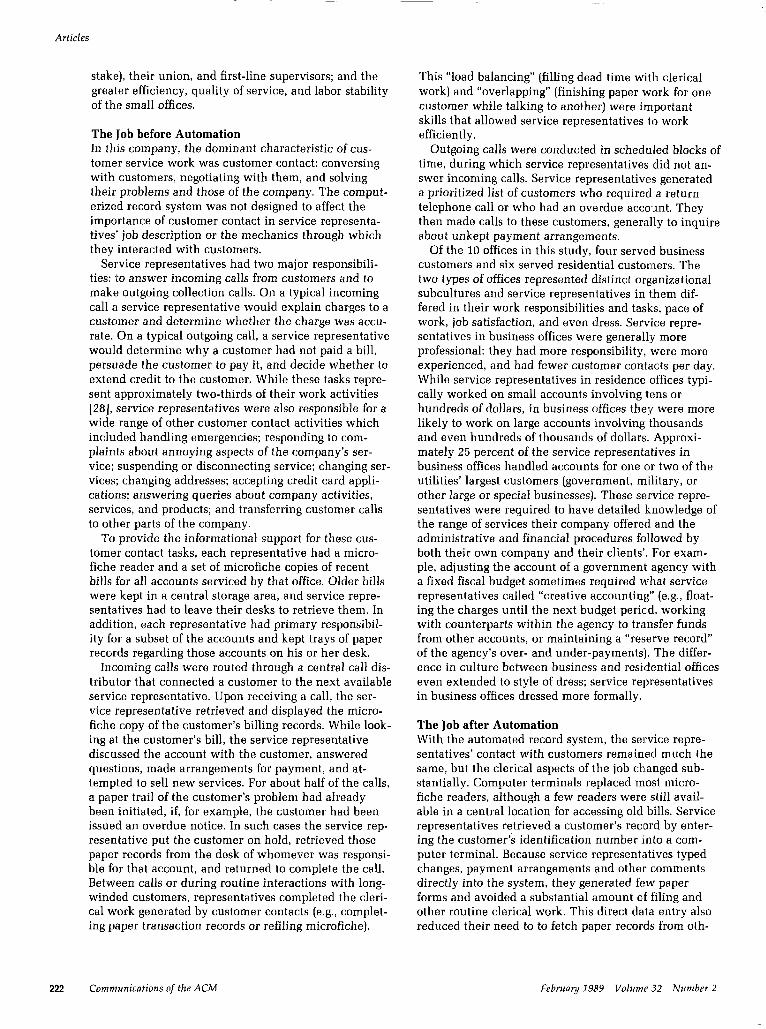
The Ilob before Automation In this company, the dominant characteristic of cus- tomer service work was customer contact: conversing with customers, negotiating with them, and solving their problems and those of the company. The comput- erized record system was not designed to affect the importance of customer contact in service representa- tives’ job description or the mechanics through which they interacted with customers.
Service representatives had two major responsibili- ties: ‘to answer incoming calls from customers and to make outgoing collection calls. On a typical incoming call a service representative would explain charges to a customer and determine whether the charge was accu- rate. On a typical outgoing call, a service representative would determine why a customer had not paid a bill, persuade the customer to pay it, and decide whether to extend credit to the customer. While these tasks repre- sent approximately two-thirds of their work activities [28], service representatives were also responsible for a wide range of other customer contact activities which included handling emergencies; responding to com- plaints about annoying aspects of the company’s ser- vice; suspending or disconnecting service; changing ser- vices; changing addresses; accepting credit card appli- cations; answering queries about company activities, services, and products; and transferring customer calls to other parts of the company.
To provide the informational support for these cus- tomer contact tasks, each representative had a micro- fiche reader and a set of microfiche copies of recent bills for all accounts serviced by that office. Older bills were kept in a central storage area, and service repre- sentatives had to leave their desks to retrieve them. In addi.tion, each representative had primary responsibil- ity for a subset of the accounts and kept trays of paper records regarding those accounts on his or her desk.
Incoming calls were routed through a central call dis- tributor that connected a customer to the next available service representative. Upon receiving a call, the ser- vice representative retrieved and displayed the micro- fiche copy of the customer’s billing records. While look- ing at the customer’s bill, the service representative discussed the account with the customer, answered questions, made arrangements for payment, and at- tempted to sell new services. For about half of the calls, a paper trail of the customer’s problem had already been initiated, if, for example, the customer had been issued an overdue notice. In such cases the service rep- resentative put the customer on hold, retrieved those paper records from the desk of whomever was responsi- ble for that account, and returned to complete the call. Bet.ween calls or during routine interactions with long- winded customers, representatives completed the cleri- cal work generated by customer contacts (e.g., complet- ing paper transaction records or refiling microfiche).
This “load balancing” (filling dead time with clerical work) and “overlapping” (finishing paper work for one customer while talking to another) were important skills that allowed service representatives to work efficiently.
Outgoing calls were conducted in scheduled blocks of time, during which service representatives did not an- swer incoming calls. Service representatives generated a prioritized list of customers who required a return telephone call or who had an overdue acco.ant. They then made calls to these customers, generally to inquire about unkept payment arrangements.
Of the 10 offices in this study, four served business customers and six served residential customers. The two types of offices represented distinct organizational subcultures and service representatives in them dif- fered in their work responsibilities and tasks, pace of work, job satisfaction, and even dress. Service repre- sentatives in business offices were generally more professional: they had more responsibility, were more experienced, and had fewer customer contacts per day. While service representatives in residence offices typi- cally worked on small accounts involving tens or hundreds of dollars, in business offices the;y were more likely to work on large accounts involving thousands and even hundreds of thousands of dollars. Approxi- mately 25 percent of the service representa.tives in business offices handled accounts for one or two of the utilities’ largest customers (government, military, or other large or special businesses). These service repre- sentatives were required to have detailed knowledge of the range of services their company offered and the administrative and financial procedures followed by both their own company and their clients’. For exam- ple, adjusting the account of a government agency with a fixed fiscal budget sometimes required what service representatives called “creative accounting” (e.g., float- ing the charges until the next budget period, working with counterparts within the agency to transfer funds from other accounts, or maintaining a “reserve record” of the agency’s over- and under-payments]. The differ- ence in culture between business and residential offices even extended to style of dress; service representatives in business offices dressed more formally.
The Job after Automation With the automated record system, the service repre- sentatives’ contact with customers remained much the same, but the clerical aspects of the job chLanged sub- stantially. Computer terminals replaced m.ost micro- fiche readers, although a few readers were still avail- able in a central location for accessing old bills. Service representatives retrieved a customer’s recsord by enter- ing the customer’s identification number :into a com- puter terminal. Because service represent(atives typed changes, payment arrangements and other comments directly into the system, they generated few paper forms and avoided a substantial amount of filing and other routine clerical work. This direct data entry also reduced their need to to fetch paper records from oth-
222 Conmn~nications of the ACM February 1989 Volume 32 Number 2
Articles
em’ desks, diminishing movement and social interac- tion throughout the office.
When they were not scheduled to take incoming calls, service representatives made their outgoing col- lection calls. The computer rather than the service rep- resentatives generated the prioritized work list of ac- counts requiring action.
Along with the introduction of the record system other changes in the technology and social organization of the customer service department were made. First, almost all of the offices were moved to new quarters with modular, ergonomically designed furniture. The office layout also changed; square arrangements of four desks separated by portable panels replaced rows of desks, disrupting familiar seating arrangements and friendship patterns, and making informal chatting more difficult. Second, a new phone and call distributing sys- tem, with increased reporting and monitoring capabili- ties, was installed. The reporting capabilities were used to schedule and manage work loads, rather than to evaluate individual service representatives. Finally, some changes in management policy were introduced. Most important was enforcement of an existing policy that all clerical work associated with a customer inter- action be accomplished while the customer was on the line. In large part, this change occurred because all work on one customer record had to be completed be- fore a new record could be accessed. These changes reduced opportunities for service representatives to bal- ance their work load or to overlap tasks in traditional ways, and created tensions as the service representa- tives raced to finish their work before hanging up on a customer.
MODELS AND METHODS FOR STUDYING TECHNOLOGICAL IMPACT We examined the effects of the automated customer record system on the job performance and quality of work life of customer service representatives. The basic hypothesis we were testing was that with the goal of improving the productivity of their labor force, man- agers and implementors would design information sys- tems that degraded the skills of their labor force and quality of working life.
Technological impact models grossly oversimplify the process of technological change in organizations by
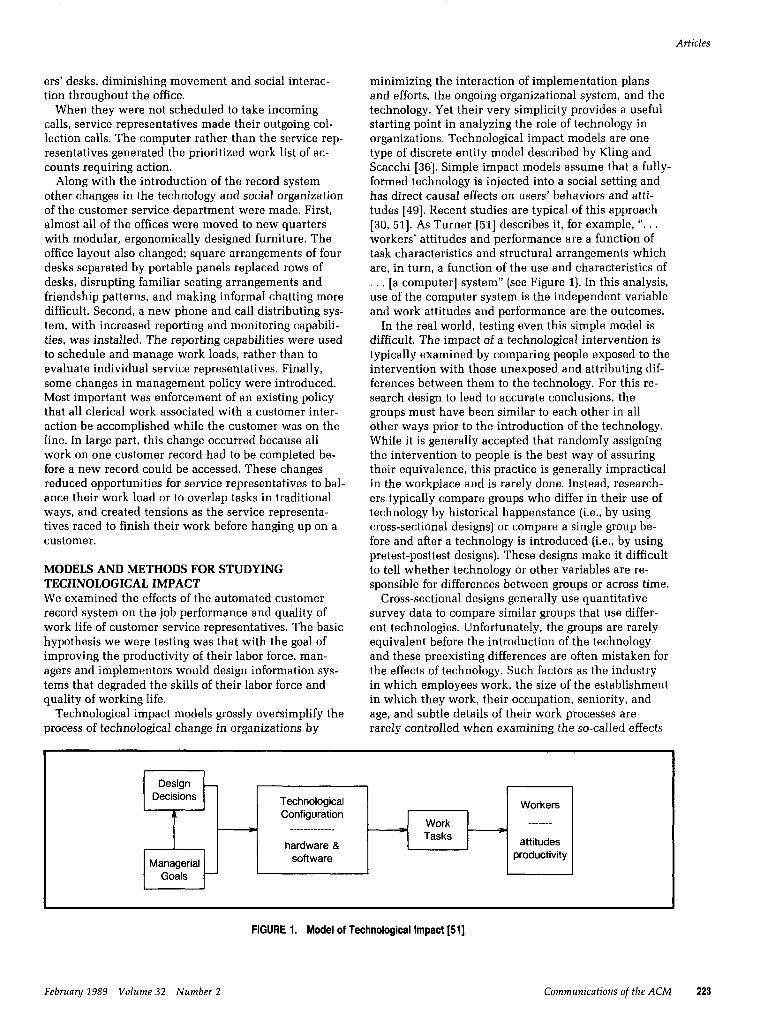
minimizing the interaction of implementation plans and efforts, the ongoing organizational system, and the technology. Yet their very simplicity provides a useful starting point in analyzing the role of technology in organizations. Technological impact models are one type of discrete entity model described by Kling and Scacchi [36]. Simple impact models assume that a fully- formed technology is injected into a social setting and has direct causal effects on users’ behaviors and atti- tudes [46]. Recent studies are typical of this approach [30, 511. As Turner [51] describes it, for example, ‘I. . . workers’ attitudes and performance are a function of task characteristics and structural arrangements which are, in turn, a function of the use and characteristics of . . . [a computer] system” (see Figure 1). In this analysis, use of the computer system is the independent variable and work attitudes and performance are the outcomes.
In the real world, testing even this simple model is difficult. The impact of a technological intervention is typically examined by comparing people exposed to the intervention with those unexposed and attributing dif- ferences between them to the technology. For this re- search design to lead to accurate conclusions, the groups must have been similar to each other in all other ways prior to the introduction of the technology. While it is generally accepted that randomly assigning the intervention to people is the best way of assuring their equivalence, this practice is generally impractical in the workplace and is rarely done. Instead, research- ers typically compare groups who differ in their use of technology by historical happenstance (i.e., by using cross-sectional designs) or compare a single group be- fore and after a technology is introduced (i.e., by using pretest-posttest designs). These designs make it difficult to tell whether technology or other variables are re- sponsible for differences between groups or across time.
Cross-sectional designs generally use quantitative survey data to compare similar groups that use differ- ent technologies. Unfortunately, the groups are rarely equivalent before the introduction of the technology and these preexisting differences are often mistaken for the effects of technology. Such factors as the industry in which employees work, the size of the establishment in which they work, their occupation, seniority, and age, and subtle details of their work processes are rarely controlled when examining the so-called effects
Design _ Decisions Technological Workers
A Configuration Work _______
- ___________-_ Tasks
s
hardware & attitudes
Managerial software productivity
Goals -
FIGURE 1. Model of Technological Impact [51]
February 1989 Volume 32 Number 2 Communications of the ACM 223
Articles
Off ice 1 Pre C Post1 Post3 2 Pre C Post1 post3 3 Pre C Post1 Post3
10 -
Nov Dee Jan Feb Mar APr
Pre
May
C Post1 Post3
Jun Jul Aug Sep
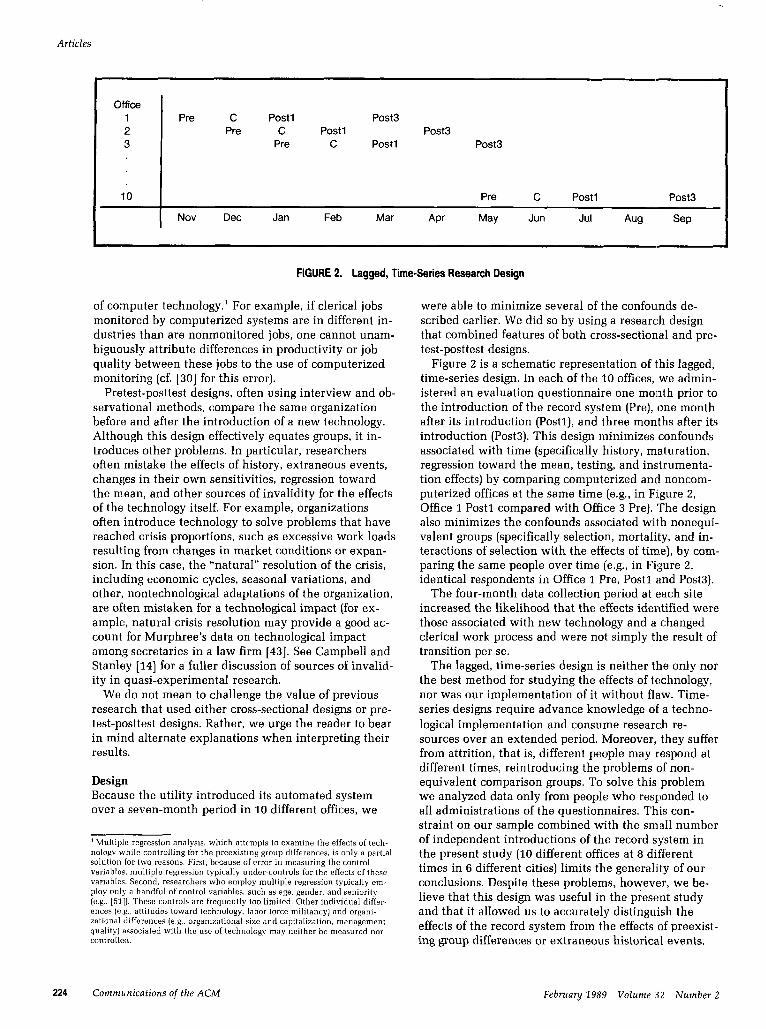
FIGURE 2. Lagged, Time-Series Research Design
of computer technology.’ For example, if clerical jobs monitored by computerized systems are in different in- dustries than are nonmonitored jobs, one cannot unam- biguously attribute differences in productivity or job quality between these jobs to the use of computerized monitoring (cf. [30] for this error).
Pretest-posttest designs, often using interview and ob- servational methods, compare the same organization before and after the introduction of a new technology. Although this design effectively equates groups, it in- traduces other problems. In particular, researchers often mistake the effects of history, extraneous events, changes in their own sensitivities, regression toward the m.ean, and other sources of invalidity for the effects of the technology itself. For example, organizations often introduce technology to solve problems that have reached crisis proportions, such as excessive work loads resulting from changes in market conditions or expan- sion. In this case, the “natural” resolution of the crisis, including economic cycles, seasonal variations, and other, nontechnological adaptations of the organization, are often mistaken for a technological impact (for ex- ample, natural crisis resolution may provide a good ac- count for Murphree’s data on technological impact among secretaries in a law firm [43]. See Campbell and Stanley [14] for a fuller discussion of sources of invalid- ity in quasi-experimental research.
We do not mean to challenge the value of previous research that used either cross-sectional designs or pre- test-posttest designs. Rather, we urge the reader to bear in mind alternate explanations when interpreting their results.
Design Because the utility introduced its automated system over a seven-month period in 10 different offices, we
’ Multiple regression analysis. which attempts to examine the effects of tech- nology while controlling for the preexisting group differences, is only a partial solution for two reasons. First. because of error in measuring the control variables, multiple regression typically under-controls for the effects of these variables. Second. researchers who employ multiple regression typically em- ploy only a handful of control variables. such as age. gender. and seniority (e.g., [51]). These controls are frequently loo limited. Other individual differ- ences (e.g.. attitudes toward technology. labor force militancy) and organi- zational differences (e.g.. organizational size and capitalization. management quality) associated with the use of technology may neither be measured nor controlled.
were able to minimize several of the confounds de- scribed earlier. We did so by using a researc:h design that combined features of both cross-sectional and pre- test-posttest designs.
Figure 2 is a schematic representation of this lagged, time-series design. In each of the 10 offices, we admin- istered an evaluation questionnaire one month prior to the introduction of the record system (Pre), one month after its introduction (Postl), and three months after its introduction (Post3). This design minimizes confounds associated with time (specifically history, maturation, regression toward the mean, testing, and instrumenta- tion effects) by comparing computerized and noncom- puterized offices at the same time (e.g., in Figure 2, Office 1 Post1 compared with Office 3 Pre). ‘The design also minimizes the confounds associated with nonequi- valent groups (specifically selection, mortality, and in- teractions of selection with the effects of time), by com- paring the same people over time (e.g., in Figure 2, identical respondents in Office 1 Pre, Post1 and Post3).
The four-month data collection period at each site increased the likelihood that the effects identified were those associated with new technology and a changed clerical work process and were not simply the result of transition per se.
The lagged, time-series design is neither the only nor the best method for studying the effects of technology, nor was our implementation of it without flaw. Time- series designs require advance knowledge of a techno- logical implementation and consume researc:h re- sources over an extended period. Moreover, they suffer from attrition, that is, different people may respond at different times, reintroducing the problems of non- equivalent comparison groups. To solve this problem we analyzed data only from people who responded to all administrations of the questionnaires. This con- straint on our sample combined with the small number of independent introductions of the record system in the present study (10 different offices at 8 dijyferent times in 6 different cities) limits the generality of our conclusions. Despite these problems, however, we be- lieve that this design was useful in the present study and that it allowed us to accurately distinguish the effects of the record system from the effects of preexist- ing group differences or extraneous historical events.
224 Communications of the ACM February 1989 Volume 32 Number 2
Articles
Data Collection and Respondents (327 Pre, 243 Postl, 175 PostS), representing a response Supervisors distributed questionnaires to approximately rate of 60 percent of the approximately 1250 question- 415 service representatives (all service representatives naires that could potentially have been returned given in the state attending work on particular days). The the numbers of service representatives reporting to questionnaires were designed after 20 hours of on-site work on a typical day. While 78 percent of respondents observation and several interviews with service repre- returned the first questionnaire, only 42 percent re- sentatives and their managers. These observations turned the last. On average, respondents were 34 years helped us tailor questions to the tasks we were study- old, had worked for the company for over 10 years, and ing. The questionnaires were completed anonymously over half had some college education. Eighty percent and returned in sealed envelopes to the research team. were female.
A total of 745 usable questionnaires were returned Our analyses are based on 169 respondents who re-
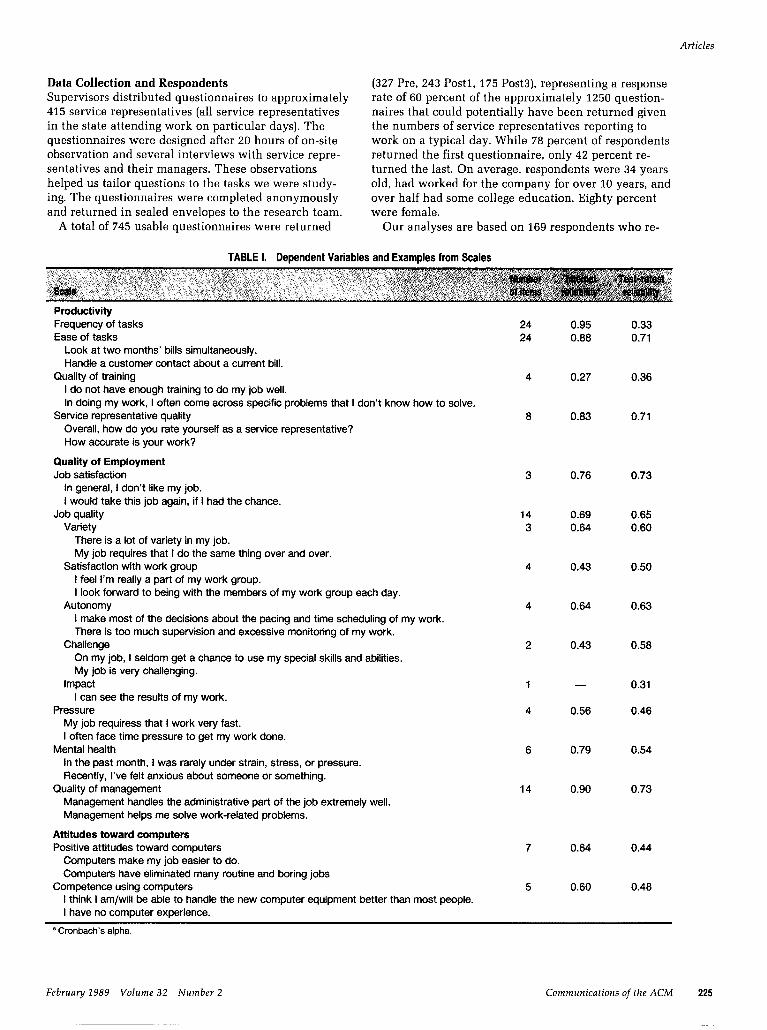
TABLE I. Dependent Variables and Examples from Scales
Productivity Frequency of tasks Ease of tasks
Look at two months’ bills simultaneously. Handle a customer contact about a current bill.
Quality of training I do not have enough training to do my job well. In doing my work, I often come across specific problems that I don’t know how to solve.
Service representative quality Overall, how do you rate yourself as a service representative? How accurate is your work?
4 0.27 0.38
8 0.83 0.71
Quality of Employment Job satisfaction
In general, I don’t like my job. I would take this job again, if I had the chance.
Job quality Variety
There is a lot of variety in my job. My job requires that I do the same thing over and over.
Satisfaction with work group I feel I’m really a part of my work group. I look forward to being with the members of my work group each day.
Autonomy I make most of the decisions about the pacing and time scheduling of my work. There is too much supervision and excessive monitoring of my work.
Challenge On my job, I seldom get a chance to use my special skills and abilities. My job is very challenging.
Impact I can see the results of my work.
Pressure My job requiress that I work very fast. I often face time pressure to get my work done.
Mental health In the past month, I was rarely under strain, stress, or pressure. Recently, I’ve felt anxious about someone or something.
Quality of management Management handles the administrative part of the job extremely well. Management helps me solve work-related problems.
3 0.76 0.73
14 0.69 0.65 3 0.64 0.60
4 0.43 0.50
4 0.64 0.83
2 0.43 0.58
1
4
- 0.31
0.56 0.46
6 0.79 0.54
14 0.90 0.73
Attitudes toward computers Positive attitudes toward computers
Computers make my job easier to do. 7 0.64 0.44
Computers have eliminated many routine and boring jobs Competence using computers
I think I am/will be able to handle the new computer equipment better than most people. I have no computer experience.
5 0.60 0.48
’ Cronbach’s alpha
Februa y 1989 Volume 32 Number 2 Communications of the ACM 225
Arficles
turned both a pre-computerization questionnaire and at naires in the composite Post measure meant that we least one of the two post-computerization question- were assessing the effects of transition rather than the naires, and whose questionnaires we could match effects of technology. Cross-sectional analyses of the de- through their voluntary use of a code number. Seventy pendent variables [see Table I) using f-tests revealed no of the time-series respondents completed all three ques- tionnaires, 88 completed both a Pre questionnaire and a Post3 questionnaire, and 11 completed both a Pre ques- tionnaire and a Post3 questionnaire. Given the large attrition in the last wave of the questionnaire, to make efficient use of our sample, we combined Post1 and Post3 responses, by using either the respondents’ Post1 or Post3 responses, if they completed only one of these questionnaires, or the mean of the Post1 and Post3 re- sponses, if they completed both. The 169 respondents for the time-series analyses represent a response rate of 40 percent of the service representatives attending work on a typical day.
We performed analyses to determine whether we were justified in combining Post1 and Post3 measures and whether the over representation of Post1 question-
cases in which the Post1 measures differed reliably from Post3 measures and many cases in which Pre measures differed from either Post1 or Post3 or from both of them.
We were also concerned that measurements taken only one month or even three months after the intro- duction of a computer system would reflect the effects of transition per se, rather than any effects of technol- ogy. The process of introducing a new technology can disrupt an organization, and the ripple effec:ts might show up in the behaviors and attitudes of the users of the technology. In addition, the users’ long practiced work skills and routines may well be disrupted by the introduction of new production technology. To exam- ine whether pretest-posttest differences me:rely reflect the effects of transition per se, we present two types of
NM* Frequency of tasks
_....___._..... -4* Ease of tasks *- __._...._..____.......... -.*----
+------ --_ -+----------4 Ease of uncommon tasks
-+----- --* Ease of common tasks *-----
*--- -‘*-----+ Quality of training
0, ;/ Service rep quality rc
1 5:
$
*- . . . . . . - . . . . . . . . . . . . . . . . . . . . * . . ..____.____.._____........ * Job satisfaction
z rt----
b ------*----------*
*---- Job quality
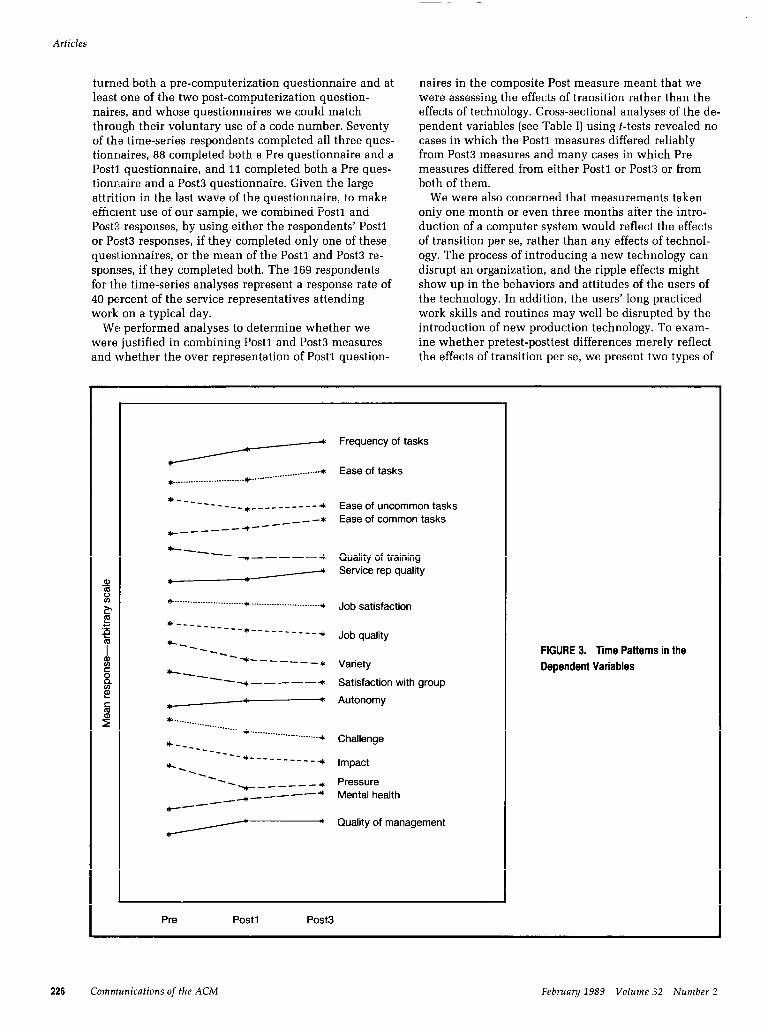
-- FIGURE 3. Time Patterns in the
z --lb------*
H
rc---- Variety Dependent Variables
- ‘+ - - - - - + Satisfaction with group
k z
*-L-----+ Autonomy
r *-.. . . ..__...._._ ““‘--.* . .._........._ . . . . . . . ___. *
*--- Challenge ---_ ---
k I--- ---____ 4
-\ Impact
-. -- -------* Pressure ,--4
-
Mental health
Quality of management
Pre Post1 Post3
226 Communications of the ACM February 198.9 Volume .32 Number 2
Articles
data. Observations in the workplace suggested that service representatives were using the new record system comfortably within a week of training, and in interviews conducted a month after its introduction service representatives claimed that their offices and jobs were “back to normal.” The short transition time reflects the limited scope of the technological change. In particular, recall that the computer technology was designed to influence only the clerical aspects of the job, not the more important customer contacts.
In a more systematic analysis, we examined plots of the dependent variables by time.” These are presented in Figure 3. This examination revealed only two pat- terns of results, both indicating relatively long-lived ef- fects of technology. In the plateau pattern, Pre meas- ures differed reliably from both Post measures, which in turn did not differ from each other (e.g., see the plots for variety, satisfaction with work group, impact, and pressure). In the linear pattern, change continued through the four-month measurement period, so that the difference between the Pre and Post1 measures were continued in the interval between the Post1 and Post3 measures (e.g., see the plots for frequency of tasks, ease of common tasks, and job quality). We saw no cases of a V or inverted-V shaped pattern indicative of simple transition effects, in which variables meas- ured one month after the introduction of the technol- ogy differed reliably from the initial pre-state, but quickly reverted to the initial state. Together these ob- servations and analyses suggest that we were justified in performing a time-series analysis and in combining Post1 with Post3 measures. While we cannot tell what happened in this organization long after the introduc- tion of the computerized record system, our analyses suggest that the four-month data collect period we used was adequate, even though a longer period would have been desirable.
We also tested the generality and validity of our time-series analyses with two additional cross-sectional analyses of the data. We examined whether the results we found among respondents who completed multiple questionnaires (time-series respondents) apply also to those who completed only one questionnaire (drop- outs). A preliminary cross-sectional analysis revealed that the computerized record system had similar effects on time-series respondents and drop-outs. In an analy- sis of variance, of wave (Pre versus Post) by respondent type (time-series versus drop-out) on the 17 dependent variables listed in Table I, only one interaction reached statistical significance, just the number one would ex- pect by chance. The similarity of technological impact on the two types of respondents is true even though time-series respondents were more positive on most de- pendent variables before the introduction of the record system. For example, while the time-series respondents
‘Note that these plots are based on a cross-sectional analysis that confounds respondent attrition with the effects technology. Because of this confounding, we do not use the plots to assess the effects of technology. but rather as an exploratory device lo help decide whether the effects identified in sounder analyses are transitional or long-lived.
were more satisfied with their jobs, reported better mental health, and worked in offices with better man- agement than did drop-outs before the introduction of the record system, the differences between the two types of respondents did not increase after its introduc- tion, i.e., they were not differentially affected by the computerized record system.
Measures of Productivity and Quality of Working Life The questionnaire included two types of measures: time-series and retrospective. The time-series measures asked respondents to describe their job experiences and beliefs at the time of questionnaire administration. The same questions were asked on all occasions, and tech- nology effects were computed by comparing measures taken before introduction to measures taken after. The questionnaires following the introduction of the record system also included some retrospective measures, which asked respondents to assess how their jobs had changed since the record system had been introduced. We rely on data from the time-series measures because respondents often have difficulty answering retrospec- tive questions accurately; they tend to assimilate their previous attitudes to their current states [8] and base their answers on their theories about the effects that technology should have [&I. We include results from the retrospective measures because they amplify the data obtained from the more trustworthy time-series measures.
We examined the impact of the computerized record system on three broad areas: productivity, quality of work life, and attitudes toward computers. We first ob- served service representatives on their jobs and then developed productivity measures based on their reports of the frequency with which they performed important job-related tasks (e.g., finding a customer record, ad- justing an account, deciding to allow a customer to defer payments, or making a sales attempt), and the ease of accomplishing these tasks. We would have pre- ferred to use more objective data on productivity, such as the number of customers served, or the productivity tallies made by service representatives at the time of a customer contact. The company, however, did not keep this information on an individual basis, but aggregated it across workers within an office.
To test hypotheses about the effects of information technology on the deskilling or upgrading of work, we concentrated on assessing the nature of the jobs that service representatives performed and their reactions to them. At the level of the individual worker, the deskill- ing hypothesis implies that the overall quality of jobs as experienced by their incumbents should decrease. To the extent that the technology incorporates workers’ skills, they should feel less challenged by their jobs. If the technology incorporates some of their decision- making prerogatives, their autonomy should be de- creased. To the extent the technology makes the jobs more routinized, workers should experience less vari- ety in their work. If separate workers must coordinate their activities through databases rather than through
February 1989 Volume 32 Number 2 Communications of the ACM 227
Articles
direct communication, some of the social satisfaction of work. will decrease as workers are less connected to their primary work groups. Finally, as is often the case, if the introduction of technology renders some skills obsolete while requiring workers to learn new ones to operate the equipment, workers may doubt the ade- quacy of their training. This degrading of the job itself may have two additional consequences. First, we would expect workers to be less satisfied with a degraded job, and second, the degraded job may lead to mental dis- tress [44, 511.
Measures of job satisfaction, job quality, and manage- ment quality were taken from the University of Michi- gan’s project on assessing organization change [13]. The questionnaire included items to measure the compo- nents of job quality associated with what Locke [XI] called “mental challenge.” We created a job quality index that assessed the extent to which respondents described their jobs as having autonomy, variety, challenge, impact on the company and its customers, and positive relations with members of a work group. To see more precisely what effects the technology had on job characteristics, we created subscales for each component of the job quality index, as well as mea- sures of job pressure, management quality, and in- fluence over the job. To assess claims that computer technology makes old job skills obsolete, we included both a self-report measure of the adequacy of service representatives’ training and skills and a self- assessment of their work quality, compared to other service representatives.
The mental health scale included both assessments of respondents’ happiness (e.g.. the extent to which they felt that things were going their way) and their freedom from symptoms of depression and anxiety (e.g., symp- toms such as feeling depressed, apart or alone, or anx- ious)? derived from items compiled from epidemiologi- cal surveys [24].
To test hypotheses that different classes of users, for example, older workers [Xl, would have more diffi- culty using computer technology and would be thus differentially affected by it, we included scales to mea- sure attitudes toward computers and competence using them. Computer attitude and competence items were taken from Jay [31] and Egan and Gomez [2X]. The computer attitude scale included both general state- ments that computers had good or bad effects on social life and more specific statements that computers im- proved or decreased productivity in the work place. The computer competence scale was based on re- spondents’ reports of experience with computers and computer-like devices.
Examples of the items from these scales are listed in Table I, along with the number of items included in each scale, their internal reliability and their four- month test-retest reliability. Because we used only a small number of items to measure our dependent vari- ables, some of the reliabilities reported in Table I are substantially lower than those reported in [13]. These low reliabilities increase measurement error and, thus,
increase the difficulty of identifying effects of technol- ogy, if they really exist (i.e., they increase Type I error).
In addition to these quantitative measures, we con- ducted 60 open-ended interviews of service representa- tives and their managers two to four weeks after the record system was introduced, and observed them in the workplace both before and after the introduction of the technology. These interviews and observations de- tailed many qualitative aspects of the setting, the ac- tors, and the technological changes. They were crucial in establishing the meaning of the quantitative relation- ships obtained from the evaluation questionnaires, for identifying constraints on managerial prerogatives in designing the record system, and for noticing the ways in which service representatives :modified the technol- ogy while using it.
THE IMPACT OF THE RECORD SYSTE:M Conceptually, given the lagged time-series <design, the data needed to test whether the automated record sys- tem had any impact on productivity or quality of work life is simply the difference between measures collected before and after the record system was introduced. Be- cause the same individuals provided data on at least two occasions and because these occasions were dis- tributed over a seven-month period for diff,erent groups of workers, this difference provides a relatively pure estimate of the effects of the record system uncon- founded with history or preexisting group differences.
We refined this simple measure by using multiple regression on the difference scores, to control for regression toward the mean and other statistical arti- facts involving preexisting differences among respond- ents [17, pp. 378-393). Specifically, each multiple regression predicted the difference between Post and Pre on some dependent variable such a job quality, holding constant a respondent’s Pre measure on that variable. We also controlled for the differential effects of the record system across the control variables of gen- der, age, offices serving business and residential cus- tomers, offices run by managers of different quality, offices of different size, and the offices that introduced the record system at different dates. Gende:r and office type (business versus residence) were dummy coded in the obvious fashion. The quality of management was the mean within an office of service representatives’ evaluations of their management as measured by the management quality scale. Office size was simply the number of service representatives in an office; offices with more service representatives were in larger cities and had more managers within their offices. The final control variable, conversion date or cut time, indi- cates the time at which the new record system was introduced.
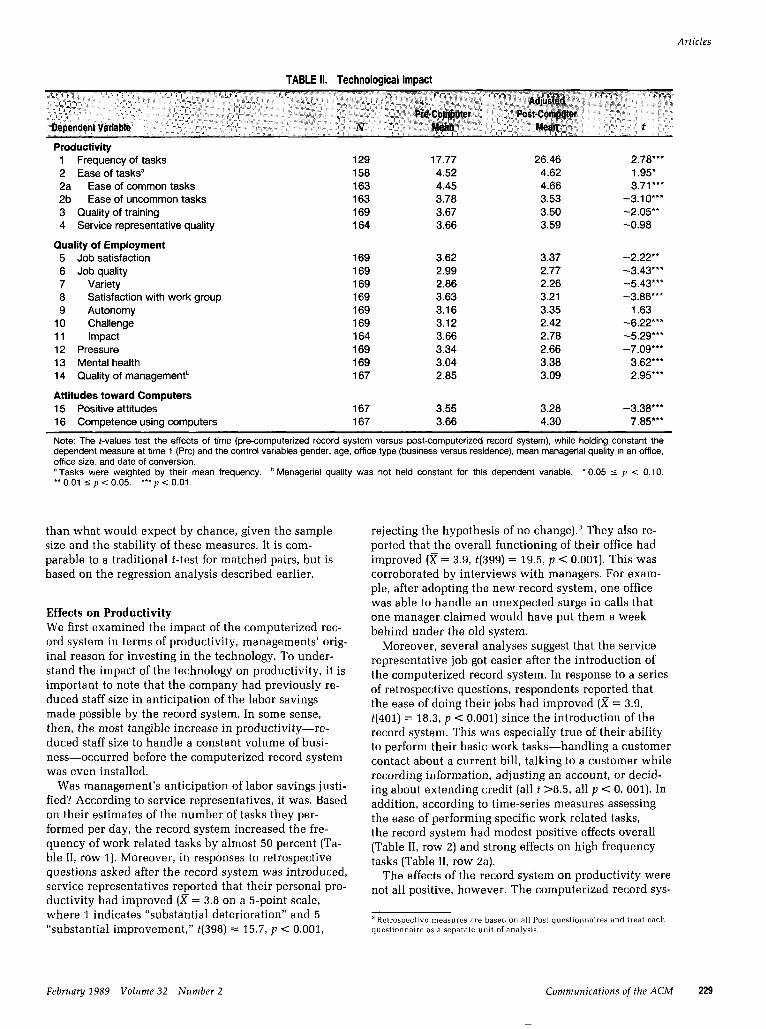
Table II shows the means of the productivity and quality of employment measures before and after the record system was introduced. Post-means were ad- justed by the control variables. The f-value in Table II is a statistic showing the extent to which th.e change between pre-computer and post-computer is greater
220 Communications of the ACM February 1989 Volume 32 Number 2
Articles
TABLE II. Technological Impact
Productivity 1 Frequency of tasks 2 Ease of tasksa 2a Ease of common tasks 2b Ease of uncommon tasks 3 Quality of training 4 Service representative quality
129 17.77 26.46 2.78*” 158 4.52 4.62 1.95* 163 4.45 4.66 3.71 l ** 163 3.78 3.53 -3.10”’ 169 3.67 3.50 -2.05*’ 164 3.66 3.59 -0.98
Quality of Employment 5 Job satisfaction 6 Job quality 7 Variety 8 Satisfaction with work group 9 Autonomy
10 Challenge 11 Impact 12 Pressure 13 Mental health 14 Quality of managementb
169 3.62 3.37 -2.22** 169 2.99 2.77 -3.43”* 169 2.86 2.26 -5.43**+ 169 3.63 3.21 -3.86**’ 169 3.16 3.35 1.63 169 3.12 2.42 -6.22’*’ 164 3.66 2.78 -5.29*** 169 3.34 2.66 -7.09-* 169 3.04 3.38 3.62”’ 167 2.85 3.09 2.95”’
Attitudes toward Computers 15 Positive attitudes 16 Competence using computers
167 3.55 3.28 -3.38”* 167 3.66 4.30 7.85*‘*
Note: The f-values test the effects of time (pre-computerized record system versus post-computerized record system), while holding constant the dependent measure at time 1 (Prc) and the control variables gender, age, office type (business versus residence), mean managerial quality in an office, office size, and date of conversion. ‘Tasks were weighted by their mean frequency. ’ Managerial quality was not held constant for this dependent variable. * 0.05 5 p < 0.10. ‘* 0.01 5 p < 0.05. If* p < 0.01.
than what would expect by chance, given the sample size and the stability of these measures. It is com- parable to a traditional t-test for matched pairs, but is based on the regression analysis described earlier.
Effects on Productivity We first examined the impact of the computerized rec- ord system in terms of productivity, managements’ orig- inal reason for investing in the technology. To under- stand the impact of the technology on productivity, it is important to note that the company had previously re- duced staff size in anticipation of the labor savings made possible by the record system. In some sense, then, the most tangible increase in productivity-re- duced staff size to handle a constant volume of busi- ness-occurred before the computerized record system was even installed.
Was management’s anticipation of labor savings justi- fied? According to service representatives, it was. Based on their estimates of the number of tasks they per- formed per day, the record system increased the fre- quency of work related tasks by almost 50 percent (Ta- ble II, row 1). Moreover, in responses to retrospective questions asked after the record system was introduced, service representatives reported that their personal pro- ductivity had improved (x = 3.8 on a 5-point scale, where 1 indicates “substantial deterioration” and 5 “substantial improvement,” t(398) = 15.7, p < 0.001,
rejecting the hypothesis of no change).3 They also re- ported that the overall functioning of their office had improved (x = 3.9, t(399) = 19.5, p < 0.001). This was corroborated by interviews with managers. For exam- ple, after adopting the new record system, one office was able to handle an unexpected surge in calls that one manager claimed would have put them a week behind under the old system.
Moreover, several analyses suggest that the service representative job got easier after the introduction of the computerized record system. In response to a series of retrospective questions, respondents reported that the ease of doing their jobs had improved (x = 3.9, t(401) = 18.3, p < 0.001) since the introduction of the record system. This was especially true of their ability to perform their basic work tasks-handling a customer contact about a current bill, talking to a customer while recording information, adjusting an account, or decid- ing about extending credit (all t >8.5, all p < 0. 001). In addition, according to time-series measures assessing the ease of performing specific work related tasks, the record system had modest positive effects overall (Table II, row 2) and strong effects on high frequency tasks (Table II, row 2a).
The effects of the record system on productivity were not all positive, however. The computerized record sys-
’ Retroapectivc measures are based on all Post questionnaires and treat each questionnaire as a separalr unit of analysis.
February 1989 Volume 32 Number 2 Communications of the ACM 229
Articles
tern was primarily designed to support the most routine work performed by service representatives, i.e., hand- ling incoming calls about current bills; less attention was paid to how infrequent tasks (such as handling a question about an old bill, working with a multipage bill, handling an account when the records were miss- ing) should be handled. These less common tasks be- came significantly more difficult to do with the advent of the new record system (Table II, row zb). Thus, while the record system made performing high fre- quency tasks easier, it made performing uncommon tasks more difficult. This interaction between task fre- quency and technology was highly statistically signifi- cant (0 = 0.43, t(145) = 6.12, p < 0.001).
Some deleterious effects of the record system on ser- vice representatives’ productivity were revealed in other ways as well. After using the record system, re- spondents felt themselves to be less adequately trained and skilled to do their jobs, and more likely to come across problems that they did not know how to solve (Table II, row 3). Some of their skills became obsolete or less relevant, while the system required new skills that they had to develop.
Although the computerized record system made the routine aspects of their job quicker and easier, it had no effect on how well service representatives believed they performed their jobs in comparison to their peers, either globally or in specific domains such as their ef- fectiveness in sales, debt collection or customer contact work (Table II, row 4).
The computerized record system was designed to in- crease service representatives’ efficiency and to reduce their numbers. To a large extent, it accomplished these goals; however, in designing the system, little attention was paid to other jobs that would be affected.
Supervisors, who evaluated service representatives by auditing records of completed transactions and pe- riodically monitoring customer contacts, found their jobs to be much more difficult after the computerized system was introduced. Evaluation became more time- consuming; for example, the time required to audit an account on the computer increased by a factor of 10 from t.he time required to review paper records. This was compounded by the limited availability of the in- formation they needed. Much of it was available only on the computer, which for security reasons was acces- sible only during business hours. Overflow work that had previously been done at home in the evenings or on weekends now had to be squeezed into business hours. The computerized record system also generated stacks of output, reporting every transaction for the day. Supervisors did not know how to use this informa- tion to evaluate service representatives and found the volume of output oppressive.
A final and more general change produced by the switch to the new system was a shift in the locus of task knowledge. Most supervisors had previously been accomplished service representatives. With the new system, however, they were no longer experts in the operational detail of the work. In fact, few supervisors
had more than rudimentary knowledge of the new sys- tem, thereby diminishing expertise as a basi.s of author- ity over their reportees.
To competently perform their jobs in the face of these difficulties, supervisors had to rely on their gen- eral knowledge of customers’ problems, to rely on their leadership and interpersonal skills, and to work harder. This shift in the bases of competence is reflected in service representatives’ belief that in general their local management and supervisors were performing their jobs better after the introduction of technology than before (Table II, row 14). In interviews, serv:ice repre- sentatives reported being impressed with th’eir supervi- sors’ handling of the transition to the computer system, especially the way in which they had responded to the pressure and uncertainty of the changes. In addition to these transitional effects, service representatives also recognized the reservoirs of general skills their supervi- sors possessed and perceived them as being good sources of help when problems arose.
Effects on Quality of Employment A number of measures show that service representa- tives’ jobs became less satisfying, less interesting, and generally of poorer quality following the introduction of the computerized record system. Overall, relpresenta- tives liked their jobs significantly less after the comput- erized record system was introduced (Table II, row 5). Furthermore, in retrospective evaluations, they re- ported that both the overall interest level and enjoy- ment of the job had deteriorated after the computerized record system was installed (g = 2.86, t(399) = -2.55,
p c 0.02). We can understand more precisely the way in which
the computerized record system affected job satisfac- tion by examining both the quantitative and qualitative evidence of changes in working conditions. In general the working conditions as measured by the Michigan Quality of Working Life scales deteriorated following the introduction of the computerized record system (Table II, row 6). Examining the components of job quality in more detail shows that service representa- tives’ work had less variety (Table II, row 7) was less challenging (Table II, row lo), and that service repre- sentatives were less able to see the results of their work (Table II, row 11). Furthermore, contact with work col- leagues became a less frequent and less satisfying com- ponent of service representatives’ work life (Table II, row 8).
How did these changes occur? The interview data suggest that they resulted partly from changes in social interaction, based on new seating arrangements, new privacy panels, and service representatives’ limited physical movement that come from their coordinating information through a database rather than through word of mouth and the transfer of documents. In this setting part of the decrease in job quality, which is often hypothesized to be a result of computer technol- ogy, was the result of changes in office layout and ar- chitecture that were ancillary to modificati0n.s in office
230 Communications of the ACM Februa y 1989 Volume 32 Number 2
Articles
procedure and only loosely linked to computerization. At a minimum this analysis suggests that the definition we use of technological impact must to expanded sub- stantially to include these nonintrinsic changes in work place and work procedure that often go hand-in-hand with the introduction of computer technology.
The effects associated with the privacy panels and architectural rearrangements seemed short-lived. Within a week after the new system was installed, ser- vice representatives reported that they had learned to talk around or over the panels. Supervisors agreed that the goal of reducing noise in the office had not been accomplished. Likewise, although the new seating ar- rangements disrupted existing friendship groups, new alliances eventually formed.
The more lasting change was service representatives’ increased confinement to their desks. Before the com- puterized record system, service represented coordi- nated some of their work through face-to-face interac- tion as they manually exchanged paper files and microfiche records. Although services representatives wrote comments on service records that should have been sufficient for another representative to continue a customer contact, they often exchanged fuller details of more complex and memorable cases by word of mouth as they exchanged the records themselves. Occasion- ally they would also pass along information about a customer’s reputation, which was legally barred from that customer’s official credit history with the com- pany, but which service representatives found relevant when making credit decisions. In addition, service rep- resentatives explained that getting up to fetch records, which they would for about a quarter of customer con- tacts, had provided them with the opportunity to chat briefly with each other and keep in touch with the rest of the office.
After the system was introduced more coordination occurred passively, with all service representatives having access to up-to-date, computerized files describ- ing a transaction. Many opportunities for interaction disappeared and service representatives felt isolated. In the words of one service representative,
I don’t know what’s going on with anybody any- more. Just today I found out that one of the women over there’s husband was in a car wreck three days ago, and I haven’t even said anything to her. . . . And it’s not all just personal stuff, either. We used to help each other with calls- problems and stuff-or just complain, to blow off steam. That’s gone too, and we just deal with it by ourselves.
In contrast to these negative effects of technology on job quality, other aspects of the job improved after the computerized record system was introduced. Because the most common tasks became easier after automa- tion, representatives reported significantly less job pres- sure after the introduction of the billing system than before (Table II, row 12). That is, even though they
were performing more tasks per day, they believed that their overall work load had been reduced, that they could work slower, and that they were less likely to face time pressures to complete work.
After the introduction of the computerized record system respondents reported themselves as happier and having fewer symptoms of depression and anxiety (Ta- ble II, row 13). This was especially surprising, because mental health was moderately associated with job satis- faction (for the full sample r(729) = 0.43) and quality of work life (r(729) = 0.25), each of which deteriorated with automation. These were offset, apparently, by lowered job pressures and improvements in manage- ment, each of which was associated with improved mental health (for job pressure r(729) = -0.24 and for management r(729) = 0.27).
Attitudes toward Computers Although not a prime focus of our study, it is interest- ing to note how service representatives’ use of com- puter technology affected their beliefs about it and their competence using it. As service representatives used computers more, they developed more negative attitudes toward them, finding them dehumanizing and unlikely to have a productive impact on job perfor- mance (Table II, row 15). As one would expect, as re- spondents used computers more, they became more confident and believed they were more knowledgeable about them (Table II, row 16).
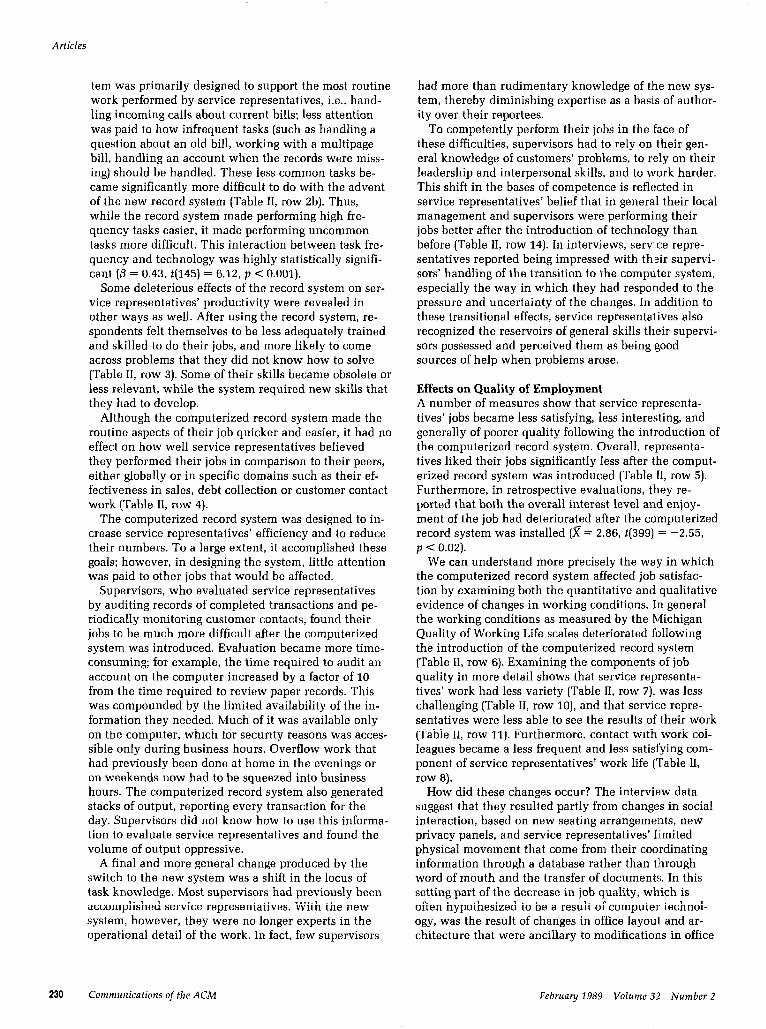
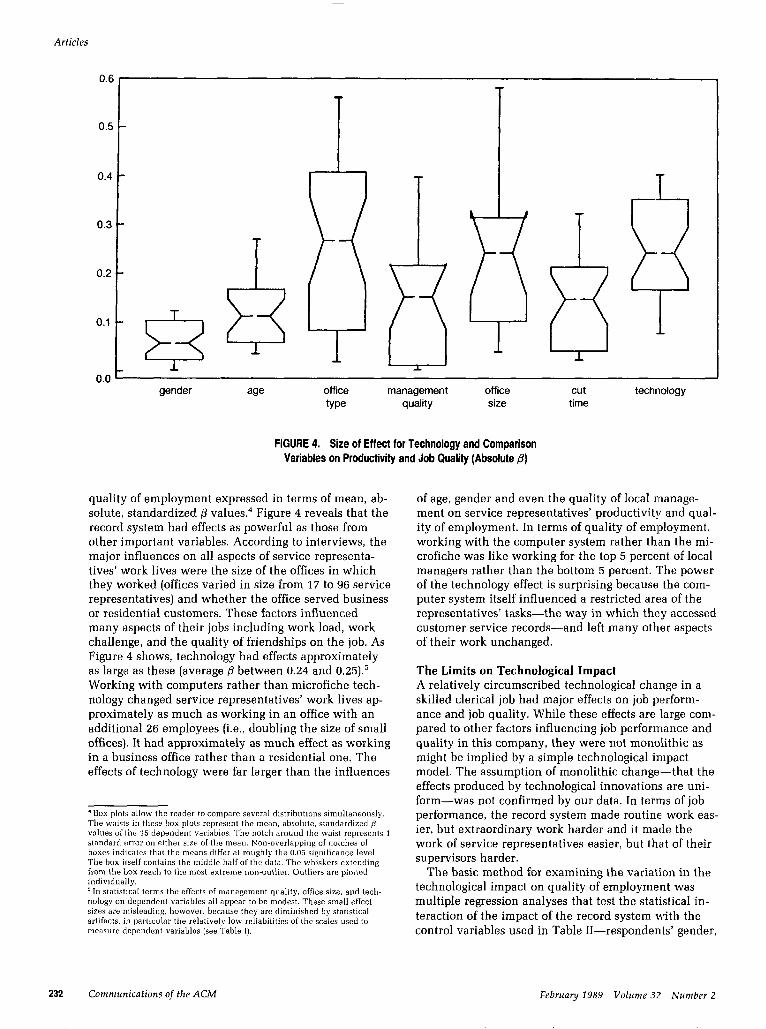
The Power of Technological Impact How important is technological impact? We examined this question by comparing the strength of the technol- ogy effect to the strength of other variables that one would expect to have important influences. By this cri- terion the impact of technology was powerful, indeed, having effects as strong as the major influences on ser- vice representatives’ productivity and quality of work- ing lives.
The comparison variables are the same as those used as control variables in Table II-respondents’ gender, their age, whether they worked in business or resi- dence offices, the quality of the management in the offices in which they worked, the size of the office, and the month in which computerization of their office started. The comparison variables were treated as the independent variables in multiple regression analyses and the mean over time of each productivity and qual- ity of work life measure was the dependent variable. These regressions thus examine the size of the statisti- cal effects of the independent variables (gender, age, etc.) on each of the dependent variables (frequency of tasks, job satisfaction, etc.) while holding constant all other independent variables. Absolute, standardized @ weights are used to summarize these analyses, because they provide a measure of the strength of effect inde- pendent of scale.
Figure 4 displays boxplots that show the size of the technology and comparison effects on productivity and
February 1989 Volume 32 Number 2 Communications of the ACM 231
Articles
0.E
0.5
0.4
0.3
0.2
0.1
0.0 gender age offlce
type
management quality
office size
cut time
technology
FIGURE 4. Size of Effect for Technology and Comparison Variables on Productivity and Job Quality (Absolute a)
quality of employment expressed in terms of mean, ab- solute, standardized @ values.“ Figure 4 reveals that the record system had effects as powerful as those from other important variables. According to interviews, the major influences on all aspects of service representa- tives’ work lives were the size of the offices in which they worked (offices varied in size from 17 to 96 service representatives) and whether the office served business or residential customers. These factors influenced many aspects of their jobs including work load, work challenge, and the quality of friendships on the job. As Figure 4 shows, technology had effects approximately as large as these (average p between 0.24 and 0.25).5 Working with computers rather than microfiche tech- nology changed service representatives’ work lives ap- proximately as much as working in an office with an additional 26 employees (i.e., doubling the size of small offices). It had approximately as much effect as working in a business office rather than a residential one. The effects of technology were far larger than the influences
*Box plot:; allow the reader to compare several distributions simultaneously. The waists in these box plots represent the mean. absolute. standardized fl values of the 15 dependent variables. The notch around the waist represents 1 standard error on either size of the mean. Non-overlapping of notches of boxes indicates that the means differ at rouehlv the 0.05 significance level
. I _ - The box itself contains the middle half of the data. The whiskers extending from the box reach to the most extreme non-outlier. Outliers are plotted individually. ‘In statistxal terms the effects of management quality. office size. and tech- nology on dependent variables all appear to be modest. These small effect sizes are misleading, however. because they are diminished by statistical artifacts. in particular the relatively low reliabilities of the scales used to measure dependent variables (see Table I).
of age, gender and even the quality of local manage- ment on service representatives’ productivity and qual- ity of employment. In terms of quality of employment, working with the computer system rather th.an the mi- crofiche was like working for the top 5 percent of local managers rather than the bottom 5 percent. The power of the technology effect is surprising because the com- puter system itself influenced a restricted area of the representatives’ tasks-the way in which they accessed customer service records-and left many other aspects of their work unchanged.
The Limits on Technological Impact A relatively circumscribed technological cha:nge in a skilled clerical job had major effects on job perform- ance and job quality. While these effects are large com- pared to other factors influencing job performance and quality in this company, they were not monolithic as might be implied by a simple technological impact model. The assumption of monolithic change-that the effects produced by technological innovations are uni- form-was not confirmed by our data. In terms of job performance, the record system made routine work eas- ier, but extraordinary work harder and it made the work of service representatives easier, but that of their supervisors harder.
The basic method for examining the variation in the technological impact on quality of employment was multiple regression analyses that test the statistical in- teraction of the impact of the record system with the control variables used in Table II-respondents’ gender,
232 Communications of the ACM February 1989 Volume 32 Number 2
Articles
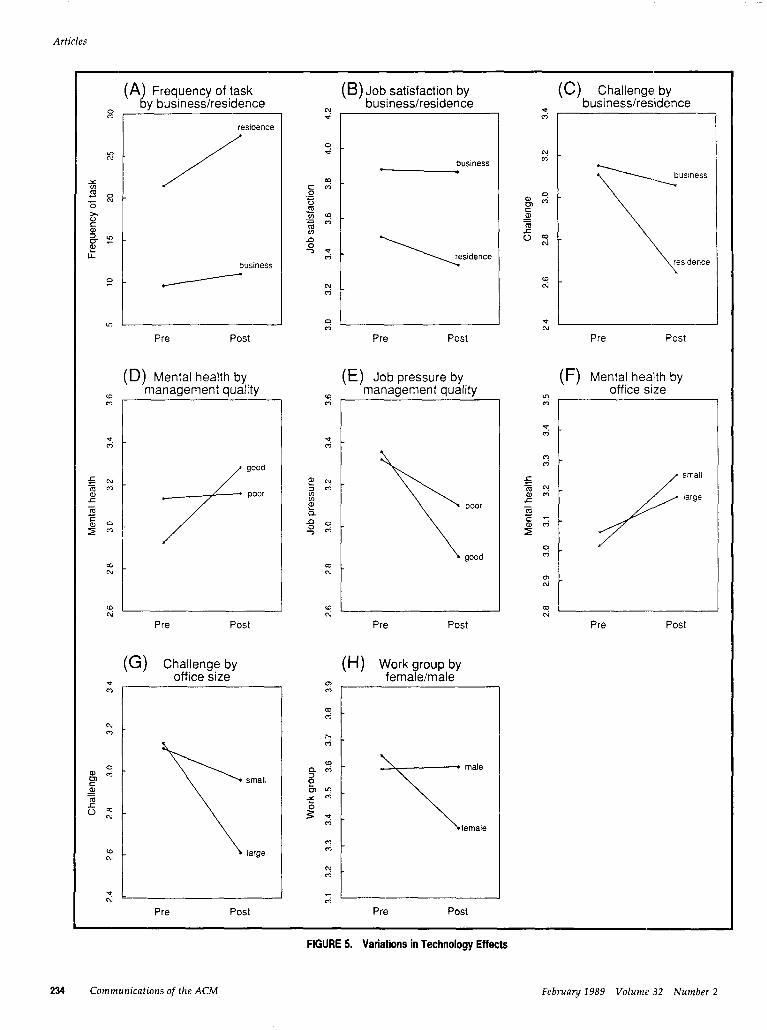
their age, whether they worked in a business or resi- dence office, the quality of their management, the size of their office, and the month in which computerization of their office started. These regression analyses are identical to the ones forming the basis of Table II and use the difference between post-computerization meas- ures and pre-computerization measures as the depend- ent variable and the control variables as independent variables. A statistically significant interaction indicates that the effect attributable to the introduction of the record system differed for different values of the con- trol variables (e.g., the record system had different ef- fect on men and women or on workers in business offices and residential offices). The size of these interac- tions will be reported as @ values in the text. Represent- ative examples are shown in Figure 5.
Office Type Interactions Business and residence offices differed substantially in many facets of work experience. In terms of productiv- ity service representatives in residence offices handled more calls per day (main effect of office-type /3 = 0.56, p < 0.01) and found their work tasks harder (p = 0.32, p < 0.01). In terms of quality of work life, service repre- sentatives in residence offices liked their jobs less (0 = - 0.28, p C O.Ol), had lower quality jobs (p = -0.51, p < O.Ol), had more pressure on the jobs (@ = 0.27, p C O.Ol), poorer mental health (p = -0.31, p C O.Ol), and perceived their management as being of poorer quality (6 = -0.16, p < 0.05). Given these large differences in office culture, one might expect that technology would have different effects in the two types of offices. This expectation is confirmed by the data.
Many of the effects of the computerized record sys- tem depend on whether representatives worked in resi- dence or business offices. In general, both positive and negative effects of the record system were substantially larger for residence offices than for business offices. For example, as Figure 5a shows, the new technology in- creased the frequency with which service representa- tives performed tasks more in the residence than in business offices, (interaction /3 = 0.35, p < 0.01). It also increased the difficulty with which they performed low frequency tasks more in the residence offices (/3 = 0.18,
p < 0.05). Similar interactions exist for quality of work life
measures. Job satisfaction (Figure 5b, /3 = 0.18, p <
0. 05) and overall job quality (/3 = 0.28, p < 0.01) and its components-variety (p = 0.16, p < 0.05), autonomy (/3 = 0.17, p < 0.05), challenge (Figure 5c, p = 0.26, p C O.Ol), and perceived impact (p = 0.16, p < O.lO)- all decreased more for representatives in residence offices. The only exception to the general trend of stronger technology effects in residence offices was that service representatives there reported less improve- ment in the quality of their management (p = -0.15, p < 0.10).
How does one explain these differing effects of identi- cal technology among workers with the same job title in a single company? First, and most simply, service
representatives in business offices used the computer- ized record system about 36 minutes less per day. It was a less integral part of their work responsibilities because they worked more frequently with old or com- plicated billing records that were not available in the computer system. Equally as important, however, serv- ice representatives in the business offices had a gener- ally more professional culture, while those in the resi- dence offices had less autonomy and less flexibility in carrying out their jobs. For example, a representative in a business office who had previously worked in a resi- dence office commented, “I won’t go back over there for anything. You have to ask permission just to go to the bathroom. Over here, they at least realize I’m a professional adult.” As a result, technology had more deterministic impact among service representatives in residence offices.
Management Quality Interactions The interaction analysis also shows that some negative effects of technology were reduced and some positive effects were enhanced in offices with higher quality management. In offices with better managers, technol- ogy decreased job satisfaction less (p = -0.27, p -=z O.lO), and increased mental health more (Figure 5d, fl= 0.34, p < 0.01). It also reduced job pressure more (Figure 5e, p = 0.35, p < O.Ol), decreased positive attitudes toward computers less (/3 = -0.35, p < O.Ol), and increased judgments of the quality of management more (/3 = 0.41, p < 0.01).
Office Sized Interactions In general, larger offices were better places to work than smaller ones; job satisfaction was higher, job vari- ety and challenge was greater, and workers exhibited better mental health. Despite these findings, some nega- tive effects of technology were reduced and some posi- tive effects were enhanced in smaller offices. In smaller offices, technology increased mental health more (Fig- ure 5f; p = 0.36, p < 0.01) and decreased job challenge less (Figure 5g, p = -0.33, p < 0.05). It also made serv- ice representatives more confident about using com- puters (p = 0.30, p < O.Ol), improved their opinions of their management more (/3 = 0.35, p < 0.051, decreased their beliefs that they were ill trained for their jobs less (/3 = -0.32, p <O.lO), and decreased their opinions of computers less (0 = -0.37, p < 0.05).
Individual Difference Interactions In general, the effects of technology did not depend on individual characteristics of the service representatives. We examined interactions with gender and age as well as measures of service representative’s job experience, their self-rated skill on their job, their attitudes toward computers, and their skill with computers. The lack of many reliable interactions suggests that the technology was equally accessible to all service representatives, regardless of age, experience, gender, or prior experi- ence with computers.
Although age had reliable main effects on several
February 1989 Volume 32 Number 2 Communications of the ACM 233
Articles
(C) Challenge by business/residence
I-- --1
(B) Job satisfaction by business/residence
Frequency of task
4 ( y business/residence
I residence
/
s
Pre Post
x business
\esidence business
9 0-I k v) 1 I
Pre Post Pre Post
(F) Mental health by office size
(D) Mental health by
E management quality
I
(E) Job pressure by management quality
poor
good
5 ii! x f 75 E f ;r
R
1 Pre Post Pre Post Pre Post
(G) Chal,lenge by
;Y l-u ri
(H) Work group by female/male
2
m 0
! T male
female
x
Pre
J Post Pre Post
FIGURE 5. Variations in Technology Effects
234 Communications of the ACM February 1989 Volurrx 32 Number 2
measures of job quality and attitudes toward com- puters, it did not-interact with the effects of technology. The failure to find pervasive age interactions is surpris- ing in light of previous research [Zl] suggesting that older individuals have more difficulty learning to use procedurally complex computer systems.
The data show only one reliable gender interaction: technology harms relationship with work group members more for women than for men (Figure 6h, p = -0.15, p < 0.05).
Time of Implementation Interactions The computerized billing system was introduced at dif- ferent times in different offices over a period of seven months. Some of the effects of technological change depended on when the technology was introduced. Im- provements in mental health symptoms were larger for earlier introductions of the technology (p = -0.32, p < 0.01). Larger decreases in job variety (p = -0.18, p < 0.05) and job challenge (p = -0.16, p < O.lO), and smaller decreases in positive attitudes toward com- puters (p = 0.29, p < 0.01) were observed in offices that introduced the technology earlier.
These time differences may simply reflect the statisti- cal artifacts resulting from the unique histories of dif- ference offices during the implementation process. They are difficult to interpret without supplementary interview and observational data because they could be due to a variety of factors: seasonal variations, extra- neous events (e.g., an impending strike) or to changes in the system software/hardware, training procedures, or expectations as a result of the experiences of previous offices. For example, the larger improvements in men- tal health symptoms observed in the first offices are most likely due to the initial anxiety service represent- atives described surrounding the introduction of the new system-would the system work, and could serv- ice representatives use it effectively? Both representa- tives and management in later offices did not have this initial anxiety, because they were informed by the ex- periences of the early users.
ONE WAY CAUSATION Technology, broadly conceived, can have large effects on workers, but the size of these effects and even their direction can depend on the workers’ job categories, the detailed tasks they perform, and the local culture in which they use the technology. In this section we show that not only does technology have effects on workers, but they in turn modify the technology.
The Evolution of the Technological Configuration “Reinvention” is the degree to which an innovation is changed by the adopter in the process of adoption and implementation after its original development [34, 471. Sometimes this happens as users modify the concrete hardware and software product, sometimes as they ap- ply their own, personal procedures to use it, and some- times as they treat it as a symbol of other organizational
Articles
and personal issues. Johnson and Rice [33] examined reinvention in word processing systems, taking a high- level view of how uses of word processing and the services provided by word processing centers changed in 194 organizations.
In the company that we studied, service representa- tives had little direct involvement in the design of the computer software and hardware or the associated or- ganizational and architectural changes. They did, how- ever, have a large role in determining how the soft- ware was actually used. They quickly mastered the procedures defined by the system designers and covered during the training, and immediately set about finding new, improved ways of doing things. Many of these discoveries involved faster ways to traverse an account and to find the information they needed.
However, one innovation, which involved their abil- ity to overlap their work, had more far-reaching conse- quences. The ability to overlap (i.e., perform several tasks simultaneously), once the hallmark of the compe- tent service representative, was less important with the new computerized record system. To continue to exer- cise this skill that the computer had threatened to ren- der obsolete and to perform their jobs more efficiently, service representatives found an innovative way to use a feature of the new system known as “dual screens.” The dual screens feature was originally designed to al- low users to easily switch between two separate cus- tomer databases, one for billing information and an- other for sales information. Service representatives soon figured out, though, that it was possible to log on to the billing database twice, allowing them to switch back and forth between two accounts, either during or between calls. Although originally resisted by manage- ment, this new way of overlapping became so popular that it finally became officially sanctioned.
A second user-designed innovation involved the cre- ation of a clandestine note-passing network within the customer record system. The record system was not designed with electronic mail facilities, and most man- agers supported this decision. Service representatives, however, circumvented this lack of electronic commu- nication by leaving each other personal notes in a field of the database record that was intended for descrip- tions of customers’ problems. Although, supervisors strongly discouraged this practice, they were powerless to prevent it.
The evolution of the utility’s record system mani- fested both changes that fell in line with management’s goals of increased efficiencies and those that reflected service representatives’ interest in maintaining social contact. In our interviews, we found that service repre- sentatives were more likely to experiment and try new ways of using the system when their supervisors en- couraged such behavior, and that certain confident in- dividuals quickly became known as inveterate experi- menters. This supports Johnson and Rice’s findings that reinvention was linked to training, encouragement of experimentation, communication, and participation in other kinds of decision-making [33].
Februa y 1989 Volume 32 Number 2 Communications of the ACM 235
Articles
DISCUSSION Computerization of even a small component of a job can have profound effects on job effectiveness and em- ployment quality, but these effects do not conform to simple models. We have shown that after service repre- sentatives began using a computerized record system, their work lives changed. The changes associated with computerization were as large as any other natural source of variation that we could identify in this set- ting. Moreover, our methods allowed us to conclude with reasonable certainty that the changes we found were the result of technology, broadly conceived, and were not the result of methodological artifacts, preex- isting differences between groups, or extraneous, his- torical factors. We concentrated on solving methodolog- ical problems in establishing the causal impact of technology, because until we can distinguish causal im- pact from methodological artifact, more sophisticated questions about the generality of effects, mediation of effects, and direction of causation cannot be addressed at all.
Some of the changes caused by introducing the cus- tomer record system were those explicitly intended by its designers: the most common parts of the primary users’ jobs became quicker and easier to do. As a result, the technology reduced their job pressure and, sur- prisingly, increased their happiness and mental health. It also made them believe their managers were more competent. These data support arguments that office automation technology, primarily used to increase productivity, can at the same time upgrade jobs [22].
On the other hand, the technology had other effects on quality of work life expected by those who see tech- nology as degrading jobs [ll, 44, 461. The record system made the service representatives’ jobs less satisfying. It deskilled the jobs, both by making them less complex, interesting, and challenging, and by making service representatives’ previous skills and training less rele- vant to a changed work process. The technology de- creased workers’ satisfaction and involvement with their work colleagues. Finally, while having positive productivity effects on the service representatives, it had negative effects on their supervisors.
Although we have shown substantial effects of intro- ducing a new computerized database into an organiza- tion, we have also demonstrated the inadequacy of con- ceptualizing them through a simple technological impact model as illustrated in Figure 1. Technology not only includes computer hardware and software, but also work procedures, management practices, physical/ architectural arrangements, and productivity and qual- ity specifications. We have shown here, for example, that service representatives’ lack of integration with their work groups, an apparent effect of computer tech- nology, was also the result of accompanying changes in procedures and physical surroundings. Similarly, their increased respect for their supervisors was based in part on the supervisors’ demonstration of leadership abilities when their task-specific expertise was threat- ened by the new technology. One must include ele-
ments of this larger technological configuration in models of technological change [36, 401.
We have also shown that the assumption of mono- lithic change, implicit in many technological impact models, is also incorrect. Many of the changes we iden- tified had varying consequences depending upon the setting in which they are introduced. The technology had smaller effects in the business offices with their professional work culture and lower dependlence on standard procedures. In both smaller offices and offices with better management, many negative effects of tech- nology were reduced and positive ones enhanced. Since business offices, smaller offices, and ones with better management all had more flexible work arrangements, these findings are all consistent with the assertion that local flexibility moderates the way technology is used.
At a minimum, the divergent effects of technology we found among service representative are consistent with recent research demonstrating the range of out- comes that can result when information technology is introduced into the work place [3, 4, 5, 6, 15, 26, 271. Our study forcefully shows that identical hardware and software within a single company can have positive effects on one job and negative effects on another, and can even have mixed effects on different aspects of the same job. These data demonstrate the oversimplicity of earlier work portraying office automation in. either starkly negative or positive terms. They are, however, consonant with observations by Mumford [4:2], among others, that unless the quality of working life is explic- itly addressed and advocated in the design of technol- ogy, business and development pressures wi.11 force some degradation of it.
The history of this computer system provided evi- dence that technology effects were not unidirectional: implementors and users modified the technological configuration as it modified their work. A problem with simple technological impact models is their assumption that causality in technological change is one-way: that managers and designers influence technology and both influence workers, but neither is strongly influenced by workers or by the vagaries of the implementation pro- cess. This assumption ignores the extent to which any technological configuration is itself a historical product of social, economic, and political decisions that shape it, and downplays the significance of modifications that occur as it is implemented and used. Automation did not unfold unswervingly from overarching goals, and the nature of the technological configuration itself changed in response to environmental changes, politi- cal demands, and chance circumstances.
Figure 6 illustrates a more complex and we believe more accurate model for technological impact, as we found it in this case study, than does the simple model in Figure 1. Figure 6 extends the simple impact model in three ways: by expanding what one considers the technology to be; by identifying individual a.nd organi- zational contingencies that moderate the impact of technology; and by recognizing the bidirectional nature of technological change.
First, in the revised model, technological change ex-
236 Communications of the ACM February 1989 Volume 32 Number 2
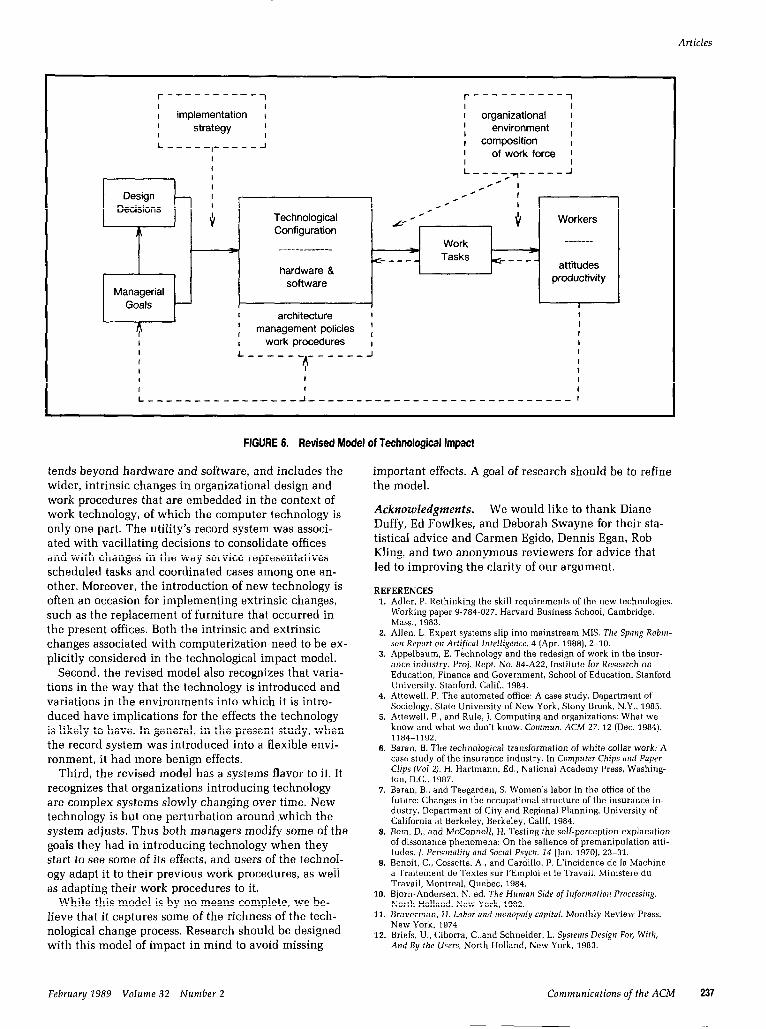
Articles
r----------1 I I I implementation t I ,
strategy I I
L-----,-----J I
l-----------1 I I 1 organizational I I I environment f
I composition I I I
of work force ;
r-7 Managerial Goals
Technological Configuration
M/M A- Workers
_----_ --_
hardware & software
r Work _-___ A
----- Tasks e---- attitudes
productivity
I architecture I
management policies : work procedures I
t L I _------ ,
3 -----J I
1 I I I I , I I L----------------~----------------------------l
FIGURE 6. Revised Model of Technological Impact
tends beyond hardware and software, and includes the wider, intrinsic changes in organizational design and work procedures that are embedded in the context of work technology, of which the computer technology is only one part. The utility’s record system was associ- ated with vacillating decisions to consolidate offices and with changes in the way service representatives scheduled tasks and coordinated cases among one an- other. Moreover, the introduction of new technology is often an occasion for implementing extrinsic changes, such as the replacement of furniture that occurred in the present offices. Both the intrinsic and extrinsic changes associated with computerization need to be ex- plicitly considered in the technological impact model.
Second, the revised model also recognizes that varia- tions in the way that the technology is introduced and variations in the environments into which it is intro- duced have implications for the effects the technology is likely to have. In general, in the present study, when the record system was introduced into a flexible envi- ronment, it had more benign effects.
Third, the revised model has a systems flavor to it. It recognizes that organizations introducing technology are complex systems slowly changing over time. New technology is but one perturbation around .which the system adjusts. Thus both managers modify some of the goals they had in introducing technology when they start to see some of its effects, and users of the technol- ogy adapt it to their previous work procedures, as well as adapting their work procedures to it.
While this model is by no means complete, we be- lieve that it captures some of the richness of the tech- nological change process. Research should be designed with this model of impact in mind to avoid missing
important effects. A goal of research should be to refine the model.
Acknowledgments. We would like to thank Diane Duffy, Ed Fowlkes, and Deborah Swayne for their sta- tistical advice and Carmen Egido, Dennis Egan, Rob Kling, and two anonymous reviewers for advice that led to improving the clarity of our argument.
REFERENCES 1. Adler, P. Rethinking the skill requirements of the new technologies.
Working paper 9-784-027. Harvard Business School, Cambridge. Mass.. 1983.
2. Allen. L. Expert systems slip into mainstream MIS. The Spang Robin- son Report 0)~ Artifical Infelligence, 4 (Apr. 1988), Z-10.
3. Appelbaum, E. Technology and the redesign of work in the insur- ance industry. Proj. Rept. No. 84-AZ, Institute for Research on Education, Finance and Government, School of Education, Stanford University, Stanford. Calif.. 1984.
4. Attewell, P. The automated office: A case study. Department of Sociology, State University of New York. Stony Brook, N.Y.. 1985.
5. Attewell. P., and Rule, J. Computing and organizations: What we know and what we don’t know. Commun. ACM 27,12 (Dec. 1984), 1184-1192.
6. Baran, B. The technological transformation of white collar work: A case study of the insurance industry. In Computer Chips and Paper Clips (vol 2), H. Hartmann, Ed., National Academy Press, Washing- ton, DC., 1987.
7. Baran, B.. and Teegarden, S. Women’s labor in the office of the future: Changes in the occupational structure of the insurance in- dustry. Department of City and Regional Planning, University of California at Berkeley, Berkeley. Calif, 1984.
8. Bern. D., and McConnell, H. Testing the self-perception explanation of dissonance phenomena: On the salience of premanipulation atti- tudes. /. Perso,tality and Social Psych. 14 (]a”. 19701, 23-31.
9. Benoit, C., Cossette. A., and Cardillo, P. L’incidence de la Machine a Traitement de Textes sur I’Emploi et le Travail. Ministere du Travail, Montreal, Quebec, 1984.
10. Bjorn-Andersen. N. ed. The Human Side of Information Processing. North Holland, New York. 1982.
11. Braverman, H. Labor and monopoly capital. Monthly Review Press. New York, 1974
12. Briefs. U., Ciborra, C.,and Schneider, L. Systems Design For, With, And By the Users. North Holland, New York, 1983.
February 1989 Volume 32 Number 2 Communications of the ACM 237
Articles
13. Cammann, C., et al. Assessing the attitudes and perceptions of or- ganizational members. In Assessing Organizafional Change, Seashore, S., et al. Eds.. John Wiley and Sons. New York, 1983, 71-138.
14. Campbell, D. T.. and Stanley, J. C. Experin~enfaf and Quasi-Experimen- fal Designs for Research. Rand McNally & Co.. Chicago, 1966.
15. Center for Career Research and Human Resources Management. Results of the study of the introduction of datapoint terminals. In Compufcr Chips and Paper Clips, Hartmann, H.. Kraut, R.. and Tilly. L.. National Academy Press. Washington, D.C.. 1986.
16. Cole. W. Medical cognitive graphics. In Proceedings of CHl’86: Human
17.
18.
19.
20.
21.
22.
23.
24.
25.
26.
27.
28.
29.
30.
31.
32.
facfors in compufing systems. ACM. New York, pp. 91-95. Cohen, J. and Cohen, P. Applied Mulfiple Regressio,l/Correlafion Analysis for fhe Behavioral Sciences. Lawrence Erlbaum Associates, Hillsdale. N.J.. 1975 Downing, H. Word processors and the oppression of women. In The Microelectronics Revolution. T. Forester, Ed., Basil Blackwell. Pub- lisher, Oxford, England, 1980. Driscoll, J. Office automation: The dynamics of a technological boon- doggle. Paper presented at the International Office Automation Symposium. Stanford University. Stanford, Calif.. 1980. Dubnoff, S. Inter-occupational shifts and changes in the quality of work in the American economy, 1900-1970. Paper presented at the annual meeting of the Society for the Study of Social Problems. San Francisco Calif., 1978. Egan. D. E., and Gomez, L. M. (1985). Assaying, isolating, and accom- modating individual differences in learning a complex skill. In Indi- vidual Differences in Cognition, Vol. 2. Academic Press. New York, 173.-217. Giuiiano, V. E. The mechanization of office work. Sci. Amer. 247, 2 (Sept. 1982). 66-76. Glenn. E., and Feldberg, R. (1977). Degraded and deskilled: The proletarianization of clerical work. Sot. Prob. 25 (1977), pp. 52-64. Gove, W. R., and Geerken. M. R. The effect of children and employ- ment on the mental health of married men and women. Sot. Forces 56 (Sept.). 66-76. Nussbaum. K.. and Gregory. J. Race qaiosf fime: Aufomafion of the office. Working Women’s Education Fund. Cleveland, Ohio, 1982. Gurstein. IM.. and Faulkner. F. Office automation and organizational culture: A case study of two implementations of an automatic call distributor. In Compufer mld SociefJf Conference (Rochester. N.Y.. June 2.1). 1985. Hartmann, H., Kraut, R.E.. and Tilly. L. Computer Chips and Paper
Clip::: Technology and Women’s Employmenf. National Academy Press, Washington. D.C., 1986. Herman, G. Cusfomer Access Issues in Business Office Specialization. Memorandum for file X381-791112.OlMF. Bell Laboratories, Murray Hill, N.J., 1979. Herman, G.. Owens. K.. and Schottland, H. Service representative questionnaire study. Tech. Memo. 79-3431-2. Bell Laboratories, Murray Hill. N.J.. 1979. [rving. R. H., Higgins, C. A., and Safayeni, F. R. (1986). Computerized performance monitoring systems: Use and abuse. Commun. ACM 29, 8 (Aug. 1986). 794-801. lay. T. Defining and measuring computerphobia. In Trends in Ergo- nomics/Human Facfors lI..R. E. Eberts and C. G. Eberts. Eds.. North Holland, New York. 1985, 321-326. lohnson, B., et al. Innovation in office systems implementation. Re- port No. 8110791, National Science Foundation, Washington, D.C., 1985.
33. Johnson, B., and Rice. R. Reinvention in the innovation process. In The New Media: Communication, Research, and Technology, R. Rice, Ed. Sage Publications, Beverly Hills, Calif., 157-184.
34. Johnson, B.. and Rice, R. Managing Organizafional Imrovafion. Colum- bia University Press. New York, N.Y.. 1987.
35. Kling. R. Automated welfare client-tracking and service integration: The political economy of computing. Commun. ACM 22, 6 (June 1978). 484-493.
36. Kling, R., and Scacchi, W. The web of computing: Computer tech- nology as social organization. Advances in Computers 21 (1982). l-90.
37. Koch. S. The Political Negotiated Order of Computer Implementa- tion Planning. Doctoral dissertation, Department of Speech Commu- nication. University of Texas at Austin, 1985.
38. Locke. E. The nature and causes of job satisfaction. In Handbook of Irldusfrial avd Organiznfional Psychology, M.Dunnette. Ed.. Rand McNally College Publishing Company, Chicago, 1976
39. March, J. Ambiguify and choice in organizafions. Universitetsforlaget, Bergen, Norway, 1976.
40. Markus, M.L. Power. politics, and MIS implementation. Commun. ACM 26. 6 (1983). 430-444.
41. Mowshowitz, A.. Ed. Human choice and compufers. North Holland, New York. 1980.
42. Mumford, E. Values, technology and work. Martinus Nijhoff Publish- ers. The Hague. The Netherlands, 1981.
43.
44.
45.
46.
47.
48.
49.
50. 51.
52.
53.
Murphree. M. C. Brave new office: The changing world of the legal secretary. In My froubles are going to have trouble with me: Everyday frials and triumphs of women workers, K. !jacks and D. Remy. Eds., Rutgers University Press, New Brunswick, N.J., 1984 9-to-5, The National Association of Working Women. The 9-fo-5 Na- fional Survey on Women and Stress fwifh Office Aufomorion Addendum). Cleveland, Ohio, 1984. Nisbett, R.. and Wilson. T. Telling more than WC can know: Verbal reports on mental processes. Psych. Rev. 84. 3 (May 1!)77), 231-259. Nussbaum K., and Gregory, J. Race against time: Aufomafion of fhe office. Working Women Education Fund, Cleveland, Ohio. 1980. Rice, R.. and Rogers. E. Reinvention in the innovation process. Knowledge: Creation, Diffusion, and Ufilizafion, 1, (198C), 499-514. Poppel, H. Who needs the office of the future? Hawa,~d Bus. Rev. 60 (Nov-Dec. 1982), 146-155. Slack. J. Communicafion fechnologies and sociefy. Abler., Norwood, N.J.. 1984. Spinrad. R. J. Office automation. Science, 215 (1982). 808-813. Turner, J. Computer mediated work: The interplay between tech- nology and structured jobs. Commun. ACM 27, 12 (Dec. 1984). 1210-1217. U.S. National Commission on Technology, Automaticn. and Eco- nomic Progress. The employment impact of technological change: technology and the American economic progress. Report of the U.S. National Commission on Technology, Automation, and Economic Progress, Volume 1, Serial No. O-788-561, U.S. Government Printing Office, Washington, DC., 1966. Zuboff. S. In fhe age of the smarf machine. Basic Books, New York, N.Y., 1988.
CR Categories and Subject Descriptors: H.1.2 [Information Systems]: Models and Principles-user/machine systems: K.4.2 [Ccqputers and So- ciety]: Social Issues-employment
General Terms: Human Factors Additional Key Words and Phrases: Productivity
ABOUT THE AUTHORS:
ROBERT E. KRAUT is a Distinguished Member of the Techni- cal Staff at Bellcore, where he manages the Interpersonal Com- munications Research Group. His research has concentrated on social aspects of current and future information. technolo- gies, including the interplay of office automation technology and quality of employment, the implications of home-based employment for women and other workers, and the communi- cation needs of collaborating scientists. Author’s present ad- dress: Bellcore, 445 South Street, Morristown, NJ 07960-1910.
SUSAN T. DUMAIS is a member of technical staff at Bellcore in the Cognitive Sciences Research Group. Her research is con- cerned with the general issue of improving human interactions with computers. In addition to her work on the impact of new computer technologies on productivity and quality of worklife, she is involved in research on using scaling and connectionist network techniques to improve computer-based information retrieval, and on the utility of spatial metaphors in information retrieval. Author’s present address: Bellcore, 445 South Street, Morristown, NJ 07960-1910.
SUSAN KOCH is a policy analyst in the Communication and Information Program, Office of Technology Assessment, US. Congress. She was previously a post-doctoral fellow at Bellcore, where the work for this article was done. Her re- search interests include social aspects of communications technology and the interplay between technology and public policy. Author’s present address: Office of Technology Assess- ment, US. Congress, Washington, DC 20510.
Permission to copy without fee all or part of this material is granted provided that the copies are not made or distributed for direct commer- cial advantage. the ACM copyright notice and the title of the publication and its date appear, and notice is given that copying is by permission of the Association for Computing Machinery. To copy otherwise. or to republish, requires a fee and/or specific permission.
238 Communications of the ACM Februay 1989 Volume 32 Number 2