Embed Size (px)
Citation preview
3Com Corporation
Jay Zager, Executive Vice President, CFO
"Computers, Communication and Compatibility""Computers, Communication and Compatibility"
3Com Corporate Overview – 2
Safe Harbor Statement
This presentation contains forward-looking statements made pursuant to the safe harbor provisions of the Private Securities Litigation Reform Act of 1995. These include forward-looking statements regarding: business strategies and growth opportunities, Huawei, TippingPoint, desired long-term financial model and integration savings. These statements are neither promises nor guarantees, but involve risks and uncertainties that could cause actual results to differ materially from the forward-looking statements. These risks include, without limitation, our ability to successfully execute our strategies and the other risks detailed in the Company’s SEC filings, including the Form 10-K for the fiscal year ended May 30, 2008. In this presentation we will also discuss several non-GAAP financial measures. The most directly comparable GAAP measure and the required reconciliation can be found on the IR portion of our website, www.3com.com. The non-GAAP measures exclude restructuring, amortization, IPR&D and stock-based compensation charges. In addition, they exclude certain special items management believes are unusual and outside of the on-going operations of the company (such as the purchase accounting and bonuses triggered by our H3C acquisition, goodwill impairments and certain one-time write-offs).
The forward-looking statements reflect beliefs, estimates and predictions as of today, and 3Com Corporation does not intend, and disclaims any obligation, to update such statements. Nothing in this presentation shall be deemed to create a warranty of any kind, including implied warranties. 3Com, the 3Com logo and TippingPoint are registered trademarks and H3C is a trademark of 3Com Corporation or its wholly-owned subsidiaries. All other company and product names may be trademarks of their respective holders.
3Com Corporate Overview – 3
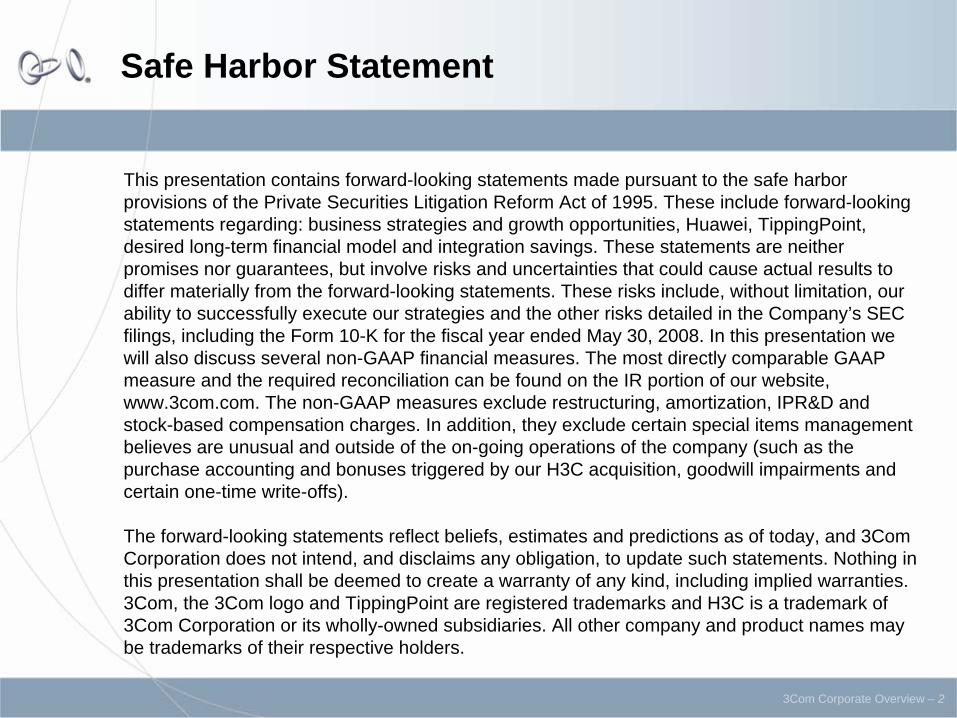
3Com Overview
›
Founded in 1979›
80 locations; 30 countries ›
6,100+ employees worldwide ―
2400+ engineers›
1,400+ U.S. patents; ~400 foreign patents; 180 Chinese patents›
New experienced management team
ChinaHangzhouLAT
Miami
EMEA Hemel, UK
APR Singapore
WW HQMarlboro

3Com Corporate Overview – 4
Investment Highlights
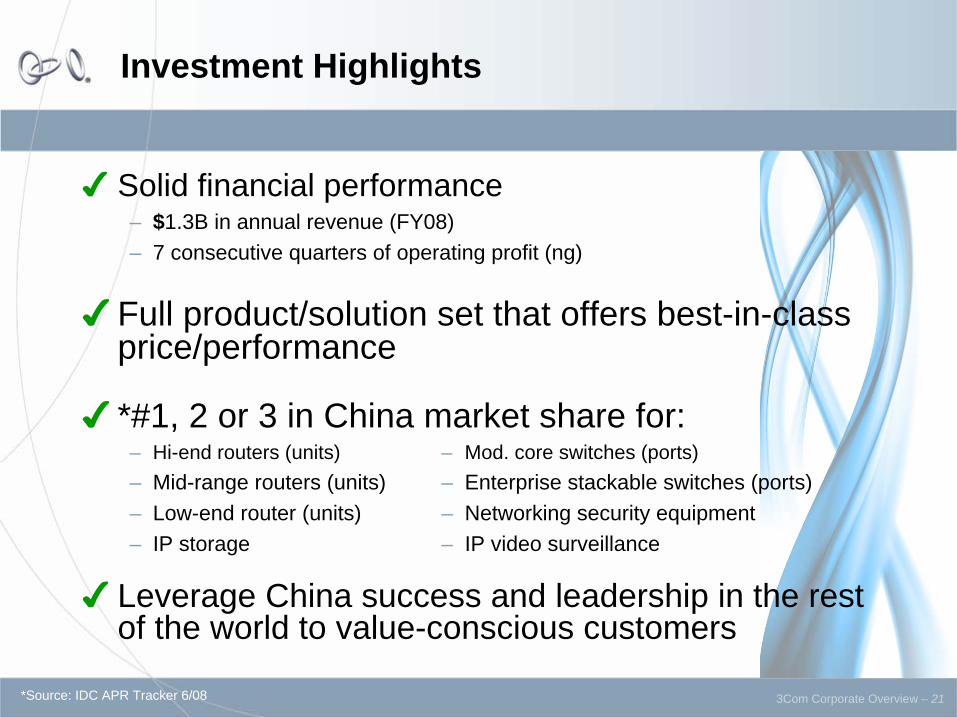
✔
Solid financial performance– $1.3B in annual revenue (FY08)– 7 consecutive quarters of operating profit (ng)
✔ Full product/solution set that offers best-in-class price/performance
✔ *#1, 2 or 3 in China market share for:– Hi-end routers (units) – Mod. core switches (ports)– Mid-range routers (units) – Enterprise stackable switches (ports) – Low-end router (units) – Networking security equipment– IP storage – IP video surveillance
✔ Leverage China success and leadership in the rest of the world to value-conscious customers
*Source: IDC APR Tracker 6/08
3Com Corporate Overview – 5
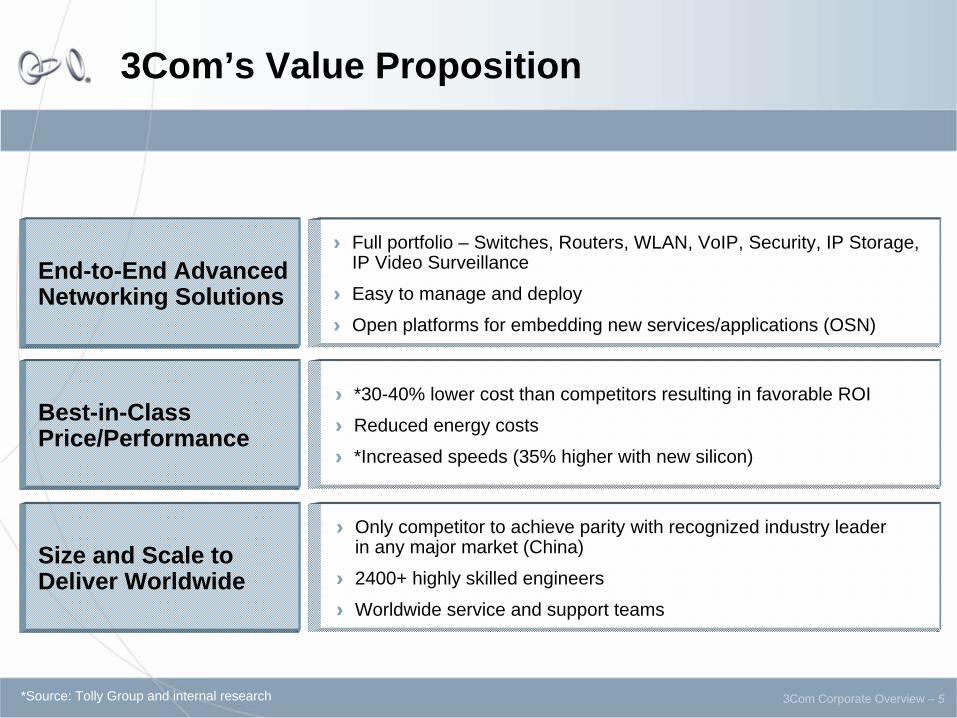
3Com’s Value Proposition
End-to-End Advanced Networking Solutions
Best-in-Class Price/Performance
Size and Scale to Deliver Worldwide
›
Full portfolio – Switches, Routers, WLAN, VoIP, Security, IP Storage, IP Video Surveillance
›
Easy to manage and deploy
›
Open platforms for embedding new services/applications (OSN)
›
*30-40% lower cost than competitors resulting in favorable ROI
›
Reduced energy costs
›
*Increased speeds (35% higher with new silicon)
›
Only competitor to achieve parity with recognized industry leader in any major market (China)
›
2400+ highly skilled engineers
›
Worldwide service and support teams
*Source: Tolly Group and internal research
3Com Corporate Overview – 63Com Corporate Overview – 6
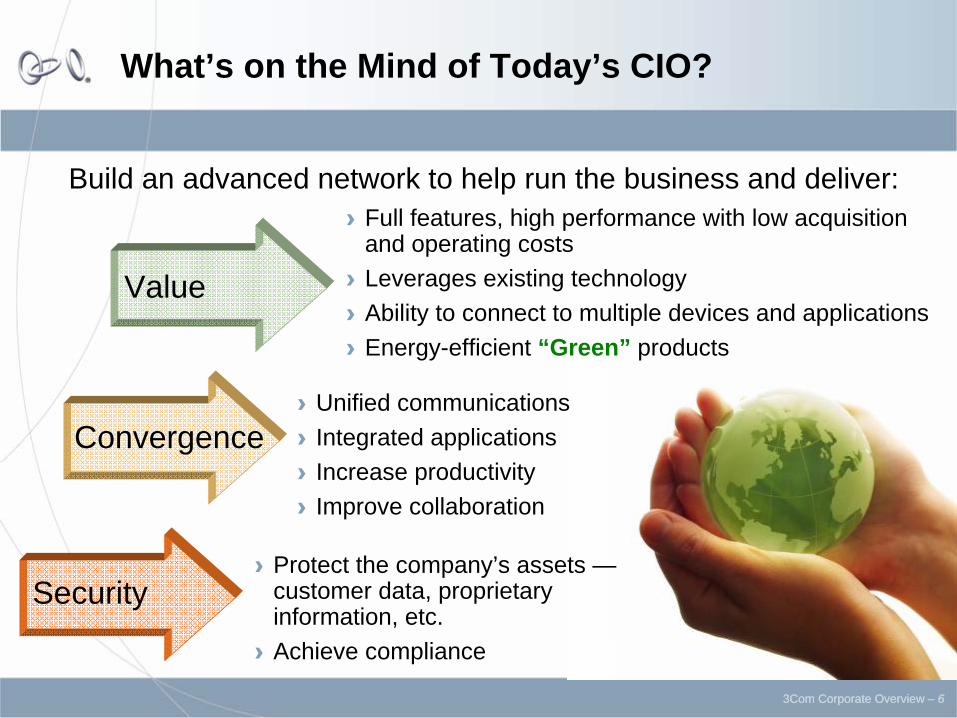
What’s on the Mind of Today’s CIO?
Security
Convergence
Value
›
Protect the company’s assets — customer data, proprietary information, etc.
›
Achieve compliance
›
Unified communications›
Integrated applications›
Increase productivity›
Improve collaboration
›
Full features, high performance with low acquisition and operating costs
›
Leverages existing technology›
Ability to connect to multiple devices and applications›
Energy-efficient “Green” products
Build an advanced network to help run the business and deliver:
3Com Corporate Overview – 7
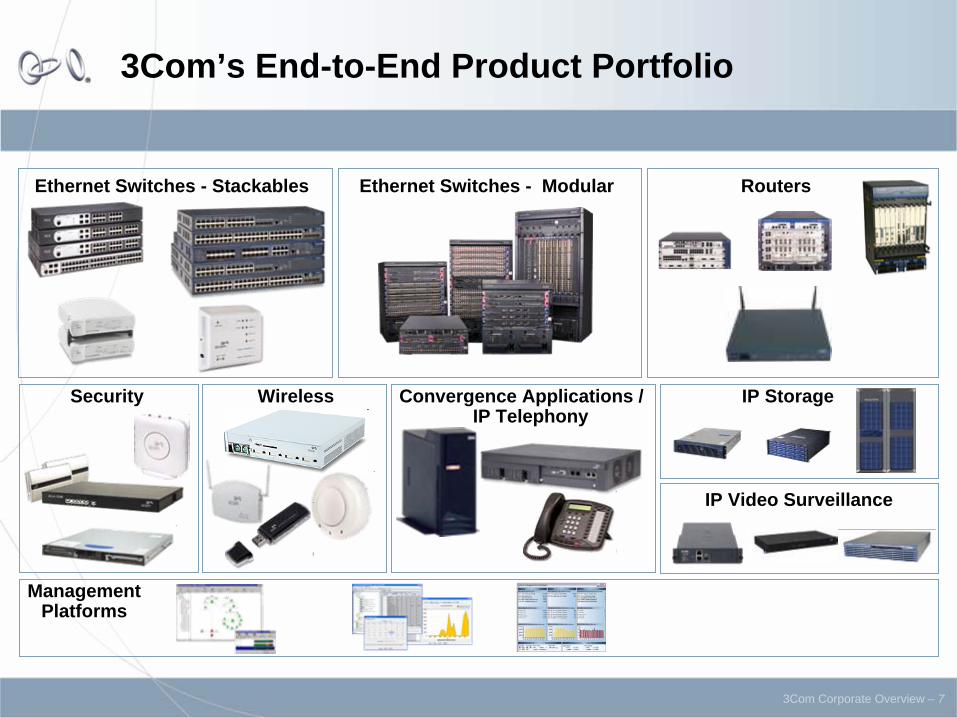
3Com’s End-to-End Product Portfolio
Ethernet Switches - Stackables
Security Convergence Applications / IP Telephony
IP StorageWireless
Management Platforms
Ethernet Switches - Modular
IP Video Surveillance
Routers
3Com Corporate Overview – 8
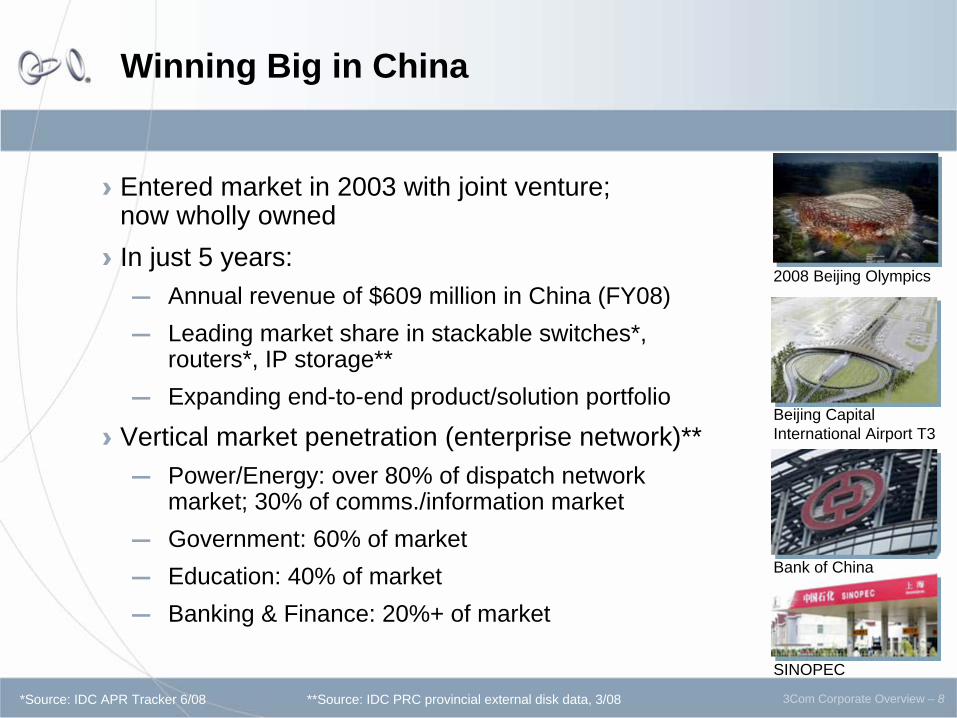
Winning Big in China
›
Entered market in 2003 with joint venture; now wholly owned ›
In just 5 years:―
Annual revenue of $609 million in China (FY08) ―
Leading market share in stackable switches*, routers*, IP storage**
―
Expanding end-to-end product/solution portfolio
›
Vertical market penetration (enterprise network)**―
Power/Energy: over 80% of dispatch network market; 30% of comms./information market
―
Government: 60% of market―
Education: 40% of market―
Banking & Finance: 20%+ of market
Beijing Capital International Airport T3
Bank of China
2008 Beijing Olympics
SINOPEC
*Source: IDC APR Tracker 6/08 **Source: IDC PRC provincial external disk data, 3/08
3Com Corporate Overview – 9
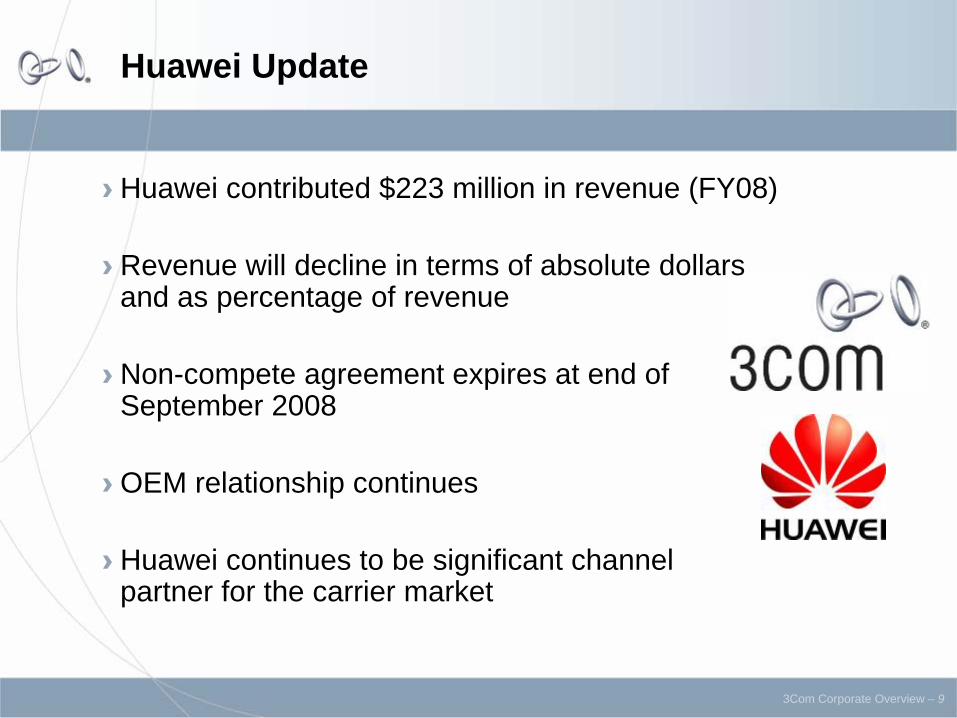
Huawei Update
›
Huawei contributed $223 million in revenue (FY08)
›
Revenue will decline in terms of absolute dollars and as percentage of revenue
›
Non-compete agreement expires at end of September 2008
›
OEM relationship continues
›
Huawei continues to be significant channel partner for the carrier market
3Com Corporate Overview – 10
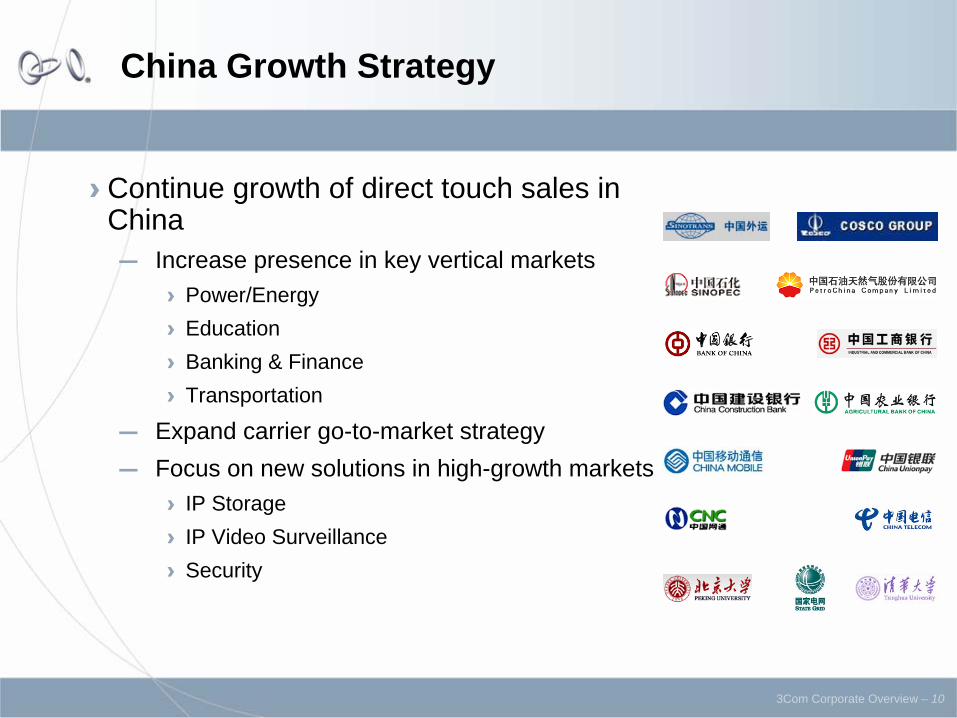
China Growth Strategy
›
Continue growth of direct touch sales in China ―
Increase presence in key vertical markets›
Power/Energy›
Education›
Banking & Finance›
Transportation
―
Expand carrier go-to-market strategy―
Focus on new solutions in high-growth markets›
IP Storage›
IP Video Surveillance›
Security
3Com Corporate Overview – 11
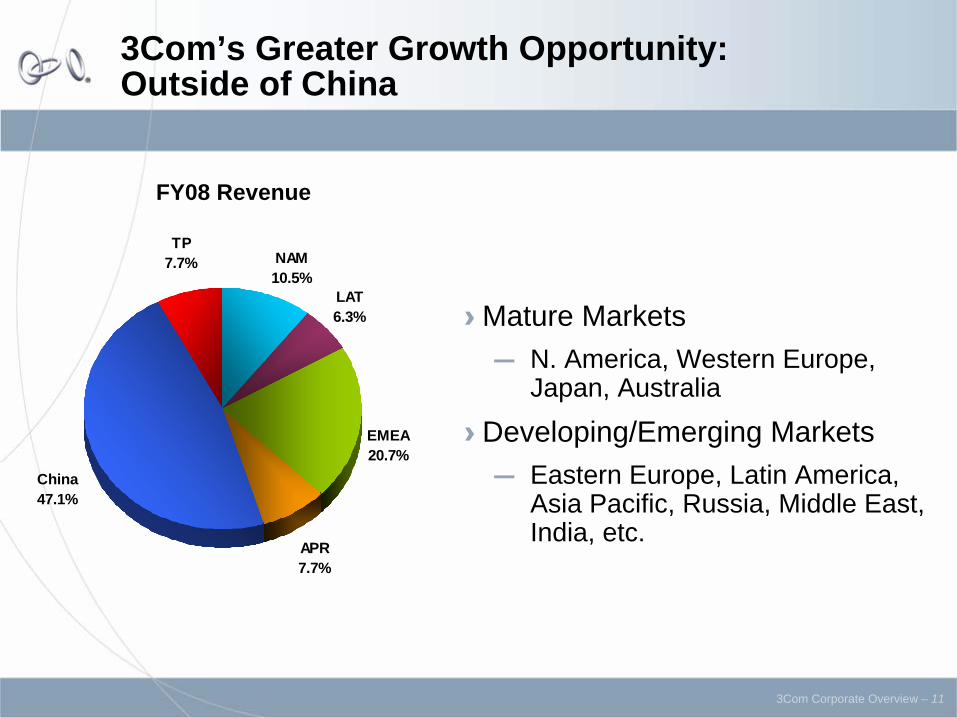
3Com’s Greater Growth Opportunity: Outside of China
EMEA20.7%
APR7.7%
LAT6.3%
NAM10.5%
China47.1%
TP7.7%
FY08 Revenue
›
Mature Markets―
N. America, Western Europe, Japan, Australia
›
Developing/Emerging Markets―
Eastern Europe, Latin America, Asia Pacific, Russia, Middle East, India, etc.
3Com Corporate Overview – 123Com Corporate Overview – 12
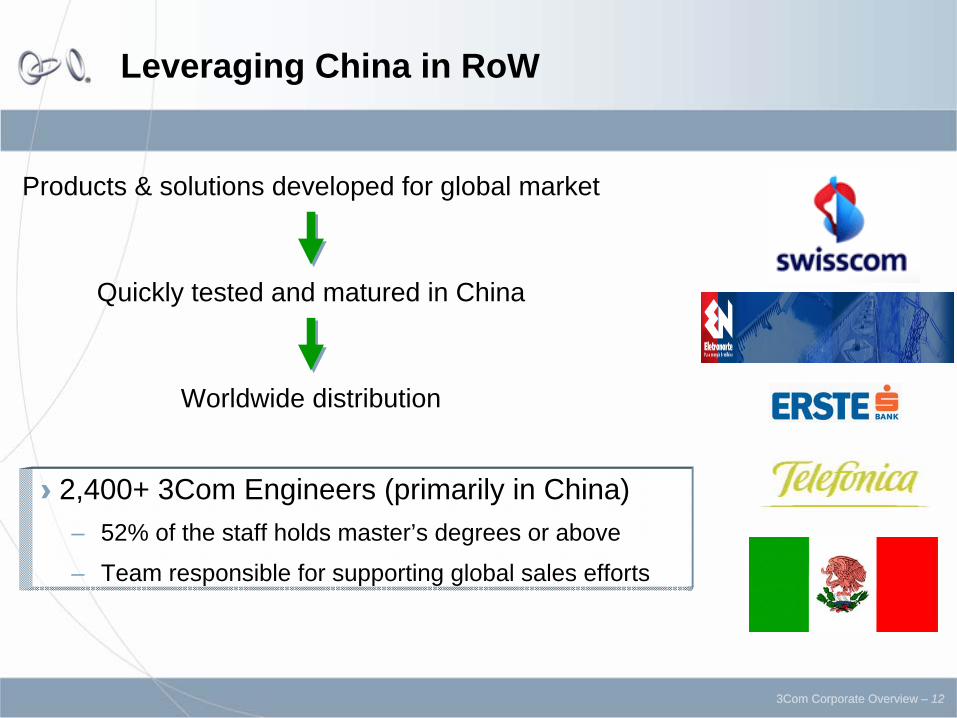
Leveraging China in RoW
Products & solutions developed for global market
Quickly tested and matured in China
Worldwide distribution
›
2,400+ 3Com Engineers (primarily in China)– 52% of the staff holds master’s degrees or above
– Team responsible for supporting global sales efforts
3Com Corporate Overview – 133Com Corporate Overview – 13
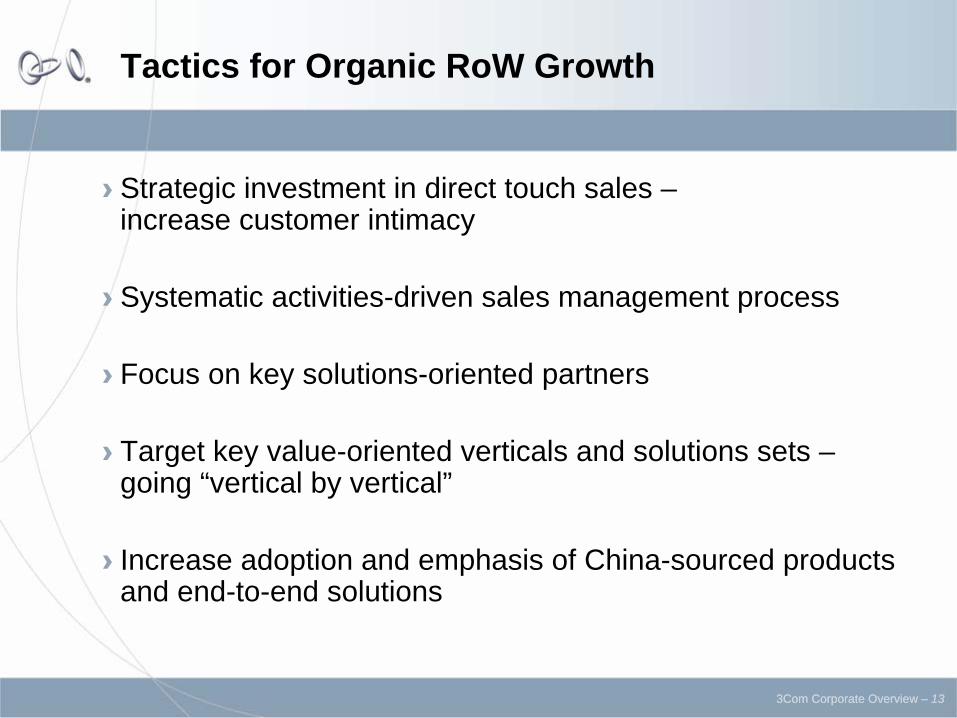
Tactics for Organic RoW Growth
›
Strategic investment in direct touch sales – increase customer intimacy
›
Systematic activities-driven sales management process
›
Focus on key solutions-oriented partners
›
Target key value-oriented verticals and solutions sets – going “vertical by vertical”
›
Increase adoption and emphasis of China-sourced products and end-to-end solutions
3Com Corporate Overview – 14
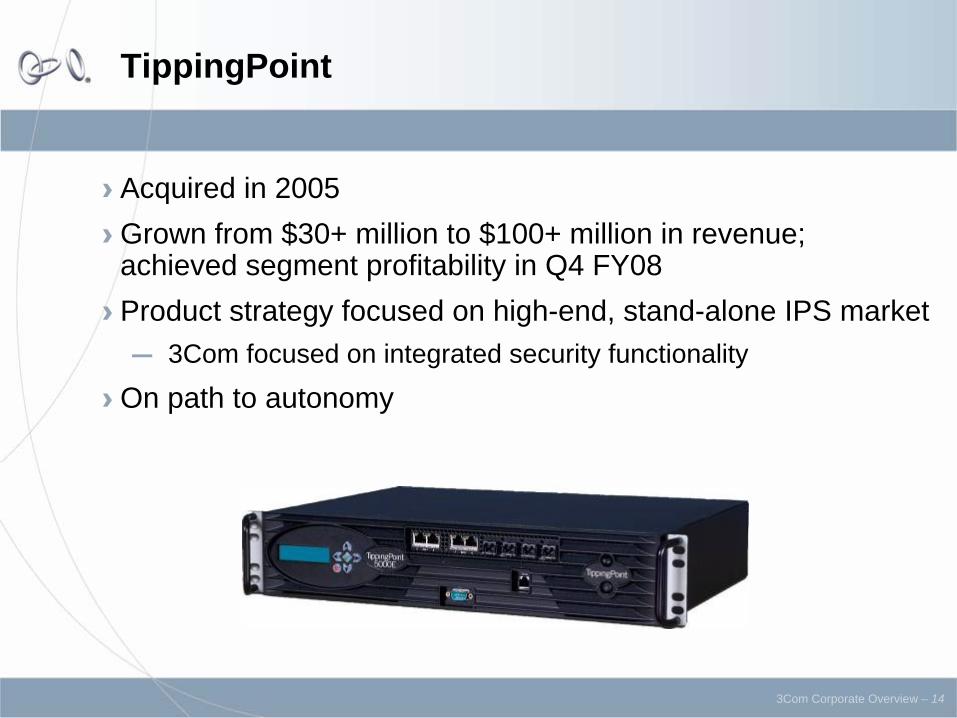
TippingPoint
›
Acquired in 2005›
Grown from $30+ million to $100+ million in revenue; achieved segment profitability in Q4 FY08›
Product strategy focused on high-end, stand-alone IPS market ―
3Com focused on integrated security functionality
›
On path to autonomy
Financial Overview
3Com Corporate Overview – 16
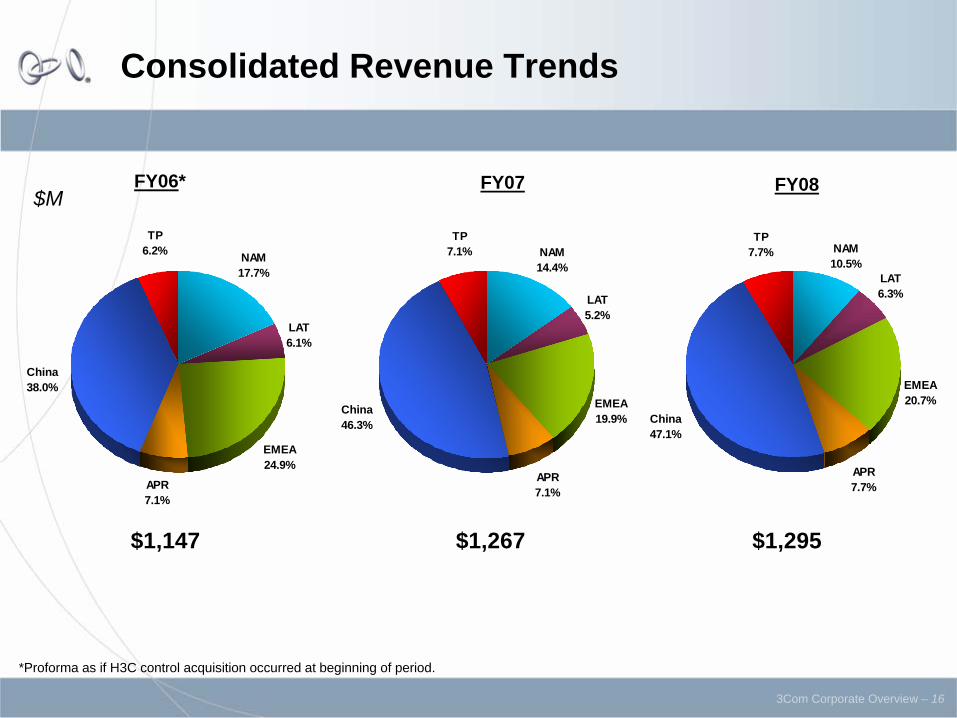
Consolidated Revenue Trends
FY06* FY07 FY08
$1,147 $1,267 $1,295
$M
*Proforma as if H3C control acquisition occurred at beginning of period.
EMEA20.7%
APR7.7%
LAT6.3%
NAM10.5%
China47.1%
TP7.7%
EMEA19.9%
APR7.1%
TP7.1%
China46.3%
NAM14.4%
LAT5.2%
EMEA24.9%
APR7.1%
LAT6.1%
NAM17.7%
China38.0%
TP6.2%
3Com Corporate Overview – 17
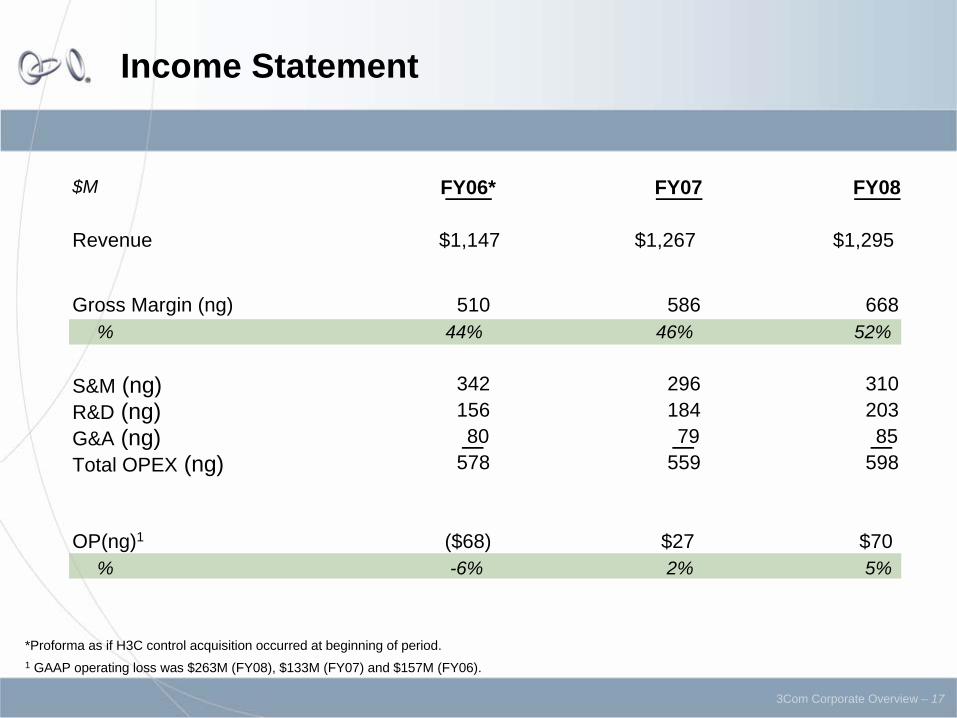
Income Statement
*Proforma as if H3C control acquisition occurred at beginning of period.1 GAAP operating loss was $263M (FY08), $133M (FY07) and $157M (FY06).
$M FY06* FY07 FY08
Revenue $1,147 $1,267 $1,295
Gross Margin (ng) 510 586 668% 44% 46% 52%
S&M (ng) 342 296 310R&D (ng) 156 184 203G&A (ng) 80 79 85Total OPEX (ng) 578 559 598
OP(ng)1 ($68) $27 $70% -6% 2% 5%
3Com Corporate Overview – 18
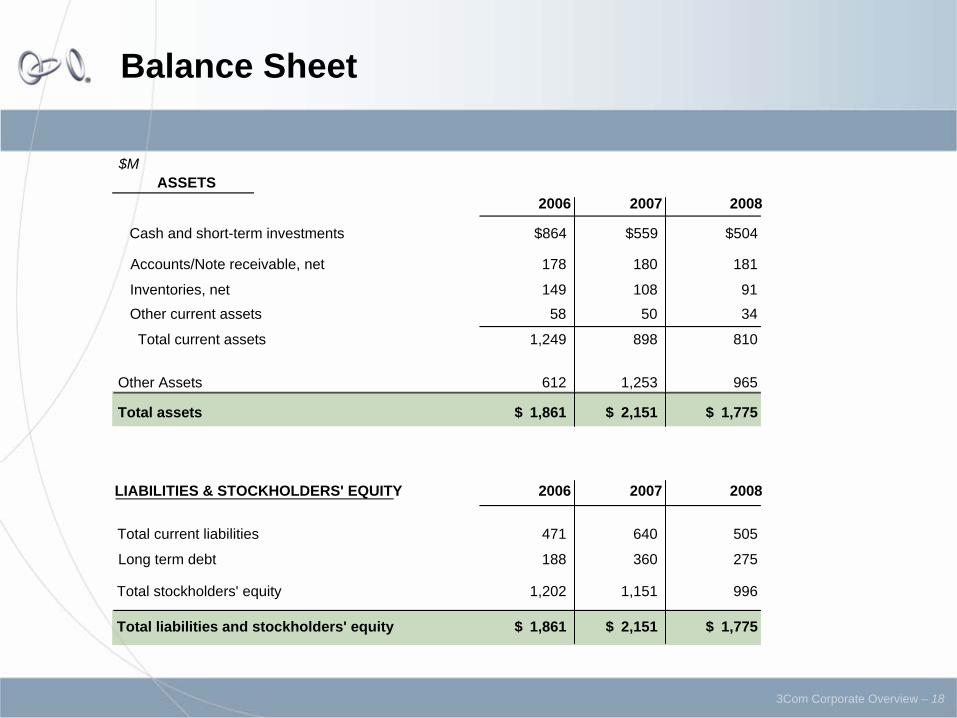
Balance Sheet
$MASSETS
2006 2007 2008
Cash and short-term investments $864 $559 $504
Accounts/Note receivable, net 178 180 181
Inventories, net 149 108 91Other current assets 58 50 34
Total current assets 1,249 898 810
Other Assets 612 1,253 965
Total assets $ 1,861 $ 2,151 $ 1,775
LIABILITIES & STOCKHOLDERS' EQUITY 2006 2007 2008
Total current liabilities 471 640 505
Long term debt 188 360 275
Total stockholders' equity 1,202 1,151 996
Total liabilities and stockholders' equity $ 1,861 $ 2,151 $ 1,775
3Com Corporate Overview – 19
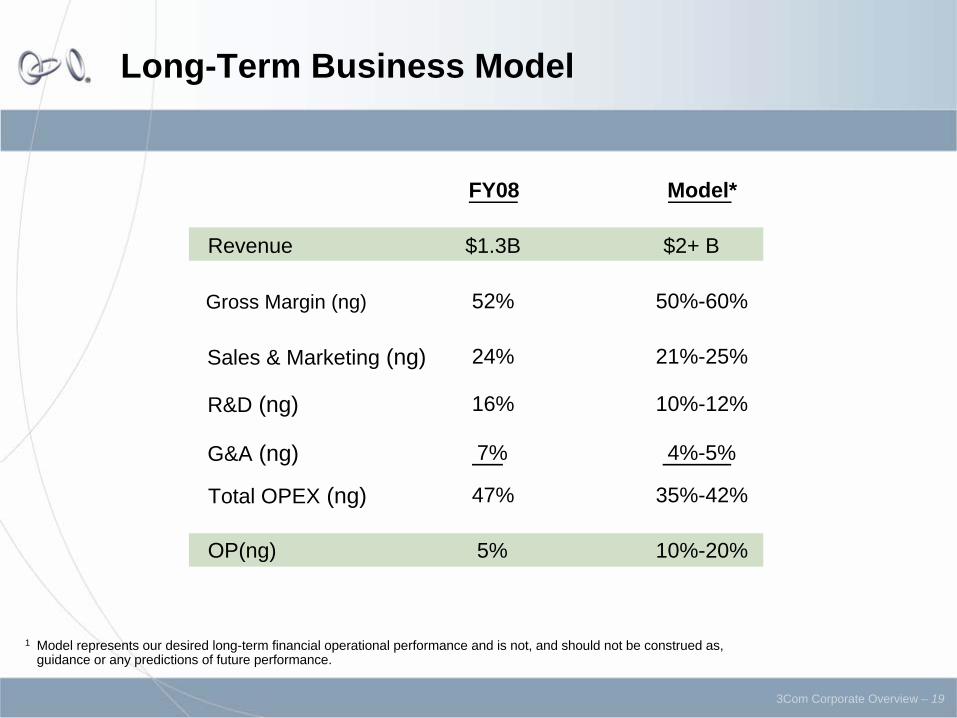
Long-Term Business Model
FY08 Model*
Revenue $1.3B $2+ B
Gross Margin (ng) 52% 50%-60%
Sales & Marketing (ng) 24% 21%-25%
R&D (ng) 16% 10%-12%
G&A (ng) 7% 4%-5%
Total OPEX (ng) 47% 35%-42%
OP(ng) 5% 10%-20%
1 Model represents our desired long-term financial operational performance and is not, and should not be construed as, guidance or any predictions of future performance.
3Com Corporate Overview – 20
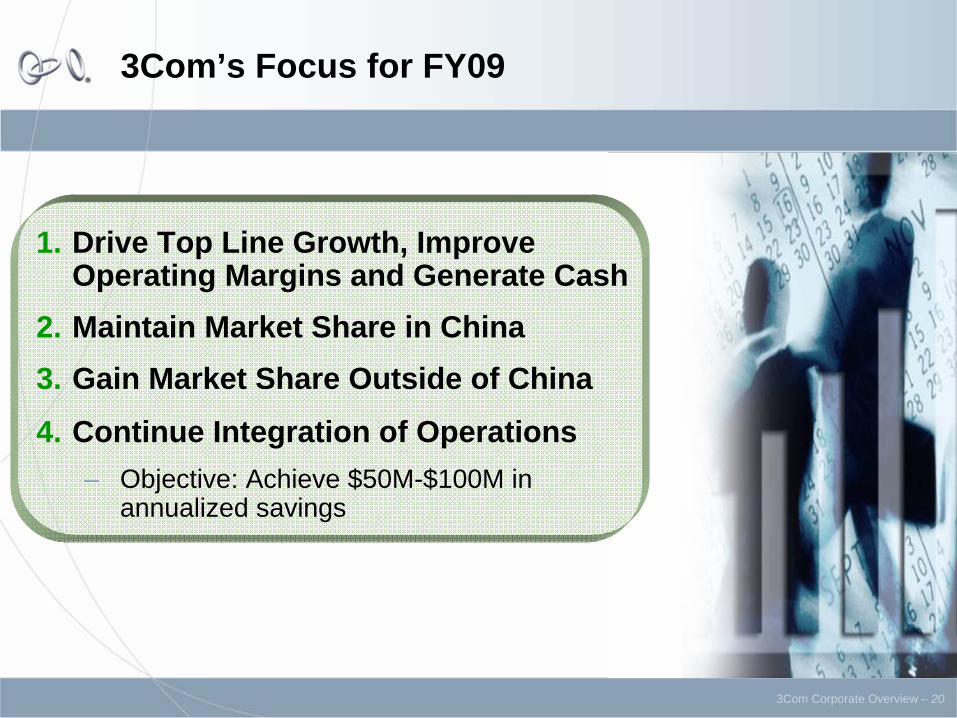
3Com’s Focus for FY09
1. Drive Top Line Growth, Improve Operating Margins and Generate Cash
2. Maintain Market Share in China3. Gain Market Share Outside of China
4. Continue Integration of Operations– Objective: Achieve $50M-$100M in
annualized savings
3Com Corporate Overview – 21
Investment Highlights
✔
Solid financial performance– $1.3B in annual revenue (FY08)– 7 consecutive quarters of operating profit (ng)
✔ Full product/solution set that offers best-in-class price/performance
✔ *#1, 2 or 3 in China market share for:– Hi-end routers (units) – Mod. core switches (ports)– Mid-range routers (units) – Enterprise stackable switches (ports) – Low-end router (units) – Networking security equipment– IP storage – IP video surveillance
✔ Leverage China success and leadership in the rest of the world to value-conscious customers
*Source: IDC APR Tracker 6/08
Thank You