Embed Size (px)
Citation preview

Co
mp
utersh
are | AN
NU
AL
RE
PO
RT
| 2018

This financial report covers the consolidated entity consisting of Computershare Limited and its controlled entities.
The financial report is presented in United States dollars (USD), unless otherwise stated.
Computershare Limited is a company limited by shares, incorporated and domiciled in Australia. Its registered office and principal place of business is:
Computershare Limited Yarra Falls 452 Johnston Street, Abbotsford Victoria 3067 Australia
The financial report was authorised for issue by the directors on 17 September 2018. The company has the power to amend and reissue the financial report.
A separate notice of meeting including a proxy form is enclosed with this financial report.
CONTENTS*
OVERVIEWFinancial highlights and financial calendar 3
Chairman’s Report 4
CEO’s Report 5
Computershare at a glance 7
Key financial metrics 9
Growth 11
Profitability 13
Capital Management 14
Corporate Responsibility 15
People 19
Group Operating Overview 21
Business Strategies and Prospects 23
GOVERNANCECorporate Governance Statement 25
Directors’ Report 38
Auditor’s Independence Declaration 55
FINANCIALSConsolidated Statement of Comprehensive Income 56
Consolidated Statement of Financial Position 57
Consolidated Statement of Changes in Equity 58
Consolidated Cash Flow Statement 59
Notes to the Consolidated Financial Statements 60
REPORTSDirectors’ Declaration 106
Declaration to the Board of Directors 107
Independent Auditor’s Report 108
FURTHER INFORMATIONShareholder information 114
Corporate directory 115
* The Chairman’s Report, Chief Executive Officer’s Report, Group Operating Overview and Business Strategies and Prospects comprise our Operating and Financial Review (OFR) and form part of the Directors’ Report.
3 Computershare Annual Report 2018
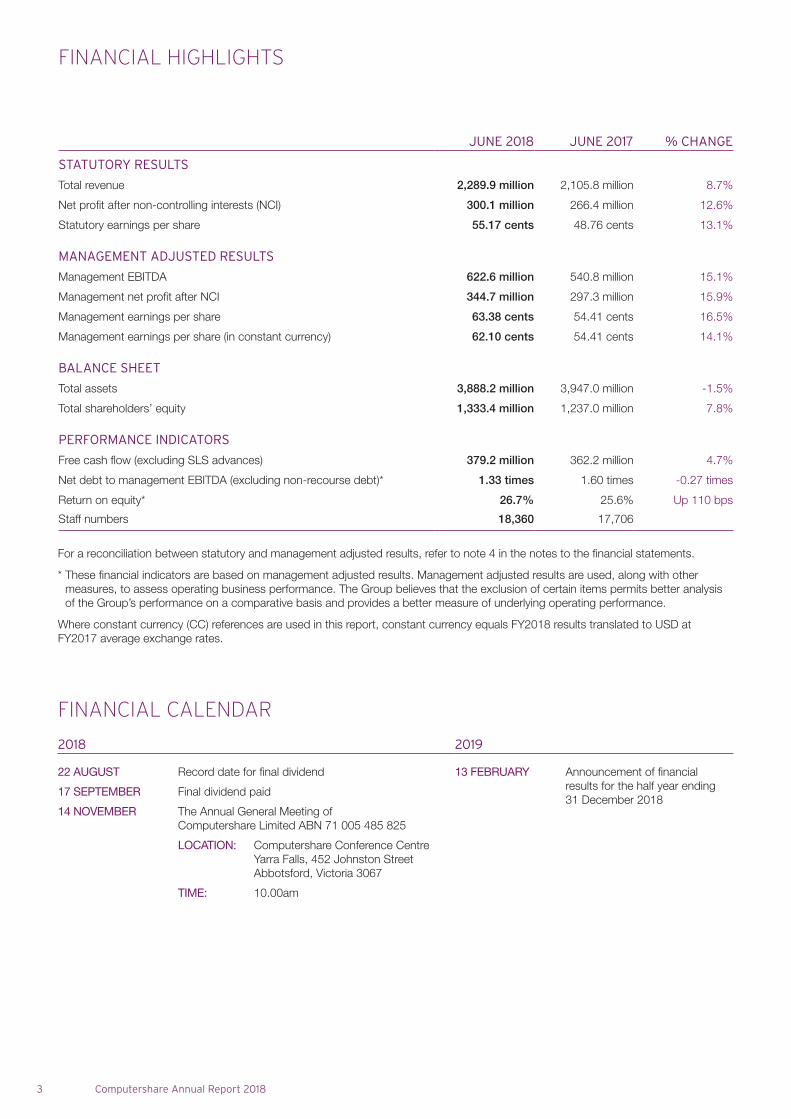
FINANCIAL HIGHLIGHTS
JUNE 2018 JUNE 2017 % CHANGE
STATUTORY RESULTS
Total revenue 2,289.9 million 2,105.8 million 8.7%
Net profit after non-controlling interests (NCI) 300.1 million 266.4 million 12.6%
Statutory earnings per share 55.17 cents 48.76 cents 13.1%
MANAGEMENT ADJUSTED RESULTS
Management EBITDA 622.6 million 540.8 million 15.1%
Management net profit after NCI 344.7 million 297.3 million 15.9%
Management earnings per share 63.38 cents 54.41 cents 16.5%
Management earnings per share (in constant currency) 62.10 cents 54.41 cents 14.1%
BALANCE SHEET
Total assets 3,888.2 million 3,947.0 million -1.5%
Total shareholders’ equity 1,333.4 million 1,237.0 million 7.8%
PERFORMANCE INDICATORS
Free cash flow (excluding SLS advances) 379.2 million 362.2 million 4.7%
Net debt to management EBITDA (excluding non-recourse debt)* 1.33 times 1.60 times -0.27 times
Return on equity* 26.7% 25.6% Up 110 bps
Staff numbers 18,360 17,706
For a reconciliation between statutory and management adjusted results, refer to note 4 in the notes to the financial statements.
* These financial indicators are based on management adjusted results. Management adjusted results are used, along with other measures, to assess operating business performance. The Group believes that the exclusion of certain items permits better analysis of the Group’s performance on a comparative basis and provides a better measure of underlying operating performance.
Where constant currency (CC) references are used in this report, constant currency equals FY2018 results translated to USD at FY2017 average exchange rates.
FINANCIAL CALENDAR
2018 2019
22 AUGUST Record date for final dividend
17 SEPTEMBER Final dividend paid
14 NOVEMBER The Annual General Meeting of Computershare Limited ABN 71 005 485 825
LOCATION: Computershare Conference CentreYarra Falls, 452 Johnston StreetAbbotsford, Victoria 3067
TIME: 10.00am
13 FEBRUARY Announcement of financial results for the half year ending 31 December 2018
4
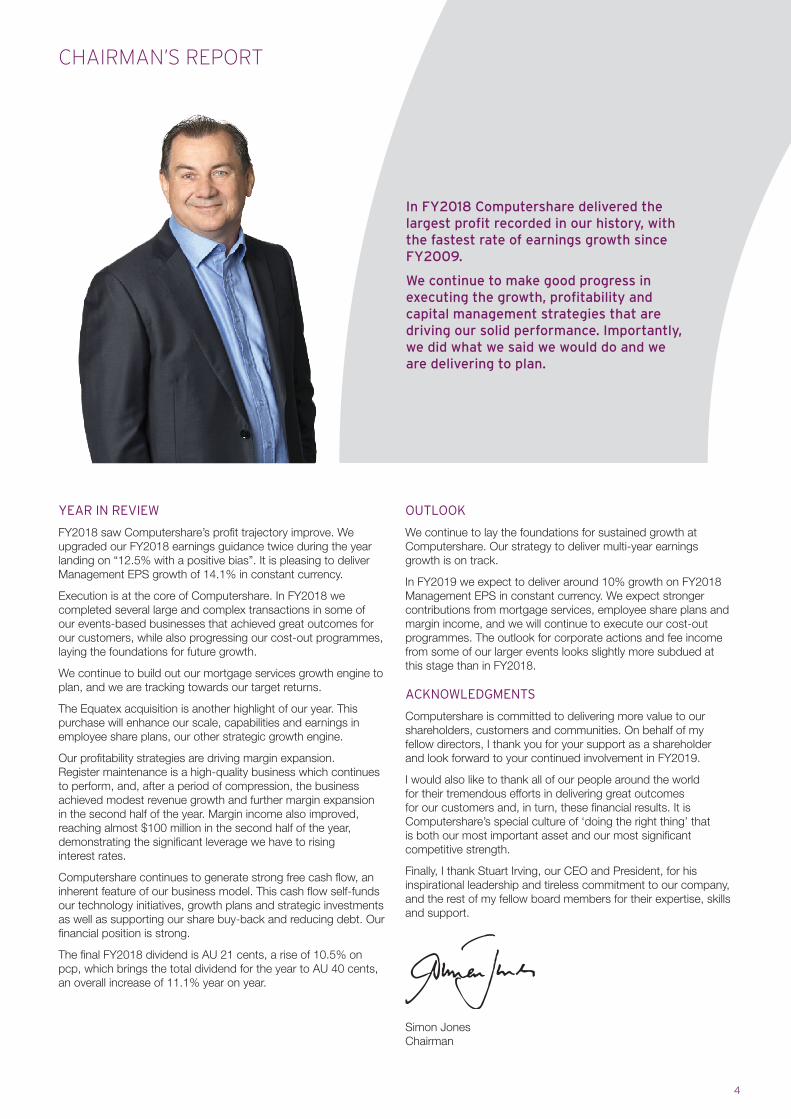
CHAIRMAN’S REPORT
YEAR IN REVIEW
FY2018 saw Computershare’s profit trajectory improve. We upgraded our FY2018 earnings guidance twice during the year landing on “12.5% with a positive bias”. It is pleasing to deliver Management EPS growth of 14.1% in constant currency.
Execution is at the core of Computershare. In FY2018 we completed several large and complex transactions in some of our events-based businesses that achieved great outcomes for our customers, while also progressing our cost-out programmes, laying the foundations for future growth.
We continue to build out our mortgage services growth engine to plan, and we are tracking towards our target returns.
The Equatex acquisition is another highlight of our year. This purchase will enhance our scale, capabilities and earnings in employee share plans, our other strategic growth engine.
Our profitability strategies are driving margin expansion. Register maintenance is a high-quality business which continues to perform, and, after a period of compression, the business achieved modest revenue growth and further margin expansion in the second half of the year. Margin income also improved, reaching almost $100 million in the second half of the year, demonstrating the significant leverage we have to rising interest rates.
Computershare continues to generate strong free cash flow, an inherent feature of our business model. This cash flow self-funds our technology initiatives, growth plans and strategic investments as well as supporting our share buy-back and reducing debt. Our financial position is strong.
The final FY2018 dividend is AU 21 cents, a rise of 10.5% on pcp, which brings the total dividend for the year to AU 40 cents, an overall increase of 11.1% year on year.
OUTLOOK
We continue to lay the foundations for sustained growth at Computershare. Our strategy to deliver multi-year earnings growth is on track.
In FY2019 we expect to deliver around 10% growth on FY2018 Management EPS in constant currency. We expect stronger contributions from mortgage services, employee share plans and margin income, and we will continue to execute our cost-out programmes. The outlook for corporate actions and fee income from some of our larger events looks slightly more subdued at this stage than in FY2018.
ACKNOWLEDGMENTS
Computershare is committed to delivering more value to our shareholders, customers and communities. On behalf of my fellow directors, I thank you for your support as a shareholder and look forward to your continued involvement in FY2019.
I would also like to thank all of our people around the world for their tremendous efforts in delivering great outcomes for our customers and, in turn, these financial results. It is Computershare’s special culture of ‘doing the right thing’ that is both our most important asset and our most significant competitive strength.
Finally, I thank Stuart Irving, our CEO and President, for his inspirational leadership and tireless commitment to our company, and the rest of my fellow board members for their expertise, skills and support.
Simon Jones Chairman
In FY2018 Computershare delivered the largest profit recorded in our history, with the fastest rate of earnings growth since FY2009.
We continue to make good progress in executing the growth, profitability and capital management strategies that are driving our solid performance. Importantly, we did what we said we would do and we are delivering to plan.
5 Computershare Annual Report 2018
CEO’S REPORT*
In FY2018, revenue was up by 6.3%.
EPS came in at 62.10 cents, an increase of 14.1%.
EBITDA was $609.7 million, an increase of 12.7%.
EBITDA margins expanded by 150 basis points to 27.1%.
Free cash flow was $379.2 million, up 4.7%.
The debt leverage ratio fell to 1.33x as our balance sheet continues to self-improve.
Importantly, as an indication of the quality of our results and capital light growth, Return on Invested Capital (ROIC) increased by 270 basis points to 18.2%.
FY2018 – LAYING THE FOUNDATIONS FOR SUSTAINED GROWTH AND RETURNS
In FY2018, while we delivered solid results, we also continued to lay the foundations for sustained growth and returns. Our ongoing commitment to enhancing our customer offerings, investing in technology, building scale in our core businesses, and strengthening our competitive advantage, underpins our confidence that we can deliver strong results for shareholders. Computershare is becoming more profitable, predictable and transparent. We are optimistic about our outlook.
Growth
Looking at our FY2018 results first, total management revenue increased by an impressive $133.7 million, with contributions from our growth engines, cyclical improvements and increases in event based activity, particularly in the first half.
Business services is now our largest business stream by some distance and accounts for almost 40% of total revenues. Within this, mortgage services revenues increased by 9.9% to $546.2 million. US mortgage services revenues broke through $300 million, up 19%, and UK mortgage services revenues were stable at $240.1 million. This is a good result given the UK book is largely in run-off mode prior to new loan volumes driving growth.
In US mortgage services we are well into our five-year plan and making good progress, with returns tracking to targets. We are building out our revenue model across the mortgage value chain, capturing more margin and driving scale in servicing volumes.
In the US, unpaid principal balances increased by over 35% to $81 billion. Capital light subservicing unpaid principal balances increased by 200% and, pleasingly, our high margin ancillary fees (not related to the underlying servicing) increased by 14.5% and now contribute 28% of the revenue mix.
Our other strategic growth engine is employee share plans where we are excited about the Equatex acquisition, our first significant acquisition since 2011. Equatex is an excellent geographic fit with our existing European share plans business. It enhances our scale, technology and customer offering, and strengthens our competitive advantage. The transaction is expected to close this calendar year, and we are ready to implement our detailed integration plan to deliver $30 million per annum in cost synergy benefits over 36 months.
Class actions administration, another one of our structural growth engines, also performed well in the period, with the number of class actions growing steadily over time. With our cross border capabilities and strong execution track record, we are well placed to administer large actions and grow our market share.
* All references to Management Results in the CEO’s report are in constant currency unless otherwise stated
I am pleased to report that the disciplined execution of our purposefully designed growth, profitability and capital management strategies is delivering solid results. While our FY2018 results are the largest reported earnings at Computershare, they are not peak results. Put simply, there is more to come.
6
Profitability
Our profitability strategies are driving margin expansion. It is encouraging to see operating leverage coming through. Group EBITDA margins increased to 27.1%, an increase of 150 basis points. Register maintenance and corporate actions, our most profitable business stream, also delivered improved margins.
It was encouraging to see register maintenance return to organic revenue growth in the second half, with margins continuing to expand. Whilst this revenue growth was aided by increasing margin income, renewals and new business wins were also an important factor globally.
Margin income, up 28.9%, clearly assisted the overall performance. Margin income improved in business services, register maintenance and corporate actions, where balances are predominantly held in the US and Canada. Margin income in employee share plans fell slightly on the back of lower achieved deposit returns in the UK.
Our cash balances that are exposed to interest rate changes increased to $11.4 billion, up 11.8%. This demonstrates our significant leverage to rising interest rates.
Management EBITDA (excluding margin income) also increased to $434.1 million, up 7.3%. It is pleasing to note that the margin grew as well, up to 20.9%, continuing our multi-year track record.
We saw improvements in some of our events-based businesses, particularly in the first half of the year, which also helped our results. We completed several major transactions concurrently, successfully leveraging our platforms, infrastructure and expertise. We purposefully maintain these platforms and infrastructure to enable our clients to execute large transactions and achieve important governance outcomes. This is another aspect of the optionality inherent in CPU that converted to profitability in the period.
We are executing well on our cost-out programmes, which also assisted our results across the Group. This discipline also supports our margin expansion. In FY2018 we achieved a further $35.7 million of gross benefits compared to FY2017. In April we announced Stage 3 of our cost management programme, representing an additional $40-$55 million of gross savings. Across all three stages we expect to be able to take out between $125-$155 million in total gross savings.
Our cost of sales increased at a lesser rate than our overall revenue growth rate, given the improved revenue mix, with greater contributions from corporate actions and margin income. Importantly, fixed personnel costs increased by a manageable 2.3%. This shows we are disciplined in controlling costs and the benefit of our cost management programmes.
Capital management
Our capital management strategies are also enhancing our earnings. We manage our capital as carefully as our operations and it was pleasing to see our post-tax ROIC increase from 15.5% to 18.2%.
We generated free cash flow of $379.2 million in the year and with this made strategic investments, bought back shares, paid higher dividends and reduced our net debt. Having funded these initiatives, our leverage ratio continued to fall, down to 1.33x. Our balance sheet continues to improve organically.
We have extended the duration of our debt facilities to strengthen our balance sheet. The average debt maturity was extended to 2.8 years at the balance date. In July, we repaid $235 million of US Private Placement debt by accessing longer-term debt, to extend our duration further to over three years.
We have ample debt headroom to complete the Equatex acquisition. Post completion we expect the leverage ratio to rise to around 2.0x which is still well within our neutral target range of a 1.75 – 2.25x ratio of net debt to EBITDA.
FY2019 OUTLOOK – DELIVERING SUSTAINED RETURNS
There are good reasons to be optimistic about our outlook. We have declared a fully franked final dividend of AU 21 cents per share. We have also formalised our dividend policy, which is to pay out 40-60% of Management NPAT subject to our cash requirement and leverage ratio, and to continue to maximise the franking available to shareholders.
We are laying foundations for sustained growth and returns into the future. We will continue to build our self-funded growth engines. Our US mortgage services business has clear scope for growth. While we are considered in our approach, we can grow this business carefully for many years to come.
Our share plans business enjoys structural growth and latent earnings power. Our acquisition of Equatex will multiply that.
Our strategic plan to reinvigorate our registry business to organic growth is gathering pace. It is a business that continues to perform well and remains an ‘unsung hero’ in the Group.
Our cost-out programmes are ongoing, and we will see the contribution from all three stages in FY2019.
Margin income should continue to rise next year. As you’ve seen, we are well positioned to capture the benefits of rising rates.
Our conservative balance sheet positions us well to complement our organic growth trajectory should suitable inorganic opportunities arise.
Given this optimistic outlook, our guidance at this early stage of the financial year is for FY2019 Management EPS to increase by around 10% on FY2018 in constant currency terms.
I’d also like to make clear that we absolutely respect the primacy of shareholders. We greatly appreciate all the interest and support you have shown us as we build the new, simpler, transparent and more profitable Computershare.
It’s also worth noting again that underlying the numbers in this annual report is our most important asset – our people. I would very much like to thank all of my colleagues at Computershare around the world who have worked so hard to deliver these results while laying the foundations for our future. Whichever Computershare office I travel to, I’m always impressed by our people’s focus on delivering high-quality outcomes for our clients and their customers.
Above all, we are proud of Computershare’s special culture. Every day we strive to ‘do the right thing’ to deliver exceptional service to our customers. That culture is more important to us than any single set of results, however pleasing.
We look forward to delivering further growth and increased profitability in FY2019 and beyond.
Stuart Irving Chief Executive Officer and President
New JerseyNew York
Boston
MontrealToronto
BarcelonaParis
Manila
RotterdamLondon
Crossflatts Doxford
Copenhagen
SkiptonDublin
Bristol
Jersey
Madrid
Turin
Edinburgh Stockholm
MumbaiBahrain
HyderabadBangalore
Johannesburg
Chennai
Kolkata
Beijing
Hong KongDelhi
MaroochydoreBrisbane
Auckland
CalgaryVancouver
San FranciscoLos Angeles
Sydney
Melbourne
Adelaide
Perth
Phoenix
Monaghan
Louisville
ChicagoDenver
Munich
Frankfurt
RomeMilan
Olten
7 Computershare Annual Report 2018
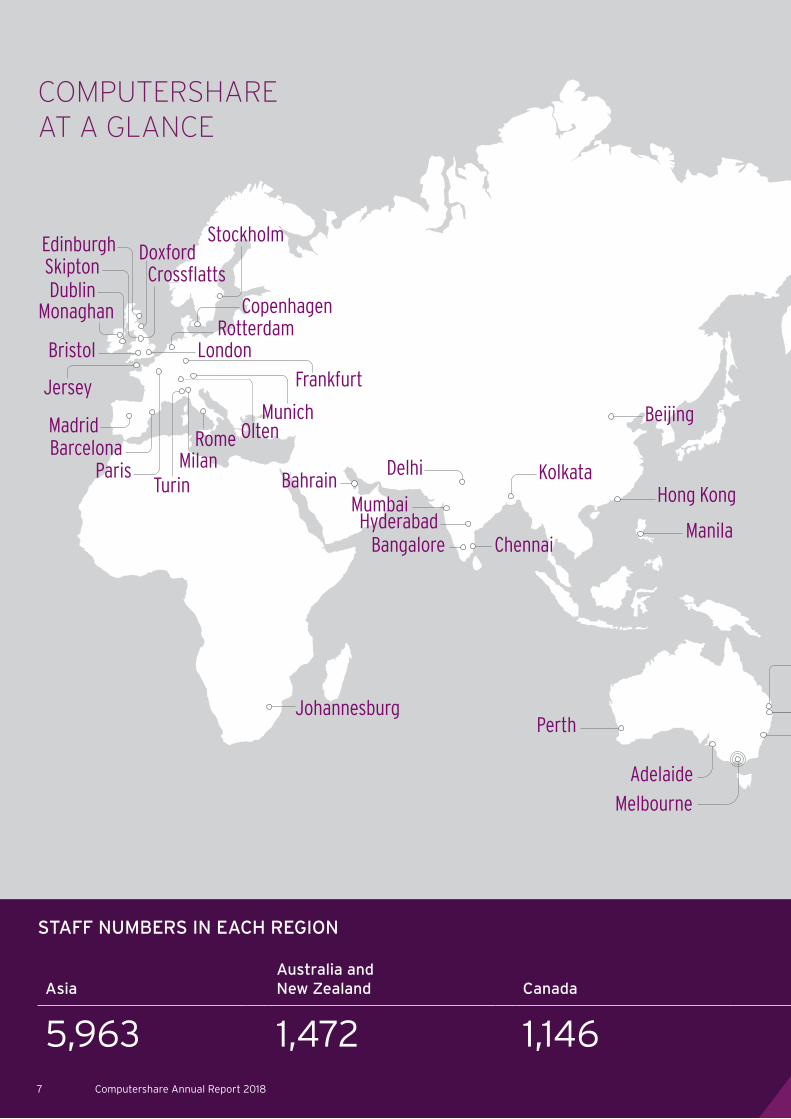
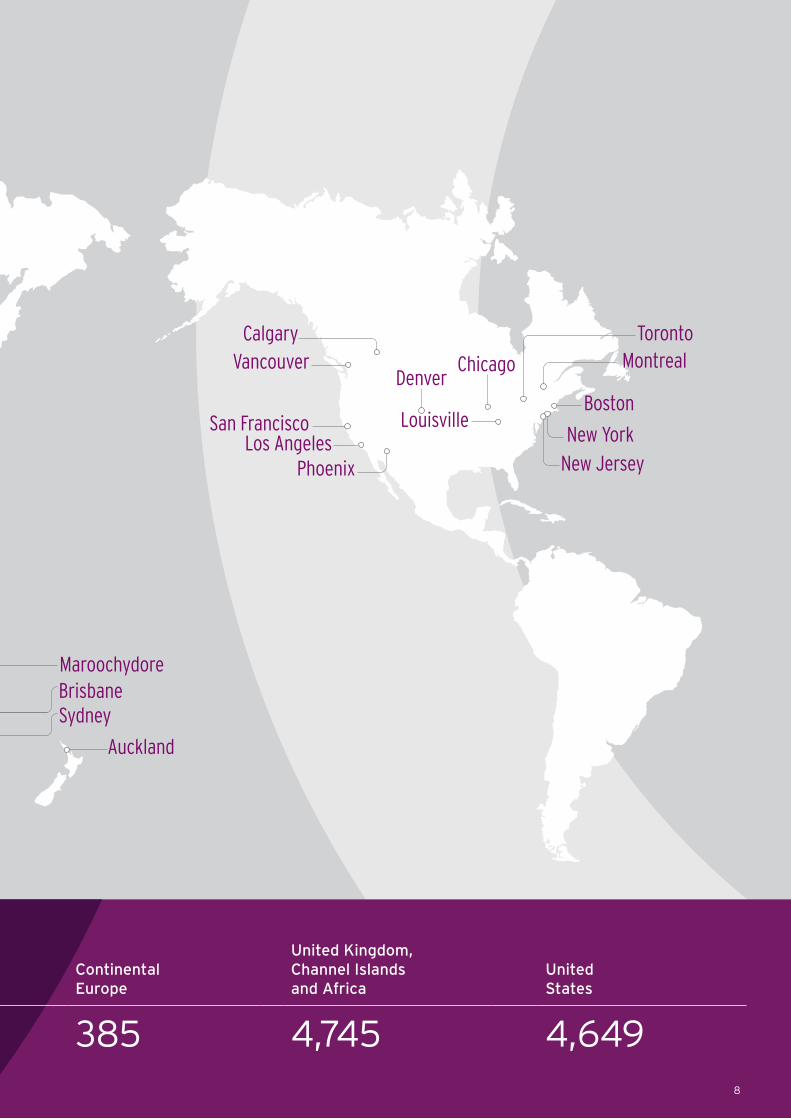
COMPUTERSHARE AT A GLANCE
STAFF NUMBERS IN EACH REGION
AsiaAustralia and New Zealand Canada
Continental Europe
United Kingdom, Channel Islands and Africa
United States
5,963 1,472 1,146 385 4,745 4,649
New JerseyNew York
Boston
MontrealToronto
BarcelonaParis
Manila
RotterdamLondon
Crossflatts Doxford
Copenhagen
SkiptonDublin
Bristol
Jersey
Madrid
Turin
Edinburgh Stockholm
MumbaiBahrain
HyderabadBangalore
Johannesburg
Chennai
Kolkata
Beijing
Hong KongDelhi
MaroochydoreBrisbane
Auckland
CalgaryVancouver
San FranciscoLos Angeles
Sydney
Melbourne
Adelaide
Perth
Phoenix
Monaghan
Louisville
ChicagoDenver
Munich
Frankfurt
RomeMilan
Olten
8
STAFF NUMBERS IN EACH REGION
AsiaAustralia and New Zealand Canada
Continental Europe
United Kingdom, Channel Islands and Africa
United States
5,963 1,472 1,146 385 4,745 4,649
9 Computershare Annual Report 2018
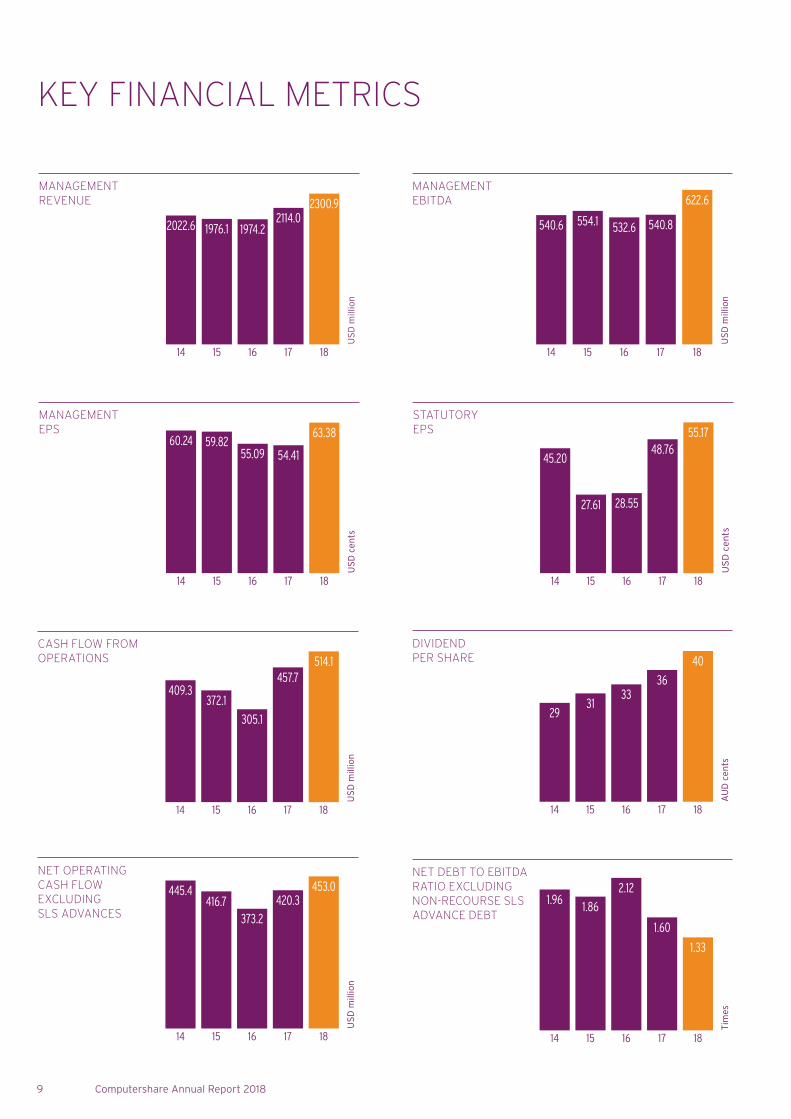
KEY FINANCIAL METRICS
2022.6 1976.1 1974.22114.0
2300.9
US
D m
illio
n14 15 16 17 18
MANAGEMENT REVENUE
540.6 554.1 532.6 540.8
622.6
US
D m
illio
n
14 15 16 17 18
MANAGEMENT EBITDA
60.24 59.8255.09 54.41
63.38
US
D c
ents
14 15 16 17 18
MANAGEMENT EPS
45.20
27.61 28.55
48.7655.17
US
D c
en
ts
14 15 16 17 18
STATUTORY EPS
409.3372.1
305.1
457.7514.1
US
D m
illio
n
14 15 16 17 18
CASH FLOW FROM OPERATIONS
2931
3336
40
AU
D c
ents
14 15 16 17 18
DIVIDEND PER SHARE
445.4416.7
373.2
420.3453.0
US
D m
illio
n
14 15 16 17 18
NET OPERATING CASH FLOW EXCLUDING SLS ADVANCES
1.96 1.86
2.12
1.60
1.33
Tim
es
14 15 16 17 18
NET DEBT TO EBITDA RATIO EXCLUDING NON-RECOURSE SLS ADVANCE DEBT
10
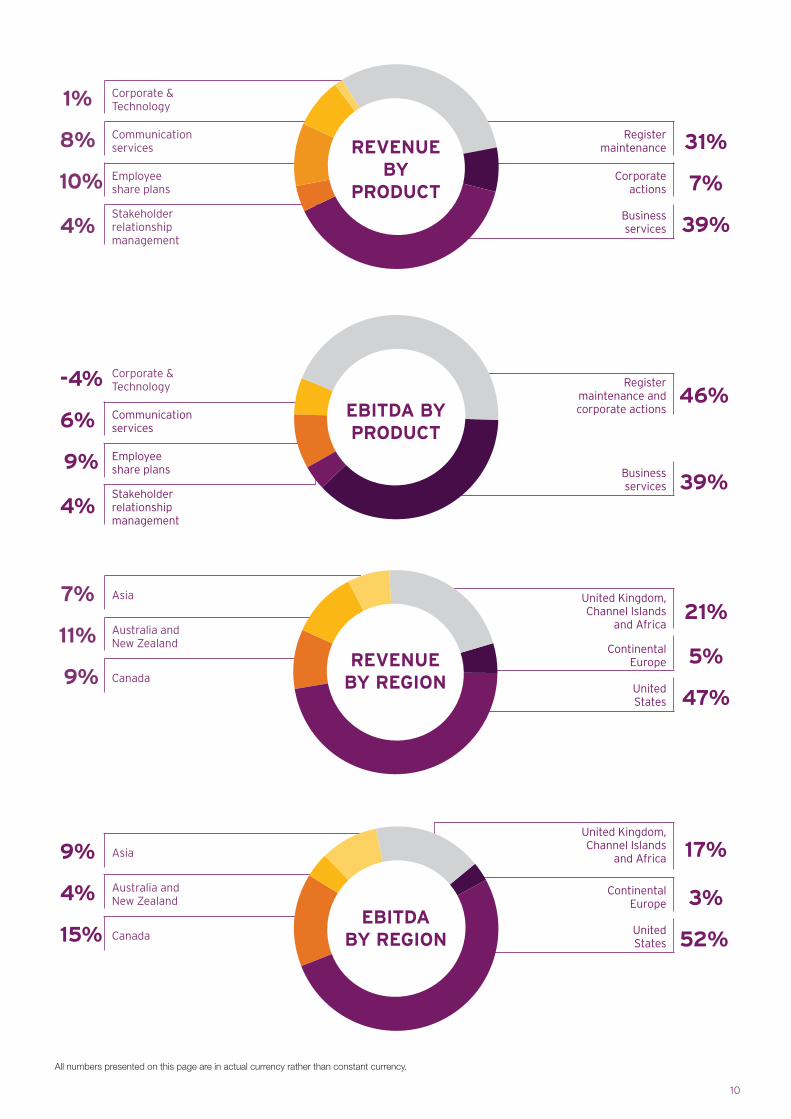
-4% Corporate & Technology
6% Communication services
9% Employee share plans
4% Stakeholder relationship management
Register maintenance and corporate actions
46%
Business services 39%
United Kingdom, Channel Islands
and Africa 17%
Continental Europe 3%United States 52%
9% Asia
4% Australia and New Zealand
15% Canada
1% Corporate & Technology
8% Communication services
10% Employee share plans
4% Stakeholder relationship management
Register maintenance 31%
Corporate actions 7%
Business services 39%
REVENUE BY
PRODUCT
7% Asia
11% Australia and New Zealand
9% Canada
United Kingdom, Channel Islands
and Africa21%
Continental Europe 5%United States 47%
EBITDA BY PRODUCT
EBITDA BY REGION
REVENUE BY REGION
All numbers presented on this page are in actual currency rather than constant currency.
11 Computershare Annual Report 2018
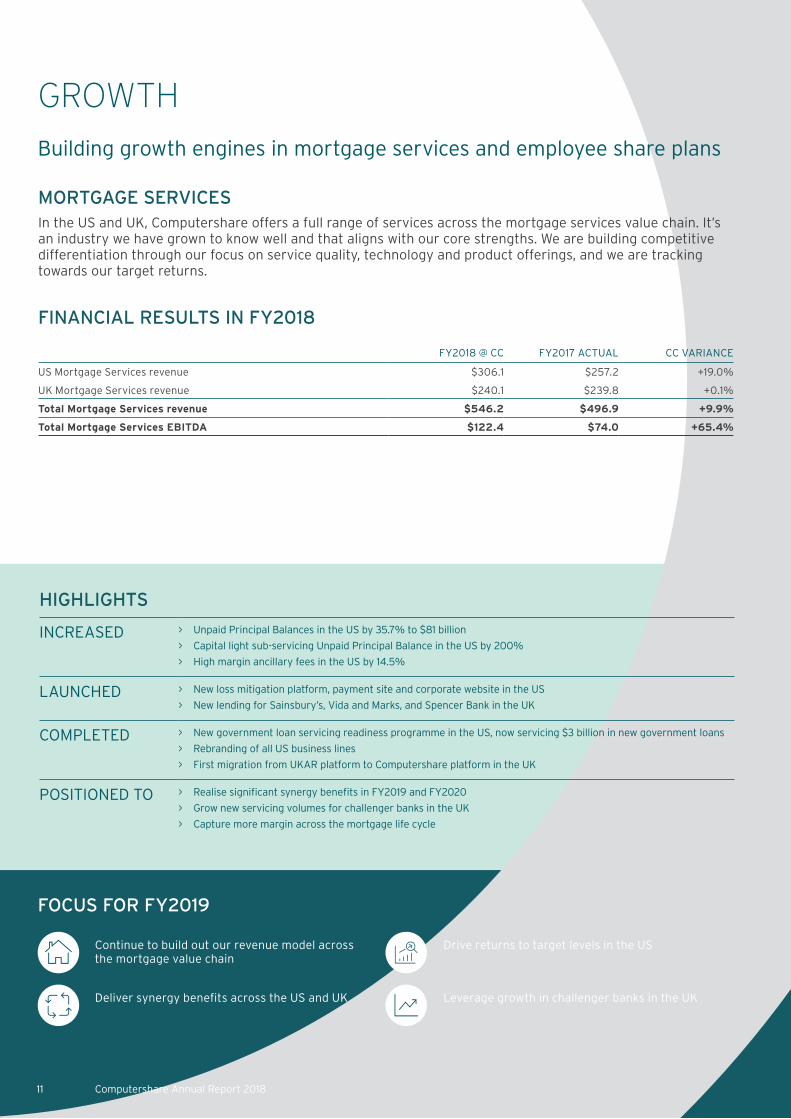
GROWTH
Building growth engines in mortgage services and employee share plans
MORTGAGE SERVICESIn the US and UK, Computershare offers a full range of services across the mortgage services value chain. It’s an industry we have grown to know well and that aligns with our core strengths. We are building competitive differentiation through our focus on service quality, technology and product offerings, and we are tracking towards our target returns.
FINANCIAL RESULTS IN FY2018
FY2018 @ CC FY2017 ACTUAL CC VARIANCE
US Mortgage Services revenue $306.1 $257.2 +19.0%
UK Mortgage Services revenue $240.1 $239.8 +0.1%
Total Mortgage Services revenue $546.2 $496.9 +9.9%
Total Mortgage Services EBITDA $122.4 $74.0 +65.4%
FOCUS FOR FY2019
Continue to build out our revenue model across the mortgage value chain
Drive returns to target levels in the US
Deliver synergy benefits across the US and UK Leverage growth in challenger banks in the UK
HIGHLIGHTS
INCREASED > Unpaid Principal Balances in the US by 35.7% to $81 billion
> Capital light sub-servicing Unpaid Principal Balance in the US by 200%
> High margin ancillary fees in the US by 14.5%
LAUNCHED > New loss mitigation platform, payment site and corporate website in the US
> New lending for Sainsbury’s, Vida and Marks, and Spencer Bank in the UK
COMPLETED > New government loan servicing readiness programme in the US, now servicing $3 billion in new government loans
> Rebranding of all US business lines
> First migration from UKAR platform to Computershare platform in the UK
POSITIONED TO > Realise significant synergy benefits in FY2019 and FY2020
> Grow new servicing volumes for challenger banks in the UK
> Capture more margin across the mortgage life cycle
12
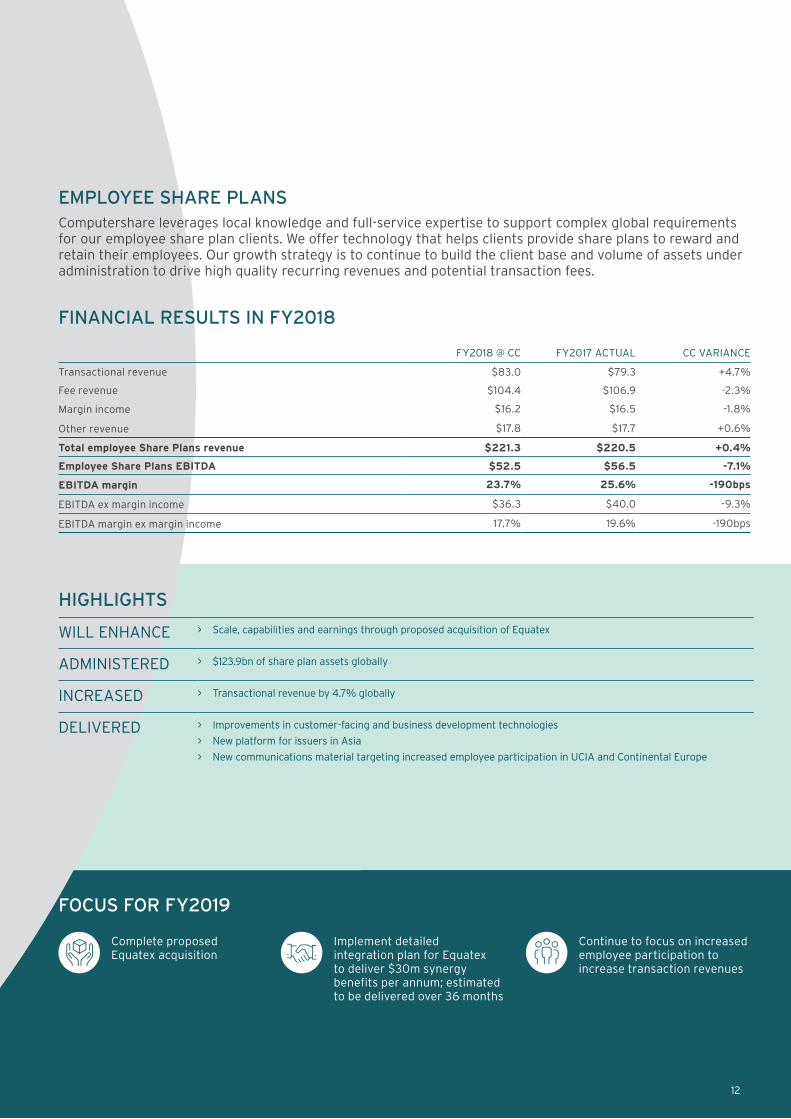
EMPLOYEE SHARE PLANSComputershare leverages local knowledge and full-service expertise to support complex global requirements for our employee share plan clients. We offer technology that helps clients provide share plans to reward and retain their employees. Our growth strategy is to continue to build the client base and volume of assets under administration to drive high quality recurring revenues and potential transaction fees.
FINANCIAL RESULTS IN FY2018
FY2018 @ CC FY2017 ACTUAL CC VARIANCE
Transactional revenue $83.0 $79.3 +4.7%
Fee revenue $104.4 $106.9 -2.3%
Margin income $16.2 $16.5 -1.8%
Other revenue $17.8 $17.7 +0.6%
Total employee Share Plans revenue $221.3 $220.5 +0.4%
Employee Share Plans EBITDA $52.5 $56.5 -7.1%
EBITDA margin 23.7% 25.6% -190bps
EBITDA ex margin income $36.3 $40.0 -9.3%
EBITDA margin ex margin income 17.7% 19.6% -190bps
FOCUS FOR FY2019
Complete proposed Equatex acquisition
Implement detailed integration plan for Equatex to deliver $30m synergy benefits per annum; estimated to be delivered over 36 months
Continue to focus on increased employee participation to increase transaction revenues
HIGHLIGHTS
WILL ENHANCE > Scale, capabilities and earnings through proposed acquisition of Equatex
ADMINISTERED > $123.9bn of share plan assets globally
INCREASED > Transactional revenue by 4.7% globally
DELIVERED > Improvements in customer-facing and business development technologies
> New platform for issuers in Asia
> New communications material targeting increased employee participation in UCIA and Continental Europe
13 Computershare Annual Report 2018
PROFITABILITY Reducing costs to deliver margin expansion and improved profitability
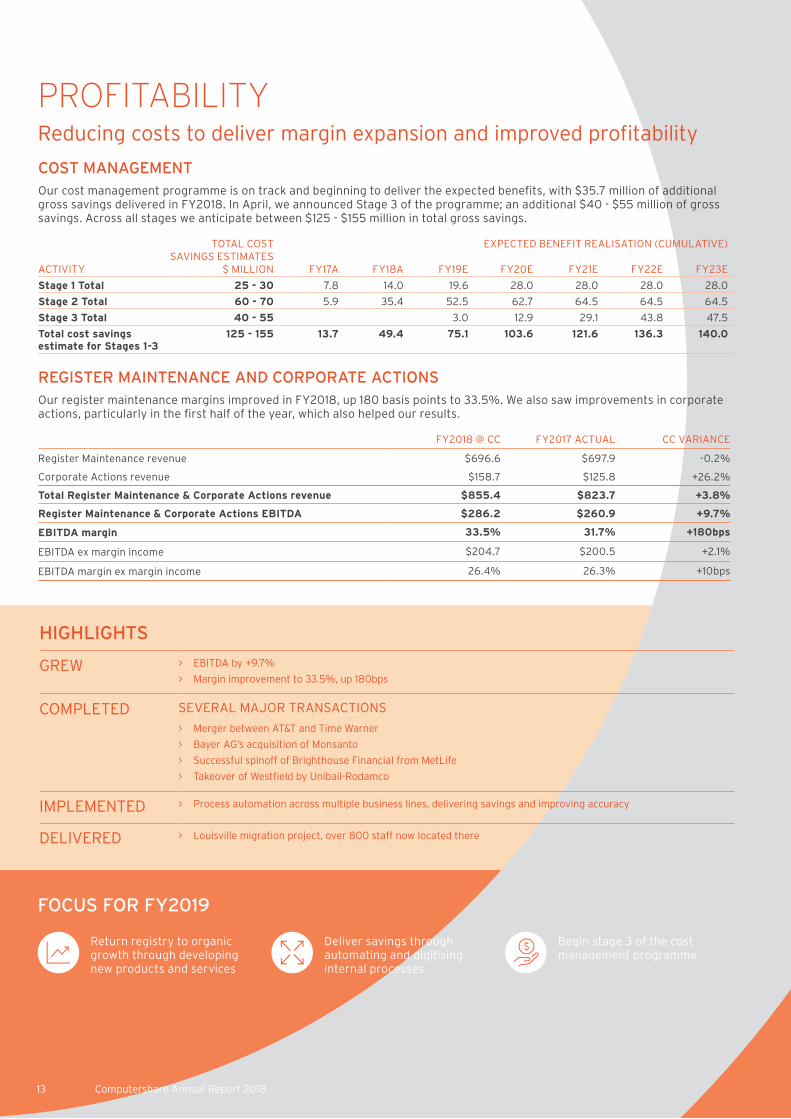
COST MANAGEMENTOur cost management programme is on track and beginning to deliver the expected benefits, with $35.7 million of additional gross savings delivered in FY2018. In April, we announced Stage 3 of the programme; an additional $40 - $55 million of gross savings. Across all stages we anticipate between $125 - $155 million in total gross savings.
ACTIVITY
TOTAL COST SAVINGS ESTIMATES
$ MILLION
EXPECTED BENEFIT REALISATION (CUMULATIVE)
FY17A FY18A FY19E FY20E FY21E FY22E FY23E
Stage 1 Total 25 - 30 7.8 14.0 19.6 28.0 28.0 28.0 28.0
Stage 2 Total 60 - 70 5.9 35.4 52.5 62.7 64.5 64.5 64.5
Stage 3 Total 40 - 55 3.0 12.9 29.1 43.8 47.5
Total cost savings estimate for Stages 1-3
125 - 155 13.7 49.4 75.1 103.6 121.6 136.3 140.0
REGISTER MAINTENANCE AND CORPORATE ACTIONSOur register maintenance margins improved in FY2018, up 180 basis points to 33.5%. We also saw improvements in corporate actions, particularly in the first half of the year, which also helped our results.
FY2018 @ CC FY2017 ACTUAL CC VARIANCE
Register Maintenance revenue $696.6 $697.9 -0.2%
Corporate Actions revenue $158.7 $125.8 +26.2%
Total Register Maintenance & Corporate Actions revenue $855.4 $823.7 +3.8%
Register Maintenance & Corporate Actions EBITDA $286.2 $260.9 +9.7%
EBITDA margin 33.5% 31.7% +180bps
EBITDA ex margin income $204.7 $200.5 +2.1%
EBITDA margin ex margin income 26.4% 26.3% +10bps
FOCUS FOR FY2019
Return registry to organic growth through developing new products and services
Deliver savings through automating and digitising internal processes
Begin stage 3 of the cost management programme
HIGHLIGHTS
GREW > EBITDA by +9.7%
> Margin improvement to 33.5%, up 180bps
COMPLETED SEVERAL MAJOR TRANSACTIONS
> Merger between AT&T and Time Warner
> Bayer AG’s acquisition of Monsanto
> Successful spinoff of Brighthouse Financial from MetLife
> Takeover of Westfield by Unibail-Rodamco
IMPLEMENTED > Process automation across multiple business lines, delivering savings and improving accuracy
DELIVERED > Louisville migration project, over 800 staff now located there
14
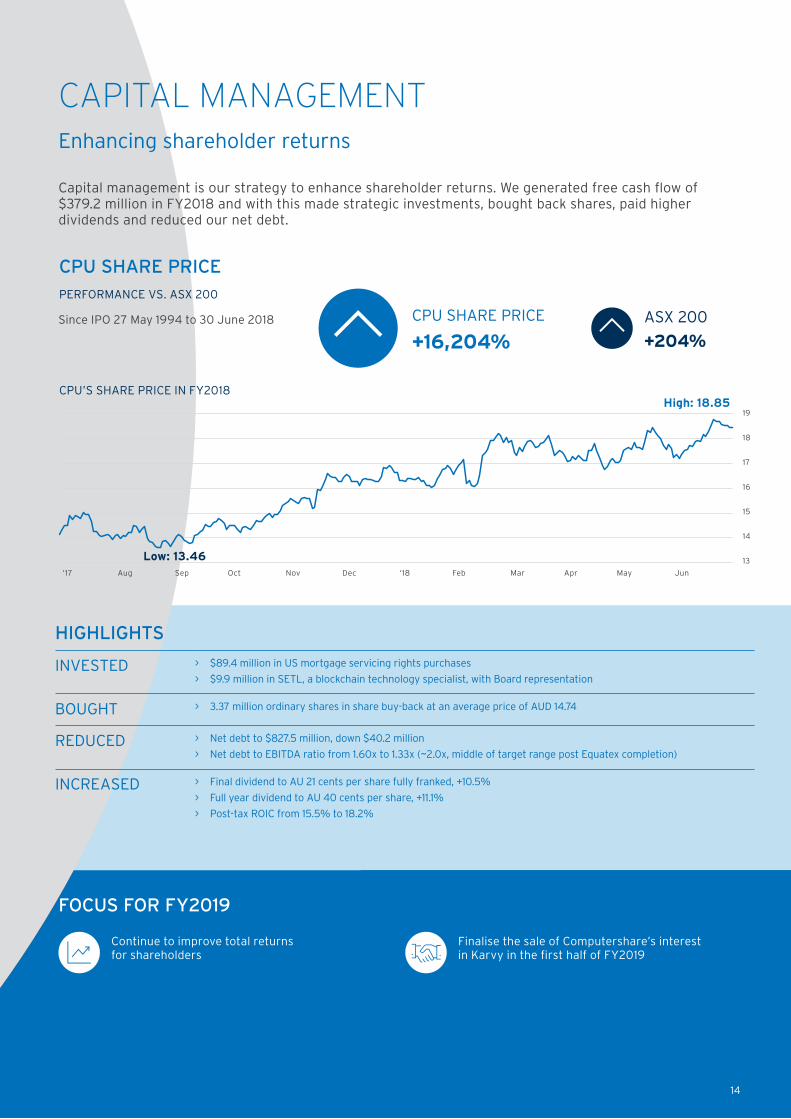
Enhancing shareholder returns
Capital management is our strategy to enhance shareholder returns. We generated free cash flow of $379.2 million in FY2018 and with this made strategic investments, bought back shares, paid higher dividends and reduced our net debt.
FOCUS FOR FY2019
Continue to improve total returns for shareholders
Finalise the sale of Computershare’s interest in Karvy in the first half of FY2019
HIGHLIGHTS
INVESTED > $89.4 million in US mortgage servicing rights purchases
> $9.9 million in SETL, a blockchain technology specialist, with Board representation
BOUGHT > 3.37 million ordinary shares in share buy-back at an average price of AUD 14.74
REDUCED > Net debt to $827.5 million, down $40.2 million
> Net debt to EBITDA ratio from 1.60x to 1.33x (~2.0x, middle of target range post Equatex completion)
INCREASED > Final dividend to AU 21 cents per share fully franked, +10.5%
> Full year dividend to AU 40 cents per share, +11.1%
> Post-tax ROIC from 15.5% to 18.2%
CAPITAL MANAGEMENT
CPU SHARE PRICEPERFORMANCE VS. ASX 200
Since IPO 27 May 1994 to 30 June 2018 CPU SHARE PRICE
+16,204%ASX 200
+204%
CPU’S SHARE PRICE IN FY2018High: 18.85
19
18
17
16
15
14
13Low: 13.46Aug DecSep ‘18 AprOct Feb MayNov Mar Jun‘17
Computershare Annual Report 201815
CORPORATE RESPONSIBILITY
SUSTAINABILITYWe have sustainability and environmental programmes in place around the globe to further minimise our already low impact on the natural world, underpinned by our environmental policy and annual sustainability objectives. For more information visit www.computershare.com/cr
PROGRESS ON OBJECTIVES
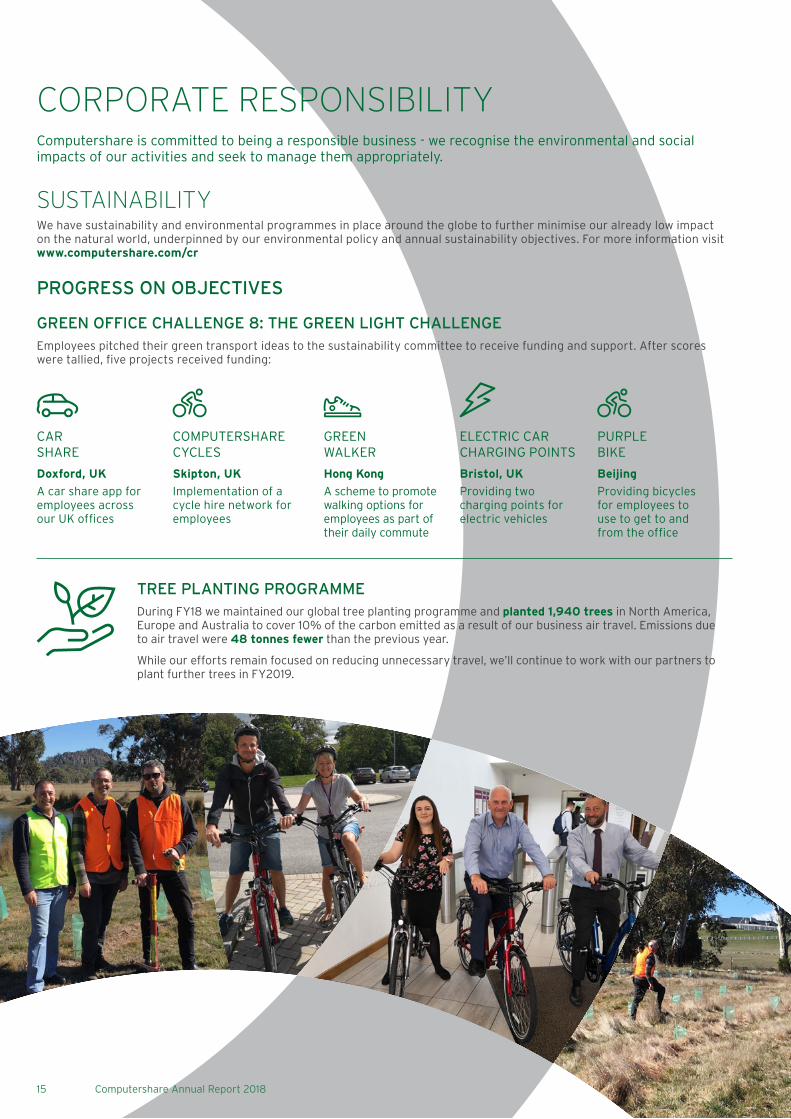
GREEN OFFICE CHALLENGE 8: THE GREEN LIGHT CHALLENGEEmployees pitched their green transport ideas to the sustainability committee to receive funding and support. After scores were tallied, five projects received funding:
CAR SHARE
COMPUTERSHARE CYCLES
GREEN WALKER
ELECTRIC CAR CHARGING POINTS
PURPLE BIKE
Doxford, UK
A car share app for employees across our UK offices
Skipton, UK
Implementation of a cycle hire network for employees
Hong Kong
A scheme to promote walking options for employees as part of their daily commute
Bristol, UK
Providing two charging points for electric vehicles
Beijing
Providing bicycles for employees to use to get to and from the office
TREE PLANTING PROGRAMMEDuring FY18 we maintained our global tree planting programme and planted 1,940 trees in North America, Europe and Australia to cover 10% of the carbon emitted as a result of our business air travel. Emissions due to air travel were 48 tonnes fewer than the previous year.
While our efforts remain focused on reducing unnecessary travel, we’ll continue to work with our partners to plant further trees in FY2019.
Computershare is committed to being a responsible business - we recognise the environmental and social impacts of our activities and seek to manage them appropriately.
16
GREEN ITWe have achieved significant energy savings during the past 12 months through converged infrastructure strategies in our primary UK data centre, decreasing our physical hardware requirements by over 10%.
Over the past six months we have deployed the same infrastructure into our data centres in Germany, Switzerland and Italy, reducing the energy we consume and providing the foundation for further Green IT initiatives.
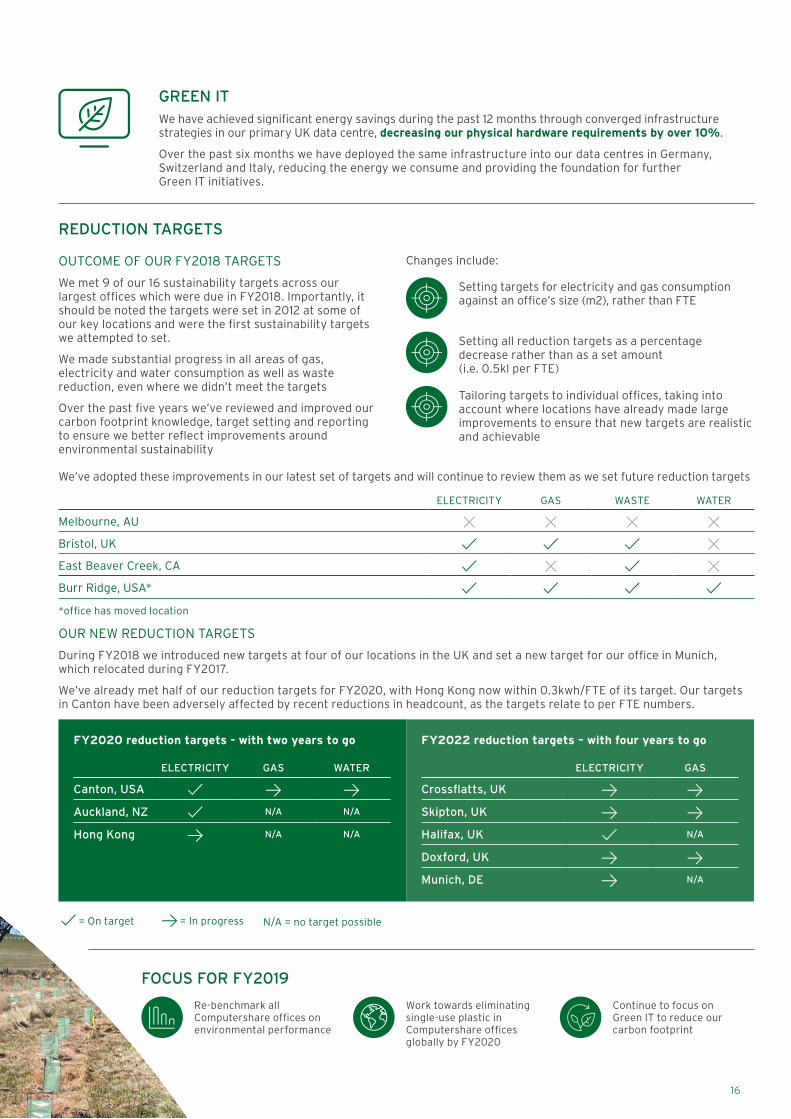
REDUCTION TARGETS
OUTCOME OF OUR FY2018 TARGETS
We met 9 of our 16 sustainability targets across our largest offices which were due in FY2018. Importantly, it should be noted the targets were set in 2012 at some of our key locations and were the first sustainability targets we attempted to set.
We made substantial progress in all areas of gas, electricity and water consumption as well as waste reduction, even where we didn’t meet the targets
Over the past five years we’ve reviewed and improved our carbon footprint knowledge, target setting and reporting to ensure we better reflect improvements around environmental sustainability
Changes include:
Setting targets for electricity and gas consumption against an office’s size (m2), rather than FTE
Setting all reduction targets as a percentage decrease rather than as a set amount (i.e. 0.5kl per FTE)
Tailoring targets to individual offices, taking into account where locations have already made large improvements to ensure that new targets are realistic and achievable
We’ve adopted these improvements in our latest set of targets and will continue to review them as we set future reduction targets
ELECTRICITY GAS WASTE WATER
Melbourne, AU
Bristol, UK
East Beaver Creek, CA
Burr Ridge, USA*
*office has moved location
OUR NEW REDUCTION TARGETS
During FY2018 we introduced new targets at four of our locations in the UK and set a new target for our office in Munich, which relocated during FY2017.
We’ve already met half of our reduction targets for FY2020, with Hong Kong now within 0.3kwh/FTE of its target. Our targets in Canton have been adversely affected by recent reductions in headcount, as the targets relate to per FTE numbers.
FY2020 reduction targets - with two years to go
ELECTRICITY GAS WATER
Canton, USA
Auckland, NZ N/A N/A
Hong Kong N/A N/A
FY2022 reduction targets – with four years to go
ELECTRICITY GAS
Crossflatts, UK
Skipton, UK
Halifax, UK N/A
Doxford, UK
Munich, DE N/A
= On target = In progress N/A = no target possible
FOCUS FOR FY2019
Re-benchmark all Computershare offices on environmental performance
Work towards eliminating single-use plastic in Computershare offices globally by FY2020
Continue to focus on Green IT to reduce our carbon footprint
Computershare Annual Report 201817
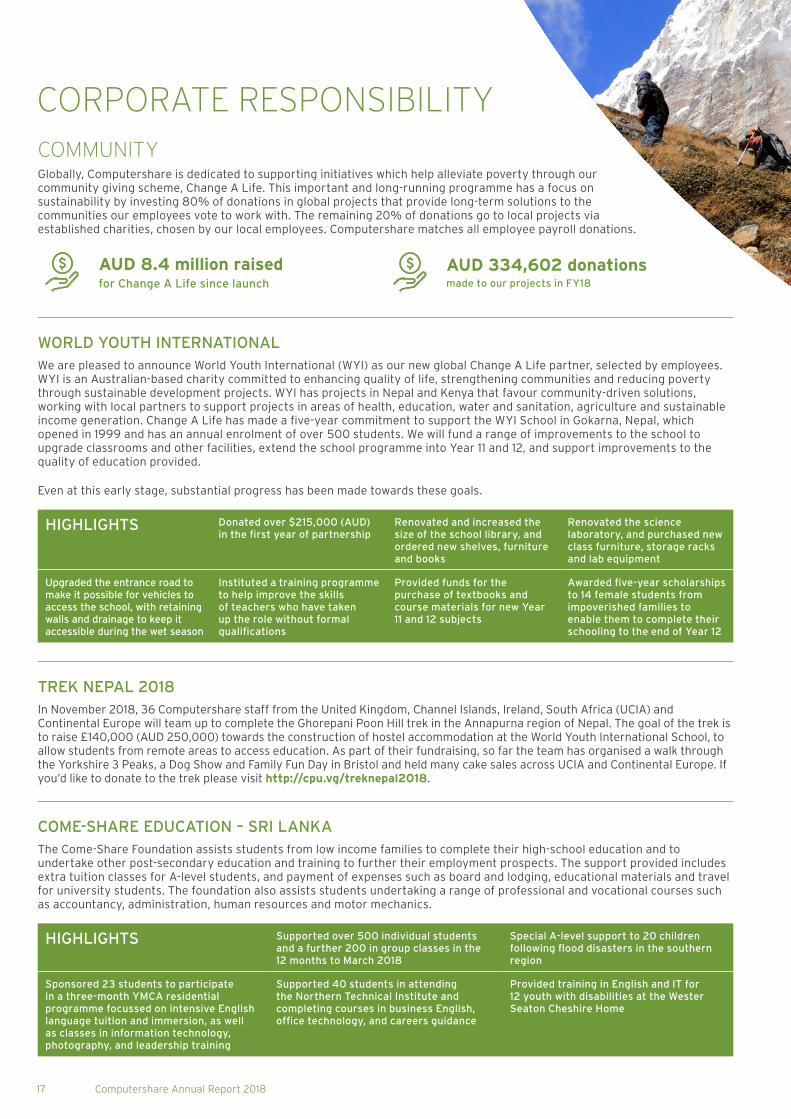
CORPORATE RESPONSIBILITYCOMMUNITYGlobally, Computershare is dedicated to supporting initiatives which help alleviate poverty through our community giving scheme, Change A Life. This important and long-running programme has a focus on sustainability by investing 80% of donations in global projects that provide long-term solutions to the communities our employees vote to work with. The remaining 20% of donations go to local projects via established charities, chosen by our local employees. Computershare matches all employee payroll donations.
AUD 8.4 million raised for Change A Life since launch
AUD 334,602 donations made to our projects in FY18
WORLD YOUTH INTERNATIONALWe are pleased to announce World Youth International (WYI) as our new global Change A Life partner, selected by employees. WYI is an Australian-based charity committed to enhancing quality of life, strengthening communities and reducing poverty through sustainable development projects. WYI has projects in Nepal and Kenya that favour community-driven solutions, working with local partners to support projects in areas of health, education, water and sanitation, agriculture and sustainable income generation. Change A Life has made a five-year commitment to support the WYI School in Gokarna, Nepal, which opened in 1999 and has an annual enrolment of over 500 students. We will fund a range of improvements to the school to upgrade classrooms and other facilities, extend the school programme into Year 11 and 12, and support improvements to the quality of education provided.
Even at this early stage, substantial progress has been made towards these goals.
HIGHLIGHTS Donated over $215,000 (AUD) in the first year of partnership
Renovated and increased the size of the school library, and ordered new shelves, furniture and books
Renovated the science laboratory, and purchased new class furniture, storage racks and lab equipment
Upgraded the entrance road to make it possible for vehicles to access the school, with retaining walls and drainage to keep it accessible during the wet season
Instituted a training programme to help improve the skills of teachers who have taken up the role without formal qualifications
Provided funds for the purchase of textbooks and course materials for new Year 11 and 12 subjects
Awarded five-year scholarships to 14 female students from impoverished families to enable them to complete their schooling to the end of Year 12
TREK NEPAL 2018In November 2018, 36 Computershare staff from the United Kingdom, Channel Islands, Ireland, South Africa (UCIA) and Continental Europe will team up to complete the Ghorepani Poon Hill trek in the Annapurna region of Nepal. The goal of the trek is to raise £140,000 (AUD 250,000) towards the construction of hostel accommodation at the World Youth International School, to allow students from remote areas to access education. As part of their fundraising, so far the team has organised a walk through the Yorkshire 3 Peaks, a Dog Show and Family Fun Day in Bristol and held many cake sales across UCIA and Continental Europe. If you’d like to donate to the trek please visit http://cpu.vg/treknepal2018.
COME-SHARE EDUCATION – SRI LANKAThe Come-Share Foundation assists students from low income families to complete their high-school education and to undertake other post-secondary education and training to further their employment prospects. The support provided includes extra tuition classes for A-level students, and payment of expenses such as board and lodging, educational materials and travel for university students. The foundation also assists students undertaking a range of professional and vocational courses such as accountancy, administration, human resources and motor mechanics.
HIGHLIGHTS Supported over 500 individual students and a further 200 in group classes in the 12 months to March 2018
Special A-level support to 20 children following flood disasters in the southern region
Sponsored 23 students to participate in a three-month YMCA residential programme focussed on intensive English language tuition and immersion, as well as classes in information technology, photography, and leadership training
Supported 40 students in attending the Northern Technical Institute and completing courses in business English, office technology, and careers guidance
Provided training in English and IT for 12 youth with disabilities at the Wester Seaton Cheshire Home

18
LOCAL CHARITIES SELECTIONOne of the goals for Change A Life for 2018 was to establish an employee consultation scheme to assist in the selection of our global charity partners, as well as to choose charities local to our offices. We allocate 20% of Change A Life funds to those local projects, and we also encourage staff to be personally involved in those projects through allocated volunteer days each year.
The process of charity selection was conducted through a multi-step process, with employees surveyed on their preferred charity type, then asked to vote from a shortlist of charities local to our major offices.
HIGHLIGHTS Our offices in New Jersey, Illinois, Arizona, Colorado and Florida all chose to support Together We Rise, a non-profit that seeks to offer a brighter future, and a sense of normalcy and belonging to children who live in foster care across the US.
Our offices in Louisville and Dallas selected Family Scholar House, who work to empower families and youth to succeed in education and achieve life-long self-sufficiency.
Our Brisbane office voted to support Kickin’ with a Cuz, a programme designed to promote health and responsible life choices for indigenous youth, by giving them access to soccer training and mentoring.
Our Bristol office chose CLIC Sargent, the UK’s leading cancer charity for children, providing specialist support to young people and their families.
Our Hong Kong office selected the Hans Andersen Club, who provide reading training and storytelling resources for under-privileged families and their children in Hong Kong.
CHANGE A LIFE FOUNDATION DINNERComputershare Australia proudly hosted the Change A Life Foundation Dinner on Saturday 12 May at the Brisbane Hilton for over 300 guests. The event raised almost AUD 60,000 for World Youth International, and the Brisbane office’s local Change A Life charity, Kickin’ with a Cuz. Those who attended enjoyed performances by the Yerongpan Aboriginal Dancers, and traditional Nepalese performances from percussionist Dheeraj Shrestha and dancer Kamana Poudel.
You can read more about our Change A Life activities on our website www.changealife.com.au.
FOCUS FOR FY2019
Run a successful Trek Nepal for employees and raise £140,000 in the process
Continue to work with our selected local charities to implement engagement programmes
Increase employee participation in Change A Life

19
At Computershare, our people are our most important asset. We expect a lot from our employees and we rely on them to protect and grow our business. We hire, develop, reward, promote and retain our people on the basis of their talent, commitment and the results they achieve.
We offer a wide variety of training and professional development opportunities, great benefits including a generous employee share plan, and a supportive work environment. We know that looking after our people ensures success for them, for us and for our clients, and we are proud of our special culture of ‘doing the right thing’ to deliver exceptional service to our customers.
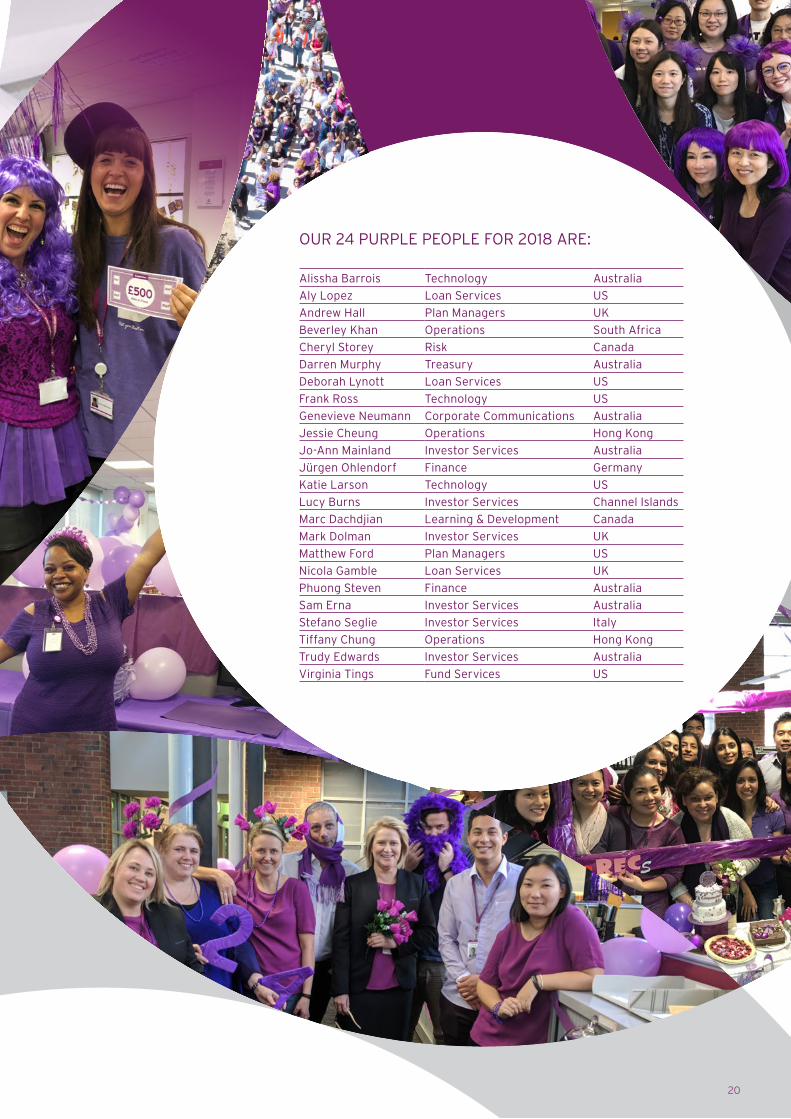
COMPUTERSHARE DAYOn 25 May we celebrated our second annual Computershare Day, marking 24 years since Computershare was listed on the Australian Securities Exchange. Employees around the world took part in the event, which included a ‘most purple team’, ‘purple quiz’ and ‘best Computershare poem’ competition.
We also presented our Purple Person awards for the second time, recognising 24 employees for their contribution to Computershare and for exemplifying our values.
PEOPLE
20
OUR 24 PURPLE PEOPLE FOR 2018 ARE:
Alissha Barrois Technology Australia
Aly Lopez Loan Services US
Andrew Hall Plan Managers UK
Beverley Khan Operations South Africa
Cheryl Storey Risk Canada
Darren Murphy Treasury Australia
Deborah Lynott Loan Services US
Frank Ross Technology US
Genevieve Neumann Corporate Communications Australia
Jessie Cheung Operations Hong Kong
Jo-Ann Mainland Investor Services Australia
Jürgen Ohlendorf Finance Germany
Katie Larson Technology US
Lucy Burns Investor Services Channel Islands
Marc Dachdjian Learning & Development Canada
Mark Dolman Investor Services UK
Matthew Ford Plan Managers US
Nicola Gamble Loan Services UK
Phuong Steven Finance Australia
Sam Erna Investor Services Australia
Stefano Seglie Investor Services Italy
Tiffany Chung Operations Hong Kong
Trudy Edwards Investor Services Australia
Virginia Tings Fund Services US
21 Computershare Annual Report 2018
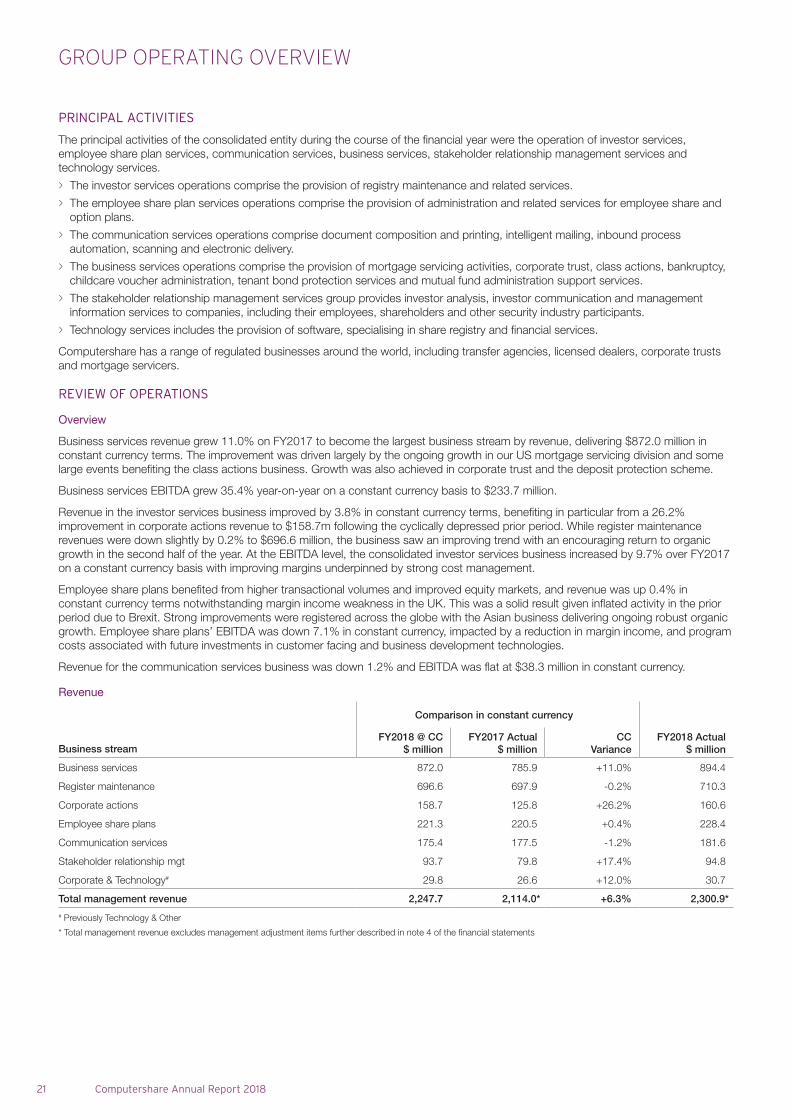
PRINCIPAL ACTIVITIES
The principal activities of the consolidated entity during the course of the financial year were the operation of investor services, employee share plan services, communication services, business services, stakeholder relationship management services and technology services.
> The investor services operations comprise the provision of registry maintenance and related services.
> The employee share plan services operations comprise the provision of administration and related services for employee share and option plans.
> The communication services operations comprise document composition and printing, intelligent mailing, inbound process automation, scanning and electronic delivery.
> The business services operations comprise the provision of mortgage servicing activities, corporate trust, class actions, bankruptcy, childcare voucher administration, tenant bond protection services and mutual fund administration support services.
> The stakeholder relationship management services group provides investor analysis, investor communication and management information services to companies, including their employees, shareholders and other security industry participants.
> Technology services includes the provision of software, specialising in share registry and financial services.
Computershare has a range of regulated businesses around the world, including transfer agencies, licensed dealers, corporate trusts and mortgage servicers.
REVIEW OF OPERATIONS
Overview
Business services revenue grew 11.0% on FY2017 to become the largest business stream by revenue, delivering $872.0 million in constant currency terms. The improvement was driven largely by the ongoing growth in our US mortgage servicing division and some large events benefiting the class actions business. Growth was also achieved in corporate trust and the deposit protection scheme.
Business services EBITDA grew 35.4% year-on-year on a constant currency basis to $233.7 million.
Revenue in the investor services business improved by 3.8% in constant currency terms, benefiting in particular from a 26.2% improvement in corporate actions revenue to $158.7m following the cyclically depressed prior period. While register maintenance revenues were down slightly by 0.2% to $696.6 million, the business saw an improving trend with an encouraging return to organic growth in the second half of the year. At the EBITDA level, the consolidated investor services business increased by 9.7% over FY2017 on a constant currency basis with improving margins underpinned by strong cost management.
Employee share plans benefited from higher transactional volumes and improved equity markets, and revenue was up 0.4% in constant currency terms notwithstanding margin income weakness in the UK. This was a solid result given inflated activity in the prior period due to Brexit. Strong improvements were registered across the globe with the Asian business delivering ongoing robust organic growth. Employee share plans’ EBITDA was down 7.1% in constant currency, impacted by a reduction in margin income, and program costs associated with future investments in customer facing and business development technologies.
Revenue for the communication services business was down 1.2% and EBITDA was flat at $38.3 million in constant currency.
Revenue
Comparison in constant currency
Business streamFY2018 @ CC
$ millionFY2017 Actual
$ millionCC
VarianceFY2018 Actual
$ million
Business services 872.0 785.9 +11.0% 894.4
Register maintenance 696.6 697.9 -0.2% 710.3
Corporate actions 158.7 125.8 +26.2% 160.6
Employee share plans 221.3 220.5 +0.4% 228.4
Communication services 175.4 177.5 -1.2% 181.6
Stakeholder relationship mgt 93.7 79.8 +17.4% 94.8
Corporate & Technology# 29.8 26.6 +12.0% 30.7
Total management revenue 2,247.7 2,114.0* +6.3% 2,300.9*
# Previously Technology & Other
* Total management revenue excludes management adjustment items further described in note 4 of the financial statements
GROUP OPERATING OVERVIEW
22
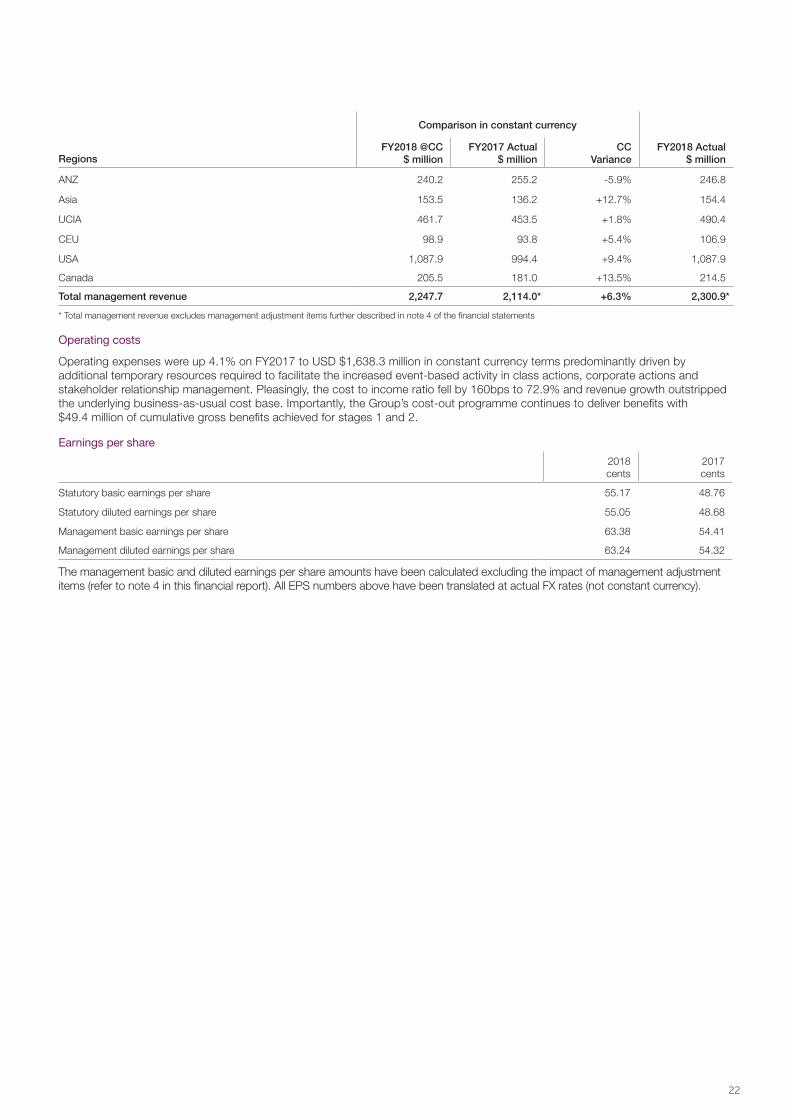
Comparison in constant currency
RegionsFY2018 @CC
$ millionFY2017 Actual
$ millionCC
VarianceFY2018 Actual
$ million
ANZ 240.2 255.2 -5.9% 246.8
Asia 153.5 136.2 +12.7% 154.4
UCIA 461.7 453.5 +1.8% 490.4
CEU 98.9 93.8 +5.4% 106.9
USA 1,087.9 994.4 +9.4% 1,087.9
Canada 205.5 181.0 +13.5% 214.5
Total management revenue 2,247.7 2,114.0* +6.3% 2,300.9*
* Total management revenue excludes management adjustment items further described in note 4 of the financial statements
Operating costs
Operating expenses were up 4.1% on FY2017 to USD $1,638.3 million in constant currency terms predominantly driven by additional temporary resources required to facilitate the increased event-based activity in class actions, corporate actions and stakeholder relationship management. Pleasingly, the cost to income ratio fell by 160bps to 72.9% and revenue growth outstripped the underlying business-as-usual cost base. Importantly, the Group’s cost-out programme continues to deliver benefits with $49.4 million of cumulative gross benefits achieved for stages 1 and 2.
Earnings per share
2018 cents
2017 cents
Statutory basic earnings per share 55.17 48.76
Statutory diluted earnings per share 55.05 48.68
Management basic earnings per share 63.38 54.41
Management diluted earnings per share 63.24 54.32
The management basic and diluted earnings per share amounts have been calculated excluding the impact of management adjustment items (refer to note 4 in this financial report). All EPS numbers above have been translated at actual FX rates (not constant currency).
23 Computershare Annual Report 2018
OUTLOOK
In August 2018, we reported that we expect management EPS in constant currency to increase by around 10% on FY2018.
This outlook assessment and other references to our FY2019 outlook in this document are subject to the forward-looking statements disclaimer and assumptions provided in our annual results announcement disclosed to the Australian Securities Exchange and assumes that interest rate markets perform broadly in line with expectations that existed at the time of providing that guidance, and that equity markets remain at the levels that existed at the time of providing that guidance.
Computershare’s strategy is to be the leading provider of services in our selected markets by leveraging our core skills and competencies to deliver outstanding client outcomes from engaged staff. We focus on new products and services to reinforce our leadership in established markets, and invest in technology and innovation to deliver productivity gains and improved cost outcomes.
We are currently focused, in particular, on driving growth in our mortgage services business by building out our revenue model across the mortgage value chain together with integrating the large UKAR book of business in the UK. In our other growth engine, employee share plans, we are now focused on closing the recent Equatex acquisition which we expect will enhance our scale, capabilities and earnings.
We also have a range of strategies to enhance profitability underpinned by our cost-out programmes where we have been executing strongly, to return our registry maintenance business to organic growth and increasing our exposure to improved margin income as the interest rate environment normalises.
Our capital management strategy aims to advance returns for shareholders. The company consistently generates strong free cash flow and we use this to fund our growth engines, technology initiatives and strategic investments, and in recent times we have also been able to reduce debt, buy back shares and increase dividends. We take a conservative stance to debt leverage, with a target range of 1.75x to 2.25x net debt to EBITDA (excluding non-recourse SLS advance debt).
We appraise on an ongoing basis the benefits of share buy-backs. Furthermore we have formalised our dividend payout ratio policy to return 40% to 60% on Management NPAT subject to our cash requirements and leverage ratio and we will continue to maximise franking available to shareholders.
RISKS
The Board is ultimately responsible for setting the risk appetite for the Group and otherwise reviewing and approving Computershare’s risk management framework and policies and assessing their effectiveness in mitigating the risks present in our business. The Board delegates some of this responsibility to the Risk and Audit Committee.
Computershare has a clear approach to the oversight and management of risk, based on the ‘three lines of defence’ model. This model provides a simple framework for the implementation and oversight of risk management in which management, as the first line of defence, has primary responsibility for risk management and control activities.
The risk function, as part of the second line of defence, is responsible for setting and implementing the risk framework and supporting tools and methodologies, as well as providing advisory support to management.
The internal audit function, as the third line of defence, provides an independent and objective assurance function with the responsibility of confirming that the framework, policies, and controls designed to manage key risks are being executed effectively by management. Internal audit carries out regular, systematic monitoring of control activities and reports its findings to the senior managers of each business unit as well as to the Risk and Audit Committee.
RISK SUMMARY
The following outlines areas of material risk that could impact our ability to achieve our strategic objectives and future financial prospects including, where applicable, our exposure to economic, environmental or social sustainability risks and how we seek to mitigate or manage them.
Strategic and regulatory risk
Our businesses operate in highly-regulated markets around the world and our success can be impacted by changes to the regulatory environment and the structure of these markets. As an organisation we pay very close attention to regulatory developments globally and play an active role in consulting with regulators on changes which could impact our business.
Many of our key businesses are also subject to direct regulatory oversight and we are required to maintain the appropriate regulatory approvals and licenses to operate, and in some cases adhere to certain financial covenants (such as capital adequacy). Computershare has robust compliance management and monitoring programs in place to support these regulatory obligations.
In the course of its business, Computershare’s mortgage servicing business purchases Mortgage Servicing Rights (MSR) in order to service a group or portfolio of mortgages. Interest rate volatility creates risk related to the market value of the MSR assets and ability to generate revenue.
Our business is also at risk of disruption from new technologies and alternative service providers. This means we must be looking constantly for ways to improve our services by investing in new technologies and processes. We have a dedicated innovation team which is responsible for rapidly assessing the viability of new business ideas and initiatives in an agile yet systematic manner using proven innovation techniques.
BUSINESS STRATEGIES AND PROSPECTS
24
In recent periods we have seen the emergence of distributed ledger technology or ‘blockchain’, which has the potential to be deployed across financial market systems, including post-trade clearing and settlement of securities. Deployment of distributed ledger technology into financial markets, if it ultimately proves to be a viable option, will require extensive dialogue and consultation with regulators and industry participants and its ultimate market structure implications are not yet known.
Computershare is adopting a measured and considered approach to blockchain. We are pursuing a dual-track approach in terms of assessing the commercial value of introducing innovative blockchain services in market adjacencies, while also rigorously defending our existing role and overall market positioning. We also believe that our global presence makes us an attractive partner to blockchain solution providers and gives us access to a wide range of potential commercial blockchain opportunities. We have also made a strategic investment in SETL, a company which is a leading provider of blockchain solutions to financial markets globally.
Our future prospects also depend on finding and executing on opportunities to grow and diversify our business. We are potentially constrained by market structure restrictions from significantly growing our registry services footprint by acquisition (unless subsequent market structure changes present new opportunities) and this has inevitably changed the focus of our investment decisions. There is also inherent risk in any acquisition, including risk of financial loss or missed earnings potential from inappropriate acquisition decisions as well as integration risk in its implementation. Computershare has a strong track record of acquiring and integrating businesses successfully, in particular in the businesses of registry and employee share plan administration. We have a deliberately focused acquisition strategy with rigorous approval processes, and we also undertake subsequent reviews of our acquisitions and their performance.
Computershare also operates across a diverse set of countries and tax jurisdictions. The tax environments in these jurisdictions can be complex and subject to change and these changes cannot be accurately predicted. Computershare operates a global finance function to manage tax risk within the Group’s risk appetite and engages external tax advice as appropriate.
Financial risk
Our financial performance each year is underpinned by significant annuity revenue. However, there is also a material proportion of revenue that is derived from transactional activity that is dependent on factors outside our control, which can be challenging to predict. Changes to market activity generally, foreign exchange and interest rates have the ability to impact adversely on our financial performance. Computershare generates significant revenues from the transaction processing fees we earn from our services (including the interest income earned by investing client funds). These revenue sources are substantially dependent on customer trading volumes, market prices and liquidity of securities markets. Sudden sharp or gradual but sustained declines in market values of securities can result in reduced investor communication activity, including reduced mutual funds communication volumes, reduced mergers and acquisitions activity and reduced proxy activity; reduced trading activity; and illiquid markets.
Margin income is a key contributor to earnings. Changes in investment restrictions, interest rates, and to the level of balances that we hold on behalf of clients can have a material impact on the Group’s earnings. We also have strong relationships with the global financial institutions that hold our client balances. We have robust policies and other protections to manage interest rate risk and other risks associated with placing those funds (including counterparty risk) and we also make significant investments in processes and technology to identify, allocate, reconcile and oversee client monies. Computershare’s current policy for hedging its interest rate exposure is for a minimum of one year forward and 25% hedging coverage to a maximum of five years forward with 100% hedging coverage.
The market for Computershare’s products and services is rapidly evolving and highly competitive. We compete with a number of firms that provide similar products and services to our own. In addition, we compete with our clients’ in-house capabilities to perform functions that they might otherwise outsource to us. We continually strive to remain the leading provider of services in all our business lines globally and invest significantly in new technology and services to maintain our market-leading position.
Operational risk
Computershare deals with a high volume of daily transactions which can be exposed to data loss and security breaches. The nature of cyber-crime is constantly changing and information systems are vulnerable to cyber-attacks. Security breaches may involve unauthorised access to Computershare systems and databases, damage to Computershare’s systems and the exposure and/or theft of confidential client data. This presents a range of challenges, from ensuring the security and integrity of that data as well as the continuity of our service in the face of internal and external factors. We manage these risks through extensive business continuity planning and testing as well as rigorous internal controls around the ability to access and modify client data. We also make significant investments in technology and services to protect data at rest, in motion and at end point, including a specialist information security team whose responsibilities include ensuring we have appropriate and effective systems in place to protect our and our clients’ data from unauthorised access. Our dedicated financial crime team is also responsible for analysing information and transactions to mitigate the risk of fraud (both internal and external), and these resources are focused on areas of highest potential exposure.
Computershare also undertakes high volumes of transactional processes, some of which are complex. There is a risk that failure to process these transactions correctly could result in liabilities being incurred to third parties. We invest significantly in technology to automate processes where possible. We also have policies, processes and corresponding controls to assist in mitigating this risk, which are routinely tested. The Group also maintains insurance.
25 Computershare Annual Report 2018
CORPORATE GOVERNANCE STATEMENT
COMPUTERSHARE’S APPROACH TO CORPORATE GOVERNANCE
The Board is committed to maintaining high standards of corporate governance by overseeing a sound and effective governance framework for the management and conduct of Computershare’s business. This corporate governance statement sets out a description of Computershare’s main corporate governance practices. Computershare’s governance arrangements complied with each of the recommendations set by the ASX Corporate Governance Council throughout the reporting period.
In this statement ‘Group’ is used to refer to Computershare Limited and its controlled entities, and references to ‘Group management’ refer to the Group’s Chief Executive Officer and the executives reporting directly to the Chief Executive Officer.
This Corporate Governance Statement has been approved by the Board and is current as at 17 September 2018.
1. BOARD RESPONSIBILITIES
The Board is responsible for the corporate governance of the Group and is governed by the principles set out in the Board Charter. A copy of the Board-approved Charter is available from http://www.computershare.com/governance.
The principal role of the Board is to ensure the long-term prosperity of the Group and, in doing so, to determine the Group’s strategic direction. The Board also sets broad corporate governance principles, which govern the Group’s business operations and accountability, and ensures that those principles are effectively implemented by Group management.
The Board’s other reserved powers and duties can be divided into five distinct areas of responsibility, an overview of which is provided below:
> Strategic planning for the Group – involves commenting on, and providing final approval of, the Group’s corporate strategy and related performance objectives, as developed by Group management, as well as monitoring Group management’s implementation of, and performance with respect to, that agreed corporate strategy.
> Financial and related matters – includes approving the Group’s budgets and other performance indicators and monitoring progress against them, as well as approving and monitoring financial and other reporting, internal and external audit plans, setting the Group’s risk appetite and approving enterprise risk management plans and monitoring the progress of major capital expenditure, acquisitions and divestitures.
> Corporate governance – incorporates overseeing Computershare’s corporate governance framework, including approving changes made to key supporting Group policies and overseeing Computershare’s reporting to shareholders and its compliance with its continuous disclosure obligations.
> Overseeing Group management – involves the appointment and, if required, removal of the Chief Executive Officer and the monitoring of his or her ongoing performance, as well as, if applicable, the appointment and if required, removal of Group management personnel, including the Chief Financial Officer and Company Secretary.
> Remuneration – comprises the approval of Computershare’s overall remuneration framework and determining the remuneration of non-executive directors within the limits approved by shareholders.
The Board has delegated the responsibility for day-to-day management and administration of Computershare to the Chief Executive Officer. Ultimately, Group management is responsible for managing the Group in accordance with the corporate strategy, plans and policies approved by the Board, and is required to provide appropriate information to the Board to ensure it can effectively discharge its duties.
2. BOARD COMPOSITION AND DIRECTOR APPOINTMENT
Computershare’s Constitution states that the Board must have a minimum of three and a maximum of ten directors. Re-appointment is not automatic and if retiring directors would like to continue to hold office they must submit themselves for re-election by Computershare’s shareholders at the Annual General Meeting. No director (other than the Chief Executive Officer) may be in office for longer than three years without facing re-election.
In addition to ensuring that the Board has the mix of skills, knowledge and experience commonly required across boards of major ASX listed companies, the Board is also focused on ensuring that its composition aligns with the Group’s strategic objectives and that it has the necessary skills and expertise to provide oversight of those areas of the Group’s business where there is greatest scope to increase shareholder value in the future.
As a global organisation, it is also of great importance to the Board that it has an appropriate balance of directors who are based in Australia, as well as directors who are based in or who have experience of regions where there are significant group operations.
The Board also considers its size should be conducive to effective discussion and efficient decision making. The Board regularly reassesses its composition to ensure that it continues to meet these requirements.
26
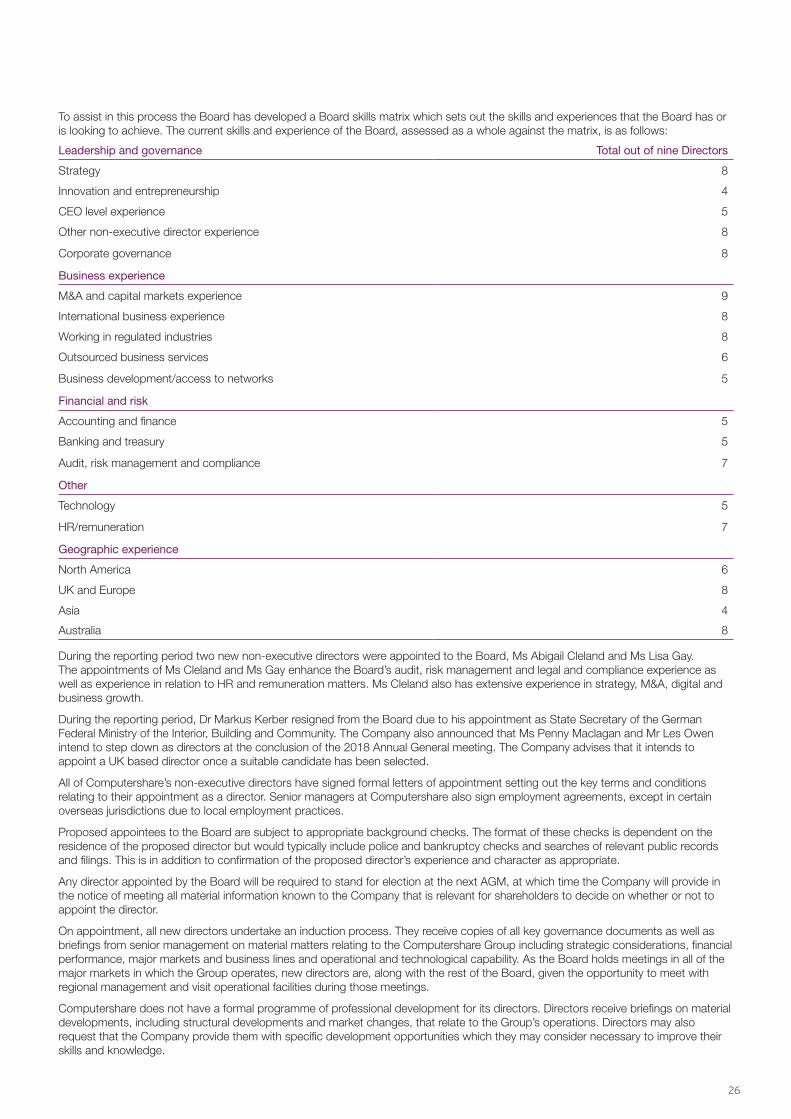
To assist in this process the Board has developed a Board skills matrix which sets out the skills and experiences that the Board has or is looking to achieve. The current skills and experience of the Board, assessed as a whole against the matrix, is as follows:
Leadership and governance Total out of nine Directors
Strategy 8
Innovation and entrepreneurship 4
CEO level experience 5
Other non-executive director experience 8
Corporate governance 8
Business experience
M&A and capital markets experience 9
International business experience 8
Working in regulated industries 8
Outsourced business services 6
Business development/access to networks 5
Financial and risk
Accounting and finance 5
Banking and treasury 5
Audit, risk management and compliance 7
Other
Technology 5
HR/remuneration 7
Geographic experience
North America 6
UK and Europe 8
Asia 4
Australia 8
During the reporting period two new non-executive directors were appointed to the Board, Ms Abigail Cleland and Ms Lisa Gay. The appointments of Ms Cleland and Ms Gay enhance the Board’s audit, risk management and legal and compliance experience as well as experience in relation to HR and remuneration matters. Ms Cleland also has extensive experience in strategy, M&A, digital and business growth.
During the reporting period, Dr Markus Kerber resigned from the Board due to his appointment as State Secretary of the German Federal Ministry of the Interior, Building and Community. The Company also announced that Ms Penny Maclagan and Mr Les Owen intend to step down as directors at the conclusion of the 2018 Annual General meeting. The Company advises that it intends to appoint a UK based director once a suitable candidate has been selected.
All of Computershare’s non-executive directors have signed formal letters of appointment setting out the key terms and conditions relating to their appointment as a director. Senior managers at Computershare also sign employment agreements, except in certain overseas jurisdictions due to local employment practices.
Proposed appointees to the Board are subject to appropriate background checks. The format of these checks is dependent on the residence of the proposed director but would typically include police and bankruptcy checks and searches of relevant public records and filings. This is in addition to confirmation of the proposed director’s experience and character as appropriate.
Any director appointed by the Board will be required to stand for election at the next AGM, at which time the Company will provide in the notice of meeting all material information known to the Company that is relevant for shareholders to decide on whether or not to appoint the director.
On appointment, all new directors undertake an induction process. They receive copies of all key governance documents as well as briefings from senior management on material matters relating to the Computershare Group including strategic considerations, financial performance, major markets and business lines and operational and technological capability. As the Board holds meetings in all of the major markets in which the Group operates, new directors are, along with the rest of the Board, given the opportunity to meet with regional management and visit operational facilities during those meetings.
Computershare does not have a formal programme of professional development for its directors. Directors receive briefings on material developments, including structural developments and market changes, that relate to the Group’s operations. Directors may also request that the Company provide them with specific development opportunities which they may consider necessary to improve their skills and knowledge.
27 Computershare Annual Report 2018
CORPORATE GOVERNANCE STATEMENT
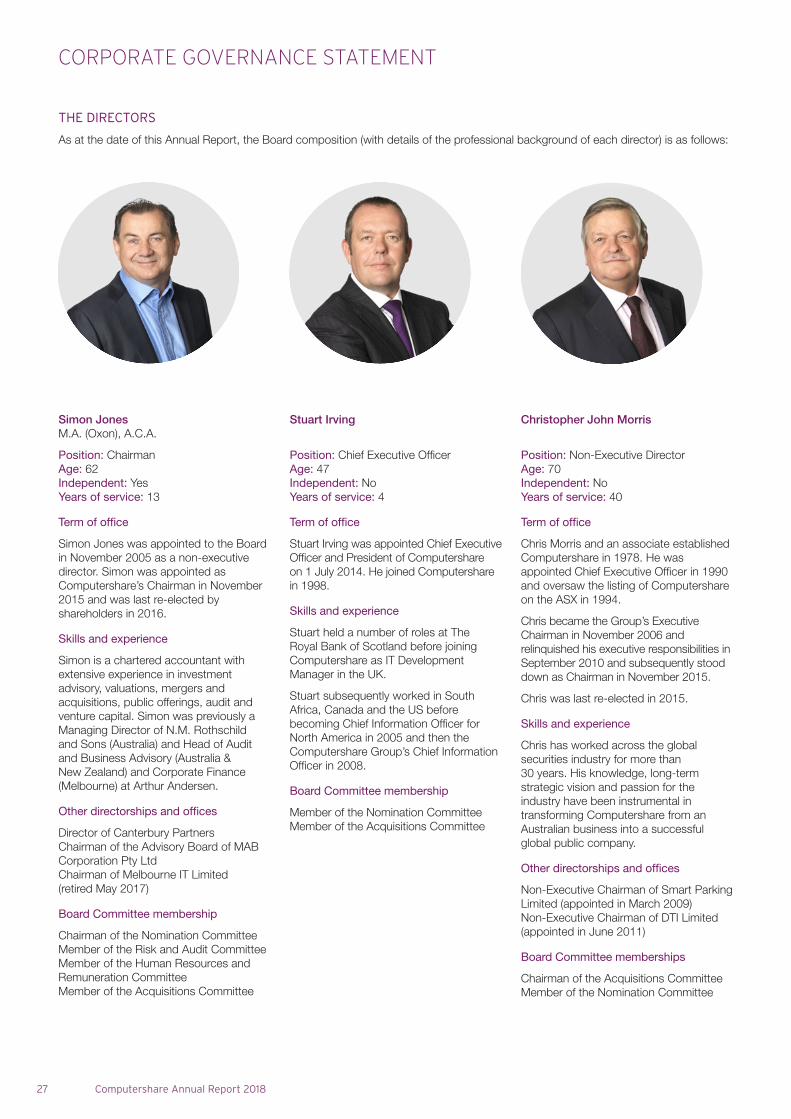
Simon Jones M.A. (Oxon), A.C.A.
Position: Chairman Age: 62 Independent: Yes Years of service: 13
Term of office
Simon Jones was appointed to the Board in November 2005 as a non-executive director. Simon was appointed as Computershare’s Chairman in November 2015 and was last re-elected by shareholders in 2016.
Skills and experience
Simon is a chartered accountant with extensive experience in investment advisory, valuations, mergers and acquisitions, public offerings, audit and venture capital. Simon was previously a Managing Director of N.M. Rothschild and Sons (Australia) and Head of Audit and Business Advisory (Australia & New Zealand) and Corporate Finance (Melbourne) at Arthur Andersen.
Other directorships and offices
Director of Canterbury Partners Chairman of the Advisory Board of MAB Corporation Pty LtdChairman of Melbourne IT Limited (retired May 2017)
Board Committee membership
Chairman of the Nomination Committee Member of the Risk and Audit Committee Member of the Human Resources and Remuneration Committee Member of the Acquisitions Committee
Stuart Irving
Position: Chief Executive OfficerAge: 47 Independent: No Years of service: 4
Term of office
Stuart Irving was appointed Chief Executive Officer and President of Computershare on 1 July 2014. He joined Computershare in 1998.
Skills and experience
Stuart held a number of roles at The Royal Bank of Scotland before joining Computershare as IT Development Manager in the UK.
Stuart subsequently worked in South Africa, Canada and the US before becoming Chief Information Officer for North America in 2005 and then the Computershare Group’s Chief Information Officer in 2008.
Board Committee membership
Member of the Nomination Committee Member of the Acquisitions Committee
Christopher John Morris
Position: Non-Executive DirectorAge: 70 Independent: No Years of service: 40
Term of office
Chris Morris and an associate established Computershare in 1978. He was appointed Chief Executive Officer in 1990 and oversaw the listing of Computershare on the ASX in 1994.
Chris became the Group’s Executive Chairman in November 2006 and relinquished his executive responsibilities in September 2010 and subsequently stood down as Chairman in November 2015.
Chris was last re-elected in 2015.
Skills and experience
Chris has worked across the global securities industry for more than 30 years. His knowledge, long-term strategic vision and passion for the industry have been instrumental in transforming Computershare from an Australian business into a successful global public company.
Other directorships and offices
Non-Executive Chairman of Smart Parking Limited (appointed in March 2009)Non-Executive Chairman of DTI Limited (appointed in June 2011)
Board Committee memberships
Chairman of the Acquisitions Committee Member of the Nomination Committee
THE DIRECTORS
As at the date of this Annual Report, the Board composition (with details of the professional background of each director) is as follows:
28
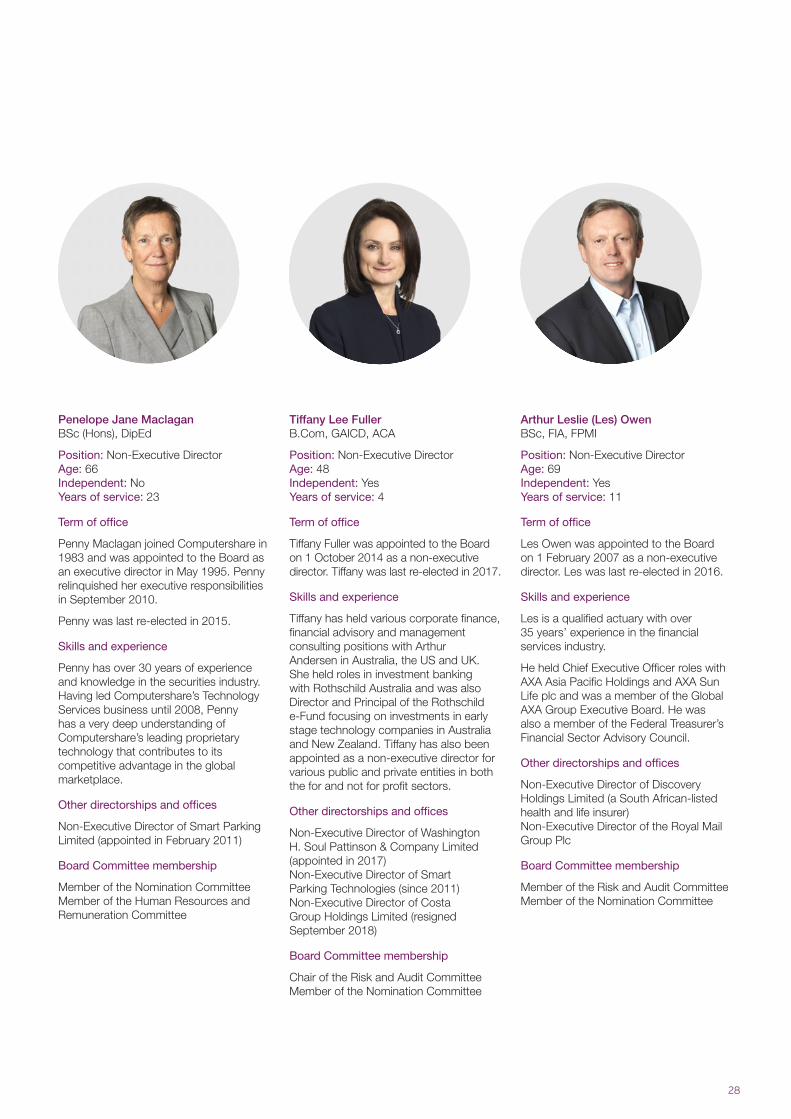
Penelope Jane Maclagan BSc (Hons), DipEd
Position: Non-Executive DirectorAge: 66 Independent: No Years of service: 23
Term of office
Penny Maclagan joined Computershare in 1983 and was appointed to the Board as an executive director in May 1995. Penny relinquished her executive responsibilities in September 2010.
Penny was last re-elected in 2015.
Skills and experience
Penny has over 30 years of experience and knowledge in the securities industry. Having led Computershare’s Technology Services business until 2008, Penny has a very deep understanding of Computershare’s leading proprietary technology that contributes to its competitive advantage in the global marketplace.
Other directorships and offices
Non-Executive Director of Smart Parking Limited (appointed in February 2011)
Board Committee membership
Member of the Nomination Committee Member of the Human Resources and Remuneration Committee
Tiffany Lee Fuller B.Com, GAICD, ACA
Position: Non-Executive DirectorAge: 48 Independent: Yes Years of service: 4
Term of office
Tiffany Fuller was appointed to the Board on 1 October 2014 as a non-executive director. Tiffany was last re-elected in 2017.
Skills and experience
Tiffany has held various corporate finance, financial advisory and management consulting positions with Arthur Andersen in Australia, the US and UK. She held roles in investment banking with Rothschild Australia and was also Director and Principal of the Rothschild e-Fund focusing on investments in early stage technology companies in Australia and New Zealand. Tiffany has also been appointed as a non-executive director for various public and private entities in both the for and not for profit sectors.
Other directorships and offices
Non-Executive Director of Washington H. Soul Pattinson & Company Limited (appointed in 2017) Non-Executive Director of Smart Parking Technologies (since 2011)Non-Executive Director of Costa Group Holdings Limited (resigned September 2018)
Board Committee membership
Chair of the Risk and Audit Committee Member of the Nomination Committee
Arthur Leslie (Les) Owen BSc, FIA, FPMI
Position: Non-Executive DirectorAge: 69 Independent: Yes Years of service: 11
Term of office
Les Owen was appointed to the Board on 1 February 2007 as a non-executive director. Les was last re-elected in 2016.
Skills and experience
Les is a qualified actuary with over 35 years’ experience in the financial services industry.
He held Chief Executive Officer roles with AXA Asia Pacific Holdings and AXA Sun Life plc and was a member of the Global AXA Group Executive Board. He was also a member of the Federal Treasurer’s Financial Sector Advisory Council.
Other directorships and offices
Non-Executive Director of Discovery Holdings Limited (a South African-listed health and life insurer)Non-Executive Director of the Royal Mail Group Plc
Board Committee membership
Member of the Risk and Audit Committee Member of the Nomination Committee
29 Computershare Annual Report 2018
CORPORATE GOVERNANCE STATEMENT
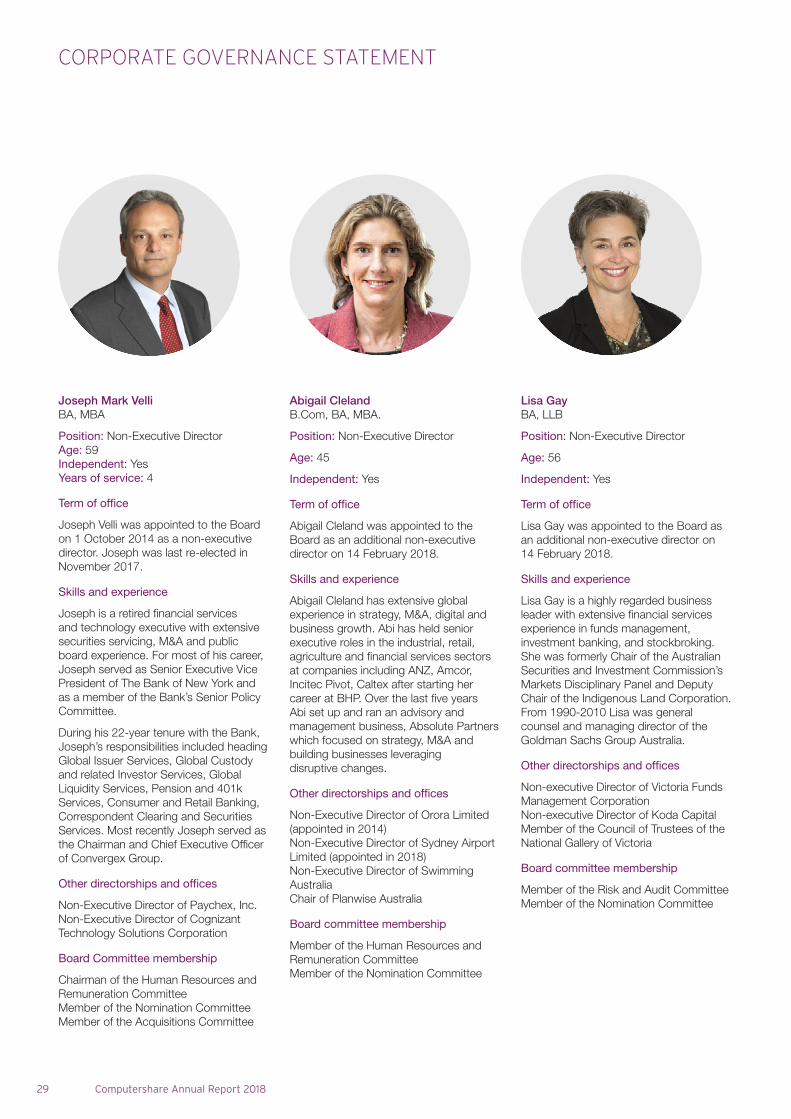
Joseph Mark Velli BA, MBA
Position: Non-Executive DirectorAge: 59 Independent: Yes Years of service: 4
Term of office
Joseph Velli was appointed to the Board on 1 October 2014 as a non-executive director. Joseph was last re-elected in November 2017.
Skills and experience
Joseph is a retired financial services and technology executive with extensive securities servicing, M&A and public board experience. For most of his career, Joseph served as Senior Executive Vice President of The Bank of New York and as a member of the Bank’s Senior Policy Committee.
During his 22-year tenure with the Bank, Joseph’s responsibilities included heading Global Issuer Services, Global Custody and related Investor Services, Global Liquidity Services, Pension and 401k Services, Consumer and Retail Banking, Correspondent Clearing and Securities Services. Most recently Joseph served as the Chairman and Chief Executive Officer of Convergex Group.
Other directorships and offices
Non-Executive Director of Paychex, Inc.Non-Executive Director of Cognizant Technology Solutions Corporation
Board Committee membership
Chairman of the Human Resources and Remuneration Committee Member of the Nomination CommitteeMember of the Acquisitions Committee
Abigail Cleland B.Com, BA, MBA.
Position: Non-Executive Director
Age: 45
Independent: Yes
Term of office
Abigail Cleland was appointed to the Board as an additional non-executive director on 14 February 2018.
Skills and experience
Abigail Cleland has extensive global experience in strategy, M&A, digital and business growth. Abi has held senior executive roles in the industrial, retail, agriculture and financial services sectors at companies including ANZ, Amcor, Incitec Pivot, Caltex after starting her career at BHP. Over the last five years Abi set up and ran an advisory and management business, Absolute Partners which focused on strategy, M&A and building businesses leveraging disruptive changes.
Other directorships and offices
Non-Executive Director of Orora Limited (appointed in 2014)Non-Executive Director of Sydney Airport Limited (appointed in 2018)Non-Executive Director of Swimming AustraliaChair of Planwise Australia
Board committee membership
Member of the Human Resources and Remuneration Committee Member of the Nomination Committee
Lisa Gay BA, LLB
Position: Non-Executive Director
Age: 56
Independent: Yes
Term of office
Lisa Gay was appointed to the Board as an additional non-executive director on 14 February 2018.
Skills and experience
Lisa Gay is a highly regarded business leader with extensive financial services experience in funds management, investment banking, and stockbroking. She was formerly Chair of the Australian Securities and Investment Commission’s Markets Disciplinary Panel and Deputy Chair of the Indigenous Land Corporation. From 1990-2010 Lisa was general counsel and managing director of the Goldman Sachs Group Australia.
Other directorships and offices
Non-executive Director of Victoria Funds Management CorporationNon-executive Director of Koda CapitalMember of the Council of Trustees of the National Gallery of Victoria
Board committee membership
Member of the Risk and Audit Committee Member of the Nomination Committee
30
3. BOARD INDEPENDENCE
The Board has considered each of the nine directors in office as at the date of this Annual Report and has determined that a majority (six out of nine) are independent, and were so throughout the reporting period. The three directors who are not considered to be independent are Chris Morris, Penny Maclagan and Stuart Irving due to their past or present involvement in the senior management of the Company and, in the case of Chris Morris, his substantial shareholding in the Company.
To determine the independence of a director, the Board has to consider a number of different factors, including those set out below:
> whether the director acts (or has recently acted) in an executive capacity for the Company
> the materiality of the director’s shareholding in the Company (if any)
> the existence of any other material relationship between the director and a member of the Group (for example, where the director is or has been an officer of a significant adviser, supplier or customer)
> the ability of the director to exercise his or her judgement independently
In relation to the Chairman, Simon Jones, the Board notes that he was first appointed as a non-executive director in November 2005 and subsequently as Chairman in November 2015. The Board has considered and is satisfied that Mr Jones’s tenure as a director does not have any impact on his capacity to bring an independent judgement to bear on issues before the Board or to act in the best interests of the Company and its shareholders generally.
4. BOARD MEETINGS AND REPORTS
The Board met in person on four occasions in the reporting period. In-person meetings will generally take place over three days and provide the Board with the opportunity to meet the senior management in the region where the meeting is held, so that the Board visits all of the Group management team in person over the year. At its meetings, the Board will also discuss the Group’s results, prospects and short and long-term strategy, as well as other matters, including operational performance and legal, governance and compliance issues. The Board also convened six other meetings by telephone during the reporting period. These additional meetings included specific meetings to consider and ultimately approve an acquisition agreement that the Group entered into during the year.
Group management provides monthly reports to the Board detailing current financial information concerning the Group. Management also provides additional information on matters of interest to the Board, including operational performance, major initiatives and the Group’s risk profile, as appropriate.
The Committees of the Board also meet regularly to fulfil their duties, as discussed further below.
5. BOARD COMMITTEES
To assist in discharging its responsibilities, the Board has established four committees.
Risk and Audit Committee
The principal function of the Risk and Audit Committee is to provide assistance to the Board in fulfilling its corporate governance and oversight responsibilities in relation to the Company’s financial reporting, internal control structure, risk management systems, internal audit function and external audit requirements.
The Risk and Audit Committee is chaired by Non-Executive Director Tiffany Fuller. The Committee currently has three other members, Simon Jones, Lisa Gay and Les Owen. Each member of this Committee is considered by the Board to be independent.
The Board regards these members as having the required financial expertise and an appropriate understanding of the markets in which the Group operates. The Chief Executive Officer, the Chief Financial Officer, the Group Head of Internal Audit, the Group Risk Officer and the Company’s external auditors are invited to meetings of the Risk and Audit Committee at the Committee’s discretion.
The Risk and Audit Committee is governed by a Board-approved charter. A copy of this Risk and Audit Committee Charter is available from http://www.computershare.com/governance.
Nomination Committee
The main functions of the Nomination Committee are to review the competence, expertise, performance, constitution and succession of the Board, as well as the performance of individual directors.
The Nomination Committee generally meets on each occasion that the Board meets in person. All current directors are members of the Nomination Committee and it is chaired by Simon Jones in his capacity as Chairman of the Board.
The Nomination Committee’s policy for the appointment of directors is to select candidates whose skills, expertise, qualifications, networks and knowledge of the markets in which Computershare operates (and other markets into which it may expand) complement those of existing Board members so that the Board as a whole has the requisite skills, diversity and experience to fulfil its duties.
The Nomination Committee is governed by a Board-approved charter. A copy of this Nomination Committee Charter is available from http://www.computershare.com/governance.
31 Computershare Annual Report 2018
CORPORATE GOVERNANCE STATEMENT
Human Resources and Remuneration Committee
The Human Resources and Remuneration Committee’s principal functions are to advise the Board on matters relating to human resources, talent management and diversity as well as the remuneration of the Group’s key management personnel.
In relation to remuneration related matters, the Committee considers, reviews and makes recommendations to the Board about the following matters:
> the Chief Executive Officer’s remuneration policy recommendations
> remuneration and contract terms for the Chief Executive Officer and the Group’s key management personnel
> terms and conditions of long-term incentive plans, short-term incentive plans, share rights plans, performance targets and bonus payments for the Chief Executive Officer and the Group’s key management personnel
> terms and conditions of any employee incentive plans
> the recommendations of the Chief Executive Officer on offers to executives under any long-term incentive plan established by the Company from time to time
> remuneration of non-executive directors within the limits approved by shareholders
> content of the remuneration report to be included in the Company’s Annual Report
> In relation to human resources and related matters, the Committee considers, reviews and makes recommendations to the Board about the following matters:
> succession planning for senior management and development frameworks for key talent;
> the effectiveness of the Group’s diversity policies and initiatives;
> monitoring surveys conducted by the company in relation to the culture of the organisation; assessing performance against measurable objectives for achieving diversity on an annual basis, including the relative proportion of women at all levels; and Computershare’s compliance with external reporting requirements.
The Committee is chaired by Joseph Velli. The Committee currently has three other members, Simon Jones, Penny Maclagan and Abigail Cleland. Pursuant to its Charter, the Committee must always be comprised of a majority of independent directors.
The Human Resources and Remuneration Committee met on three occasions during the reporting period. The Committee has access to Group management and, where necessary, may consult independent experts to discharge its responsibilities effectively.
The Human Resources and Remuneration Committee is governed by a Board-approved charter. A copy of this Remuneration Committee Charter is available from http://www.computershare.com/governance.
Acquisitions Committee
To assist in fulfilling its corporate governance and oversight responsibilities with respect to prospective acquisitions and divestitures being considered by the Group, the Board has established an Acquisitions Committee. The Committee receives reports from Group management on acquisition and divestiture opportunities and provides advice on matters such as the price, terms, structure and strategic management of such opportunities. The Committee is also authorised to approve transactions to be entered into by Group companies, provided that it does so within the scope of authority delegated to the Committee by the Board from time to time.
The Acquisitions Committee comprises Simon Jones, Joseph Velli and Chris Morris as well as Stuart Irving and Mark Davis (the Group’s Chief Financial Officer).
For details of directors’ attendance at Committee meetings, see the Directors’ Report, which starts on page 38 of this Annual Report.
6. EQUITY PARTICIPATION BY NON-EXECUTIVE DIRECTORS
The Board encourages non-executive directors to own shares in the Company, however the Company has not awarded shares to non-executive directors. As at 30 June 2018, all non-executive directors held a relevant interest in shares in the Company.
7. REMUNERATION
For information relating to the Group’s remuneration practices, and details relating to the directors’ remuneration and that of the Group’s key management personnel during the year ended 30 June 2018, see the Remuneration Report, which starts on page 41 of this Annual Report and is incorporated into this corporate governance statement by reference.
In addition to the disclosures contained in the Remuneration Report, it should be noted that the Board is keen to encourage equity holdings in the Company by employees with a view to aligning staff and shareholder interests. Many employees have participated (and continue to participate) in the various equity plans offered by the Company, and the directors believe that, historically, this has contributed significantly to the Group’s success.
32
8. ANNUAL REVIEW OF BOARD AND GROUP MANAGEMENT PERFORMANCE
The Board’s performance is regularly reviewed by the directors of the Company as a whole. These reviews are undertaken in an open manner each time the Board meets in person. There is a standing agenda item at each in-person Board meeting for directors to be given an opportunity to discuss any concerns they may have with the Board’s and its Committees’ performance as well as any steps that can be taken to maintain their effectiveness.
Directors also completed a questionnaire relating to Board and Committee performance during the reporting period and the Board then reviewed and discussed the responses. The directors believe that this process works well for its size and composition.
The process for evaluating the performance of individual directors is an informal one. The Chairman is responsible for engaging directly with directors on any individual performance concerns. Directors are able to raise concerns they might have with an individual director’s performance directly with the Chairman.
The Board annually reviews the Chief Executive Officer’s performance while the Chief Executive Officer annually reviews the performance of the other members of Group management against their KPIs for the year. This review process results in each member of Group management receiving a proposed numerical rating which determines their short-term incentive outcomes for the year. The proposed rating given to each member of Group management is then reviewed by the Human resources and Remuneration Committee.
The Risk and Audit Committee also undertakes an annual review of its performance. The review comprises completion of a questionnaire by the individual members of the Committee and a review by the Committee of the responses.
9. IDENTIFYING AND MANAGING BUSINESS RISKS
The Business Strategies and Prospects section of this Annual Report contains a summary of Computershare’s approach to managing risk within the organisation.
In respect of the reporting period, the Board received a report from the Chief Executive Officer and the Chief Financial Officer that confirms, among other things, the following:
> The ‘Declaration to the Board of Directors of Computershare Limited’, a copy of which is included in this Annual Report (see page 107) as required by section 295A of the Corporations Act 2001, is founded on a sound risk management and internal control system that is operating effectively in all material respects in relation to financial reporting risks.
> The Group’s material business risks have been managed effectively.
The Risk and Audit Committee also undertook a review of the Group’s risk management framework during the reporting period and was satisfied that it remained sound.
10. DIVERSITY AND INCLUSION
This summary outlines our progress during FY2018 and covers our focus areas for FY2019.
Progress during FY2018
At a global level, we have undertaken significant work on the development of our three year strategic plan with the assistance of an external consultant based in Melbourne. This has included interviews with a broad range of executives around the globe. We will be rolling this plan, including metrics, out across our employee population by the end of 2018.
We have held regular meetings of our global network of senior management level country-based D&I champions. This group is responsible for ensuring that the company’s D&I policy and specific global objectives are carried forward at a local level, taking into account country specific laws and regulations, and is chaired jointly by two global executive management team members.
Other global achievements include:
> Exceeded 30% female representation on our global Board of Directors
> Introduced our first mandatory D&I training for all employees with more to follow in FY2019
> Supported International Women’s Day (IWD) and saw 32 offices collect more than 3000 items of clothing for donation to Dress for Success, a charity that supports disadvantaged women with clothing that enables them to go for an interview and to start work, regardless of their financial situation. This year we added to our IWD activities with a programme of talks, networking events (including one for clients in the UK) and profiling of successful CPU women
> Supported Pride month and made free rainbow ‘support’ badges available in a large number of offices, as well as using internal communications channels to increase awareness of the LGBTQ+ community
> Regular D&I communications via CPUniverse, our global all staff digital newsletter including a cultural diversity piece aligned with May the 4th, Star Wars day
We continue to make progress on our local D&I initiatives with the UK, Australia and the US (the countries with the largest employee populations) engaged in the most specific and notable programs to drive change.
> The US has completed unconscious bias training and workshops for all senior managers with positive feedback
> In Canada, we have become an employer party with the Canadian Centre for Diversity and Inclusion (CCDI). CCDI provides innovative and proven strategies, research, tools, and educational support for local employees, with the goal of helping improve the overall inclusivity of the Canadian workforce.
33 Computershare Annual Report 2018
CORPORATE GOVERNANCE STATEMENT
> In Australia we:
> Ran unconscious bias and inclusive leader workshops for senior leaders
> Introduced a “pulse check” program to regularly track our progress on inclusive leadership
> Continued to run staff information sessions on a range of issues, such as mental health and wellbeing, and domestic violence on White Ribbon Day.
> The UK
> Had its first women’s career event, with senior women speaking about their careers and offering support to women working in Computershare
> Released its first report on gender pay and bonus
> Launched a new flexible working policy and guidance for managers, increasing awareness and take up of flexible working.
Feedback on measurable objectives
Objectives Measurement Update
1. Building on the 12 quick wins work with an external partner to draw up a global D&I plan for the next 5 years
Plan to be defined and communicated to all employees by end of 2017
While noting that this objective is running behind schedule, the strategy paper was received in April 2018 and we are reviewing the recommendations provided with the intention of rolling out the plan more widely by the end of 2018.
2. Evaluate employee opinion of CPUs progress towards greater D&I with the aim of increasing scores
Scores from annual global staff survey
We ask five questions in our annual employee survey which cover D&I. Results from the survey completed December 2017 are as follows, showing a slight upward trend across the 9407 participants.
1. Computershare is progressing towards greater diversity & inclusion – up to 7.1 in FY17 from 6.9 in FY16
2. Computershare offers everyone an equal opportunity to progress – up to 6.6 from 6.4
3. Computershare respects individuals and values their differences – up to 7.1 from 6.9
4. People are made to feel included and valued within my workplace at Computershare – up to 6.6 from 6.3
5. There are opportunities to develop my career at Computershare – up to 6.2 from 5.8
3. Work towards our goal of 30% female representative at Senior Levels (CEO directs and Co Execs) by 2020
To be measured using statistics from our employee records
Please see tables below for detail. As at 30 June 2018 females represent 26% of our Senior staff (defined as CEO directs and Company Executives). This percentage is the same as at 30 June 2017.
4 Increase the amount of flexible working arrangements in place across the company
To be measured using statistics from our employee records
Flexible working policies and opportunities have been proactively promoted in many of our regions and we have seen an increase in formal flexible working arrangements during the year.
During FY2019 we will look to create a consistent definition of ‘formal flexible working arrangements’ across the various regions which will make reporting easier.
5. Maintain the number of women returning from maternity leave at 80% +. Additionally, measure and report on the retention of these women in the three years after return
To be measured using statistics from our employee records
More than 85% of women due to return from maternity leave in FY2018 did so. More than 60% of females who returned from maternity leave in FY2015 (three years ago) remain employed with Computershare.
6. Increase the number of staff filling internal vacancies through appropriate training, development and awareness of the opportunities.
To be measured using statistics from our employee records
We have increased the number of internal communications which promote the roles available to colleagues.
We have also increased the internal training and career-pathing available to employees to support them on their journey with the company.
Metrics gathered via our annual employee survey (results shown in Point 2 above) show progress against this objective.
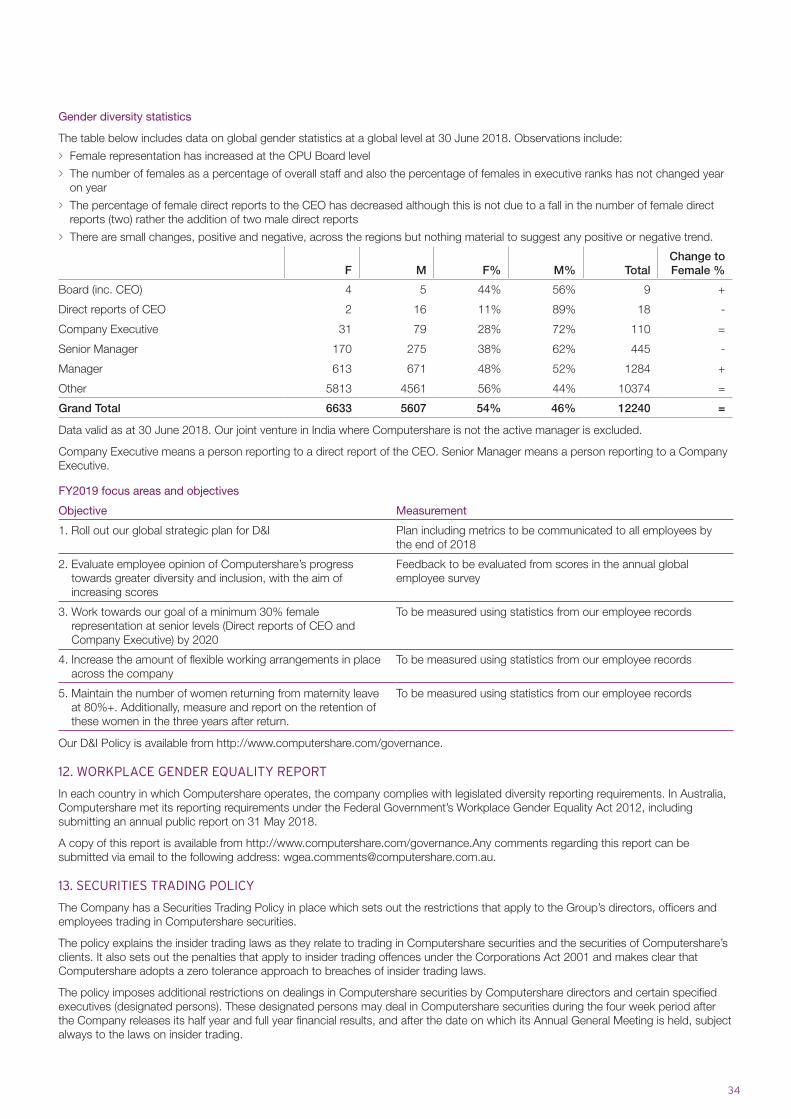
34
Gender diversity statistics
The table below includes data on global gender statistics at a global level at 30 June 2018. Observations include:
> Female representation has increased at the CPU Board level
> The number of females as a percentage of overall staff and also the percentage of females in executive ranks has not changed year on year
> The percentage of female direct reports to the CEO has decreased although this is not due to a fall in the number of female direct reports (two) rather the addition of two male direct reports
> There are small changes, positive and negative, across the regions but nothing material to suggest any positive or negative trend.
F M F% M% TotalChange to Female %
Board (inc. CEO) 4 5 44% 56% 9 +
Direct reports of CEO 2 16 11% 89% 18 -
Company Executive 31 79 28% 72% 110 =
Senior Manager 170 275 38% 62% 445 -
Manager 613 671 48% 52% 1284 +
Other 5813 4561 56% 44% 10374 =
Grand Total 6633 5607 54% 46% 12240 =
Data valid as at 30 June 2018. Our joint venture in India where Computershare is not the active manager is excluded.
Company Executive means a person reporting to a direct report of the CEO. Senior Manager means a person reporting to a Company Executive.
FY2019 focus areas and objectives
Objective Measurement
1. Roll out our global strategic plan for D&I Plan including metrics to be communicated to all employees by the end of 2018
2. Evaluate employee opinion of Computershare’s progress towards greater diversity and inclusion, with the aim of increasing scores
Feedback to be evaluated from scores in the annual global employee survey
3. Work towards our goal of a minimum 30% female representation at senior levels (Direct reports of CEO and Company Executive) by 2020
To be measured using statistics from our employee records
4. Increase the amount of flexible working arrangements in place across the company
To be measured using statistics from our employee records
5. Maintain the number of women returning from maternity leave at 80%+. Additionally, measure and report on the retention of these women in the three years after return.
To be measured using statistics from our employee records
Our D&I Policy is available from http://www.computershare.com/governance.
12. WORKPLACE GENDER EQUALITY REPORT
In each country in which Computershare operates, the company complies with legislated diversity reporting requirements. In Australia, Computershare met its reporting requirements under the Federal Government’s Workplace Gender Equality Act 2012, including submitting an annual public report on 31 May 2018.
A copy of this report is available from http://www.computershare.com/governance.Any comments regarding this report can be submitted via email to the following address: [email protected].
13. SECURITIES TRADING POLICY
The Company has a Securities Trading Policy in place which sets out the restrictions that apply to the Group’s directors, officers and employees trading in Computershare securities.
The policy explains the insider trading laws as they relate to trading in Computershare securities and the securities of Computershare’s clients. It also sets out the penalties that apply to insider trading offences under the Corporations Act 2001 and makes clear that Computershare adopts a zero tolerance approach to breaches of insider trading laws.
The policy imposes additional restrictions on dealings in Computershare securities by Computershare directors and certain specified executives (designated persons). These designated persons may deal in Computershare securities during the four week period after the Company releases its half year and full year financial results, and after the date on which its Annual General Meeting is held, subject always to the laws on insider trading.
35 Computershare Annual Report 2018
CORPORATE GOVERNANCE STATEMENT
In addition, these designated persons may only deal in Computershare securities outside those specified four week trading windows with an express prior clearance by a nominated director. During certain prohibited periods, being the period between 15 December and the Company’s release of its half year results and the period between 15 June and the Company’s release of its full year results, and such other periods as may be determined by the Board from time to time, clearance to deal can only be given in exceptional circumstances.
Under the policy, designated persons are also prohibited from entering into an arrangement pursuant to which they seek to hedge the economic risk associated with an unvested incentive award made to them by Computershare.
The list of designated persons is set out in Schedule 1 of the Securities Trading Policy. It is reviewed and updated as appropriate, having regard to any changes in the structure of or the creation of new roles within Group management. An up-to-date copy of the Board-approved Securities Trading Policy is available from http://www.computershare.com/governance.
14. CORPORATE REPORTING
The Chief Executive Officer and the Chief Financial Officer have made a Declaration to the Board of Directors in respect of the year ended 30 June 2018, as detailed on page 107 of this Annual Report. The Chief Executive Officer and the Chief Financial Officer also provided an equivalent statement to the Directors in respect of the Company’s half year report for the period ended 31 December 2017.
15. CONFLICT OF INTEREST AND INDEPENDENT ADVICE
If a director has an actual or potential conflict of interest in a matter under consideration by the Board or a Committee of the Board, that director must promptly disclose that conflict of interest and abstain from deliberations on the matter. In that circumstance, the director is not permitted to exercise any influence over other Board members or Committee members on that issue, nor receive relevant Board or Committee papers.
The Company permits any director or Committee of the Board to obtain external advice about transactions or matters of concern at the Company’s cost. Directors seeking independent advice must obtain the approval of the Chairman, who is required to act reasonably in deciding whether the request is appropriate.
16. ETHICAL STANDARDS
Computershare recognises the need for directors and employees to perform to the highest standards of behaviour and business ethics. The Board has adopted a Code of Conduct that sets out the principles and standards with which all officers and employees are expected to comply as they perform their respective functions. The Code recognises the legal and other obligations that the Company has to legitimate stakeholders, and requires that directors, officers and employees maintain the highest standards of propriety and act in accordance with the law.
A copy of the Group’s Board-approved Code of Conduct is available from the corporate governance section of http://www.computershare.com/governance.
17. SHAREHOLDER COMMUNICATIONS AND INVESTOR RELATIONS
Computershare has an investor relations program in place with the aim of facilitating effective communication between Computershare and its investors. A key feature of this program is to ensure that shareholders are notified of, or are otherwise able to access information necessary to assess Computershare’s performance. Information is communicated to shareholders through the following means:
> The Annual Report, which is distributed to all shareholders who elect to receive it. An overview of the previous financial year is also included in the Notice of AGM that all shareholders receive.
> The AGM and any other shareholder meetings called from time to time to obtain shareholder approval as required. In 2017, the Company conducted its AGM as a hybrid meeting which provided an opportunity for shareholders to attend the meeting via an online platform. Attending the meeting online enabled shareholders to view the AGM live and to also ask questions and cast direct votes at the appropriate times whilst the meeting was in progress.
> The Company’s website, which contains information regarding the Company and the Group and its corporate governance framework. The Investor Relations section of the website also includes information released to the ASX, a copy of investor and analyst briefing documentation, press releases and webcasts.
> By email to those shareholders who have supplied their email address for the purpose of receiving communications from the Company electronically. Computershare actively encourages shareholders to provide an email address to facilitate more timely and effective communication with them and runs campaigns from time to time to encourage greater email adoption.
Computershare also encourages shareholders to participate in the Company’s AGM. Shareholders who are unable to attend and vote in person at the meeting are encouraged to vote electronically via Computershare’s service known as InvestorVote, where they can view an electronic version of the voting form and accompanying materials and submit their votes. Computershare also encourages shareholders who are unable to attend the AGM to communicate any issues or questions by writing to the Company.
36
18. COMMITMENT TO AN INFORMED MARKET RELATING TO COMPUTERSHARE SECURITIES
The Board has a Market Disclosure Policy to ensure the fair and timely disclosure of price-sensitive information to the investment community as required by applicable law.
In order to effectively manage its continuous disclosure obligations, the Chief Executive Officer has established a Disclosure Committee which is responsible for the following matters:
> considering what information needs to be released to the market by Computershare, although routine administrative announcements may be made by the Company Secretary without consulting the Disclosure Committee
> ensuring announcements relating to significant matters are referred to the Board for consideration and approval, namely announcements relating to the Company’s half and full year financial reports, financial projections and future financial performance as well as changes to the Group’s policy or strategy
> approving the disclosure of information to the market for matters not referred to the Board
> implementing adequate systems for ensuring timely disclosure of material information to the market, including where such information needs to be released urgently
The Disclosure Committee consists of the Chief Executive Officer, the Chief Financial Officer, the Head of Investor Relations and the Company Secretary. Where the urgency of an issue, which under the policy is to be referred to the Board, prevents its consideration by the full Board, an announcement relating to that issue may be approved for release to the market by all available directors in conjunction with the Disclosure Committee.
Further, in circumstances where it is considered appropriate to request a trading halt (for example, where Computershare is required to disclose information to the market, but for whatever reason is unable to do so promptly and without delay) the Chief Executive Officer, or if the Chief Executive Officer is unavailable, the Chairman or the Chief Financial Officer, is authorised to request a trading halt on behalf of the Company. The full Board is to be consulted as far as is practicable on any request for a trading halt.
A copy of the Board-approved Market Disclosure Policy is available from the corporate governance section of http://www.computershare.com/governance.
19. EXTERNAL AUDITORS
The Company’s policy is to appoint external auditors who demonstrate professional ability and independence. The auditor’s performance is reviewed annually.
PricewaterhouseCoopers were appointed as the external auditors in May 2002. Audit services have been put out to tender since their initial appointment.
PricewaterhouseCoopers normally rotates audit engagement partners on listed companies every five years. It is also PricewaterhouseCoopers’ policy to provide an annual declaration of independence, a copy of which can be found on page 55 of this Annual Report. The external auditor is required to attend the Company’s Annual General Meeting and be available to answer shareholder questions about the conduct of the audit and the preparation of the content of the audit report, the accounting policies adopted by the Company in relation to the preparation of the financial statements and the independence of the auditor in relation to the conduct of the audit.
An analysis of fees paid to the external auditors, including a breakdown of fees for non-audit services, is provided in the Directors’ Report (see page 54 of this Annual Report).
20. INTERNAL AUDITORS
Computershare has a dedicated Group Internal Audit function. The function is led by the Group Head of Internal Audit who has a reporting line to the Chairman of the Risk and Audit Committee. Group Internal Audit is authorised to audit all areas of the Computershare Group without the need for prior approval. In carrying out its responsibilities, it has full and unrestricted access to all records, property, functions, IT systems and staff in the Group.
Each financial year, the function develops an annual audit plan which is approved by the Risk and Audit Committee. The function’s key responsibilities are to review and appraise the adequacy, design and effectiveness of the Group’s system of internal controls and evaluate and improve the effectiveness of risk management, control and governance processes and to identify control gaps.
On completion of audit assignments, Internal Audit will issue written reports which are distributed to management and communicated to the Risk and Audit Committee. Where the report identifies specific findings and recommendations, the report will include an action plan from management to implement appropriate corrective action within specific timeframes which are actively monitored. All internal audits are conducted in accordance with the Institute of Internal Auditor’s Standards for the Professional Practice of Internal Auditing.
21. WHISTLEBLOWING
The Board has approved a Whistleblower Policy that specifically outlines procedures for dealing with allegations of improper conduct made by directors, officers or employees of the Company or parties external to Computershare. Concerns can be raised anonymously in a number of ways, including through the Company’s online whistleblower reporting system, by telephone or by mail. Any reported concerns are assessed and handled by regional Whistleblower officers. The Group Whistleblower Officer also provides quarterly reports to the Group Risk and Audit Committee on any concerns reported over the period.
All Computershare employees have received training about the Company’s Whistleblower Policy, including how to detect and report improper conduct. A copy of the Whistleblower Policy is available from http://www.computershare.com/whistleblowing.
37 Computershare Annual Report 2018
CORPORATE GOVERNANCE STATEMENT
22. CORPORATE RESPONSIBILITY
For details relating to the Company’s corporate responsibility initiatives, see pages 15 to 18 of this Annual Report.
A copy of the Board-approved Corporate Responsibility Policy is also available from the corporate governance section of http://www.computershare.com/governance.
23. HEALTH AND SAFETY
Computershare aims to provide and maintain a safe and healthy work environment. Computershare acts to meet this commitment by implementing work practices and procedures throughout the Group that comply with the relevant regulations governing workplaces in each country in which the Group operates. Employees are expected to take all practical measures to ensure a safe and healthy working environment, in keeping with their defined responsibilities and applicable laws.
24. COMPANY SECRETARY
The Company Secretary during the reporting period was Dominic Horsley. Under Computershare’s Constitution, the appointment and removal of the Company Secretary is a matter for the Board.
Among other matters, the Company Secretary advises the Board on governance procedures and supports their effectiveness by monitoring Board policy and procedures, coordinating the completion and dispatch of Board meeting agendas and papers and assisting with the induction of new Directors. The Company Secretary is accountable to the Board, through the Chairman, for these responsibilities.
Dominic Horsley joined the Company in June 2006, having previously practised law at one of Asia Pacific’s leading law firms and worked as a Corporate Counsel with a major listed Australian software and services supplier. Dominic completed a Bachelor of Arts (Hons) in Economics at the University of Cambridge and completed his legal studies at the College of Law in London. Dominic is also the Chief Legal Counsel for the Group’s Asia Pacific operations and is a Fellow of the Governance Institute of Australia.
All directors have access to the advice and services of the Company Secretary.
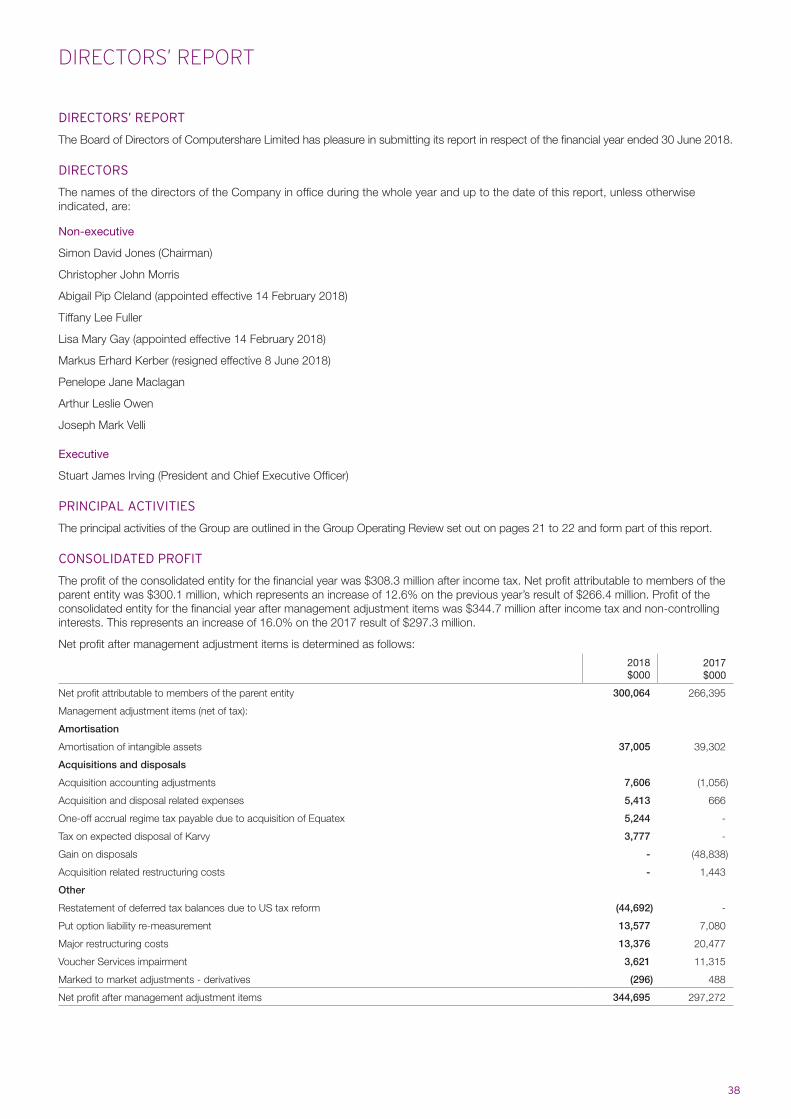
38
DIRECTORS’ REPORT
The Board of Directors of Computershare Limited has pleasure in submitting its report in respect of the financial year ended 30 June 2018.
DIRECTORS
The names of the directors of the Company in office during the whole year and up to the date of this report, unless otherwise indicated, are:
Non-executive
Simon David Jones (Chairman)
Christopher John Morris
Abigail Pip Cleland (appointed effective 14 February 2018)
Tiffany Lee Fuller
Lisa Mary Gay (appointed effective 14 February 2018)
Markus Erhard Kerber (resigned effective 8 June 2018)
Penelope Jane Maclagan
Arthur Leslie Owen
Joseph Mark Velli
Executive
Stuart James Irving (President and Chief Executive Officer)
PRINCIPAL ACTIVITIES
The principal activities of the Group are outlined in the Group Operating Review set out on pages 21 to 22 and form part of this report.
CONSOLIDATED PROFIT
The profit of the consolidated entity for the financial year was $308.3 million after income tax. Net profit attributable to members of the parent entity was $300.1 million, which represents an increase of 12.6% on the previous year’s result of $266.4 million. Profit of the consolidated entity for the financial year after management adjustment items was $344.7 million after income tax and non-controlling interests. This represents an increase of 16.0% on the 2017 result of $297.3 million.
Net profit after management adjustment items is determined as follows: 2018
$0002017$000
Net profit attributable to members of the parent entity 300,064 266,395
Management adjustment items (net of tax):
Amortisation
Amortisation of intangible assets 37,005 39,302
Acquisitions and disposals
Acquisition accounting adjustments 7,606 (1,056)
Acquisition and disposal related expenses 5,413 666
One-off accrual regime tax payable due to acquisition of Equatex 5,244 -
Tax on expected disposal of Karvy 3,777 -
Gain on disposals - (48,838)
Acquisition related restructuring costs - 1,443
Other
Restatement of deferred tax balances due to US tax reform (44,692) -
Put option liability re-measurement 13,577 7,080
Major restructuring costs 13,376 20,477
Voucher Services impairment 3,621 11,315
Marked to market adjustments - derivatives (296) 488
Net profit after management adjustment items 344,695 297,272
DIRECTORS’ REPORT
DIRECTORS’ REPORT
39 Computershare Annual Report 2018
Management adjustment items
Management results are used, along with other measures, to assess operating business performance. The Group believes that exclusion of certain items permits better analysis of the Group’s performance on a comparative basis and provides a better measure of underlying operating performance. Description of management adjustment items can be found in note 4 of the financial statements.
The non-IFRS financial information contained within this Directors’ report has not been audited in accordance with the Australian Auditing Standards.
DIVIDENDS
The following dividends of the consolidated entity have been paid or declared since the end of the preceding financial year:
Ordinary shares
A final dividend in respect of the year ended 30 June 2017 was declared on 16 August 2017 and paid on 18 September 2017. This was an unfranked ordinary dividend of AU 19 cents per share, amounting to AUD 103,727,282 ($80,470,502).
An interim dividend was declared on 14 February 2018 and paid on 16 March 2018. This was an unfranked ordinary dividend of AU 19 cents per share, amounting to AUD 103,137,695 ($80,013,107).
A final dividend in respect of the year ended 30 June 2018 was declared by the directors of the Company on 15 August 2018 and paid on 17 September 2018. This was a fully franked ordinary dividend of AU 21 cents per share. As the dividend was not declared until 15 August 2018, a provision was not recognised as at 30 June 2018.
REVIEW OF OPERATIONS
The review of operations is outlined in the Group Operating Review set out on pages 21 to 22 and forms part of this report.
SIGNIFICANT EVENTS AND SIGNIFICANT CHANGES IN ACTIVITIES
A discussion of significant events and significant changes in activities, if applicable, is included in the Group Operating Review set out on pages 21 to 22 and forms part of this report.
In the opinion of the directors, there were no other significant changes in the affairs of the consolidated entity during the financial year under review that are not otherwise disclosed in this report or the consolidated accounts.
SIGNIFICANT EVENTS AFTER YEAR END
No other matter or circumstance has arisen since the end of the financial year which is not otherwise dealt with in this report or in the consolidated financial statements that has significantly affected or may significantly affect the operations of the consolidated entity, the results of those operations, or the state of affairs of the consolidated entity in subsequent financial years.
LIKELY DEVELOPMENTS AND FUTURE RESULTS
A discussion of business strategies and prospects is set out on pages 23 to 24 and forms part of this report.
ENVIRONMENTAL REGULATIONS
The Computershare Group is not subject to significant environmental regulation.
INFORMATION ON DIRECTORS
The qualifications, experience and responsibilities of directors together with details of all directorships of other listed companies held by a director in the three years to 30 June 2018 and any contracts to which the director is a party to under which they are entitled to a benefit are outlined in the Corporate Governance Statement and form part of this report.
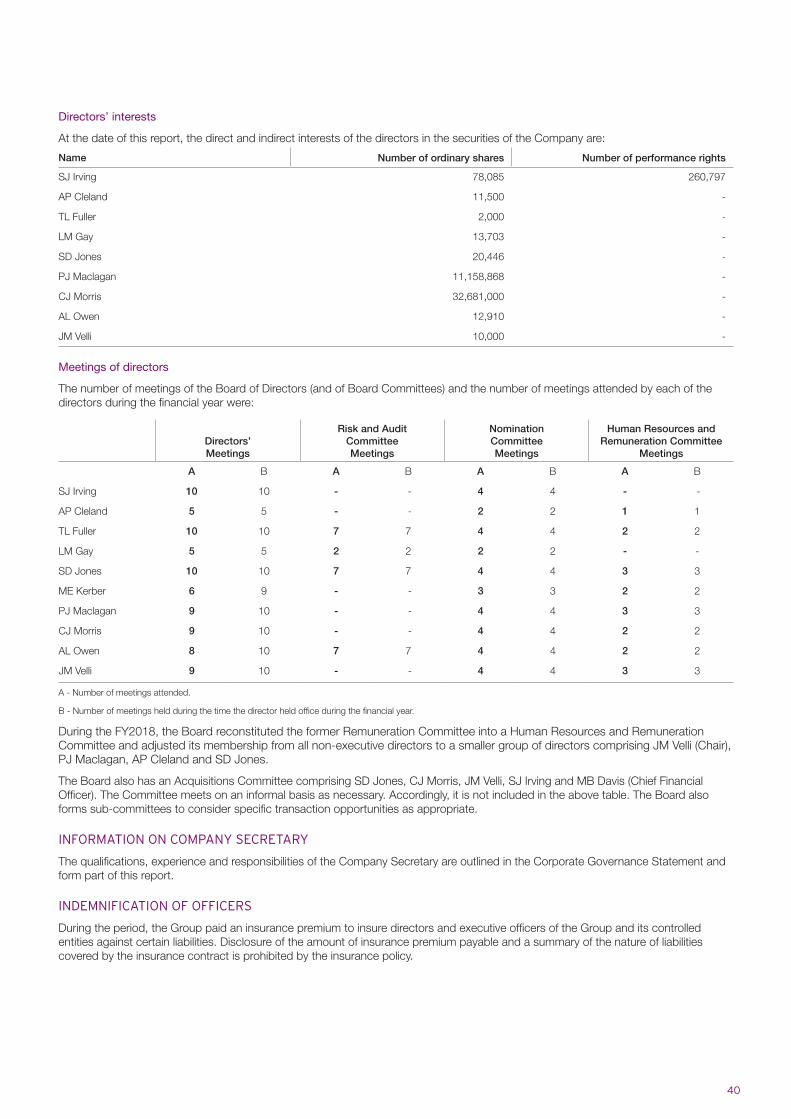
40
Directors’ interests
At the date of this report, the direct and indirect interests of the directors in the securities of the Company are:
Name Number of ordinary shares Number of performance rights
SJ Irving 78,085 260,797
AP Cleland 11,500 -
TL Fuller 2,000 -
LM Gay 13,703 -
SD Jones 20,446 -
PJ Maclagan 11,158,868 -
CJ Morris 32,681,000 -
AL Owen 12,910 -
JM Velli 10,000 -
Meetings of directors
The number of meetings of the Board of Directors (and of Board Committees) and the number of meetings attended by each of the directors during the financial year were:
Directors’Meetings
Risk and Audit Committee Meetings
Nomination CommitteeMeetings
Human Resources and Remuneration Committee
Meetings
A B A B A B A B
SJ Irving 10 10 - - 4 4 - -
AP Cleland 5 5 - - 2 2 1 1
TL Fuller 10 10 7 7 4 4 2 2
LM Gay 5 5 2 2 2 2 - -
SD Jones 10 10 7 7 4 4 3 3
ME Kerber 6 9 - - 3 3 2 2
PJ Maclagan 9 10 - - 4 4 3 3
CJ Morris 9 10 - - 4 4 2 2
AL Owen 8 10 7 7 4 4 2 2
JM Velli 9 10 - - 4 4 3 3
A - Number of meetings attended.
B - Number of meetings held during the time the director held office during the financial year.
During the FY2018, the Board reconstituted the former Remuneration Committee into a Human Resources and Remuneration Committee and adjusted its membership from all non-executive directors to a smaller group of directors comprising JM Velli (Chair), PJ Maclagan, AP Cleland and SD Jones.
The Board also has an Acquisitions Committee comprising SD Jones, CJ Morris, JM Velli, SJ Irving and MB Davis (Chief Financial Officer). The Committee meets on an informal basis as necessary. Accordingly, it is not included in the above table. The Board also forms sub-committees to consider specific transaction opportunities as appropriate.
INFORMATION ON COMPANY SECRETARY
The qualifications, experience and responsibilities of the Company Secretary are outlined in the Corporate Governance Statement and form part of this report.
INDEMNIFICATION OF OFFICERS
During the period, the Group paid an insurance premium to insure directors and executive officers of the Group and its controlled entities against certain liabilities. Disclosure of the amount of insurance premium payable and a summary of the nature of liabilities covered by the insurance contract is prohibited by the insurance policy.
DIRECTORS’ REPORT
41 Computershare Annual Report 2018
REMUNERATION REPORT
This report covers:
A. Remuneration strategy
B. A summary of key remuneration highlights in the current financial year
C. The structure of remuneration at Computershare
D. Details of remuneration and service contracts
E. Proportions of fixed and performance related remuneration
F. Other information
A. REMUNERATION STRATEGY
Computershare’s remuneration strategy for its executive staff is designed to:
> Be competitive in the local employment market where an executive is based so as to support the attraction and retention of a talented executive team
> Motivate executives to deliver excellent performance
> Align remuneration outcomes for executives with the interests of shareholders
Computershare’s remuneration strategy and structure is reviewed by the Board and the Human Resources and Remuneration Committee on an ongoing basis for its appropriateness and effectiveness.
B. A SUMMARY OF KEY REMUNERATION HIGHLIGHTS IN FY2018
Set out below are some of the key remuneration outcomes that occurred in relation to FY2018:
> FY2018 was a record earnings year for Computershare with management EPS up 14.1% on a constant currency basis when compared to FY2017 and excellent financial performance was achieved across the Group’s operations. This translated into improved short-term incentive outcomes for executive management as compared to recent years.
> Long-term incentive (LTI) awards granted in FY2016 were tested against their performance hurdles across the performance period of 1 July 2015 to 30 June 2018. LTI awards subject to a relative Total Shareholder Revenue (TSR) hurdle vested at 92% of the maximum award entitlement as Computershare achieved positive TSR of 55.3% across the period and a relative TSR ranking of 71% within its comparator group.
> In relation to LTI awards subject to an EPS performance hurdle, despite the record earnings result in FY2018 and positive earnings momentum in FY2017, the threshold EPS hurdle of 5% compound annual growth had not been achieved and none of the LTIs subject to the EPS hurdle vested. FX movements had a significant adverse impact on the EPS growth results recorded over the testing period.
> Due to the record earnings result in FY2018 and also because of the successful delivery of a number of important strategic priorities to the group during FY2018, the Board determined to pay a small group of senior executives (which did not include the Group CEO) an additional one-off cash bonus outside the terms of the Group’s structured incentive programs. This discretionary payment was also made in part to recognise that the FY2016 LTI awards subject to the EPS hurdle were significantly impacted by foreign exchange movements over the performance period. These payments are included within the remuneration tables included in this report.
> There was a broad based salary increase across staff of around 2% on average.
> Computershare staff remain active participants in the various share plans offered with around 5,000 staff globally currently participating in a Computershare share plan.
CEO remuneration review
In FY2017, the Board undertook a benchmark of the Group CEO’s remuneration and, despite making an adjustment to his overall remuneration, it remained significantly below the 25th percentile when compared across a range of comparator groups. A further smaller adjustment was also made in FY2018. However, the Board has remained concerned that the CEO’s remuneration was uncompetitive, especially in view of the nature of the Group’s operations where more than 90% of the Group’s earnings are derived offshore and the CEO is currently on an expat relocation to the UK to ensure that he is in close proximity to the Group’s most material operations. The Board excludes the costs associated with this expat assignment for remuneration benchmarking purposes. The Board also believes that the CEO has provided exceptional leadership for the Group during his tenure and the record financial results in FY2018 is testament to that leadership.
Having regard to all of these factors, the Board undertook a further review of the CEO’s remuneration for FY2019 with the intention of ensuring that the CEO’s remuneration was competitive, in line with the Group’s overall remuneration strategy and appropriately rewarded the CEO for strong performance whilst ensuring outcomes remained aligned with shareholders’ objectives. The outcome of that review has resulted in a material increase to the CEO’s remuneration for FY2019, which will come into effect 1 October 2018. Fixed pay will increase by approximately 50% to AUD 1,860,000 (inclusive of superannuation). The Board also determined to reweight the CEO’s remuneration mix further towards long-term incentive and as a result the allocation across fixed pay, short-term incentive and long-term incentive will be adjusted to 30%, 30% and 40% respectively of total remuneration (based on on-target performance).
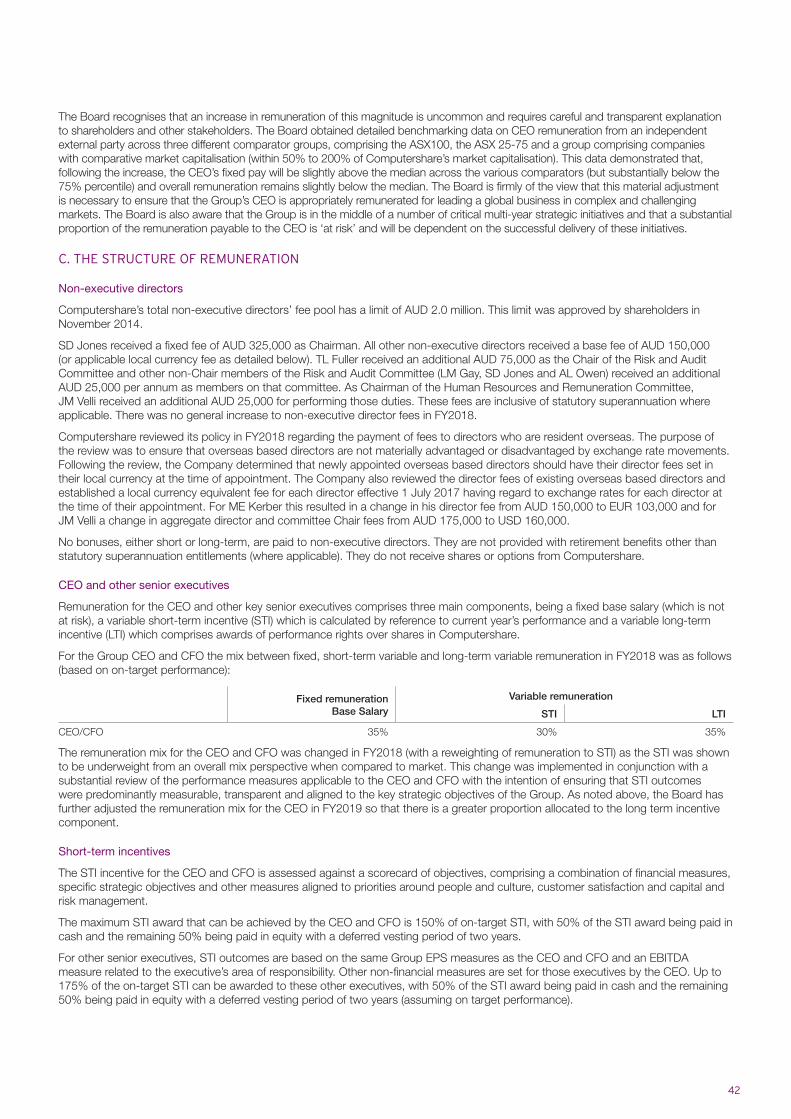
42
The Board recognises that an increase in remuneration of this magnitude is uncommon and requires careful and transparent explanation to shareholders and other stakeholders. The Board obtained detailed benchmarking data on CEO remuneration from an independent external party across three different comparator groups, comprising the ASX100, the ASX 25-75 and a group comprising companies with comparative market capitalisation (within 50% to 200% of Computershare’s market capitalisation). This data demonstrated that, following the increase, the CEO’s fixed pay will be slightly above the median across the various comparators (but substantially below the 75% percentile) and overall remuneration remains slightly below the median. The Board is firmly of the view that this material adjustment is necessary to ensure that the Group’s CEO is appropriately remunerated for leading a global business in complex and challenging markets. The Board is also aware that the Group is in the middle of a number of critical multi-year strategic initiatives and that a substantial proportion of the remuneration payable to the CEO is ‘at risk’ and will be dependent on the successful delivery of these initiatives.
C. THE STRUCTURE OF REMUNERATION
Non-executive directors
Computershare’s total non-executive directors’ fee pool has a limit of AUD 2.0 million. This limit was approved by shareholders in November 2014.
SD Jones received a fixed fee of AUD 325,000 as Chairman. All other non-executive directors received a base fee of AUD 150,000 (or applicable local currency fee as detailed below). TL Fuller received an additional AUD 75,000 as the Chair of the Risk and Audit Committee and other non-Chair members of the Risk and Audit Committee (LM Gay, SD Jones and AL Owen) received an additional AUD 25,000 per annum as members on that committee. As Chairman of the Human Resources and Remuneration Committee, JM Velli received an additional AUD 25,000 for performing those duties. These fees are inclusive of statutory superannuation where applicable. There was no general increase to non-executive director fees in FY2018.
Computershare reviewed its policy in FY2018 regarding the payment of fees to directors who are resident overseas. The purpose of the review was to ensure that overseas based directors are not materially advantaged or disadvantaged by exchange rate movements. Following the review, the Company determined that newly appointed overseas based directors should have their director fees set in their local currency at the time of appointment. The Company also reviewed the director fees of existing overseas based directors and established a local currency equivalent fee for each director effective 1 July 2017 having regard to exchange rates for each director at the time of their appointment. For ME Kerber this resulted in a change in his director fee from AUD 150,000 to EUR 103,000 and for JM Velli a change in aggregate director and committee Chair fees from AUD 175,000 to USD 160,000.
No bonuses, either short or long-term, are paid to non-executive directors. They are not provided with retirement benefits other than statutory superannuation entitlements (where applicable). They do not receive shares or options from Computershare.
CEO and other senior executives
Remuneration for the CEO and other key senior executives comprises three main components, being a fixed base salary (which is not at risk), a variable short-term incentive (STI) which is calculated by reference to current year’s performance and a variable long-term incentive (LTI) which comprises awards of performance rights over shares in Computershare.
For the Group CEO and CFO the mix between fixed, short-term variable and long-term variable remuneration in FY2018 was as follows (based on on-target performance):
Fixed remunerationBase Salary
Variable remuneration
STI LTI
CEO/CFO 35% 30% 35%
The remuneration mix for the CEO and CFO was changed in FY2018 (with a reweighting of remuneration to STI) as the STI was shown to be underweight from an overall mix perspective when compared to market. This change was implemented in conjunction with a substantial review of the performance measures applicable to the CEO and CFO with the intention of ensuring that STI outcomes were predominantly measurable, transparent and aligned to the key strategic objectives of the Group. As noted above, the Board has further adjusted the remuneration mix for the CEO in FY2019 so that there is a greater proportion allocated to the long term incentive component.
Short-term incentives
The STI incentive for the CEO and CFO is assessed against a scorecard of objectives, comprising a combination of financial measures, specific strategic objectives and other measures aligned to priorities around people and culture, customer satisfaction and capital and risk management.
The maximum STI award that can be achieved by the CEO and CFO is 150% of on-target STI, with 50% of the STI award being paid in cash and the remaining 50% being paid in equity with a deferred vesting period of two years.
For other senior executives, STI outcomes are based on the same Group EPS measures as the CEO and CFO and an EBITDA measure related to the executive’s area of responsibility. Other non-financial measures are set for those executives by the CEO. Up to 175% of the on-target STI can be awarded to these other executives, with 50% of the STI award being paid in cash and the remaining 50% being paid in equity with a deferred vesting period of two years (assuming on target performance).
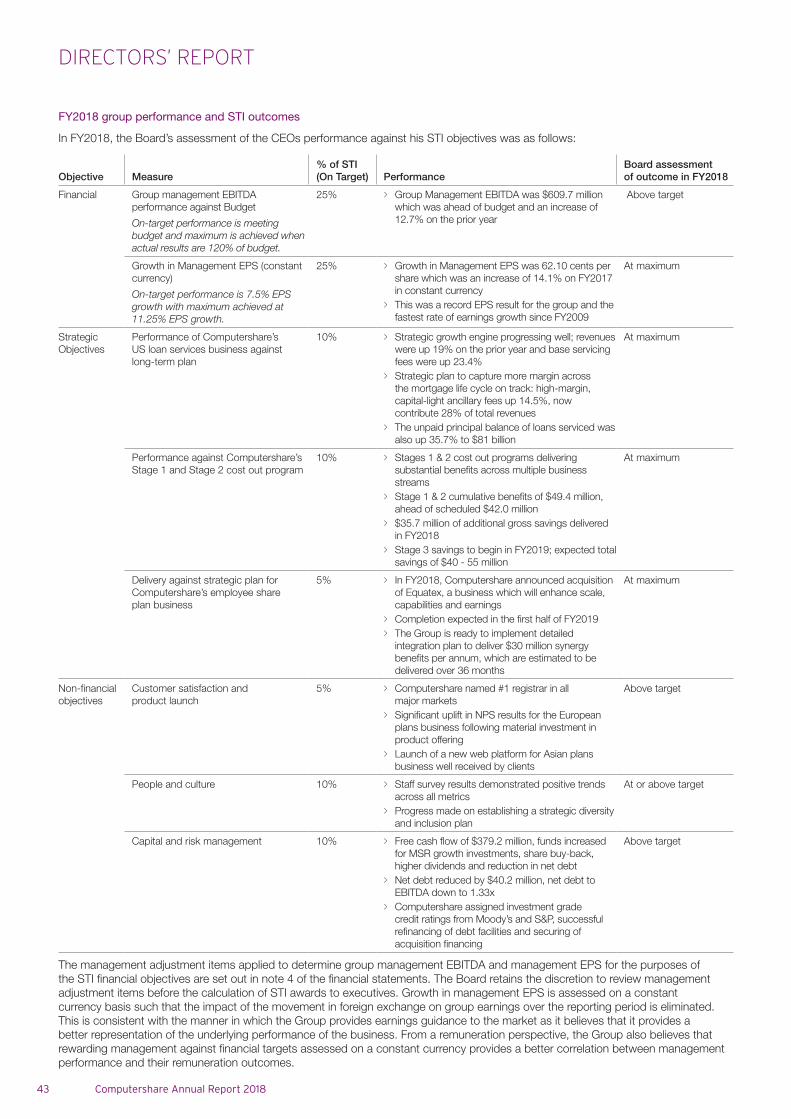
DIRECTORS’ REPORT
43 Computershare Annual Report 2018
FY2018 group performance and STI outcomes
In FY2018, the Board’s assessment of the CEOs performance against his STI objectives was as follows:
Objective Measure% of STI (On Target) Performance
Board assessment of outcome in FY2018
Financial Group management EBITDA performance against Budget
On-target performance is meeting budget and maximum is achieved when actual results are 120% of budget.
25% > Group Management EBITDA was $609.7 million which was ahead of budget and an increase of 12.7% on the prior year
Above target
Growth in Management EPS (constant currency)
On-target performance is 7.5% EPS growth with maximum achieved at 11.25% EPS growth.
25% > Growth in Management EPS was 62.10 cents per share which was an increase of 14.1% on FY2017 in constant currency
> This was a record EPS result for the group and the fastest rate of earnings growth since FY2009
At maximum
Strategic Objectives
Performance of Computershare’s US loan services business against long-term plan
10% > Strategic growth engine progressing well; revenues were up 19% on the prior year and base servicing fees were up 23.4%
> Strategic plan to capture more margin across the mortgage life cycle on track: high-margin, capital-light ancillary fees up 14.5%, now contribute 28% of total revenues
> The unpaid principal balance of loans serviced was also up 35.7% to $81 billion
At maximum
Performance against Computershare’s Stage 1 and Stage 2 cost out program
10% > Stages 1 & 2 cost out programs delivering substantial benefits across multiple business streams
> Stage 1 & 2 cumulative benefits of $49.4 million, ahead of scheduled $42.0 million
> $35.7 million of additional gross savings delivered in FY2018
> Stage 3 savings to begin in FY2019; expected total savings of $40 - 55 million
At maximum
Delivery against strategic plan for Computershare’s employee share plan business
5% > In FY2018, Computershare announced acquisition of Equatex, a business which will enhance scale, capabilities and earnings
> Completion expected in the first half of FY2019 > The Group is ready to implement detailed
integration plan to deliver $30 million synergy benefits per annum, which are estimated to be delivered over 36 months
At maximum
Non-financial objectives
Customer satisfaction and product launch
5% > Computershare named #1 registrar in all major markets
> Significant uplift in NPS results for the European plans business following material investment in product offering
> Launch of a new web platform for Asian plans business well received by clients
Above target
People and culture 10% > Staff survey results demonstrated positive trends across all metrics
> Progress made on establishing a strategic diversity and inclusion plan
At or above target
Capital and risk management 10% > Free cash flow of $379.2 million, funds increased for MSR growth investments, share buy-back, higher dividends and reduction in net debt
> Net debt reduced by $40.2 million, net debt to EBITDA down to 1.33x
> Computershare assigned investment grade credit ratings from Moody’s and S&P, successful refinancing of debt facilities and securing of acquisition financing
Above target
The management adjustment items applied to determine group management EBITDA and management EPS for the purposes of the STI financial objectives are set out in note 4 of the financial statements. The Board retains the discretion to review management adjustment items before the calculation of STI awards to executives. Growth in management EPS is assessed on a constant currency basis such that the impact of the movement in foreign exchange on group earnings over the reporting period is eliminated. This is consistent with the manner in which the Group provides earnings guidance to the market as it believes that it provides a better representation of the underlying performance of the business. From a remuneration perspective, the Group also believes that rewarding management against financial targets assessed on a constant currency provides a better correlation between management performance and their remuneration outcomes.
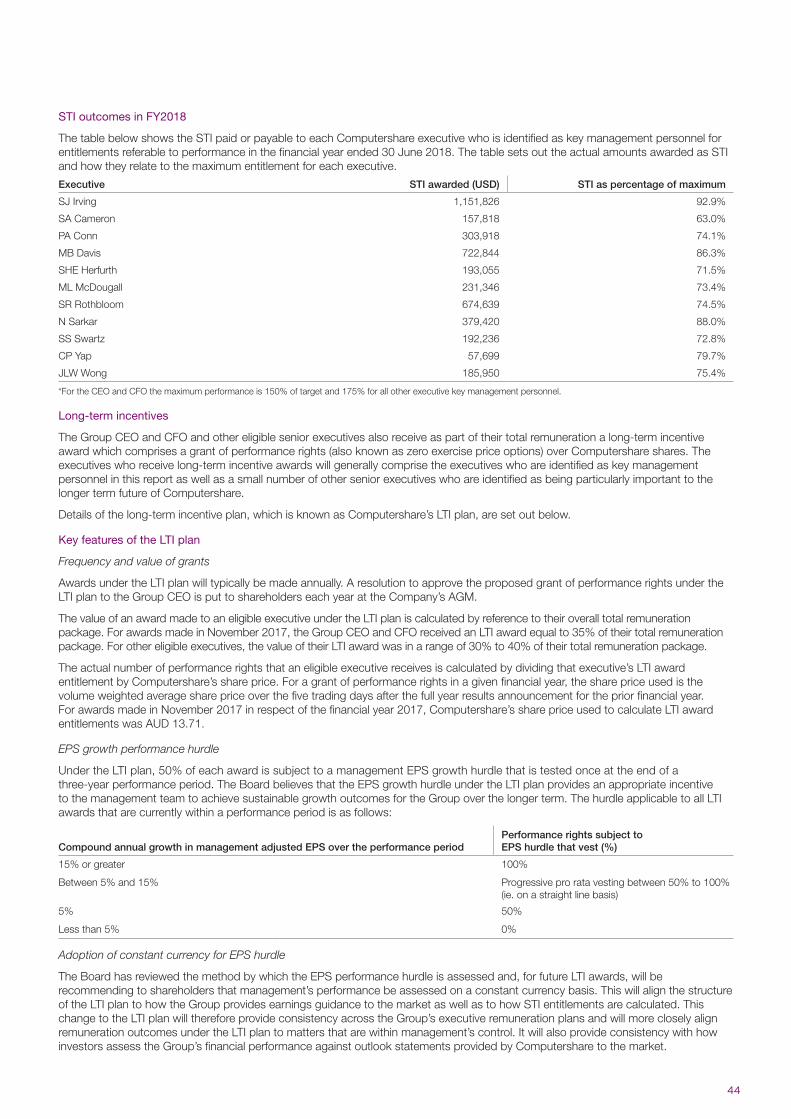
44
STI outcomes in FY2018
The table below shows the STI paid or payable to each Computershare executive who is identified as key management personnel for entitlements referable to performance in the financial year ended 30 June 2018. The table sets out the actual amounts awarded as STI and how they relate to the maximum entitlement for each executive.
Executive STI awarded (USD) STI as percentage of maximum
SJ Irving 1,151,826 92.9%
SA Cameron 157,818 63.0%
PA Conn 303,918 74.1%
MB Davis 722,844 86.3%
SHE Herfurth 193,055 71.5%
ML McDougall 231,346 73.4%
SR Rothbloom 674,639 74.5%
N Sarkar 379,420 88.0%
SS Swartz 192,236 72.8%
CP Yap 57,699 79.7%
JLW Wong 185,950 75.4%
*For the CEO and CFO the maximum performance is 150% of target and 175% for all other executive key management personnel.
Long-term incentives
The Group CEO and CFO and other eligible senior executives also receive as part of their total remuneration a long-term incentive award which comprises a grant of performance rights (also known as zero exercise price options) over Computershare shares. The executives who receive long-term incentive awards will generally comprise the executives who are identified as key management personnel in this report as well as a small number of other senior executives who are identified as being particularly important to the longer term future of Computershare.
Details of the long-term incentive plan, which is known as Computershare’s LTI plan, are set out below.
Key features of the LTI plan
Frequency and value of grants
Awards under the LTI plan will typically be made annually. A resolution to approve the proposed grant of performance rights under the LTI plan to the Group CEO is put to shareholders each year at the Company’s AGM.
The value of an award made to an eligible executive under the LTI plan is calculated by reference to their overall total remuneration package. For awards made in November 2017, the Group CEO and CFO received an LTI award equal to 35% of their total remuneration package. For other eligible executives, the value of their LTI award was in a range of 30% to 40% of their total remuneration package.
The actual number of performance rights that an eligible executive receives is calculated by dividing that executive’s LTI award entitlement by Computershare’s share price. For a grant of performance rights in a given financial year, the share price used is the volume weighted average share price over the five trading days after the full year results announcement for the prior financial year. For awards made in November 2017 in respect of the financial year 2017, Computershare’s share price used to calculate LTI award entitlements was AUD 13.71.
EPS growth performance hurdle
Under the LTI plan, 50% of each award is subject to a management EPS growth hurdle that is tested once at the end of a three-year performance period. The Board believes that the EPS growth hurdle under the LTI plan provides an appropriate incentive to the management team to achieve sustainable growth outcomes for the Group over the longer term. The hurdle applicable to all LTI awards that are currently within a performance period is as follows:
Compound annual growth in management adjusted EPS over the performance periodPerformance rights subject to EPS hurdle that vest (%)
15% or greater 100%
Between 5% and 15% Progressive pro rata vesting between 50% to 100% (ie. on a straight line basis)
5% 50%
Less than 5% 0%
Adoption of constant currency for EPS hurdle
The Board has reviewed the method by which the EPS performance hurdle is assessed and, for future LTI awards, will be recommending to shareholders that management’s performance be assessed on a constant currency basis. This will align the structure of the LTI plan to how the Group provides earnings guidance to the market as well as to how STI entitlements are calculated. This change to the LTI plan will therefore provide consistency across the Group’s executive remuneration plans and will more closely align remuneration outcomes under the LTI plan to matters that are within management’s control. It will also provide consistency with how investors assess the Group’s financial performance against outlook statements provided by Computershare to the market.
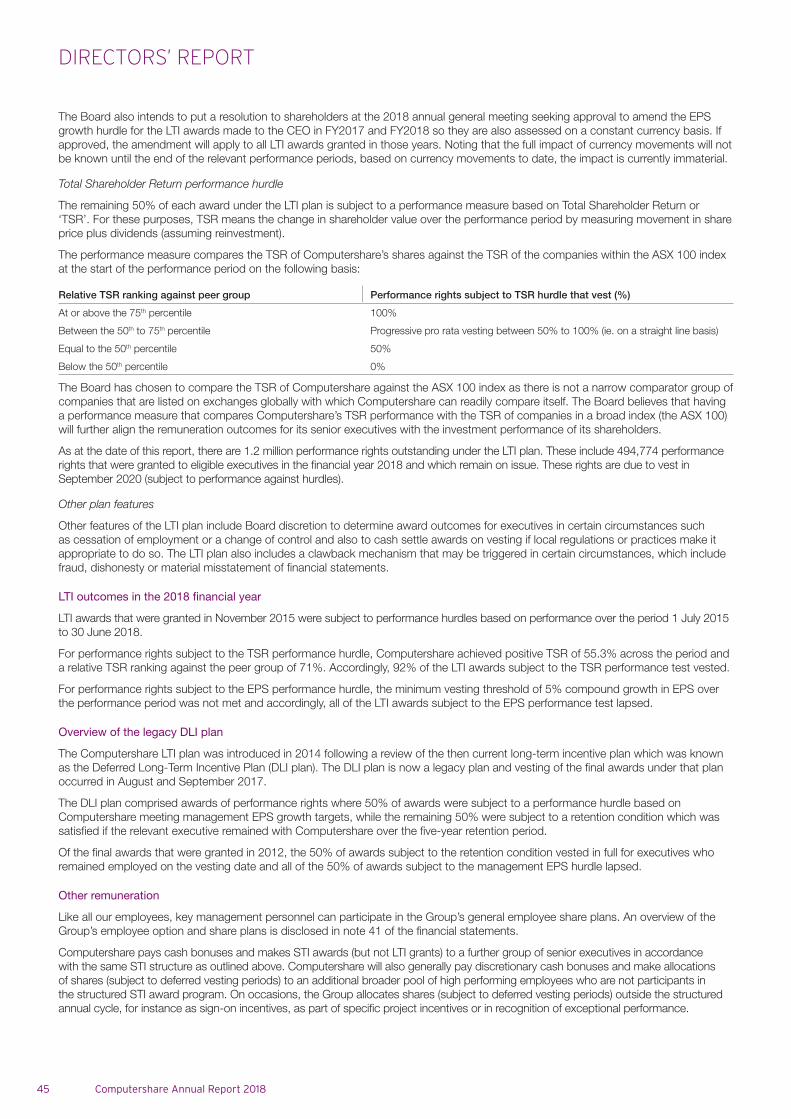
DIRECTORS’ REPORT
45 Computershare Annual Report 2018
The Board also intends to put a resolution to shareholders at the 2018 annual general meeting seeking approval to amend the EPS growth hurdle for the LTI awards made to the CEO in FY2017 and FY2018 so they are also assessed on a constant currency basis. If approved, the amendment will apply to all LTI awards granted in those years. Noting that the full impact of currency movements will not be known until the end of the relevant performance periods, based on currency movements to date, the impact is currently immaterial.
Total Shareholder Return performance hurdle
The remaining 50% of each award under the LTI plan is subject to a performance measure based on Total Shareholder Return or ‘TSR’. For these purposes, TSR means the change in shareholder value over the performance period by measuring movement in share price plus dividends (assuming reinvestment).
The performance measure compares the TSR of Computershare’s shares against the TSR of the companies within the ASX 100 index at the start of the performance period on the following basis:
Relative TSR ranking against peer group Performance rights subject to TSR hurdle that vest (%)
At or above the 75th percentile 100%
Between the 50th to 75th percentile Progressive pro rata vesting between 50% to 100% (ie. on a straight line basis)
Equal to the 50th percentile 50%
Below the 50th percentile 0%
The Board has chosen to compare the TSR of Computershare against the ASX 100 index as there is not a narrow comparator group of companies that are listed on exchanges globally with which Computershare can readily compare itself. The Board believes that having a performance measure that compares Computershare’s TSR performance with the TSR of companies in a broad index (the ASX 100) will further align the remuneration outcomes for its senior executives with the investment performance of its shareholders.
As at the date of this report, there are 1.2 million performance rights outstanding under the LTI plan. These include 494,774 performance rights that were granted to eligible executives in the financial year 2018 and which remain on issue. These rights are due to vest in September 2020 (subject to performance against hurdles).
Other plan features
Other features of the LTI plan include Board discretion to determine award outcomes for executives in certain circumstances such as cessation of employment or a change of control and also to cash settle awards on vesting if local regulations or practices make it appropriate to do so. The LTI plan also includes a clawback mechanism that may be triggered in certain circumstances, which include fraud, dishonesty or material misstatement of financial statements.
LTI outcomes in the 2018 financial year
LTI awards that were granted in November 2015 were subject to performance hurdles based on performance over the period 1 July 2015 to 30 June 2018.
For performance rights subject to the TSR performance hurdle, Computershare achieved positive TSR of 55.3% across the period and a relative TSR ranking against the peer group of 71%. Accordingly, 92% of the LTI awards subject to the TSR performance test vested.
For performance rights subject to the EPS performance hurdle, the minimum vesting threshold of 5% compound growth in EPS over the performance period was not met and accordingly, all of the LTI awards subject to the EPS performance test lapsed.
Overview of the legacy DLI plan
The Computershare LTI plan was introduced in 2014 following a review of the then current long-term incentive plan which was known as the Deferred Long-Term Incentive Plan (DLI plan). The DLI plan is now a legacy plan and vesting of the final awards under that plan occurred in August and September 2017.
The DLI plan comprised awards of performance rights where 50% of awards were subject to a performance hurdle based on Computershare meeting management EPS growth targets, while the remaining 50% were subject to a retention condition which was satisfied if the relevant executive remained with Computershare over the five-year retention period.
Of the final awards that were granted in 2012, the 50% of awards subject to the retention condition vested in full for executives who remained employed on the vesting date and all of the 50% of awards subject to the management EPS hurdle lapsed.
Other remuneration
Like all our employees, key management personnel can participate in the Group’s general employee share plans. An overview of the Group’s employee option and share plans is disclosed in note 41 of the financial statements.
Computershare pays cash bonuses and makes STI awards (but not LTI grants) to a further group of senior executives in accordance with the same STI structure as outlined above. Computershare will also generally pay discretionary cash bonuses and make allocations of shares (subject to deferred vesting periods) to an additional broader pool of high performing employees who are not participants in the structured STI award program. On occasions, the Group allocates shares (subject to deferred vesting periods) outside the structured annual cycle, for instance as sign-on incentives, as part of specific project incentives or in recognition of exceptional performance.
46
Relationship between remuneration and Group’s performance
One of the key principles of Computershare’s remuneration strategy is to ensure that there is a link between the remuneration outcomes for executives and company performance and its consequent impact on shareholder interests. The Board believes that the use of a management EPS growth hurdle and a relative TSR hurdle under the Group’s executive LTI plan supports that alignment. Similarly, the Board believes that short-term incentive outcomes for executives should reflect a combination of personal objectives as well as targets that are based on financial performance. The following table highlights some of the key financial results for Computershare over the period from the financial year 2014 to the financial year 2018 with the corresponding average STI outcomes for executive key management personnel over the same period.
2014 2015 2016 2017 2018
Management EBITDA (USD million) 540.6 554.1 532.6 540.8 622.6
Statutory EPS (US cents) 45.20 27.61 28.55 48.76 55.17
Management EPS (US cents) 60.24 59.82 55.09 54.41 63.38
Management EPS (US cents) – constant currency1 54.92 55.56 54.05 55.82 63.38
Total Dividend (AU cents per share) 29 31 33 36 40
Share price as at 30 June (AUD) 12.48 11.71 9.17 14.14 18.43
Average STI received as % of maximum opportunity for executive KMP (%)
65.3 48.7 48.0 56.8 77.4
1 Translated at FY2018 average exchange rates
D. DETAILS OF REMUNERATION AND SERVICE CONTRACTS
Directors
The directors of Computershare Limited who held the position during the current financial year are listed below.
Non-executive Executive
CJ Morris
AP Cleland (appointed effective 14 February 2018)
TL Fuller
LM Gay (appointed effective 14 February 2018)
SD Jones
ME Kerber (resigned effective 8 June 2018)
PJ Maclagan
AL Owen
JM Velli
SJ Irving President and Chief Executive Officer
Key management personnel other than directors
The individuals listed below are key management personnel of the Group other than directors (within the meaning of the Australian accounting standard AASB 124 Related Party Disclosures) who have the authority and responsibility for planning, directing and controlling the activities of the Group. All individuals named below held their position for the whole of the financial year ended 30 June 2018 unless otherwise stated.
Name Position Employer
SA Cameron President – Australia and New Zealand Computershare Investor Services Pty Ltd
PA Conn President – Global Capital Markets Computershare Inc (US)
MB Davis Chief Financial Officer Computershare Ltd
SHE Herfurth President – Continental Europe CPU Deutschland GmbH & Co KG
ML McDougall Chief Information Officer Computershare Technology Services Pty Ltd
SR Rothbloom President – North America Computershare Inc (US)
N Sarkar President – United Kingdom, Channel Islands, Ireland and South Africa Computershare Investor Services PLC (UK)
SS Swartz President – Canada Computershare Trust Company of Canada
CP Yap1 President – Asia Computershare Hong Kong Investor Services Limited
JLW Wong2 President – Asia Computershare Hong Kong Investor Services Limited
1 CP Yap was appointed as President – Asia effective 14 May 2018.
2 JLW Wong resigned as President – Asia effective 31 December 2017, and acted as Senior Executive Advisor from 1 January until 30 June 2018.
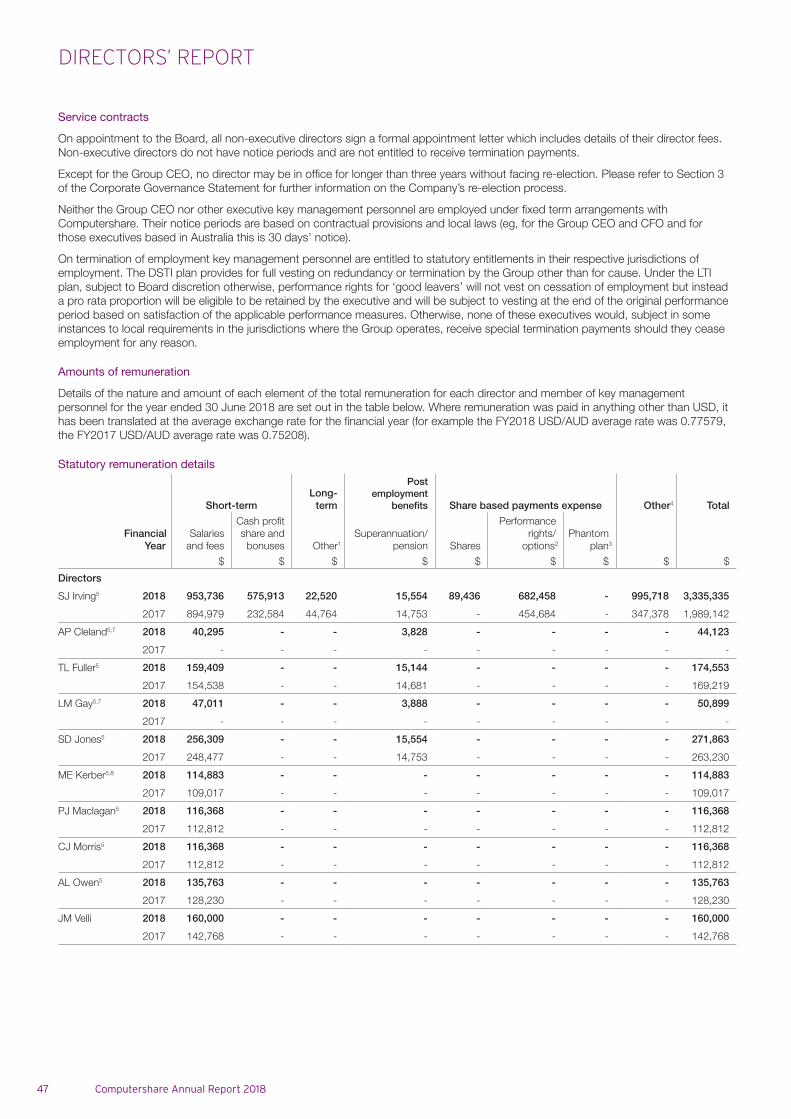
DIRECTORS’ REPORT
47 Computershare Annual Report 2018
Service contracts
On appointment to the Board, all non-executive directors sign a formal appointment letter which includes details of their director fees. Non-executive directors do not have notice periods and are not entitled to receive termination payments.
Except for the Group CEO, no director may be in office for longer than three years without facing re-election. Please refer to Section 3 of the Corporate Governance Statement for further information on the Company’s re-election process.
Neither the Group CEO nor other executive key management personnel are employed under fixed term arrangements with Computershare. Their notice periods are based on contractual provisions and local laws (eg, for the Group CEO and CFO and for those executives based in Australia this is 30 days’ notice).
On termination of employment key management personnel are entitled to statutory entitlements in their respective jurisdictions of employment. The DSTI plan provides for full vesting on redundancy or termination by the Group other than for cause. Under the LTI plan, subject to Board discretion otherwise, performance rights for ‘good leavers’ will not vest on cessation of employment but instead a pro rata proportion will be eligible to be retained by the executive and will be subject to vesting at the end of the original performance period based on satisfaction of the applicable performance measures. Otherwise, none of these executives would, subject in some instances to local requirements in the jurisdictions where the Group operates, receive special termination payments should they cease employment for any reason.
Amounts of remuneration
Details of the nature and amount of each element of the total remuneration for each director and member of key management personnel for the year ended 30 June 2018 are set out in the table below. Where remuneration was paid in anything other than USD, it has been translated at the average exchange rate for the financial year (for example the FY2018 USD/AUD average rate was 0.77579, the FY2017 USD/AUD average rate was 0.75208).
Statutory remuneration details
Short-termLong-
term
Post employment
benefits Share based payments expense Other4 Total
FinancialYear
Salaries and fees
Cash profit share and
bonuses Other1
Superannuation/pension Shares
Performancerights/
options2
Phantomplan3
$ $ $ $ $ $ $ $ $
Directors
SJ Irving5 2018 953,736 575,913 22,520 15,554 89,436 682,458 - 995,718 3,335,335
2017 894,979 232,584 44,764 14,753 - 454,684 - 347,378 1,989,142
AP Cleland5,7 2018 40,295 - - 3,828 - - - - 44,123
2017 - - - - - - - - -
TL Fuller5 2018 159,409 - - 15,144 - - - - 174,553
2017 154,538 - - 14,681 - - - - 169,219
LM Gay5,7 2018 47,011 - - 3,888 - - - - 50,899
2017 - - - - - - - - -
SD Jones5 2018 256,309 - - 15,554 - - - - 271,863
2017 248,477 - - 14,753 - - - - 263,230
ME Kerber5,8 2018 114,883 - - - - - - - 114,883
2017 109,017 - - - - - - - 109,017
PJ Maclagan5 2018 116,368 - - - - - - - 116,368
2017 112,812 - - - - - - - 112,812
CJ Morris5 2018 116,368 - - - - - - - 116,368
2017 112,812 - - - - - - - 112,812
AL Owen5 2018 135,763 - - - - - - - 135,763
2017 128,230 - - - - - - - 128,230
JM Velli 2018 160,000 - - - - - - - 160,000
2017 142,768 - - - - - - - 142,768
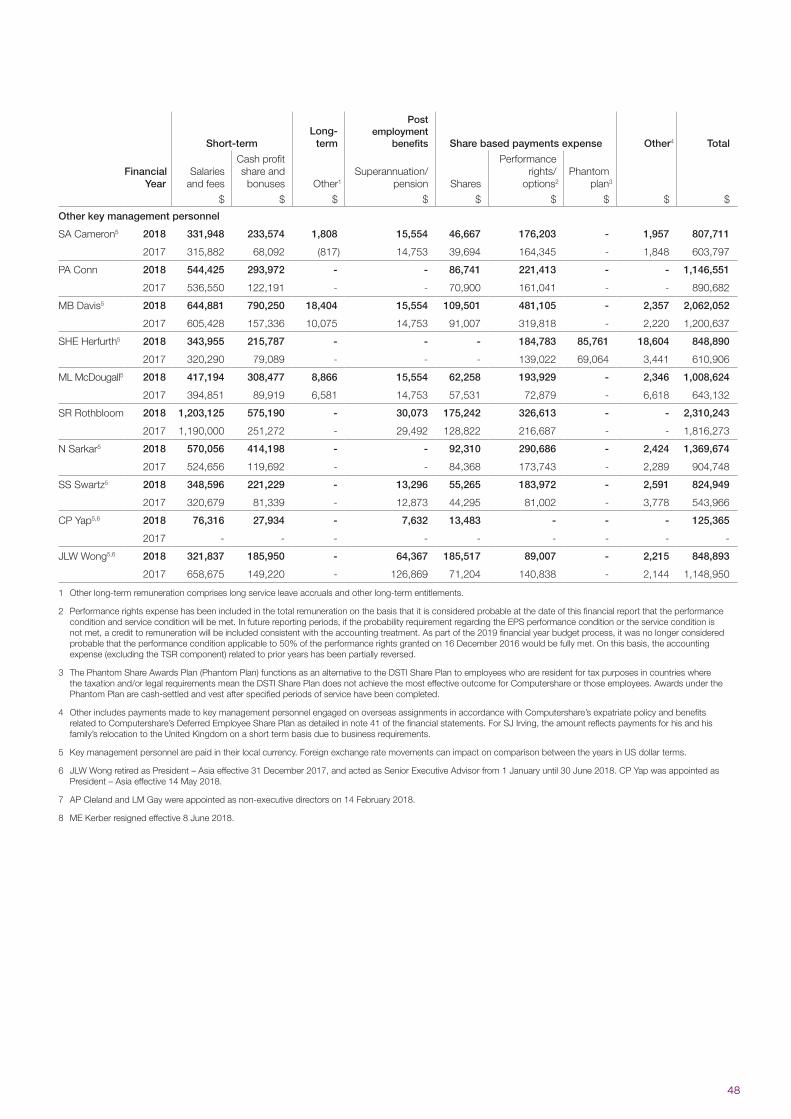
48
Short-termLong-
term
Post employment
benefits Share based payments expense Other4 Total
FinancialYear
Salaries and fees
Cash profit share and
bonuses Other1
Superannuation/pension Shares
Performancerights/
options2
Phantomplan3
$ $ $ $ $ $ $ $ $
Other key management personnel
SA Cameron5 2018 331,948 233,574 1,808 15,554 46,667 176,203 - 1,957 807,711
2017 315,882 68,092 (817) 14,753 39,694 164,345 - 1,848 603,797
PA Conn 2018 544,425 293,972 - - 86,741 221,413 - - 1,146,551
2017 536,550 122,191 - - 70,900 161,041 - - 890,682
MB Davis5 2018 644,881 790,250 18,404 15,554 109,501 481,105 - 2,357 2,062,052
2017 605,428 157,336 10,075 14,753 91,007 319,818 - 2,220 1,200,637
SHE Herfurth5 2018 343,955 215,787 - - - 184,783 85,761 18,604 848,890
2017 320,290 79,089 - - - 139,022 69,064 3,441 610,906
ML McDougall5 2018 417,194 308,477 8,866 15,554 62,258 193,929 - 2,346 1,008,624
2017 394,851 89,919 6,581 14,753 57,531 72,879 - 6,618 643,132
SR Rothbloom 2018 1,203,125 575,190 - 30,073 175,242 326,613 - - 2,310,243
2017 1,190,000 251,272 - 29,492 128,822 216,687 - - 1,816,273
N Sarkar5 2018 570,056 414,198 - - 92,310 290,686 - 2,424 1,369,674
2017 524,656 119,692 - - 84,368 173,743 - 2,289 904,748
SS Swartz5 2018 348,596 221,229 - 13,296 55,265 183,972 - 2,591 824,949
2017 320,679 81,339 - 12,873 44,295 81,002 - 3,778 543,966
CP Yap5,6 2018 76,316 27,934 - 7,632 13,483 - - - 125,365
2017 - - - - - - - - -
JLW Wong5,6 2018 321,837 185,950 - 64,367 185,517 89,007 - 2,215 848,893
2017 658,675 149,220 - 126,869 71,204 140,838 - 2,144 1,148,950
1 Other long-term remuneration comprises long service leave accruals and other long-term entitlements.
2 Performance rights expense has been included in the total remuneration on the basis that it is considered probable at the date of this financial report that the performance condition and service condition will be met. In future reporting periods, if the probability requirement regarding the EPS performance condition or the service condition is not met, a credit to remuneration will be included consistent with the accounting treatment. As part of the 2019 financial year budget process, it was no longer considered probable that the performance condition applicable to 50% of the performance rights granted on 16 December 2016 would be fully met. On this basis, the accounting expense (excluding the TSR component) related to prior years has been partially reversed.
3 The Phantom Share Awards Plan (Phantom Plan) functions as an alternative to the DSTI Share Plan to employees who are resident for tax purposes in countries where the taxation and/or legal requirements mean the DSTI Share Plan does not achieve the most effective outcome for Computershare or those employees. Awards under the Phantom Plan are cash-settled and vest after specified periods of service have been completed.
4 Other includes payments made to key management personnel engaged on overseas assignments in accordance with Computershare’s expatriate policy and benefits related to Computershare’s Deferred Employee Share Plan as detailed in note 41 of the financial statements. For SJ Irving, the amount reflects payments for his and his family’s relocation to the United Kingdom on a short term basis due to business requirements.
5 Key management personnel are paid in their local currency. Foreign exchange rate movements can impact on comparison between the years in US dollar terms.
6 JLW Wong retired as President – Asia effective 31 December 2017, and acted as Senior Executive Advisor from 1 January until 30 June 2018. CP Yap was appointed as President – Asia effective 14 May 2018.
7 AP Cleland and LM Gay were appointed as non-executive directors on 14 February 2018.
8 ME Kerber resigned effective 8 June 2018.
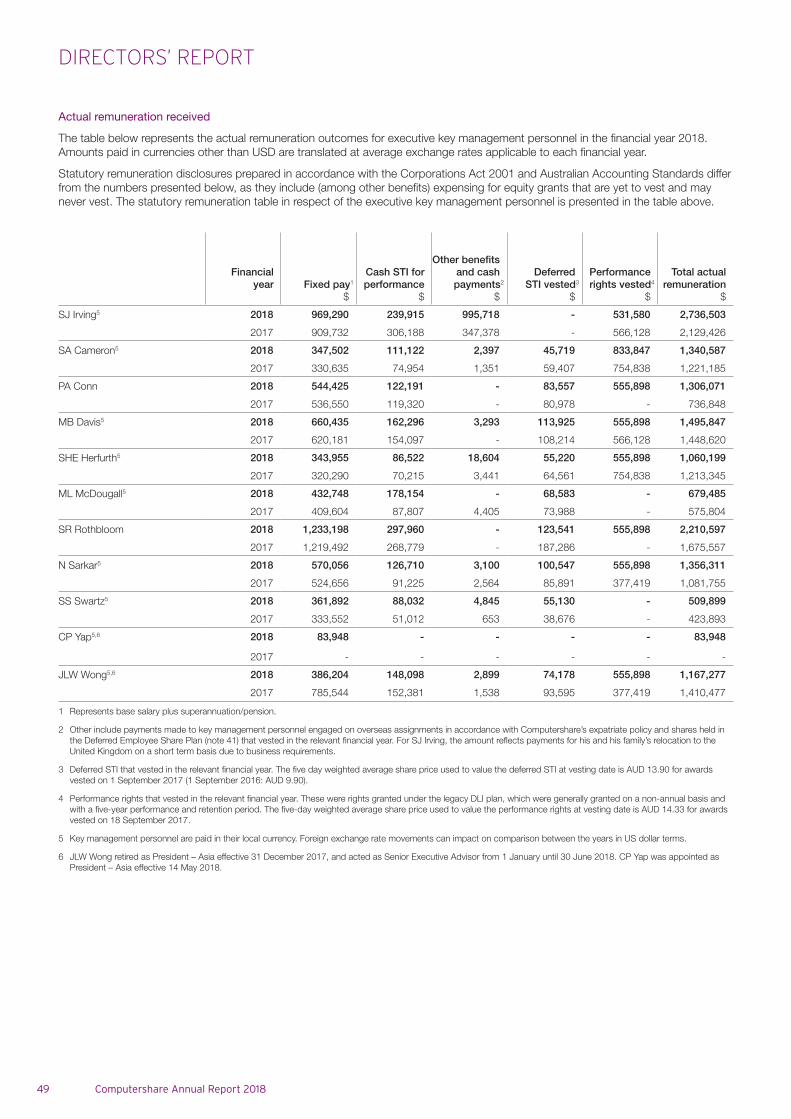
DIRECTORS’ REPORT
49 Computershare Annual Report 2018
Actual remuneration received
The table below represents the actual remuneration outcomes for executive key management personnel in the financial year 2018. Amounts paid in currencies other than USD are translated at average exchange rates applicable to each financial year.
Statutory remuneration disclosures prepared in accordance with the Corporations Act 2001 and Australian Accounting Standards differ from the numbers presented below, as they include (among other benefits) expensing for equity grants that are yet to vest and may never vest. The statutory remuneration table in respect of the executive key management personnel is presented in the table above.
Financial year Fixed pay1
$
Cash STI for performance
$
Other benefits and cash payments2
$
Deferred STI vested3
$
Performance rights vested4
$
Total actual remuneration
$
SJ Irving5 2018 969,290 239,915 995,718 - 531,580 2,736,503
2017 909,732 306,188 347,378 - 566,128 2,129,426
SA Cameron5 2018 347,502 111,122 2,397 45,719 833,847 1,340,587
2017 330,635 74,954 1,351 59,407 754,838 1,221,185
PA Conn 2018 544,425 122,191 - 83,557 555,898 1,306,071
2017 536,550 119,320 - 80,978 - 736,848
MB Davis5 2018 660,435 162,296 3,293 113,925 555,898 1,495,847
2017 620,181 154,097 - 108,214 566,128 1,448,620
SHE Herfurth5 2018 343,955 86,522 18,604 55,220 555,898 1,060,199
2017 320,290 70,215 3,441 64,561 754,838 1,213,345
ML McDougall5 2018 432,748 178,154 - 68,583 - 679,485
2017 409,604 87,807 4,405 73,988 - 575,804
SR Rothbloom 2018 1,233,198 297,960 - 123,541 555,898 2,210,597
2017 1,219,492 268,779 - 187,286 - 1,675,557
N Sarkar5 2018 570,056 126,710 3,100 100,547 555,898 1,356,311
2017 524,656 91,225 2,564 85,891 377,419 1,081,755
SS Swartz5 2018 361,892 88,032 4,845 55,130 - 509,899
2017 333,552 51,012 653 38,676 - 423,893
CP Yap5,6 2018 83,948 - - - - 83,948
2017 - - - - - -
JLW Wong5,6 2018 386,204 148,098 2,899 74,178 555,898 1,167,277
2017 785,544 152,381 1,538 93,595 377,419 1,410,477
1 Represents base salary plus superannuation/pension.
2 Other include payments made to key management personnel engaged on overseas assignments in accordance with Computershare’s expatriate policy and shares held in the Deferred Employee Share Plan (note 41) that vested in the relevant financial year. For SJ Irving, the amount reflects payments for his and his family’s relocation to the United Kingdom on a short term basis due to business requirements.
3 Deferred STI that vested in the relevant financial year. The five day weighted average share price used to value the deferred STI at vesting date is AUD 13.90 for awards vested on 1 September 2017 (1 September 2016: AUD 9.90).
4 Performance rights that vested in the relevant financial year. These were rights granted under the legacy DLI plan, which were generally granted on a non-annual basis and with a five-year performance and retention period. The five-day weighted average share price used to value the performance rights at vesting date is AUD 14.33 for awards vested on 18 September 2017.
5 Key management personnel are paid in their local currency. Foreign exchange rate movements can impact on comparison between the years in US dollar terms.
6 JLW Wong retired as President – Asia effective 31 December 2017, and acted as Senior Executive Advisor from 1 January until 30 June 2018. CP Yap was appointed as President – Asia effective 14 May 2018.
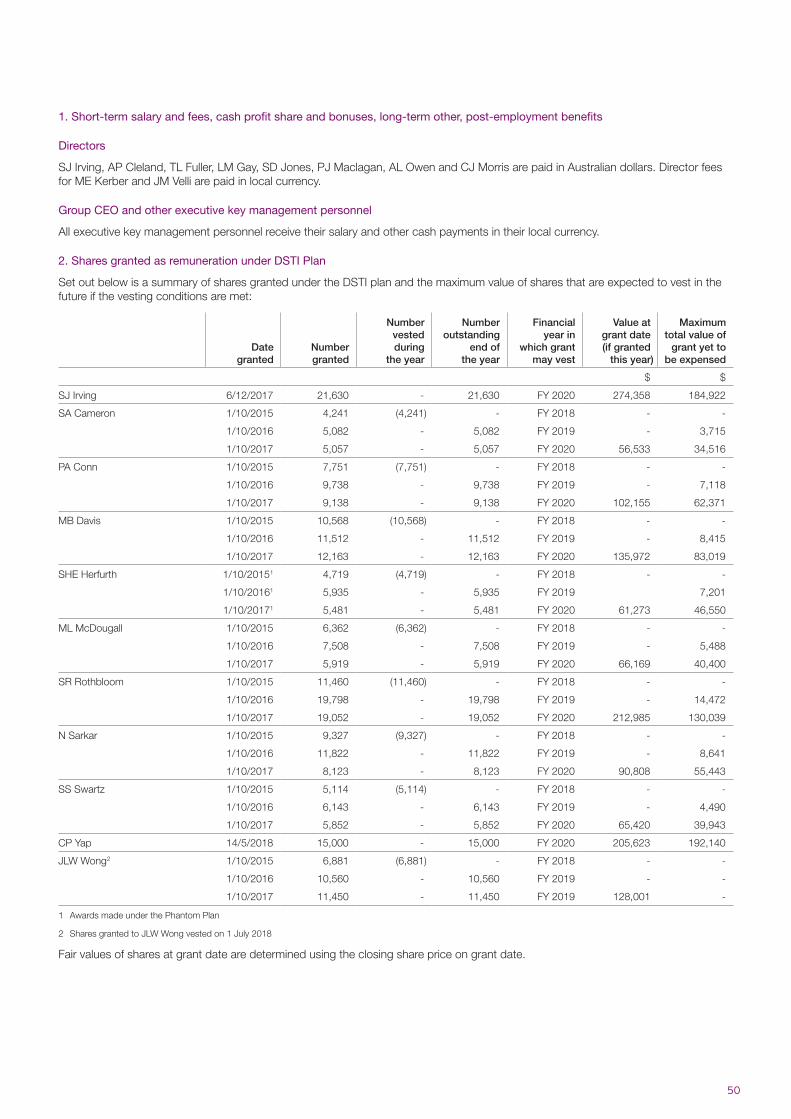
50
1. Short-term salary and fees, cash profit share and bonuses, long-term other, post-employment benefits
Directors
SJ Irving, AP Cleland, TL Fuller, LM Gay, SD Jones, PJ Maclagan, AL Owen and CJ Morris are paid in Australian dollars. Director fees for ME Kerber and JM Velli are paid in local currency.
Group CEO and other executive key management personnel
All executive key management personnel receive their salary and other cash payments in their local currency.
2. Shares granted as remuneration under DSTI Plan
Set out below is a summary of shares granted under the DSTI plan and the maximum value of shares that are expected to vest in the future if the vesting conditions are met:
Date granted
Number granted
Number vested during
the year
Number outstanding
end of the year
Financial year in
which grant may vest
Value at grant date (if granted
this year)
Maximum total value of
grant yet to be expensed
$ $
SJ Irving 6/12/2017 21,630 - 21,630 FY 2020 274,358 184,922
SA Cameron 1/10/2015 4,241 (4,241) - FY 2018 - -
1/10/2016 5,082 - 5,082 FY 2019 - 3,715
1/10/2017 5,057 - 5,057 FY 2020 56,533 34,516
PA Conn 1/10/2015 7,751 (7,751) - FY 2018 - -
1/10/2016 9,738 - 9,738 FY 2019 - 7,118
1/10/2017 9,138 - 9,138 FY 2020 102,155 62,371
MB Davis 1/10/2015 10,568 (10,568) - FY 2018 - -
1/10/2016 11,512 - 11,512 FY 2019 - 8,415
1/10/2017 12,163 - 12,163 FY 2020 135,972 83,019
SHE Herfurth 1/10/20151 4,719 (4,719) - FY 2018 - -
1/10/20161 5,935 - 5,935 FY 2019 7,201
1/10/20171 5,481 - 5,481 FY 2020 61,273 46,550
ML McDougall 1/10/2015 6,362 (6,362) - FY 2018 - -
1/10/2016 7,508 - 7,508 FY 2019 - 5,488
1/10/2017 5,919 - 5,919 FY 2020 66,169 40,400
SR Rothbloom 1/10/2015 11,460 (11,460) - FY 2018 - -
1/10/2016 19,798 - 19,798 FY 2019 - 14,472
1/10/2017 19,052 - 19,052 FY 2020 212,985 130,039
N Sarkar 1/10/2015 9,327 (9,327) - FY 2018 - -
1/10/2016 11,822 - 11,822 FY 2019 - 8,641
1/10/2017 8,123 - 8,123 FY 2020 90,808 55,443
SS Swartz 1/10/2015 5,114 (5,114) - FY 2018 - -
1/10/2016 6,143 - 6,143 FY 2019 - 4,490
1/10/2017 5,852 - 5,852 FY 2020 65,420 39,943
CP Yap 14/5/2018 15,000 - 15,000 FY 2020 205,623 192,140
JLW Wong2 1/10/2015 6,881 (6,881) - FY 2018 - -
1/10/2016 10,560 - 10,560 FY 2019 - -
1/10/2017 11,450 - 11,450 FY 2019 128,001 -
1 Awards made under the Phantom Plan
2 Shares granted to JLW Wong vested on 1 July 2018
Fair values of shares at grant date are determined using the closing share price on grant date.
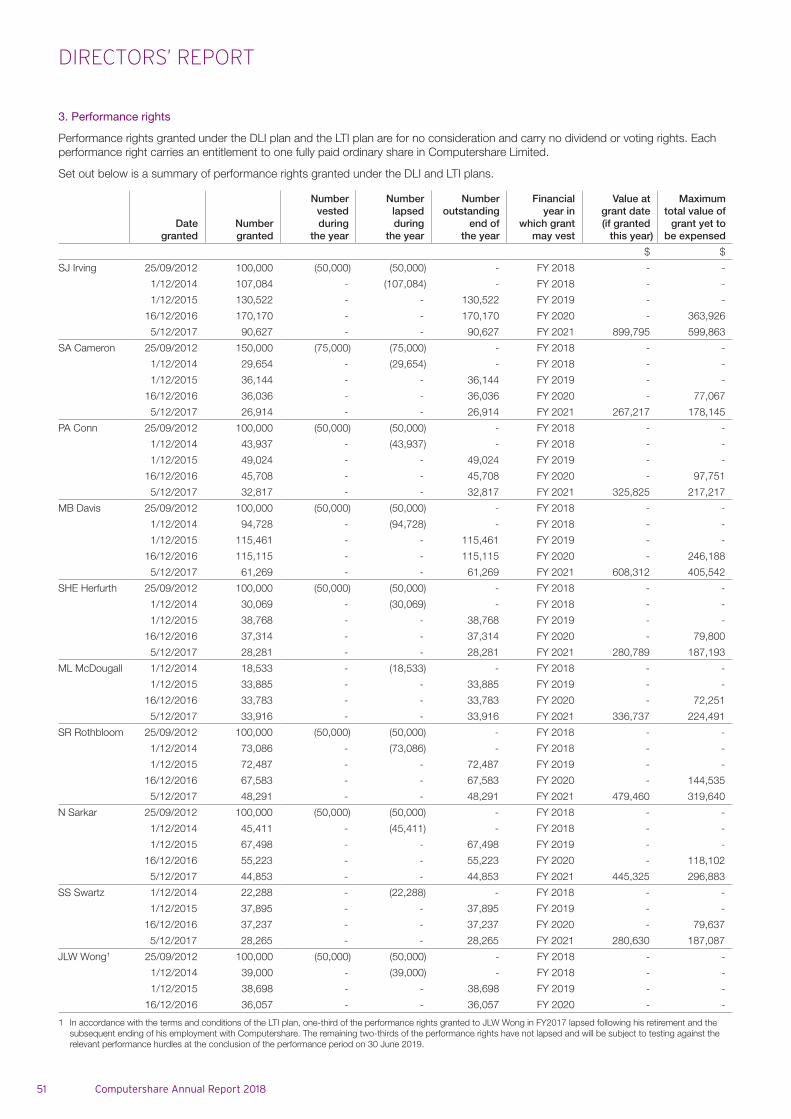
DIRECTORS’ REPORT
51 Computershare Annual Report 2018
3. Performance rights
Performance rights granted under the DLI plan and the LTI plan are for no consideration and carry no dividend or voting rights. Each performance right carries an entitlement to one fully paid ordinary share in Computershare Limited.
Set out below is a summary of performance rights granted under the DLI and LTI plans.
Date granted
Number granted
Number vested during
the year
Number lapsed during
the year
Number outstanding
end of the year
Financial year in
which grant may vest
Value at grant date (if granted
this year)
Maximum total value of
grant yet to be expensed
$ $
SJ Irving 25/09/2012 100,000 (50,000) (50,000) - FY 2018 - -
1/12/2014 107,084 - (107,084) - FY 2018 - -
1/12/2015 130,522 - - 130,522 FY 2019 - -
16/12/2016 170,170 - - 170,170 FY 2020 - 363,926
5/12/2017 90,627 - - 90,627 FY 2021 899,795 599,863
SA Cameron 25/09/2012 150,000 (75,000) (75,000) - FY 2018 - -
1/12/2014 29,654 - (29,654) - FY 2018 - -
1/12/2015 36,144 - - 36,144 FY 2019 - -
16/12/2016 36,036 - - 36,036 FY 2020 - 77,067
5/12/2017 26,914 - - 26,914 FY 2021 267,217 178,145
PA Conn 25/09/2012 100,000 (50,000) (50,000) - FY 2018 - -
1/12/2014 43,937 - (43,937) - FY 2018 - -
1/12/2015 49,024 - - 49,024 FY 2019 - -
16/12/2016 45,708 - - 45,708 FY 2020 - 97,751
5/12/2017 32,817 - - 32,817 FY 2021 325,825 217,217
MB Davis 25/09/2012 100,000 (50,000) (50,000) - FY 2018 - -
1/12/2014 94,728 - (94,728) - FY 2018 - -
1/12/2015 115,461 - - 115,461 FY 2019 - -
16/12/2016 115,115 - - 115,115 FY 2020 - 246,188
5/12/2017 61,269 - - 61,269 FY 2021 608,312 405,542
SHE Herfurth 25/09/2012 100,000 (50,000) (50,000) - FY 2018 - -
1/12/2014 30,069 - (30,069) - FY 2018 - -
1/12/2015 38,768 - - 38,768 FY 2019 - -
16/12/2016 37,314 - - 37,314 FY 2020 - 79,800
5/12/2017 28,281 - - 28,281 FY 2021 280,789 187,193
ML McDougall 1/12/2014 18,533 - (18,533) - FY 2018 - -
1/12/2015 33,885 - - 33,885 FY 2019 - -
16/12/2016 33,783 - - 33,783 FY 2020 - 72,251
5/12/2017 33,916 - - 33,916 FY 2021 336,737 224,491
SR Rothbloom 25/09/2012 100,000 (50,000) (50,000) - FY 2018 - -
1/12/2014 73,086 - (73,086) - FY 2018 - -
1/12/2015 72,487 - - 72,487 FY 2019 - -
16/12/2016 67,583 - - 67,583 FY 2020 - 144,535
5/12/2017 48,291 - - 48,291 FY 2021 479,460 319,640
N Sarkar 25/09/2012 100,000 (50,000) (50,000) - FY 2018 - -
1/12/2014 45,411 - (45,411) - FY 2018 - -
1/12/2015 67,498 - - 67,498 FY 2019 - -
16/12/2016 55,223 - - 55,223 FY 2020 - 118,102
5/12/2017 44,853 - - 44,853 FY 2021 445,325 296,883
SS Swartz 1/12/2014 22,288 - (22,288) - FY 2018 - -
1/12/2015 37,895 - - 37,895 FY 2019 - -
16/12/2016 37,237 - - 37,237 FY 2020 - 79,637
5/12/2017 28,265 - - 28,265 FY 2021 280,630 187,087
JLW Wong1 25/09/2012 100,000 (50,000) (50,000) - FY 2018 - -
1/12/2014 39,000 - (39,000) - FY 2018 - -
1/12/2015 38,698 - - 38,698 FY 2019 - -
16/12/2016 36,057 - - 36,057 FY 2020 - -
1 In accordance with the terms and conditions of the LTI plan, one-third of the performance rights granted to JLW Wong in FY2017 lapsed following his retirement and the subsequent ending of his employment with Computershare. The remaining two-thirds of the performance rights have not lapsed and will be subject to testing against the relevant performance hurdles at the conclusion of the performance period on 30 June 2019.
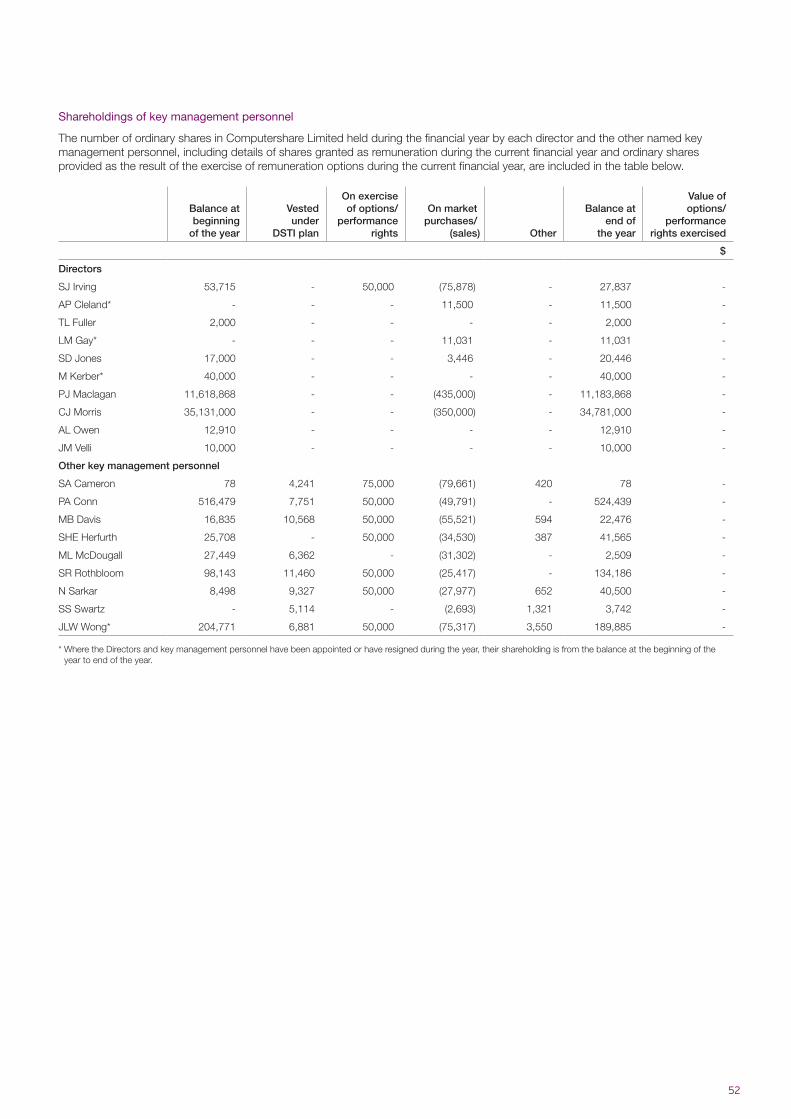
52
Shareholdings of key management personnel
The number of ordinary shares in Computershare Limited held during the financial year by each director and the other named key management personnel, including details of shares granted as remuneration during the current financial year and ordinary shares provided as the result of the exercise of remuneration options during the current financial year, are included in the table below.
Balance at beginning of the year
Vested under
DSTI plan
On exercise of options/
performance rights
On market purchases/
(sales) Other
Balance at end of
the year
Value of options/
performancerights exercised
$
Directors
SJ Irving 53,715 - 50,000 (75,878) - 27,837 -
AP Cleland* - - - 11,500 - 11,500 -
TL Fuller 2,000 - - - - 2,000 -
LM Gay* - - - 11,031 - 11,031 -
SD Jones 17,000 - - 3,446 - 20,446 -
M Kerber* 40,000 - - - - 40,000 -
PJ Maclagan 11,618,868 - - (435,000) - 11,183,868 -
CJ Morris 35,131,000 - - (350,000) - 34,781,000 -
AL Owen 12,910 - - - - 12,910 -
JM Velli 10,000 - - - - 10,000 -
Other key management personnel
SA Cameron 78 4,241 75,000 (79,661) 420 78 -
PA Conn 516,479 7,751 50,000 (49,791) - 524,439 -
MB Davis 16,835 10,568 50,000 (55,521) 594 22,476 -
SHE Herfurth 25,708 - 50,000 (34,530) 387 41,565 -
ML McDougall 27,449 6,362 - (31,302) - 2,509 -
SR Rothbloom 98,143 11,460 50,000 (25,417) - 134,186 -
N Sarkar 8,498 9,327 50,000 (27,977) 652 40,500 -
SS Swartz - 5,114 - (2,693) 1,321 3,742 -
JLW Wong* 204,771 6,881 50,000 (75,317) 3,550 189,885 -
* Where the Directors and key management personnel have been appointed or have resigned during the year, their shareholding is from the balance at the beginning of the year to end of the year.
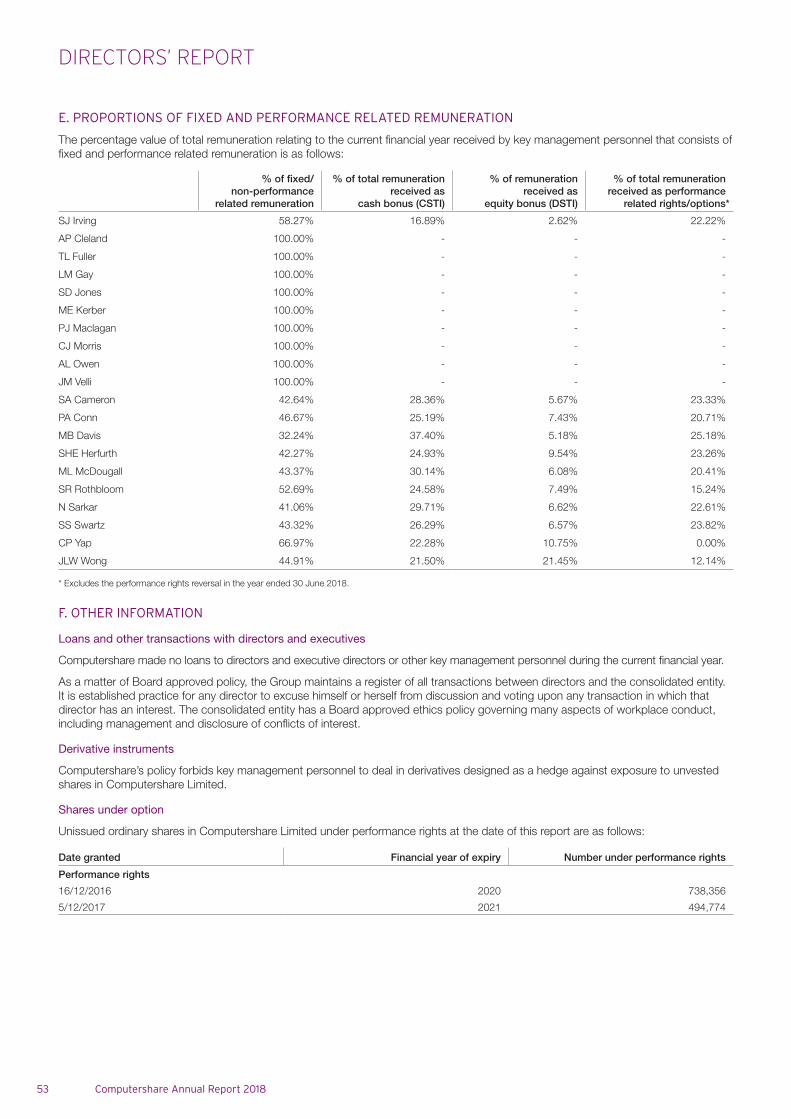
DIRECTORS’ REPORT
53 Computershare Annual Report 2018
E. PROPORTIONS OF FIXED AND PERFORMANCE RELATED REMUNERATION
The percentage value of total remuneration relating to the current financial year received by key management personnel that consists of fixed and performance related remuneration is as follows:
% of fixed/non-performance
related remuneration
% of total remuneration received as
cash bonus (CSTI)
% of remuneration received as
equity bonus (DSTI)
% of total remuneration received as performance
related rights/options*
SJ Irving 58.27% 16.89% 2.62% 22.22%
AP Cleland 100.00% - - -
TL Fuller 100.00% - - -
LM Gay 100.00% - - -
SD Jones 100.00% - - -
ME Kerber 100.00% - - -
PJ Maclagan 100.00% - - -
CJ Morris 100.00% - - -
AL Owen 100.00% - - -
JM Velli 100.00% - - -
SA Cameron 42.64% 28.36% 5.67% 23.33%
PA Conn 46.67% 25.19% 7.43% 20.71%
MB Davis 32.24% 37.40% 5.18% 25.18%
SHE Herfurth 42.27% 24.93% 9.54% 23.26%
ML McDougall 43.37% 30.14% 6.08% 20.41%
SR Rothbloom 52.69% 24.58% 7.49% 15.24%
N Sarkar 41.06% 29.71% 6.62% 22.61%
SS Swartz 43.32% 26.29% 6.57% 23.82%
CP Yap 66.97% 22.28% 10.75% 0.00%
JLW Wong 44.91% 21.50% 21.45% 12.14%
* Excludes the performance rights reversal in the year ended 30 June 2018.
F. OTHER INFORMATION
Loans and other transactions with directors and executives
Computershare made no loans to directors and executive directors or other key management personnel during the current financial year.
As a matter of Board approved policy, the Group maintains a register of all transactions between directors and the consolidated entity. It is established practice for any director to excuse himself or herself from discussion and voting upon any transaction in which that director has an interest. The consolidated entity has a Board approved ethics policy governing many aspects of workplace conduct, including management and disclosure of conflicts of interest.
Derivative instruments
Computershare’s policy forbids key management personnel to deal in derivatives designed as a hedge against exposure to unvested shares in Computershare Limited.
Shares under option
Unissued ordinary shares in Computershare Limited under performance rights at the date of this report are as follows:
Date granted Financial year of expiry Number under performance rights
Performance rights
16/12/2016 2020 738,356
5/12/2017 2021 494,774
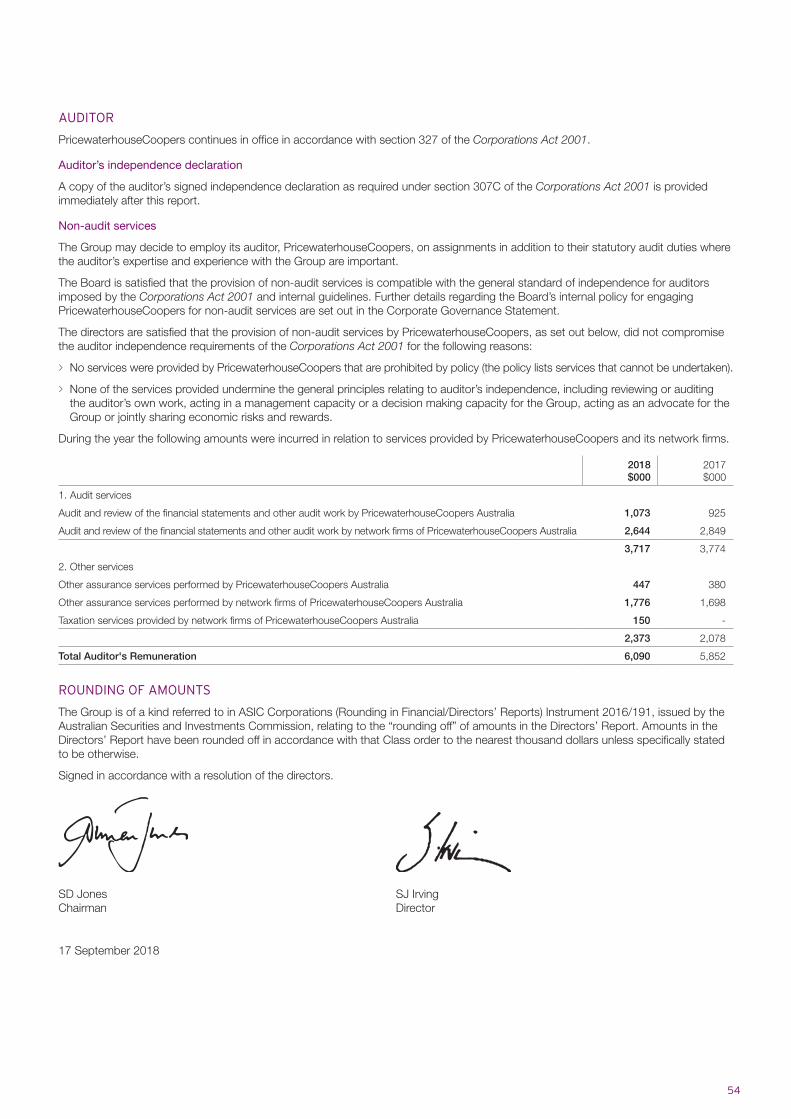
54
AUDITOR
PricewaterhouseCoopers continues in office in accordance with section 327 of the Corporations Act 2001.
Auditor’s independence declaration
A copy of the auditor’s signed independence declaration as required under section 307C of the Corporations Act 2001 is provided immediately after this report.
Non-audit services
The Group may decide to employ its auditor, PricewaterhouseCoopers, on assignments in addition to their statutory audit duties where the auditor’s expertise and experience with the Group are important.
The Board is satisfied that the provision of non-audit services is compatible with the general standard of independence for auditors imposed by the Corporations Act 2001 and internal guidelines. Further details regarding the Board’s internal policy for engaging PricewaterhouseCoopers for non-audit services are set out in the Corporate Governance Statement.
The directors are satisfied that the provision of non-audit services by PricewaterhouseCoopers, as set out below, did not compromise the auditor independence requirements of the Corporations Act 2001 for the following reasons:
> No services were provided by PricewaterhouseCoopers that are prohibited by policy (the policy lists services that cannot be undertaken).
> None of the services provided undermine the general principles relating to auditor’s independence, including reviewing or auditing the auditor’s own work, acting in a management capacity or a decision making capacity for the Group, acting as an advocate for the Group or jointly sharing economic risks and rewards.
During the year the following amounts were incurred in relation to services provided by PricewaterhouseCoopers and its network firms.
2018$000
2017$000
1. Audit services
Audit and review of the financial statements and other audit work by PricewaterhouseCoopers Australia 1,073 925
Audit and review of the financial statements and other audit work by network firms of PricewaterhouseCoopers Australia 2,644 2,849
3,717 3,774
2. Other services
Other assurance services performed by PricewaterhouseCoopers Australia 447 380
Other assurance services performed by network firms of PricewaterhouseCoopers Australia 1,776 1,698
Taxation services provided by network firms of PricewaterhouseCoopers Australia 150 -
2,373 2,078
Total Auditor's Remuneration 6,090 5,852
ROUNDING OF AMOUNTS
The Group is of a kind referred to in ASIC Corporations (Rounding in Financial/Directors’ Reports) Instrument 2016/191, issued by the Australian Securities and Investments Commission, relating to the “rounding off” of amounts in the Directors’ Report. Amounts in the Directors’ Report have been rounded off in accordance with that Class order to the nearest thousand dollars unless specifically stated to be otherwise.
Signed in accordance with a resolution of the directors.
SD JonesChairman
SJ IrvingDirector
17 September 2018
55 Computershare Annual Report 2018
AUDITOR’S INDEPENDENCE DECLARATION
Auditor’s Independence Declaration
As lead auditor for the audit of Computershare Limited for the year ended 30 June 2018, I declare that to the best of my knowledge and belief, there have been:
(a) no contraventions of the auditor independence requirements of the Corporations Act 2001 in relation to the audit; and
(b) no contraventions of any applicable code of professional conduct in relation to the audit other than as noted below.
The spouse of a partner in the lead audit engagement office, who joined PricewaterhouseCoopers on 1 August 2018 as part of a business acquisition, held an AUD 11,718 investment in Computershare Limited until 11 September 2018. The investment was immediately disposed of when the matter was identified. The partner did not provide any services to Computershare Limited and the audit team were not aware of the investment. On this basis I do not believe this matter has impacted the objectivity of PricewaterhouseCoopers in relation to the audit.
This declaration is in respect of Computershare Limited and the entities it controlled during the period.
Anton Linschoten Melbourne Partner 17 September 2018 PricewaterhouseCoopers
PricewaterhouseCoopers, ABN 52 780 433 757 2 Riverside Quay, SOUTHBANK VIC 3006, GPO Box 1331, MELBOURNE VIC 3001 T: 61 3 8603 1000, F: 61 3 8603 1999, www.pwc.com.auLiability limited by a scheme approved under Professional Standards Legislation.
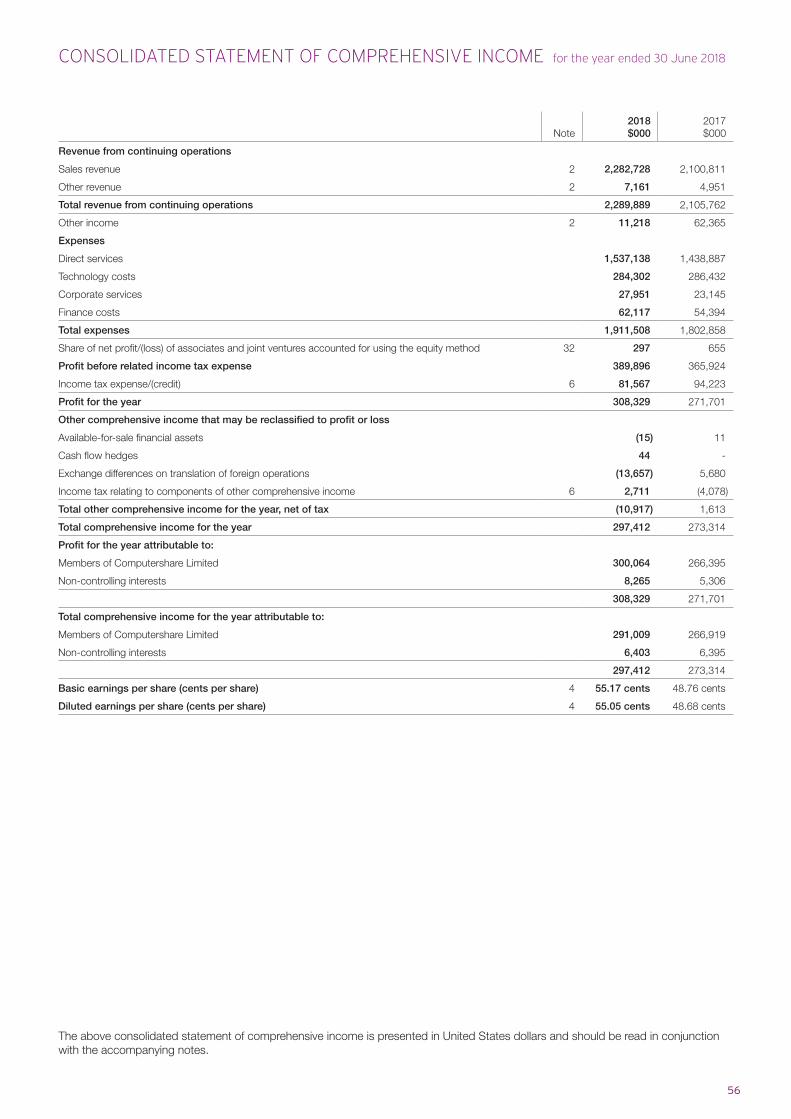
56
Note2018$000
2017$000
Revenue from continuing operations
Sales revenue 2 2,282,728 2,100,811
Other revenue 2 7,161 4,951
Total revenue from continuing operations 2,289,889 2,105,762
Other income 2 11,218 62,365
Expenses
Direct services 1,537,138 1,438,887
Technology costs 284,302 286,432
Corporate services 27,951 23,145
Finance costs 62,117 54,394
Total expenses 1,911,508 1,802,858
Share of net profit/(loss) of associates and joint ventures accounted for using the equity method 32 297 655
Profit before related income tax expense 389,896 365,924
Income tax expense/(credit) 6 81,567 94,223
Profit for the year 308,329 271,701
Other comprehensive income that may be reclassified to profit or loss
Available-for-sale financial assets (15) 11
Cash flow hedges 44 -
Exchange differences on translation of foreign operations (13,657) 5,680
Income tax relating to components of other comprehensive income 6 2,711 (4,078)
Total other comprehensive income for the year, net of tax (10,917) 1,613
Total comprehensive income for the year 297,412 273,314
Profit for the year attributable to:
Members of Computershare Limited 300,064 266,395
Non-controlling interests 8,265 5,306
308,329 271,701
Total comprehensive income for the year attributable to:
Members of Computershare Limited 291,009 266,919
Non-controlling interests 6,403 6,395
297,412 273,314
Basic earnings per share (cents per share) 4 55.17 cents 48.76 cents
Diluted earnings per share (cents per share) 4 55.05 cents 48.68 cents
CONSOLIDATED STATEMENT OF COMPREHENSIVE INCOME for the year ended 30 June 2018
The above consolidated statement of comprehensive income is presented in United States dollars and should be read in conjunction with the accompanying notes.
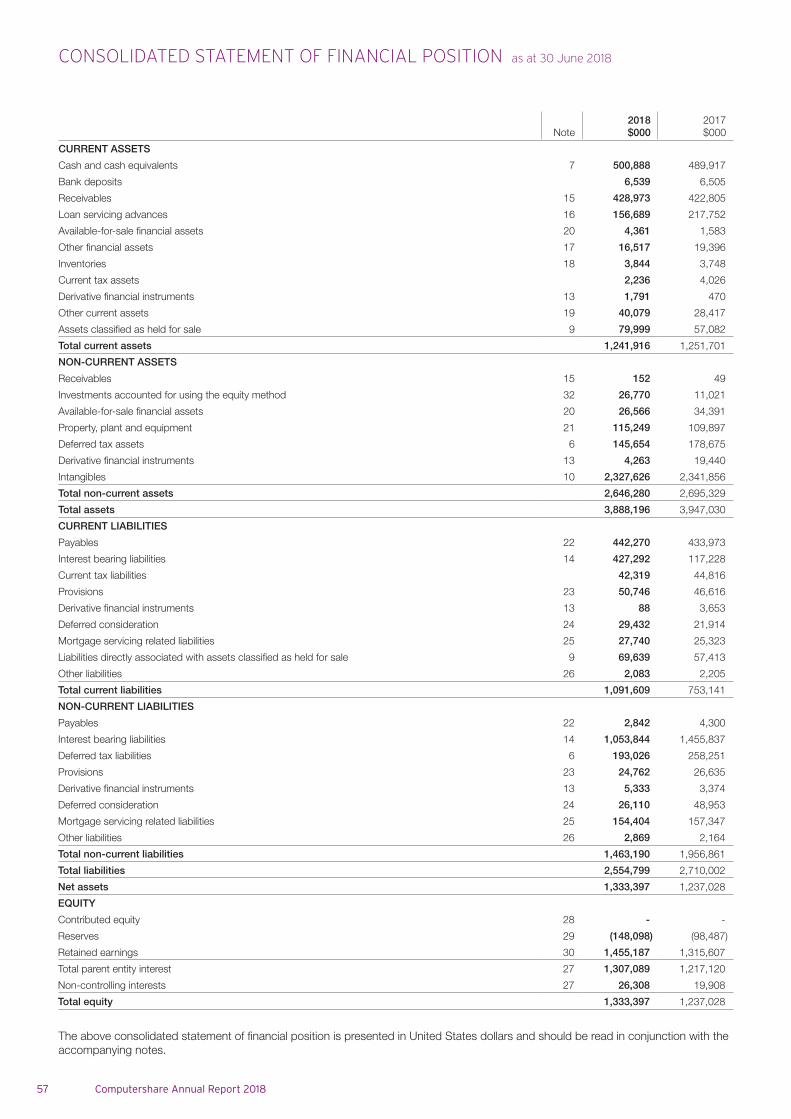
57 Computershare Annual Report 2018
Note2018$000
2017$000
CURRENT ASSETS
Cash and cash equivalents 7 500,888 489,917
Bank deposits 6,539 6,505
Receivables 15 428,973 422,805
Loan servicing advances 16 156,689 217,752
Available-for-sale financial assets 20 4,361 1,583
Other financial assets 17 16,517 19,396
Inventories 18 3,844 3,748
Current tax assets 2,236 4,026
Derivative financial instruments 13 1,791 470
Other current assets 19 40,079 28,417
Assets classified as held for sale 9 79,999 57,082
Total current assets 1,241,916 1,251,701
NON-CURRENT ASSETS
Receivables 15 152 49
Investments accounted for using the equity method 32 26,770 11,021
Available-for-sale financial assets 20 26,566 34,391
Property, plant and equipment 21 115,249 109,897
Deferred tax assets 6 145,654 178,675
Derivative financial instruments 13 4,263 19,440
Intangibles 10 2,327,626 2,341,856
Total non-current assets 2,646,280 2,695,329
Total assets 3,888,196 3,947,030
CURRENT LIABILITIES
Payables 22 442,270 433,973
Interest bearing liabilities 14 427,292 117,228
Current tax liabilities 42,319 44,816
Provisions 23 50,746 46,616
Derivative financial instruments 13 88 3,653
Deferred consideration 24 29,432 21,914
Mortgage servicing related liabilities 25 27,740 25,323
Liabilities directly associated with assets classified as held for sale 9 69,639 57,413
Other liabilities 26 2,083 2,205
Total current liabilities 1,091,609 753,141
NON-CURRENT LIABILITIES
Payables 22 2,842 4,300
Interest bearing liabilities 14 1,053,844 1,455,837
Deferred tax liabilities 6 193,026 258,251
Provisions 23 24,762 26,635
Derivative financial instruments 13 5,333 3,374
Deferred consideration 24 26,110 48,953
Mortgage servicing related liabilities 25 154,404 157,347
Other liabilities 26 2,869 2,164
Total non-current liabilities 1,463,190 1,956,861
Total liabilities 2,554,799 2,710,002
Net assets 1,333,397 1,237,028
EQUITY
Contributed equity 28 - -
Reserves 29 (148,098) (98,487)
Retained earnings 30 1,455,187 1,315,607
Total parent entity interest 27 1,307,089 1,217,120
Non-controlling interests 27 26,308 19,908
Total equity 1,333,397 1,237,028
CONSOLIDATED STATEMENT OF FINANCIAL POSITION as at 30 June 2018
The above consolidated statement of financial position is presented in United States dollars and should be read in conjunction with the accompanying notes.
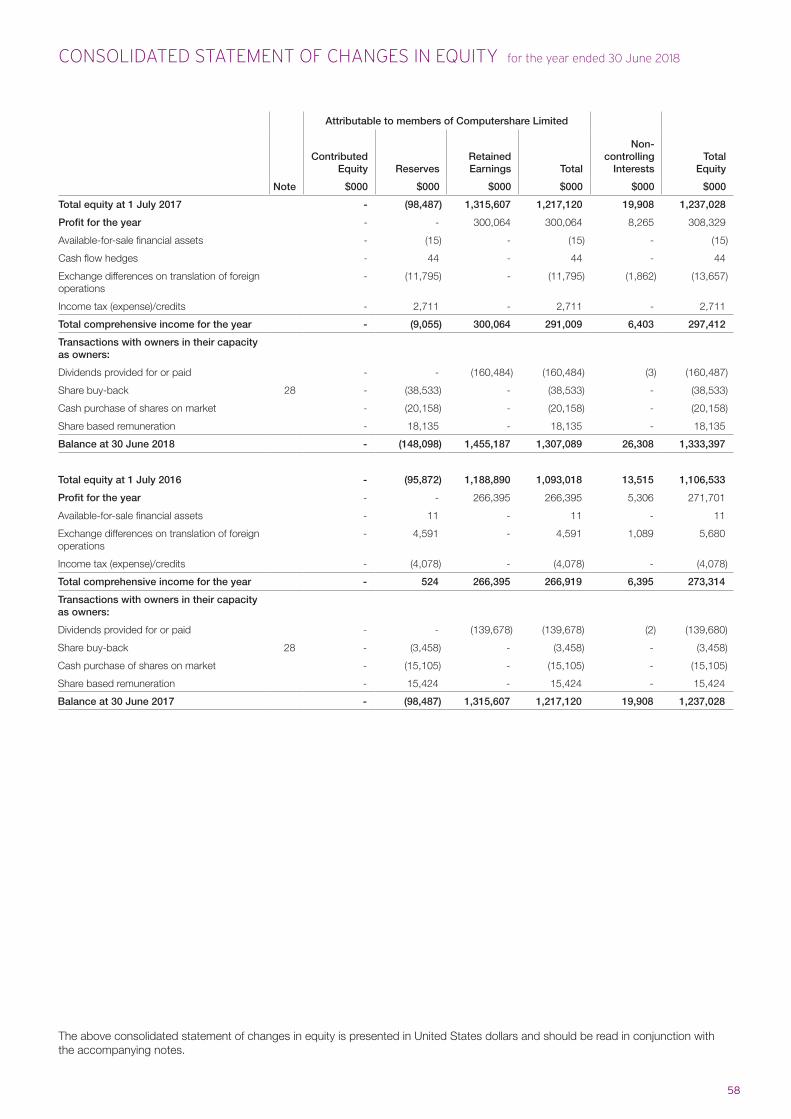
58
The above consolidated statement of changes in equity is presented in United States dollars and should be read in conjunction with the accompanying notes.
Note
Attributable to members of Computershare Limited
Contributed Equity Reserves
Retained Earnings Total
Non-controlling
InterestsTotal
Equity
$000 $000 $000 $000 $000 $000
Total equity at 1 July 2017 - (98,487) 1,315,607 1,217,120 19,908 1,237,028
Profit for the year - - 300,064 300,064 8,265 308,329
Available-for-sale financial assets - (15) - (15) - (15)
Cash flow hedges - 44 - 44 - 44
Exchange differences on translation of foreign operations
- (11,795) - (11,795) (1,862) (13,657)
Income tax (expense)/credits - 2,711 - 2,711 - 2,711
Total comprehensive income for the year - (9,055) 300,064 291,009 6,403 297,412
Transactions with owners in their capacity as owners:
Dividends provided for or paid - - (160,484) (160,484) (3) (160,487)
Share buy-back 28 - (38,533) - (38,533) - (38,533)
Cash purchase of shares on market - (20,158) - (20,158) - (20,158)
Share based remuneration - 18,135 - 18,135 - 18,135
Balance at 30 June 2018 - (148,098) 1,455,187 1,307,089 26,308 1,333,397
Total equity at 1 July 2016 - (95,872) 1,188,890 1,093,018 13,515 1,106,533
Profit for the year - - 266,395 266,395 5,306 271,701
Available-for-sale financial assets - 11 - 11 - 11
Exchange differences on translation of foreign operations
- 4,591 - 4,591 1,089 5,680
Income tax (expense)/credits - (4,078) - (4,078) - (4,078)
Total comprehensive income for the year - 524 266,395 266,919 6,395 273,314
Transactions with owners in their capacity as owners:
Dividends provided for or paid - - (139,678) (139,678) (2) (139,680)
Share buy-back 28 - (3,458) - (3,458) - (3,458)
Cash purchase of shares on market - (15,105) - (15,105) - (15,105)
Share based remuneration - 15,424 - 15,424 - 15,424
Balance at 30 June 2017 - (98,487) 1,315,607 1,217,120 19,908 1,237,028
CONSOLIDATED STATEMENT OF CHANGES IN EQUITY for the year ended 30 June 2018
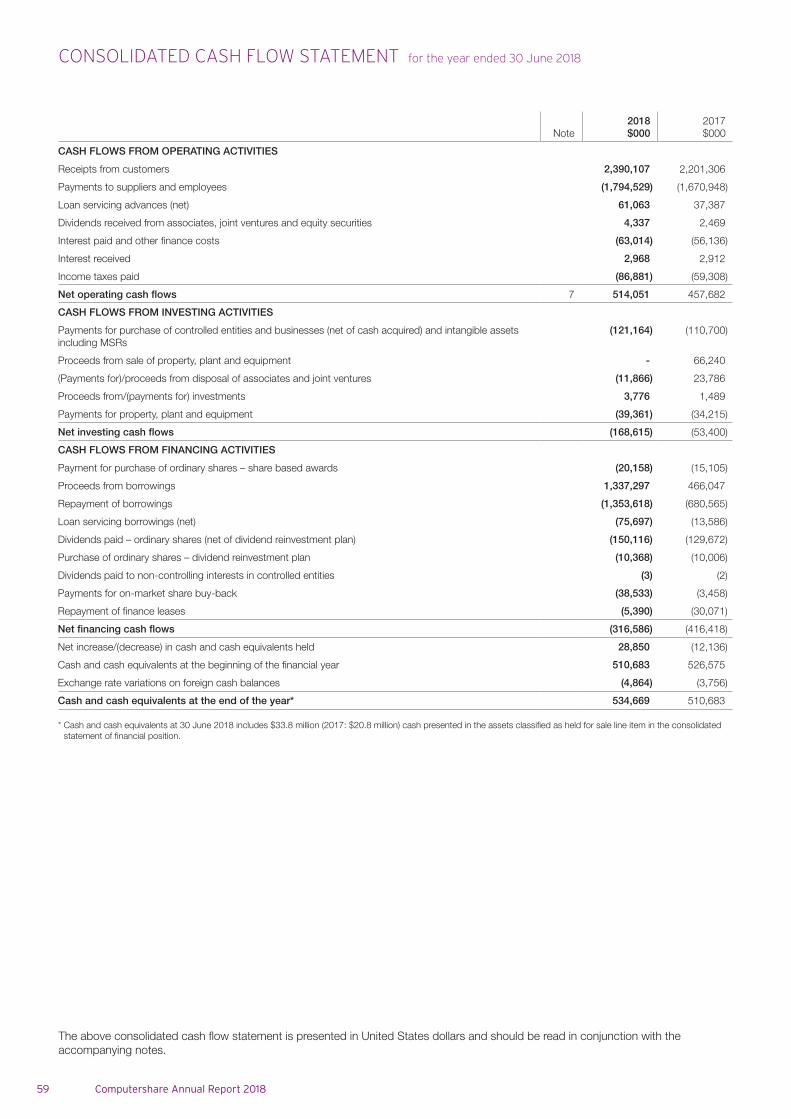
59 Computershare Annual Report 2018
The above consolidated cash flow statement is presented in United States dollars and should be read in conjunction with the accompanying notes.
Note2018$000
2017$000
CASH FLOWS FROM OPERATING ACTIVITIES
Receipts from customers 2,390,107 2,201,306
Payments to suppliers and employees (1,794,529) (1,670,948)
Loan servicing advances (net) 61,063 37,387
Dividends received from associates, joint ventures and equity securities 4,337 2,469
Interest paid and other finance costs (63,014) (56,136)
Interest received 2,968 2,912
Income taxes paid (86,881) (59,308)
Net operating cash flows 7 514,051 457,682
CASH FLOWS FROM INVESTING ACTIVITIES
Payments for purchase of controlled entities and businesses (net of cash acquired) and intangible assets including MSRs
(121,164) (110,700)
Proceeds from sale of property, plant and equipment - 66,240
(Payments for)/proceeds from disposal of associates and joint ventures (11,866) 23,786
Proceeds from/(payments for) investments 3,776 1,489
Payments for property, plant and equipment (39,361) (34,215)
Net investing cash flows (168,615) (53,400)
CASH FLOWS FROM FINANCING ACTIVITIES
Payment for purchase of ordinary shares – share based awards (20,158) (15,105)
Proceeds from borrowings 1,337,297 466,047
Repayment of borrowings (1,353,618) (680,565)
Loan servicing borrowings (net) (75,697) (13,586)
Dividends paid – ordinary shares (net of dividend reinvestment plan) (150,116) (129,672)
Purchase of ordinary shares – dividend reinvestment plan (10,368) (10,006)
Dividends paid to non-controlling interests in controlled entities (3) (2)
Payments for on-market share buy-back (38,533) (3,458)
Repayment of finance leases (5,390) (30,071)
Net financing cash flows (316,586) (416,418)
Net increase/(decrease) in cash and cash equivalents held 28,850 (12,136)
Cash and cash equivalents at the beginning of the financial year 510,683 526,575
Exchange rate variations on foreign cash balances (4,864) (3,756)
Cash and cash equivalents at the end of the year* 534,669 510,683
* Cash and cash equivalents at 30 June 2018 includes $33.8 million (2017: $20.8 million) cash presented in the assets classified as held for sale line item in the consolidated statement of financial position.
CONSOLIDATED CASH FLOW STATEMENT for the year ended 30 June 2018
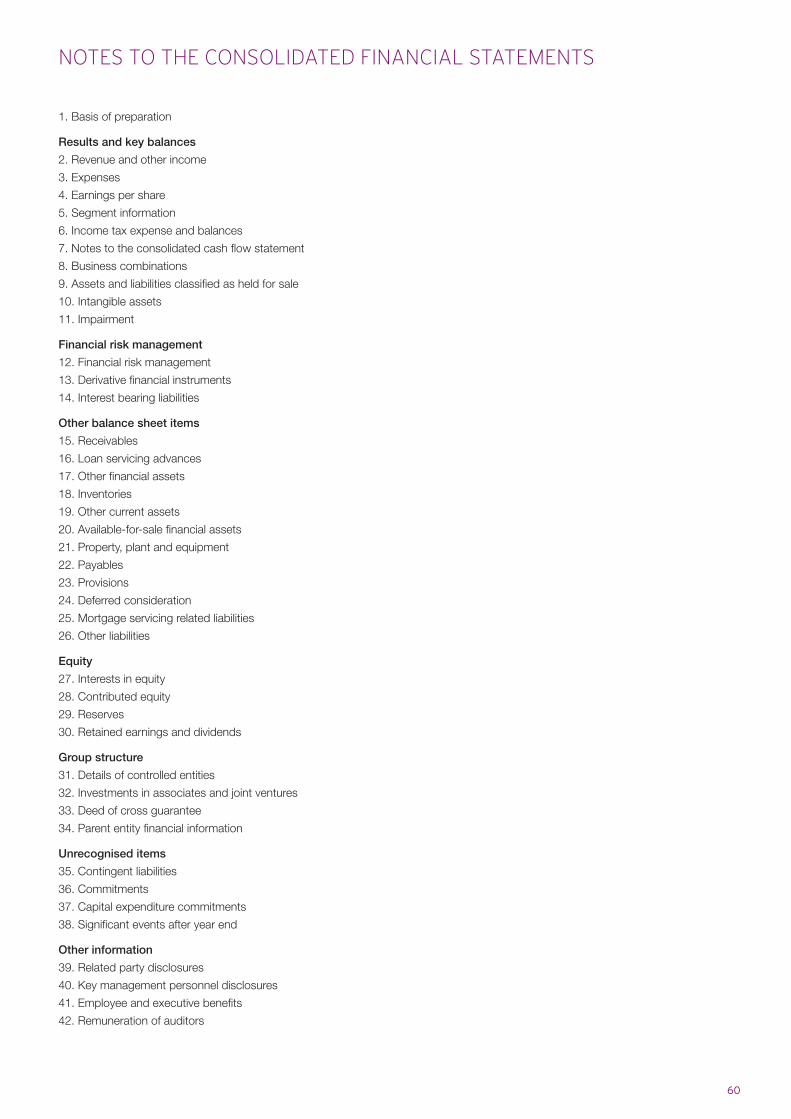
60
1. Basis of preparation
Results and key balances
2. Revenue and other income
3. Expenses
4. Earnings per share
5. Segment information
6. Income tax expense and balances
7. Notes to the consolidated cash flow statement
8. Business combinations
9. Assets and liabilities classified as held for sale
10. Intangible assets
11. Impairment
Financial risk management
12. Financial risk management
13. Derivative financial instruments
14. Interest bearing liabilities
Other balance sheet items
15. Receivables
16. Loan servicing advances
17. Other financial assets
18. Inventories
19. Other current assets
20. Available-for-sale financial assets
21. Property, plant and equipment
22. Payables
23. Provisions
24. Deferred consideration
25. Mortgage servicing related liabilities
26. Other liabilities
Equity
27. Interests in equity
28. Contributed equity
29. Reserves
30. Retained earnings and dividends
Group structure
31. Details of controlled entities
32. Investments in associates and joint ventures
33. Deed of cross guarantee
34. Parent entity financial information
Unrecognised items
35. Contingent liabilities
36. Commitments
37. Capital expenditure commitments
38. Significant events after year end
Other information
39. Related party disclosures
40. Key management personnel disclosures
41. Employee and executive benefits
42. Remuneration of auditors
NOTES TO THE CONSOLIDATED FINANCIAL STATEMENTS
NOTES TO THE CONSOLIDATED FINANCIAL STATEMENTS
61 Computershare Annual Report 2018
1. BASIS OF PREPARATION
The principal accounting policies adopted in the preparation of the financial report are set out below. These policies have been consistently applied to all the periods presented, unless otherwise stated. The financial report is for the consolidated entity consisting of Computershare Limited and its controlled entities, referred to collectively throughout these financial statements as the “consolidated entity”, “the Group” or “Computershare”.
Basis of preparation of full year financial report
This general purpose financial report for the reporting period ended 30 June 2018 has been prepared in accordance with Australian Accounting Standards, other authoritative pronouncements of the Australian Accounting Standards Board and the Corporations Act 2001. Computershare Limited is a for-profit entity for the purpose of preparing financial statements.
This report is to be read in conjunction with any public announcements made by Computershare Limited during the reporting period in accordance with the continuous disclosure requirements of the Corporations Act 2001 and Australian Securities Exchange Listing Rules.
Where necessary, comparative figures have been adjusted to conform with changes in presentation in the current period.
Compliance with IFRS
The financial statements of Computershare Limited and its controlled entities also comply with International Financial Reporting Standards (IFRS) as issued by the International Accounting Standards Board (IASB).
Changes to conceptual framework
Changes to the Conceptual Framework for Financial Reporting have been issued by the International Accounting Standards Board. Amendments were made to apply new definition and recognition criteria for assets, liabilities, income and expenses in the framework, which will apply for years commencing on or after 1 January 2020. The changes could affect entities that use the Conceptual Framework to develop accounting policies for transactions, events or conditions that are not otherwise dealt with under existing IFRS Standards. The Group has not yet determined the impact of adopting the criteria in the new framework.
Historical cost convention
The financial statements have been prepared under the historical cost convention as modified by the revaluation of available-for-sale financial assets and financial assets and liabilities (including derivative instruments) at fair value through profit or loss.
Principles of consolidation
The consolidated financial statements include the assets and liabilities of the parent entity, Computershare Limited, and its controlled entities.
All intercompany balances and transactions have been eliminated. Where an entity either began or ceased to be controlled during the year, the results are consolidated only from the date control commenced or up to the date control ceased.
Financial statements of foreign controlled entities, associates and joint ventures presented in accordance with overseas accounting principles are, for consolidation purposes, adjusted to comply with Group policy and Australian Accounting Standards.
Controlled entities
Controlled entities are all those entities over which the Group has control. The Group controls an entity when the Group is exposed to, or has rights to, variable returns from its involvement with the entity and has the ability to affect those returns through its power over the entity. Controlled entities are fully consolidated from the date on which control is transferred to the Group. They are de-consolidated from the date that control ceases.
The acquisition method of accounting is used to account for the acquisition of controlled entities by the Group.
Investments in associated entities
Associates are all entities over which the Group has significant influence but not control or joint control. This generally accompanies a shareholding of between 20% and 50% of the voting rights. Interests in associates are accounted for using the equity method.
Investments in joint ventures
Joint ventures are arrangements where Computershare has joint control with another party over that arrangement and each party has rights to the net assets of that arrangement. Joint control is the agreed sharing of control, which exists when decisions about relevant activities require unanimous consent of parties sharing control. Interests in joint ventures are accounted for using the equity method.
Changes in ownership interests
The Group treats transactions with non-controlling interests that do not result in a loss of control as transactions with equity owners of the Group. A change in ownership interest results in an adjustment between the carrying amounts of the controlling and non-controlling interests to reflect their relative interests in the controlled entity. Any difference between the amount of the adjustment to non-controlling interests and any consideration paid or received is recognised in a separate reserve within equity attributable to owners of the parent entity.
62
Foreign currency
Functional and presentation currency
Items included in the financial statements of each of the Group’s entities are measured using the currency of the primary economic environment in which the entity operates (the ‘functional currency’). The consolidated financial statements are presented in US dollars as a significant portion of the Group’s activity is denominated in US dollars.
Transactions and balances
Foreign currency transactions are converted to US dollars at exchange rates approximating those in effect at the date of each transaction. Amounts payable and receivable in foreign currencies at balance date are converted to US dollars at the average of the buy and sell rates available on the close of business at balance date. Revaluation gains and losses are brought to account as they occur.
Exchange differences relating to monetary items are included in profit or loss, as exchange gains or losses, in the period when the exchange rates change, except when deferred in equity as qualifying cash flow hedges and qualifying net investment hedges.
Group companies
The results and financial position of all the Group entities that have a functional currency different from the presentation currency are translated into the presentation currency as follows:
> Assets and liabilities for each presented statement of financial position are translated at the closing rate at the date of that statement
> Income and expenses for each statement of comprehensive income are translated at average exchange rates
> All resulting exchange differences are recognised in other comprehensive income
On consolidation, exchange differences arising from the translation of any net investment in foreign entities, and of borrowings and other currency instruments designated as hedges of such investments, are recognised in other comprehensive income and reflected in equity.
Goodwill and fair value adjustments arising on acquisition of a foreign entity are treated as assets and liabilities of the foreign entity and are translated at the closing rate.
Key estimates and judgements
Estimates and judgements are continually evaluated and are based on historical experience and other factors, including expectations of future events that may have a financial impact on the entity and that are believed to be reasonable under the circumstances.
The Group makes estimates and assumptions concerning the future. The resulting accounting estimates will, by definition, seldom equal the related actual results. The significant estimates and assumptions made in the current financial year are set out in the relevant notes:
Note Key accounting estimates and judgements
2 Revenue and other income
6 Provision for income tax
6 Deferred tax assets relating to carry forward tax losses
8 Accounting for business combinations
11 Impairment
Rounding of amounts
The consolidated entity is of a kind referred to in ASIC Corporations (Rounding in Financial/Directors’ Reports) Instrument 2016/191, issued by the Australian Securities and Investments Commission, relating to the ‘rounding off’ of amounts in the financial report. In accordance with this instrument, amounts in the financial report have been rounded off to the nearest thousand dollars, or in certain cases, the nearest dollar.
New and amended accounting standards and interpretations adopted from 1 July 2017
The Group has adopted the following standards and amendments commencing 1 July 2017:
> AASB 2016-1 Amendments to Australian Accounting Standards – Recognition of Deferred Tax Assets for Unrealised Losses
> AASB 2016-2 Amendments to Australian Accounting Standards – Disclosure Initiative: Amendments to AASB 107; and
> AASB 2017-2 Amendments to Australian Accounting Standards – Further Annual Improvements 2014-2016 Cycle
The adoption of these amendments did not have any impact on the amounts recognised in the current period or any prior period and is not likely to affect future periods.
The amendments to AASB 107 include a requirement to provide a reconciliation of liabilities arising from financing activities in the financial report, refer to note 7c).
NOTES TO THE CONSOLIDATED FINANCIAL STATEMENTS
63 Computershare Annual Report 2018
New and amended standards and interpretations issued but not yet effective
Certain new accounting standards have been published that are not mandatory for the reporting period ended 30 June 2018 and have not been early adopted by the Group. The Group’s assessment of the impact of these new standards is set out below.
AASB 15 Revenue from contracts with customers
AASB 15 is a new standard in relation to recognition of revenue and will replace AASB 118 which covers revenue arising from the sale of goods and services and AASB 111 which covers construction contracts. This standard is mandatory for financial years commencing on or after 1 January 2018.
Under AASB 15, revenue is recognised in a manner that depicts the transfer of promised goods or services to customers in an amount that reflects the consideration to which the provider of the goods or services expects to be entitled. The new standard requires adoption of the following 5-step model of revenue recognition:
> Identify the contract with a customer
> Identify performance obligations under the contract
> Determine transaction price
> Allocate transaction price to performance obligations under the contract
> Recognise revenue when or as the entity satisfies its performance obligations
The Group has completed its assessment of the effects of applying the new standard on the Group’s financial statements and adopted AASB 15 on 1 July 2018. The new standard will result in two minor changes to the Group’s revenue recognition policy:
1. Shareholder meetings
Some of the Group’s customer contracts in the registry business line include the shareholder meeting service in the general registry maintenance fee, which is recognised as revenue over time as the registry maintenance service is provided. This means that for the contracts where the shareholder meeting fee is not billed separately, the portion of the fee attributable to the shareholder meeting service is currently recognised progressively over the year. Under AASB 15, revenue related to shareholder meetings will always be recognised at a point in time when the shareholder meeting service has been provided. This change will result in deferral of some of the registry revenue from the first half of the financial year to the second half. This change does not affect full year’s results and its impact is expected to be immaterial to the Group.
2. Upfront fees
There are a number of customer contracts in the Group’s registry, plan managers and business services business lines which include an upfront fee charged at the beginning of the contract for set up and implementation activities. The upfront fees are currently recognised when billed at the beginning of the contract. Under AASB 15, most of the upfront fees will be classified as fulfilment activity and recognised straight line over the relevant contract term. Where the related implementation costs can be measured reliably, they will also be deferred and amortised over the same period. The impact of this change is expected to be immaterial to the Group.
The Group will apply the modified retrospective method of implementation of AASB 15.
AASB 9 Financial Instruments
AASB 9 addresses the classification, measurement and derecognition of financial assets and financial liabilities and introduces new rules for hedge accounting and a new impairment model for financial assets. The standard is mandatory for financial years commencing on or after 1 January 2018 and the Group will apply AASB 9 in the financial year beginning 1 July 2018.
The Group has reviewed its financial assets and liabilities and has identified the following impact from the adoption of the new standard on 1 July 2018:
1. Provisioning for impairment
The new impairment model requires recognition of impairment provisions based on expected credit losses rather than incurred credit losses as is the case under AASB 139. Expected credit losses are probability-weighted amounts determined by evaluating a range of possible outcomes and taking into account the time value of money, past events, current conditions and forecasts of future economic conditions. The Group has completed its assessment of the effects of the new impairment model. Computershare’s methodology for calculating provisions for impairment will change under AASB 9 but the impact is not material for the Group.
2. Classification and measurement
The available-for-sale equity securities and investments in structured entities, that are currently revalued through other comprehensive income, will be classified as financial assets at fair value through profit or loss (FVTPL). In the current reporting period, the Group recognised a loss of $0.02 million in other comprehensive income that would have been recognised directly in profit or loss under AASB 9.
The available-for-sale debt securities will be classified as financial assets at fair value through other comprehensive income (OCI), where the contractual cash flows are solely principal and interest and the objective of the Group’s business model is achieved by both collecting contractual cash flows and selling financial assets.
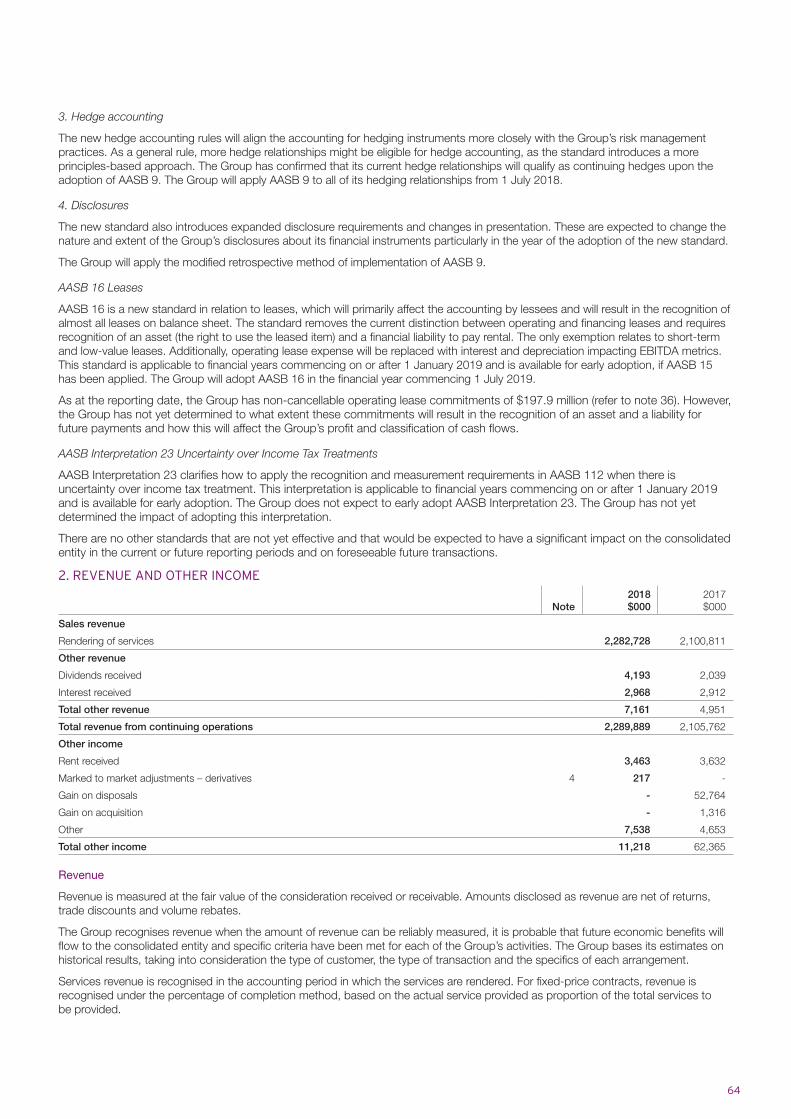
64
3. Hedge accounting
The new hedge accounting rules will align the accounting for hedging instruments more closely with the Group’s risk management practices. As a general rule, more hedge relationships might be eligible for hedge accounting, as the standard introduces a more principles-based approach. The Group has confirmed that its current hedge relationships will qualify as continuing hedges upon the adoption of AASB 9. The Group will apply AASB 9 to all of its hedging relationships from 1 July 2018.
4. Disclosures
The new standard also introduces expanded disclosure requirements and changes in presentation. These are expected to change the nature and extent of the Group’s disclosures about its financial instruments particularly in the year of the adoption of the new standard.
The Group will apply the modified retrospective method of implementation of AASB 9.
AASB 16 Leases
AASB 16 is a new standard in relation to leases, which will primarily affect the accounting by lessees and will result in the recognition of almost all leases on balance sheet. The standard removes the current distinction between operating and financing leases and requires recognition of an asset (the right to use the leased item) and a financial liability to pay rental. The only exemption relates to short-term and low-value leases. Additionally, operating lease expense will be replaced with interest and depreciation impacting EBITDA metrics. This standard is applicable to financial years commencing on or after 1 January 2019 and is available for early adoption, if AASB 15 has been applied. The Group will adopt AASB 16 in the financial year commencing 1 July 2019.
As at the reporting date, the Group has non-cancellable operating lease commitments of $197.9 million (refer to note 36). However, the Group has not yet determined to what extent these commitments will result in the recognition of an asset and a liability for future payments and how this will affect the Group’s profit and classification of cash flows.
AASB Interpretation 23 Uncertainty over Income Tax Treatments
AASB Interpretation 23 clarifies how to apply the recognition and measurement requirements in AASB 112 when there is uncertainty over income tax treatment. This interpretation is applicable to financial years commencing on or after 1 January 2019 and is available for early adoption. The Group does not expect to early adopt AASB Interpretation 23. The Group has not yet determined the impact of adopting this interpretation.
There are no other standards that are not yet effective and that would be expected to have a significant impact on the consolidated entity in the current or future reporting periods and on foreseeable future transactions.
2. REVENUE AND OTHER INCOME
Note2018$000
2017$000
Sales revenue
Rendering of services 2,282,728 2,100,811
Other revenue
Dividends received 4,193 2,039
Interest received 2,968 2,912
Total other revenue 7,161 4,951
Total revenue from continuing operations 2,289,889 2,105,762
Other income
Rent received 3,463 3,632
Marked to market adjustments – derivatives 4 217 -
Gain on disposals - 52,764
Gain on acquisition - 1,316
Other 7,538 4,653
Total other income 11,218 62,365
Revenue
Revenue is measured at the fair value of the consideration received or receivable. Amounts disclosed as revenue are net of returns, trade discounts and volume rebates.
The Group recognises revenue when the amount of revenue can be reliably measured, it is probable that future economic benefits will flow to the consolidated entity and specific criteria have been met for each of the Group’s activities. The Group bases its estimates on historical results, taking into consideration the type of customer, the type of transaction and the specifics of each arrangement.
Services revenue is recognised in the accounting period in which the services are rendered. For fixed-price contracts, revenue is recognised under the percentage of completion method, based on the actual service provided as proportion of the total services to be provided.
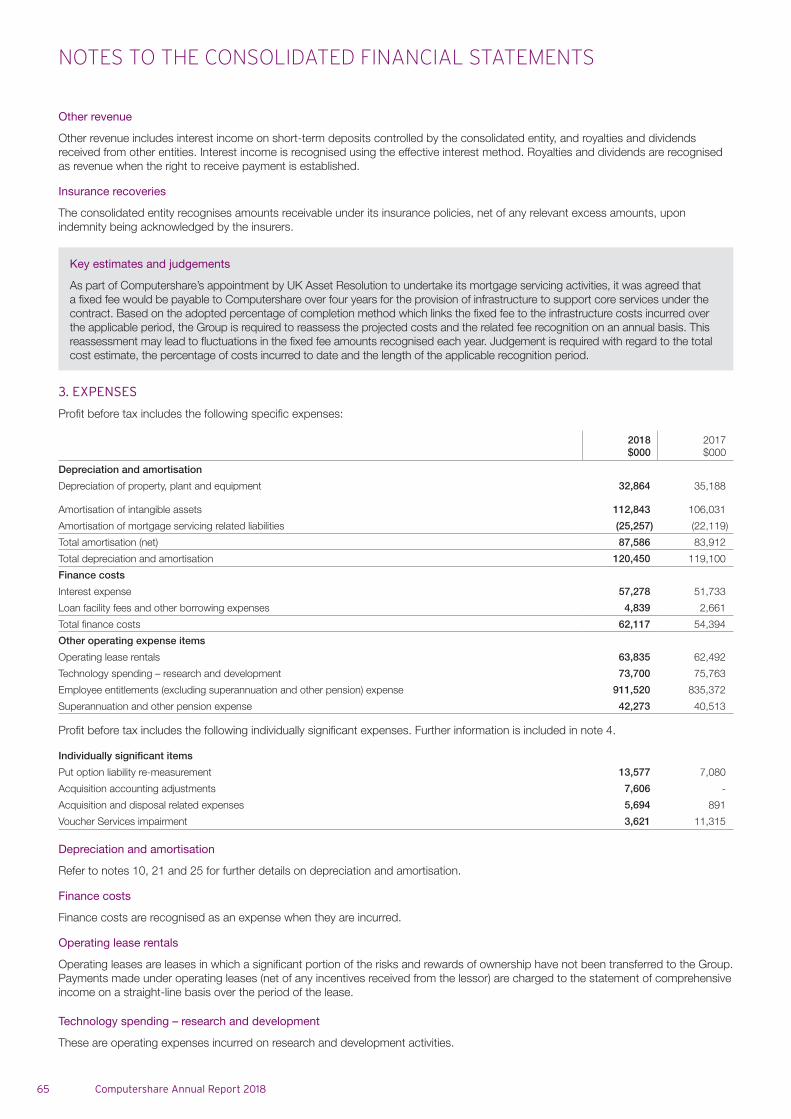
NOTES TO THE CONSOLIDATED FINANCIAL STATEMENTS
65 Computershare Annual Report 2018
Other revenue
Other revenue includes interest income on short-term deposits controlled by the consolidated entity, and royalties and dividends received from other entities. Interest income is recognised using the effective interest method. Royalties and dividends are recognised as revenue when the right to receive payment is established.
Insurance recoveries
The consolidated entity recognises amounts receivable under its insurance policies, net of any relevant excess amounts, upon indemnity being acknowledged by the insurers.
Key estimates and judgements
As part of Computershare’s appointment by UK Asset Resolution to undertake its mortgage servicing activities, it was agreed that a fixed fee would be payable to Computershare over four years for the provision of infrastructure to support core services under the contract. Based on the adopted percentage of completion method which links the fixed fee to the infrastructure costs incurred over the applicable period, the Group is required to reassess the projected costs and the related fee recognition on an annual basis. This reassessment may lead to fluctuations in the fixed fee amounts recognised each year. Judgement is required with regard to the total cost estimate, the percentage of costs incurred to date and the length of the applicable recognition period.
3. EXPENSES
Profit before tax includes the following specific expenses:
2018$000
2017$000
Depreciation and amortisation
Depreciation of property, plant and equipment 32,864 35,188
Amortisation of intangible assets 112,843 106,031
Amortisation of mortgage servicing related liabilities (25,257) (22,119)
Total amortisation (net) 87,586 83,912
Total depreciation and amortisation 120,450 119,100
Finance costs
Interest expense 57,278 51,733
Loan facility fees and other borrowing expenses 4,839 2,661
Total finance costs 62,117 54,394
Other operating expense items
Operating lease rentals 63,835 62,492
Technology spending – research and development 73,700 75,763
Employee entitlements (excluding superannuation and other pension) expense 911,520 835,372
Superannuation and other pension expense 42,273 40,513
Profit before tax includes the following individually significant expenses. Further information is included in note 4.
Individually significant items
Put option liability re-measurement 13,577 7,080
Acquisition accounting adjustments 7,606 -
Acquisition and disposal related expenses 5,694 891
Voucher Services impairment 3,621 11,315
Depreciation and amortisation
Refer to notes 10, 21 and 25 for further details on depreciation and amortisation.
Finance costs
Finance costs are recognised as an expense when they are incurred.
Operating lease rentals
Operating leases are leases in which a significant portion of the risks and rewards of ownership have not been transferred to the Group. Payments made under operating leases (net of any incentives received from the lessor) are charged to the statement of comprehensive income on a straight-line basis over the period of the lease.
Technology spending – research and development
These are operating expenses incurred on research and development activities.
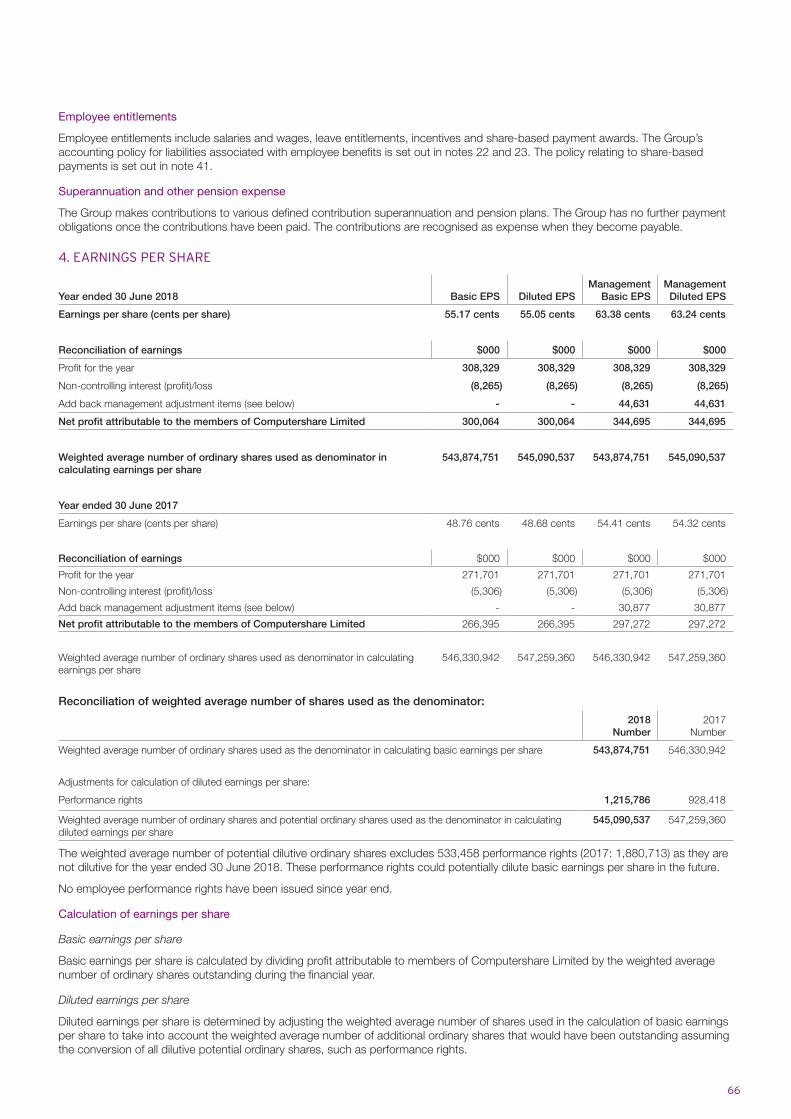
66
Employee entitlements
Employee entitlements include salaries and wages, leave entitlements, incentives and share-based payment awards. The Group’s accounting policy for liabilities associated with employee benefits is set out in notes 22 and 23. The policy relating to share-based payments is set out in note 41.
Superannuation and other pension expense
The Group makes contributions to various defined contribution superannuation and pension plans. The Group has no further payment obligations once the contributions have been paid. The contributions are recognised as expense when they become payable.
4. EARNINGS PER SHARE
Year ended 30 June 2018 Basic EPS Diluted EPSManagement
Basic EPSManagement Diluted EPS
Earnings per share (cents per share) 55.17 cents 55.05 cents 63.38 cents 63.24 cents
Reconciliation of earnings $000 $000 $000 $000
Profit for the year 308,329 308,329 308,329 308,329
Non-controlling interest (profit)/loss (8,265) (8,265) (8,265) (8,265)
Add back management adjustment items (see below) - - 44,631 44,631
Net profit attributable to the members of Computershare Limited 300,064 300,064 344,695 344,695
Weighted average number of ordinary shares used as denominator in calculating earnings per share
543,874,751 545,090,537 543,874,751 545,090,537
Year ended 30 June 2017
Earnings per share (cents per share) 48.76 cents 48.68 cents 54.41 cents 54.32 cents
Reconciliation of earnings $000 $000 $000 $000
Profit for the year 271,701 271,701 271,701 271,701
Non-controlling interest (profit)/loss (5,306) (5,306) (5,306) (5,306)
Add back management adjustment items (see below) - - 30,877 30,877
Net profit attributable to the members of Computershare Limited 266,395 266,395 297,272 297,272
Weighted average number of ordinary shares used as denominator in calculating earnings per share
546,330,942 547,259,360 546,330,942 547,259,360
Reconciliation of weighted average number of shares used as the denominator:
2018Number
2017Number
Weighted average number of ordinary shares used as the denominator in calculating basic earnings per share 543,874,751 546,330,942
Adjustments for calculation of diluted earnings per share:
Performance rights 1,215,786 928,418
Weighted average number of ordinary shares and potential ordinary shares used as the denominator in calculating diluted earnings per share
545,090,537 547,259,360
The weighted average number of potential dilutive ordinary shares excludes 533,458 performance rights (2017: 1,880,713) as they are not dilutive for the year ended 30 June 2018. These performance rights could potentially dilute basic earnings per share in the future.
No employee performance rights have been issued since year end.
Calculation of earnings per share
Basic earnings per share
Basic earnings per share is calculated by dividing profit attributable to members of Computershare Limited by the weighted average number of ordinary shares outstanding during the financial year.
Diluted earnings per share
Diluted earnings per share is determined by adjusting the weighted average number of shares used in the calculation of basic earnings per share to take into account the weighted average number of additional ordinary shares that would have been outstanding assuming the conversion of all dilutive potential ordinary shares, such as performance rights.
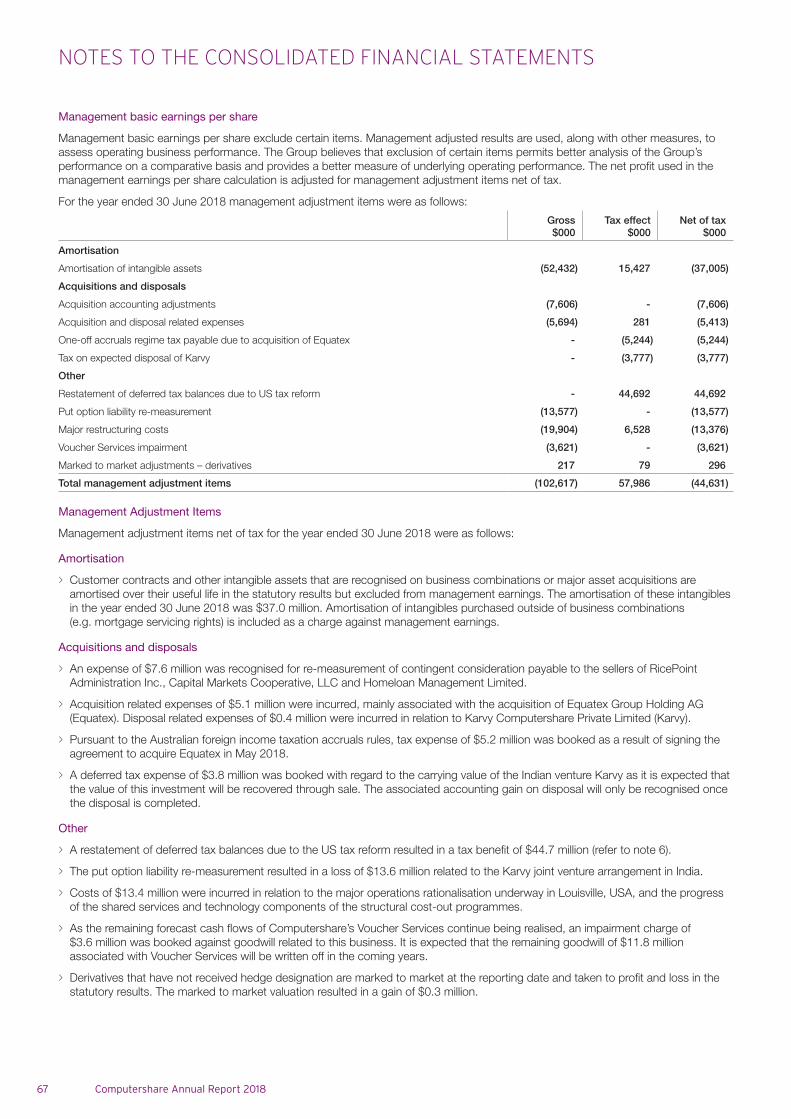
NOTES TO THE CONSOLIDATED FINANCIAL STATEMENTS
67 Computershare Annual Report 2018
Management basic earnings per share
Management basic earnings per share exclude certain items. Management adjusted results are used, along with other measures, to assess operating business performance. The Group believes that exclusion of certain items permits better analysis of the Group’s performance on a comparative basis and provides a better measure of underlying operating performance. The net profit used in the management earnings per share calculation is adjusted for management adjustment items net of tax.
For the year ended 30 June 2018 management adjustment items were as follows:
Gross$000
Tax effect$000
Net of tax$000
Amortisation
Amortisation of intangible assets (52,432) 15,427 (37,005)
Acquisitions and disposals
Acquisition accounting adjustments (7,606) - (7,606)
Acquisition and disposal related expenses (5,694) 281 (5,413)
One-off accruals regime tax payable due to acquisition of Equatex - (5,244) (5,244)
Tax on expected disposal of Karvy - (3,777) (3,777)
Other
Restatement of deferred tax balances due to US tax reform - 44,692 44,692
Put option liability re-measurement (13,577) - (13,577)
Major restructuring costs (19,904) 6,528 (13,376)
Voucher Services impairment (3,621) - (3,621)
Marked to market adjustments – derivatives 217 79 296
Total management adjustment items (102,617) 57,986 (44,631)
Management Adjustment Items
Management adjustment items net of tax for the year ended 30 June 2018 were as follows:
Amortisation
> Customer contracts and other intangible assets that are recognised on business combinations or major asset acquisitions are amortised over their useful life in the statutory results but excluded from management earnings. The amortisation of these intangibles in the year ended 30 June 2018 was $37.0 million. Amortisation of intangibles purchased outside of business combinations (e.g. mortgage servicing rights) is included as a charge against management earnings.
Acquisitions and disposals
> An expense of $7.6 million was recognised for re-measurement of contingent consideration payable to the sellers of RicePoint Administration Inc., Capital Markets Cooperative, LLC and Homeloan Management Limited.
> Acquisition related expenses of $5.1 million were incurred, mainly associated with the acquisition of Equatex Group Holding AG (Equatex). Disposal related expenses of $0.4 million were incurred in relation to Karvy Computershare Private Limited (Karvy).
> Pursuant to the Australian foreign income taxation accruals rules, tax expense of $5.2 million was booked as a result of signing the agreement to acquire Equatex in May 2018.
> A deferred tax expense of $3.8 million was booked with regard to the carrying value of the Indian venture Karvy as it is expected that the value of this investment will be recovered through sale. The associated accounting gain on disposal will only be recognised once the disposal is completed.
Other
> A restatement of deferred tax balances due to the US tax reform resulted in a tax benefit of $44.7 million (refer to note 6).
> The put option liability re-measurement resulted in a loss of $13.6 million related to the Karvy joint venture arrangement in India.
> Costs of $13.4 million were incurred in relation to the major operations rationalisation underway in Louisville, USA, and the progress of the shared services and technology components of the structural cost-out programmes.
> As the remaining forecast cash flows of Computershare’s Voucher Services continue being realised, an impairment charge of $3.6 million was booked against goodwill related to this business. It is expected that the remaining goodwill of $11.8 million associated with Voucher Services will be written off in the coming years.
> Derivatives that have not received hedge designation are marked to market at the reporting date and taken to profit and loss in the statutory results. The marked to market valuation resulted in a gain of $0.3 million.
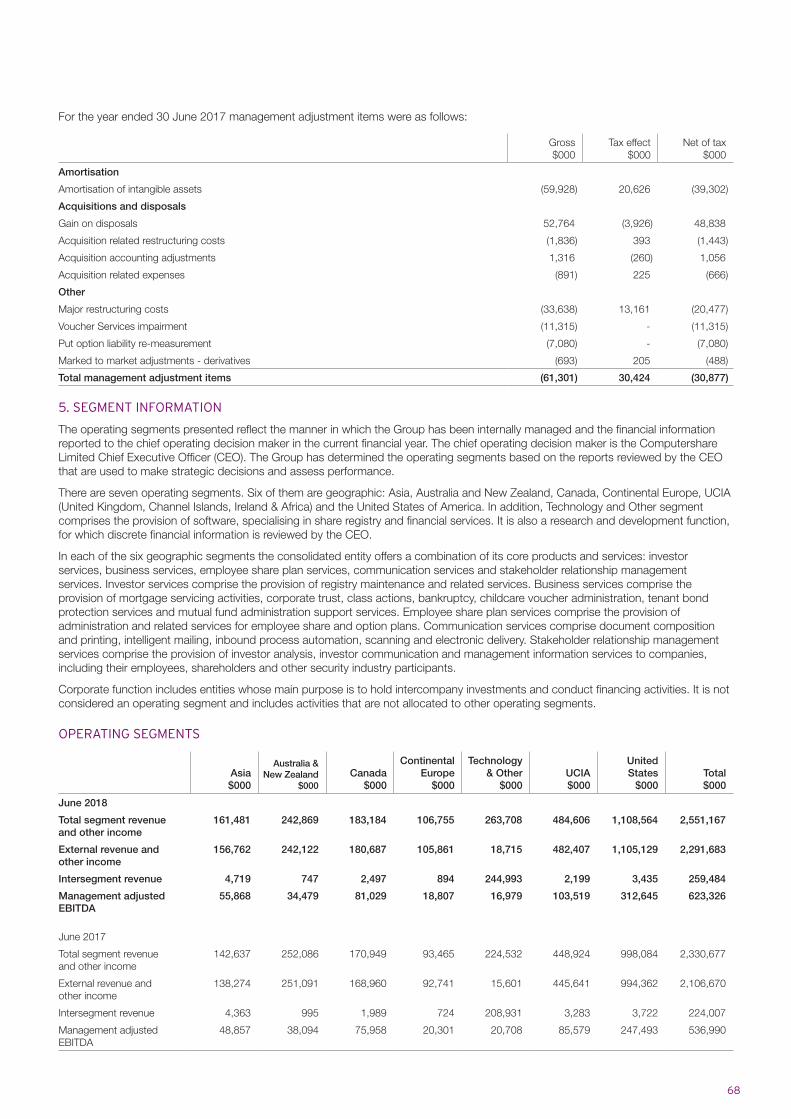
68
For the year ended 30 June 2017 management adjustment items were as follows:
Gross$000
Tax effect$000
Net of tax$000
Amortisation
Amortisation of intangible assets (59,928) 20,626 (39,302)
Acquisitions and disposals
Gain on disposals 52,764 (3,926) 48,838
Acquisition related restructuring costs (1,836) 393 (1,443)
Acquisition accounting adjustments 1,316 (260) 1,056
Acquisition related expenses (891) 225 (666)
Other
Major restructuring costs (33,638) 13,161 (20,477)
Voucher Services impairment (11,315) - (11,315)
Put option liability re-measurement (7,080) - (7,080)
Marked to market adjustments - derivatives (693) 205 (488)
Total management adjustment items (61,301) 30,424 (30,877)
5. SEGMENT INFORMATION
The operating segments presented reflect the manner in which the Group has been internally managed and the financial information reported to the chief operating decision maker in the current financial year. The chief operating decision maker is the Computershare Limited Chief Executive Officer (CEO). The Group has determined the operating segments based on the reports reviewed by the CEO that are used to make strategic decisions and assess performance.
There are seven operating segments. Six of them are geographic: Asia, Australia and New Zealand, Canada, Continental Europe, UCIA (United Kingdom, Channel Islands, Ireland & Africa) and the United States of America. In addition, Technology and Other segment comprises the provision of software, specialising in share registry and financial services. It is also a research and development function, for which discrete financial information is reviewed by the CEO.
In each of the six geographic segments the consolidated entity offers a combination of its core products and services: investor services, business services, employee share plan services, communication services and stakeholder relationship management services. Investor services comprise the provision of registry maintenance and related services. Business services comprise the provision of mortgage servicing activities, corporate trust, class actions, bankruptcy, childcare voucher administration, tenant bond protection services and mutual fund administration support services. Employee share plan services comprise the provision of administration and related services for employee share and option plans. Communication services comprise document composition and printing, intelligent mailing, inbound process automation, scanning and electronic delivery. Stakeholder relationship management services comprise the provision of investor analysis, investor communication and management information services to companies, including their employees, shareholders and other security industry participants.
Corporate function includes entities whose main purpose is to hold intercompany investments and conduct financing activities. It is not considered an operating segment and includes activities that are not allocated to other operating segments.
OPERATING SEGMENTS
Asia$000
Australia & New Zealand
$000Canada
$000
Continental Europe
$000
Technology & Other
$000UCIA$000
United States
$000Total$000
June 2018
Total segment revenue and other income
161,481 242,869 183,184 106,755 263,708 484,606 1,108,564 2,551,167
External revenue and other income
156,762 242,122 180,687 105,861 18,715 482,407 1,105,129 2,291,683
Intersegment revenue 4,719 747 2,497 894 244,993 2,199 3,435 259,484
Management adjusted EBITDA
55,868 34,479 81,029 18,807 16,979 103,519 312,645 623,326
June 2017
Total segment revenue and other income
142,637 252,086 170,949 93,465 224,532 448,924 998,084 2,330,677
External revenue and other income
138,274 251,091 168,960 92,741 15,601 445,641 994,362 2,106,670
Intersegment revenue 4,363 995 1,989 724 208,931 3,283 3,722 224,007
Management adjusted EBITDA
48,857 38,094 75,958 20,301 20,708 85,579 247,493 536,990
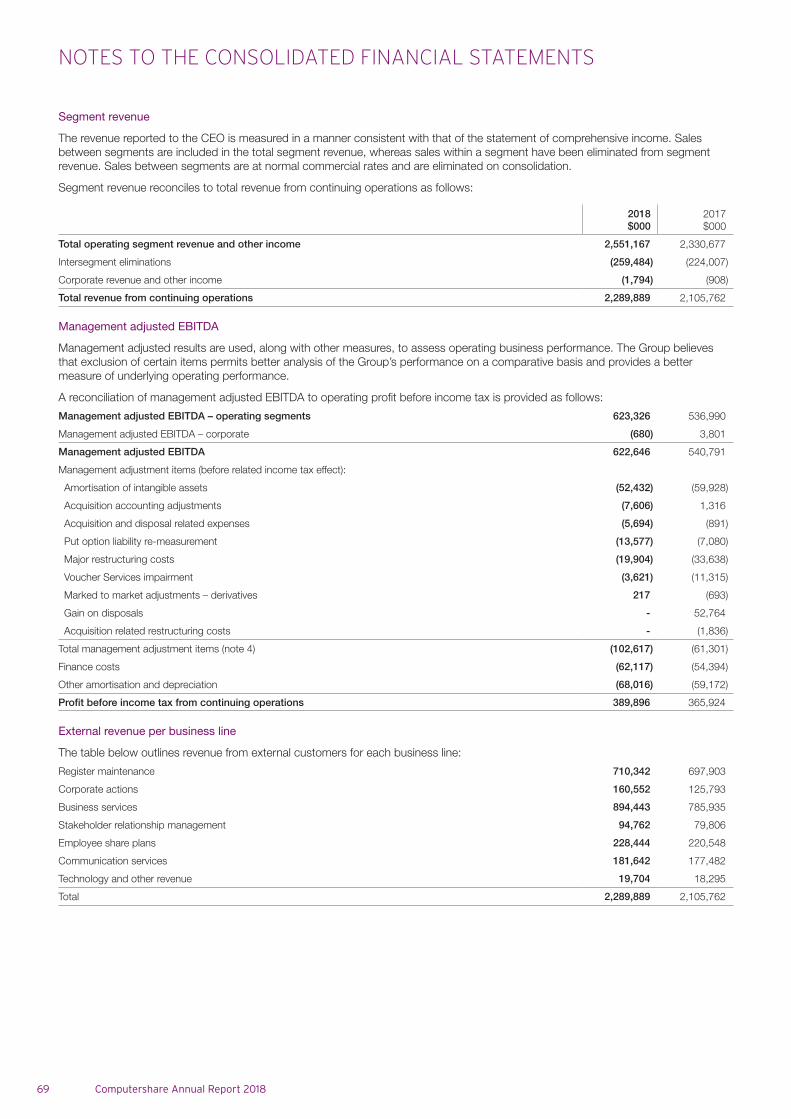
NOTES TO THE CONSOLIDATED FINANCIAL STATEMENTS
69 Computershare Annual Report 2018
Segment revenue
The revenue reported to the CEO is measured in a manner consistent with that of the statement of comprehensive income. Sales between segments are included in the total segment revenue, whereas sales within a segment have been eliminated from segment revenue. Sales between segments are at normal commercial rates and are eliminated on consolidation.
Segment revenue reconciles to total revenue from continuing operations as follows:
2018$000
2017$000
Total operating segment revenue and other income 2,551,167 2,330,677
Intersegment eliminations (259,484) (224,007)
Corporate revenue and other income (1,794) (908)
Total revenue from continuing operations 2,289,889 2,105,762
Management adjusted EBITDA
Management adjusted results are used, along with other measures, to assess operating business performance. The Group believes that exclusion of certain items permits better analysis of the Group’s performance on a comparative basis and provides a better measure of underlying operating performance.
A reconciliation of management adjusted EBITDA to operating profit before income tax is provided as follows:
Management adjusted EBITDA – operating segments 623,326 536,990
Management adjusted EBITDA – corporate (680) 3,801
Management adjusted EBITDA 622,646 540,791
Management adjustment items (before related income tax effect):
Amortisation of intangible assets (52,432) (59,928)
Acquisition accounting adjustments (7,606) 1,316
Acquisition and disposal related expenses (5,694) (891)
Put option liability re-measurement (13,577) (7,080)
Major restructuring costs (19,904) (33,638)
Voucher Services impairment (3,621) (11,315)
Marked to market adjustments – derivatives 217 (693)
Gain on disposals - 52,764
Acquisition related restructuring costs - (1,836)
Total management adjustment items (note 4) (102,617) (61,301)
Finance costs (62,117) (54,394)
Other amortisation and depreciation (68,016) (59,172)
Profit before income tax from continuing operations 389,896 365,924
External revenue per business line
The table below outlines revenue from external customers for each business line:
Register maintenance 710,342 697,903
Corporate actions 160,552 125,793
Business services 894,443 785,935
Stakeholder relationship management 94,762 79,806
Employee share plans 228,444 220,548
Communication services 181,642 177,482
Technology and other revenue 19,704 18,295
Total 2,289,889 2,105,762
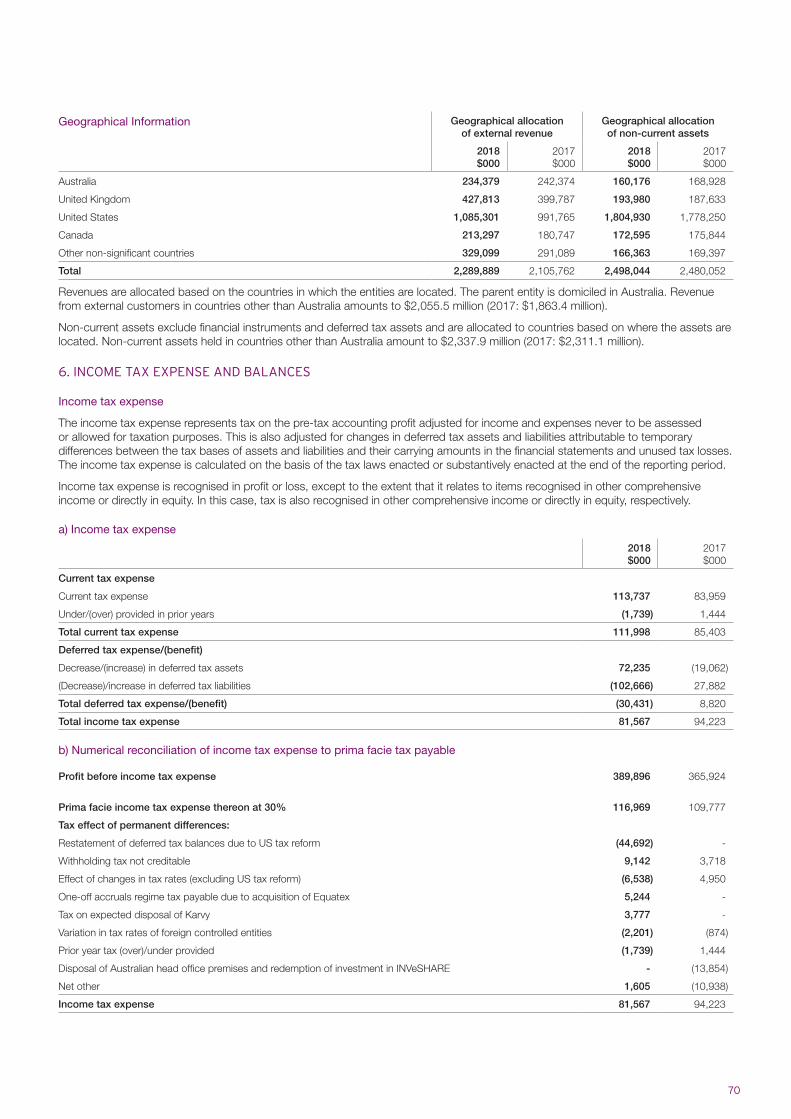
70
Geographical Information Geographical allocation of external revenue
Geographical allocation of non-current assets
2018$000
2017$000
2018$000
2017$000
Australia 234,379 242,374 160,176 168,928
United Kingdom 427,813 399,787 193,980 187,633
United States 1,085,301 991,765 1,804,930 1,778,250
Canada 213,297 180,747 172,595 175,844
Other non-significant countries 329,099 291,089 166,363 169,397
Total 2,289,889 2,105,762 2,498,044 2,480,052
Revenues are allocated based on the countries in which the entities are located. The parent entity is domiciled in Australia. Revenue from external customers in countries other than Australia amounts to $2,055.5 million (2017: $1,863.4 million).
Non-current assets exclude financial instruments and deferred tax assets and are allocated to countries based on where the assets are located. Non-current assets held in countries other than Australia amount to $2,337.9 million (2017: $2,311.1 million).
6. INCOME TAX EXPENSE AND BALANCES
Income tax expense
The income tax expense represents tax on the pre-tax accounting profit adjusted for income and expenses never to be assessed or allowed for taxation purposes. This is also adjusted for changes in deferred tax assets and liabilities attributable to temporary differences between the tax bases of assets and liabilities and their carrying amounts in the financial statements and unused tax losses. The income tax expense is calculated on the basis of the tax laws enacted or substantively enacted at the end of the reporting period.
Income tax expense is recognised in profit or loss, except to the extent that it relates to items recognised in other comprehensive income or directly in equity. In this case, tax is also recognised in other comprehensive income or directly in equity, respectively.
a) Income tax expense
2018$000
2017$000
Current tax expense
Current tax expense 113,737 83,959
Under/(over) provided in prior years (1,739) 1,444
Total current tax expense 111,998 85,403
Deferred tax expense/(benefit)
Decrease/(increase) in deferred tax assets 72,235 (19,062)
(Decrease)/increase in deferred tax liabilities (102,666) 27,882
Total deferred tax expense/(benefit) (30,431) 8,820
Total income tax expense 81,567 94,223
b) Numerical reconciliation of income tax expense to prima facie tax payable
Profit before income tax expense 389,896 365,924
Prima facie income tax expense thereon at 30% 116,969 109,777
Tax effect of permanent differences:
Restatement of deferred tax balances due to US tax reform (44,692) -
Withholding tax not creditable 9,142 3,718
Effect of changes in tax rates (excluding US tax reform) (6,538) 4,950
One-off accruals regime tax payable due to acquisition of Equatex 5,244 -
Tax on expected disposal of Karvy 3,777 -
Variation in tax rates of foreign controlled entities (2,201) (874)
Prior year tax (over)/under provided (1,739) 1,444
Disposal of Australian head office premises and redemption of investment in INVeSHARE - (13,854)
Net other 1,605 (10,938)
Income tax expense 81,567 94,223
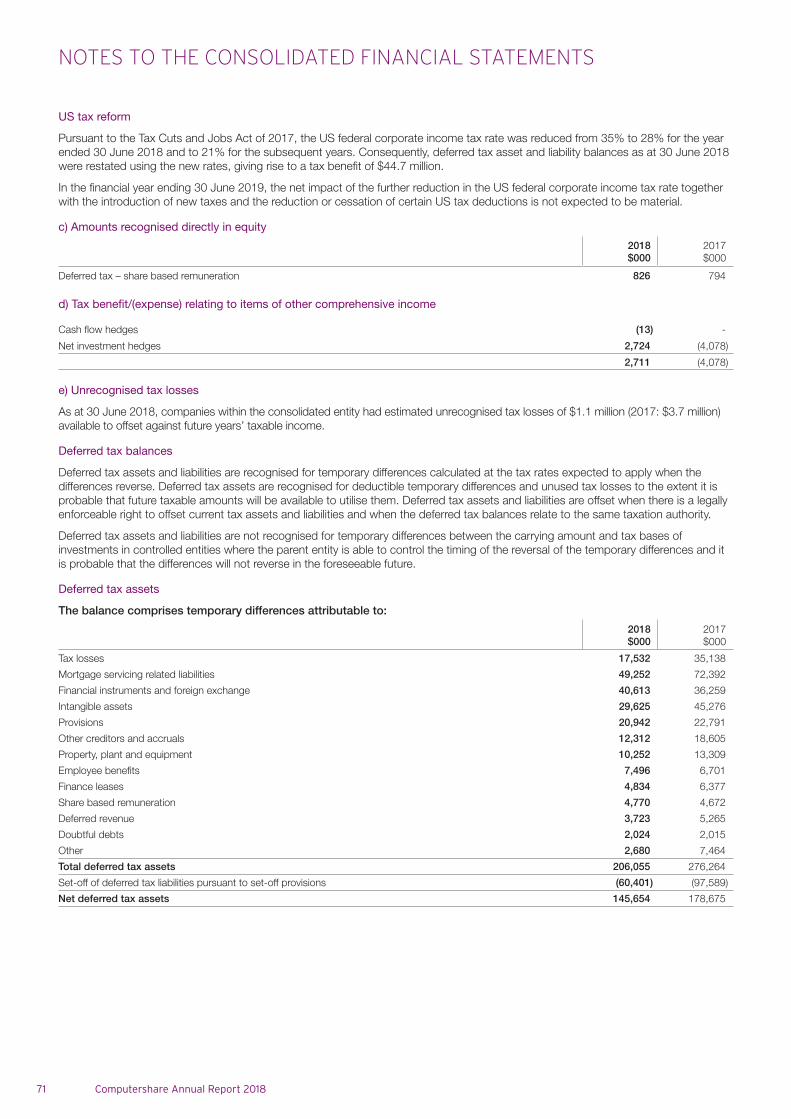
NOTES TO THE CONSOLIDATED FINANCIAL STATEMENTS
71 Computershare Annual Report 2018
US tax reform
Pursuant to the Tax Cuts and Jobs Act of 2017, the US federal corporate income tax rate was reduced from 35% to 28% for the year ended 30 June 2018 and to 21% for the subsequent years. Consequently, deferred tax asset and liability balances as at 30 June 2018 were restated using the new rates, giving rise to a tax benefit of $44.7 million.
In the financial year ending 30 June 2019, the net impact of the further reduction in the US federal corporate income tax rate together with the introduction of new taxes and the reduction or cessation of certain US tax deductions is not expected to be material.
c) Amounts recognised directly in equity
2018$000
2017$000
Deferred tax – share based remuneration 826 794
d) Tax benefit/(expense) relating to items of other comprehensive income
Cash flow hedges (13) -
Net investment hedges 2,724 (4,078)
2,711 (4,078)
e) Unrecognised tax losses
As at 30 June 2018, companies within the consolidated entity had estimated unrecognised tax losses of $1.1 million (2017: $3.7 million) available to offset against future years’ taxable income.
Deferred tax balances
Deferred tax assets and liabilities are recognised for temporary differences calculated at the tax rates expected to apply when the differences reverse. Deferred tax assets are recognised for deductible temporary differences and unused tax losses to the extent it is probable that future taxable amounts will be available to utilise them. Deferred tax assets and liabilities are offset when there is a legally enforceable right to offset current tax assets and liabilities and when the deferred tax balances relate to the same taxation authority.
Deferred tax assets and liabilities are not recognised for temporary differences between the carrying amount and tax bases of investments in controlled entities where the parent entity is able to control the timing of the reversal of the temporary differences and it is probable that the differences will not reverse in the foreseeable future.
Deferred tax assets
The balance comprises temporary differences attributable to:
2018$000
2017$000
Tax losses 17,532 35,138
Mortgage servicing related liabilities 49,252 72,392
Financial instruments and foreign exchange 40,613 36,259
Intangible assets 29,625 45,276
Provisions 20,942 22,791
Other creditors and accruals 12,312 18,605
Property, plant and equipment 10,252 13,309
Employee benefits 7,496 6,701
Finance leases 4,834 6,377
Share based remuneration 4,770 4,672
Deferred revenue 3,723 5,265
Doubtful debts 2,024 2,015
Other 2,680 7,464
Total deferred tax assets 206,055 276,264
Set-off of deferred tax liabilities pursuant to set-off provisions (60,401) (97,589)
Net deferred tax assets 145,654 178,675
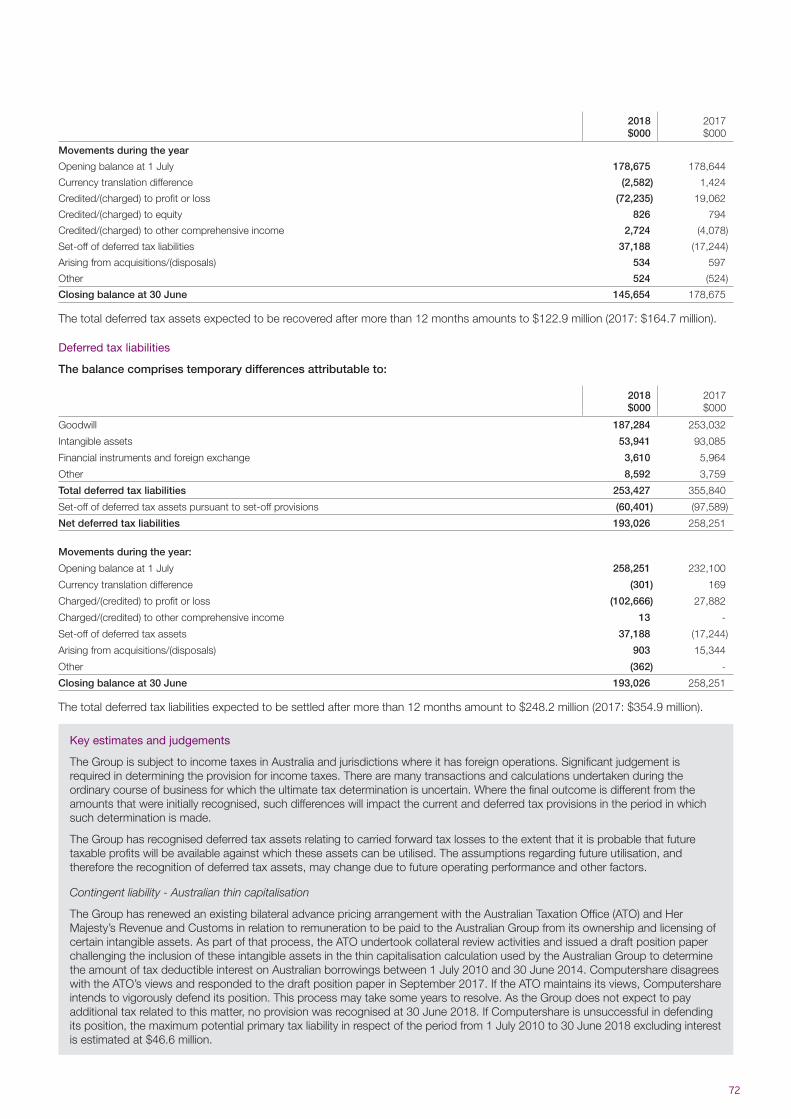
72
2018$000
2017$000
Movements during the year
Opening balance at 1 July 178,675 178,644
Currency translation difference (2,582) 1,424
Credited/(charged) to profit or loss (72,235) 19,062
Credited/(charged) to equity 826 794
Credited/(charged) to other comprehensive income 2,724 (4,078)
Set-off of deferred tax liabilities 37,188 (17,244)
Arising from acquisitions/(disposals) 534 597
Other 524 (524)
Closing balance at 30 June 145,654 178,675
The total deferred tax assets expected to be recovered after more than 12 months amounts to $122.9 million (2017: $164.7 million).
Deferred tax liabilities
The balance comprises temporary differences attributable to:
2018$000
2017$000
Goodwill 187,284 253,032
Intangible assets 53,941 93,085
Financial instruments and foreign exchange 3,610 5,964
Other 8,592 3,759
Total deferred tax liabilities 253,427 355,840
Set-off of deferred tax assets pursuant to set-off provisions (60,401) (97,589)
Net deferred tax liabilities 193,026 258,251
Movements during the year:
Opening balance at 1 July 258,251 232,100
Currency translation difference (301) 169
Charged/(credited) to profit or loss (102,666) 27,882
Charged/(credited) to other comprehensive income 13 -
Set-off of deferred tax assets 37,188 (17,244)
Arising from acquisitions/(disposals) 903 15,344
Other (362) -
Closing balance at 30 June 193,026 258,251
The total deferred tax liabilities expected to be settled after more than 12 months amount to $248.2 million (2017: $354.9 million).
Key estimates and judgements
The Group is subject to income taxes in Australia and jurisdictions where it has foreign operations. Significant judgement is required in determining the provision for income taxes. There are many transactions and calculations undertaken during the ordinary course of business for which the ultimate tax determination is uncertain. Where the final outcome is different from the amounts that were initially recognised, such differences will impact the current and deferred tax provisions in the period in which such determination is made.
The Group has recognised deferred tax assets relating to carried forward tax losses to the extent that it is probable that future taxable profits will be available against which these assets can be utilised. The assumptions regarding future utilisation, and therefore the recognition of deferred tax assets, may change due to future operating performance and other factors.
Contingent liability - Australian thin capitalisation
The Group has renewed an existing bilateral advance pricing arrangement with the Australian Taxation Office (ATO) and Her Majesty’s Revenue and Customs in relation to remuneration to be paid to the Australian Group from its ownership and licensing of certain intangible assets. As part of that process, the ATO undertook collateral review activities and issued a draft position paper challenging the inclusion of these intangible assets in the thin capitalisation calculation used by the Australian Group to determine the amount of tax deductible interest on Australian borrowings between 1 July 2010 and 30 June 2014. Computershare disagrees with the ATO’s views and responded to the draft position paper in September 2017. If the ATO maintains its views, Computershare intends to vigorously defend its position. This process may take some years to resolve. As the Group does not expect to pay additional tax related to this matter, no provision was recognised at 30 June 2018. If Computershare is unsuccessful in defending its position, the maximum potential primary tax liability in respect of the period from 1 July 2010 to 30 June 2018 excluding interest is estimated at $46.6 million.
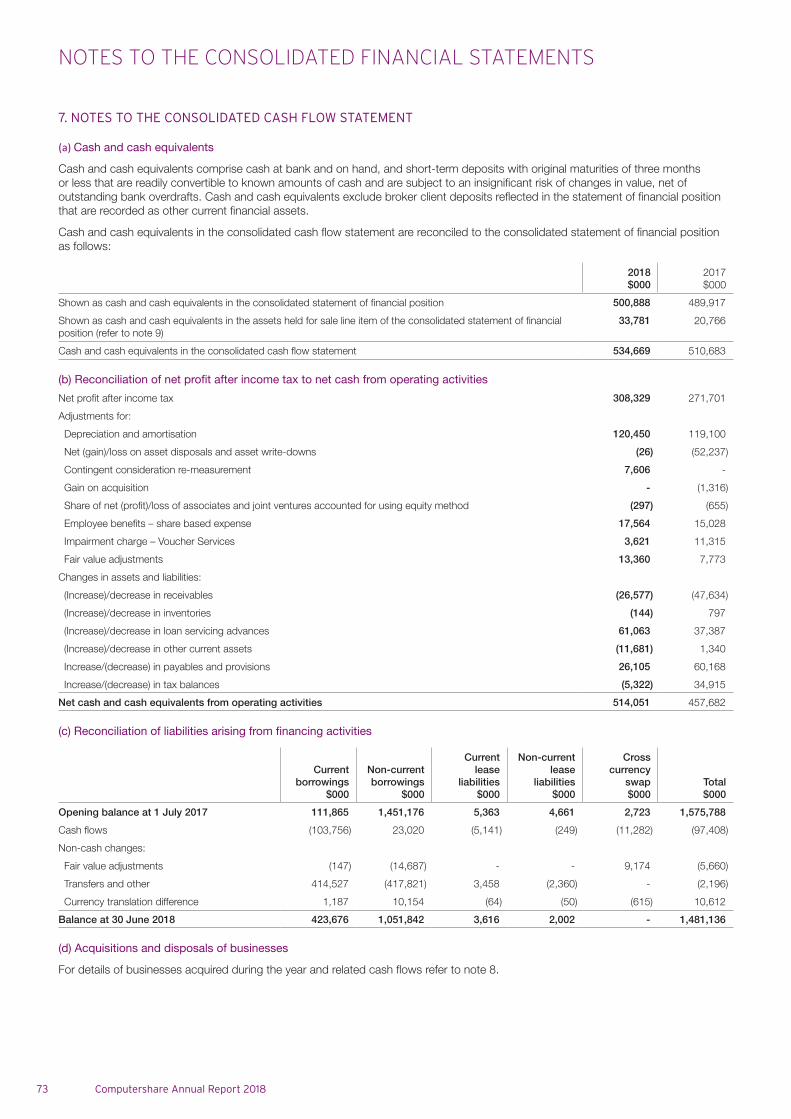
NOTES TO THE CONSOLIDATED FINANCIAL STATEMENTS
73 Computershare Annual Report 2018
7. NOTES TO THE CONSOLIDATED CASH FLOW STATEMENT
(a) Cash and cash equivalents
Cash and cash equivalents comprise cash at bank and on hand, and short-term deposits with original maturities of three months or less that are readily convertible to known amounts of cash and are subject to an insignificant risk of changes in value, net of outstanding bank overdrafts. Cash and cash equivalents exclude broker client deposits reflected in the statement of financial position that are recorded as other current financial assets.
Cash and cash equivalents in the consolidated cash flow statement are reconciled to the consolidated statement of financial position as follows:
2018$000
2017$000
Shown as cash and cash equivalents in the consolidated statement of financial position 500,888 489,917
Shown as cash and cash equivalents in the assets held for sale line item of the consolidated statement of financial position (refer to note 9)
33,781 20,766
Cash and cash equivalents in the consolidated cash flow statement 534,669 510,683
(b) Reconciliation of net profit after income tax to net cash from operating activities
Net profit after income tax 308,329 271,701
Adjustments for:
Depreciation and amortisation 120,450 119,100
Net (gain)/loss on asset disposals and asset write-downs (26) (52,237)
Contingent consideration re-measurement 7,606 -
Gain on acquisition - (1,316)
Share of net (profit)/loss of associates and joint ventures accounted for using equity method (297) (655)
Employee benefits – share based expense 17,564 15,028
Impairment charge – Voucher Services 3,621 11,315
Fair value adjustments 13,360 7,773
Changes in assets and liabilities:
(Increase)/decrease in receivables (26,577) (47,634)
(Increase)/decrease in inventories (144) 797
(Increase)/decrease in loan servicing advances 61,063 37,387
(Increase)/decrease in other current assets (11,681) 1,340
Increase/(decrease) in payables and provisions 26,105 60,168
Increase/(decrease) in tax balances (5,322) 34,915
Net cash and cash equivalents from operating activities 514,051 457,682
(c) Reconciliation of liabilities arising from financing activities
Current borrowings
$000
Non-current borrowings
$000
Current lease
liabilities$000
Non-current lease
liabilities$000
Cross currency
swap$000
Total$000
Opening balance at 1 July 2017 111,865 1,451,176 5,363 4,661 2,723 1,575,788
Cash flows (103,756) 23,020 (5,141) (249) (11,282) (97,408)
Non-cash changes:
Fair value adjustments (147) (14,687) - - 9,174 (5,660)
Transfers and other 414,527 (417,821) 3,458 (2,360) - (2,196)
Currency translation difference 1,187 10,154 (64) (50) (615) 10,612
Balance at 30 June 2018 423,676 1,051,842 3,616 2,002 - 1,481,136
(d) Acquisitions and disposals of businesses
For details of businesses acquired during the year and related cash flows refer to note 8.
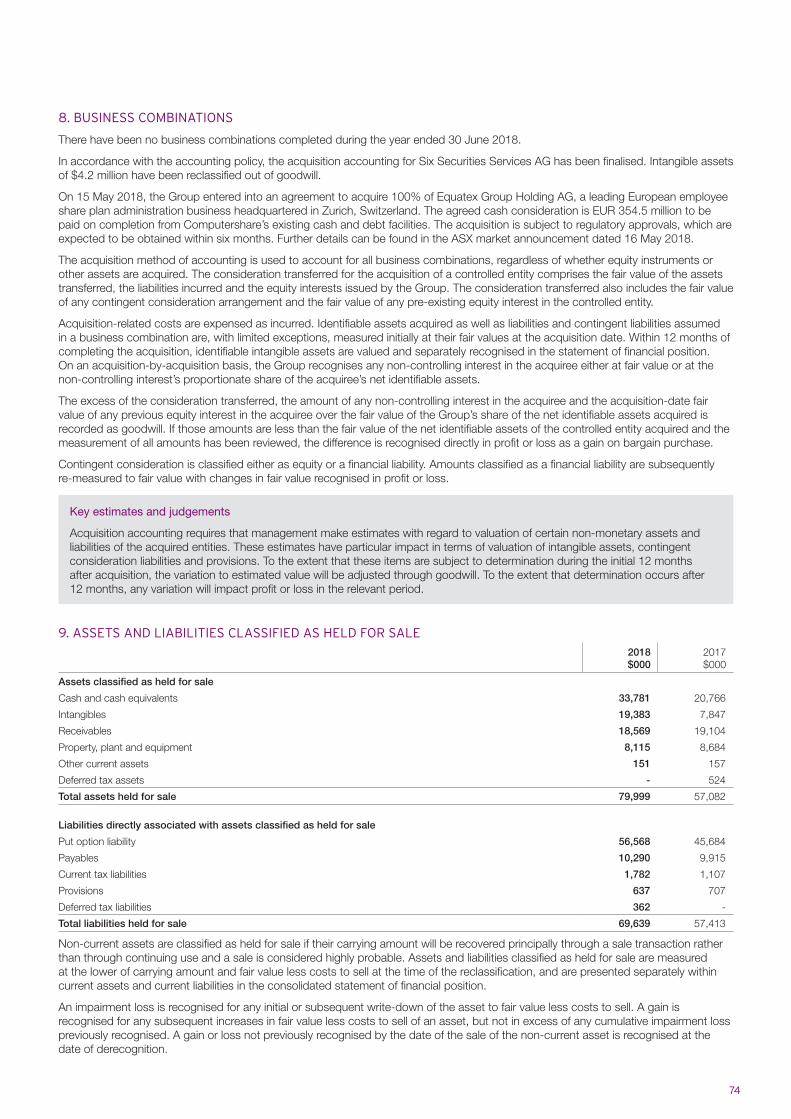
74
8. BUSINESS COMBINATIONS
There have been no business combinations completed during the year ended 30 June 2018.
In accordance with the accounting policy, the acquisition accounting for Six Securities Services AG has been finalised. Intangible assets of $4.2 million have been reclassified out of goodwill.
On 15 May 2018, the Group entered into an agreement to acquire 100% of Equatex Group Holding AG, a leading European employee share plan administration business headquartered in Zurich, Switzerland. The agreed cash consideration is EUR 354.5 million to be paid on completion from Computershare’s existing cash and debt facilities. The acquisition is subject to regulatory approvals, which are expected to be obtained within six months. Further details can be found in the ASX market announcement dated 16 May 2018.
The acquisition method of accounting is used to account for all business combinations, regardless of whether equity instruments or other assets are acquired. The consideration transferred for the acquisition of a controlled entity comprises the fair value of the assets transferred, the liabilities incurred and the equity interests issued by the Group. The consideration transferred also includes the fair value of any contingent consideration arrangement and the fair value of any pre-existing equity interest in the controlled entity.
Acquisition-related costs are expensed as incurred. Identifiable assets acquired as well as liabilities and contingent liabilities assumed in a business combination are, with limited exceptions, measured initially at their fair values at the acquisition date. Within 12 months of completing the acquisition, identifiable intangible assets are valued and separately recognised in the statement of financial position. On an acquisition-by-acquisition basis, the Group recognises any non-controlling interest in the acquiree either at fair value or at the non-controlling interest’s proportionate share of the acquiree’s net identifiable assets.
The excess of the consideration transferred, the amount of any non-controlling interest in the acquiree and the acquisition-date fair value of any previous equity interest in the acquiree over the fair value of the Group’s share of the net identifiable assets acquired is recorded as goodwill. If those amounts are less than the fair value of the net identifiable assets of the controlled entity acquired and the measurement of all amounts has been reviewed, the difference is recognised directly in profit or loss as a gain on bargain purchase.
Contingent consideration is classified either as equity or a financial liability. Amounts classified as a financial liability are subsequently re-measured to fair value with changes in fair value recognised in profit or loss.
Key estimates and judgements
Acquisition accounting requires that management make estimates with regard to valuation of certain non-monetary assets and liabilities of the acquired entities. These estimates have particular impact in terms of valuation of intangible assets, contingent consideration liabilities and provisions. To the extent that these items are subject to determination during the initial 12 months after acquisition, the variation to estimated value will be adjusted through goodwill. To the extent that determination occurs after 12 months, any variation will impact profit or loss in the relevant period.
9. ASSETS AND LIABILITIES CLASSIFIED AS HELD FOR SALE2018$000
2017$000
Assets classified as held for sale
Cash and cash equivalents 33,781 20,766
Intangibles 19,383 7,847
Receivables 18,569 19,104
Property, plant and equipment 8,115 8,684
Other current assets 151 157
Deferred tax assets - 524
Total assets held for sale 79,999 57,082
Liabilities directly associated with assets classified as held for sale
Put option liability 56,568 45,684
Payables 10,290 9,915
Current tax liabilities 1,782 1,107
Provisions 637 707
Deferred tax liabilities 362 -
Total liabilities held for sale 69,639 57,413
Non-current assets are classified as held for sale if their carrying amount will be recovered principally through a sale transaction rather than through continuing use and a sale is considered highly probable. Assets and liabilities classified as held for sale are measured at the lower of carrying amount and fair value less costs to sell at the time of the reclassification, and are presented separately within current assets and current liabilities in the consolidated statement of financial position.
An impairment loss is recognised for any initial or subsequent write-down of the asset to fair value less costs to sell. A gain is recognised for any subsequent increases in fair value less costs to sell of an asset, but not in excess of any cumulative impairment loss previously recognised. A gain or loss not previously recognised by the date of the sale of the non-current asset is recognised at the date of derecognition.
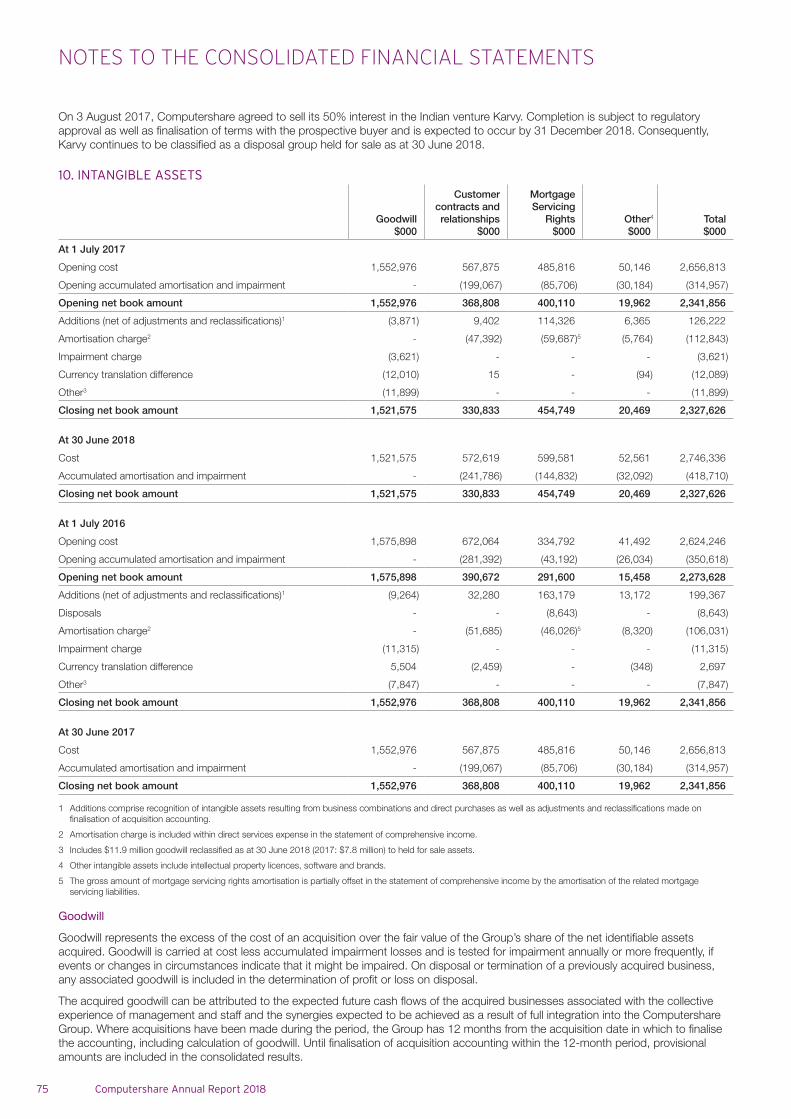
NOTES TO THE CONSOLIDATED FINANCIAL STATEMENTS
75 Computershare Annual Report 2018
On 3 August 2017, Computershare agreed to sell its 50% interest in the Indian venture Karvy. Completion is subject to regulatory approval as well as finalisation of terms with the prospective buyer and is expected to occur by 31 December 2018. Consequently, Karvy continues to be classified as a disposal group held for sale as at 30 June 2018.
10. INTANGIBLE ASSETS
Goodwill$000
Customer contracts and relationships
$000
Mortgage Servicing
Rights$000
Other4
$000Total$000
At 1 July 2017
Opening cost 1,552,976 567,875 485,816 50,146 2,656,813
Opening accumulated amortisation and impairment - (199,067) (85,706) (30,184) (314,957)
Opening net book amount 1,552,976 368,808 400,110 19,962 2,341,856
Additions (net of adjustments and reclassifications)1 (3,871) 9,402 114,326 6,365 126,222
Amortisation charge2 - (47,392) (59,687)5 (5,764) (112,843)
Impairment charge (3,621) - - - (3,621)
Currency translation difference (12,010) 15 - (94) (12,089)
Other3 (11,899) - - - (11,899)
Closing net book amount 1,521,575 330,833 454,749 20,469 2,327,626
At 30 June 2018
Cost 1,521,575 572,619 599,581 52,561 2,746,336
Accumulated amortisation and impairment - (241,786) (144,832) (32,092) (418,710)
Closing net book amount 1,521,575 330,833 454,749 20,469 2,327,626
At 1 July 2016
Opening cost 1,575,898 672,064 334,792 41,492 2,624,246
Opening accumulated amortisation and impairment - (281,392) (43,192) (26,034) (350,618)
Opening net book amount 1,575,898 390,672 291,600 15,458 2,273,628
Additions (net of adjustments and reclassifications)1 (9,264) 32,280 163,179 13,172 199,367
Disposals - - (8,643) - (8,643)
Amortisation charge2 - (51,685) (46,026)5 (8,320) (106,031)
Impairment charge (11,315) - - - (11,315)
Currency translation difference 5,504 (2,459) - (348) 2,697
Other3 (7,847) - - - (7,847)
Closing net book amount 1,552,976 368,808 400,110 19,962 2,341,856
At 30 June 2017
Cost 1,552,976 567,875 485,816 50,146 2,656,813
Accumulated amortisation and impairment - (199,067) (85,706) (30,184) (314,957)
Closing net book amount 1,552,976 368,808 400,110 19,962 2,341,856
1 Additions comprise recognition of intangible assets resulting from business combinations and direct purchases as well as adjustments and reclassifications made on finalisation of acquisition accounting.
2 Amortisation charge is included within direct services expense in the statement of comprehensive income.
3 Includes $11.9 million goodwill reclassified as at 30 June 2018 (2017: $7.8 million) to held for sale assets.
4 Other intangible assets include intellectual property licences, software and brands.
5 The gross amount of mortgage servicing rights amortisation is partially offset in the statement of comprehensive income by the amortisation of the related mortgage servicing liabilities.
Goodwill
Goodwill represents the excess of the cost of an acquisition over the fair value of the Group’s share of the net identifiable assets acquired. Goodwill is carried at cost less accumulated impairment losses and is tested for impairment annually or more frequently, if events or changes in circumstances indicate that it might be impaired. On disposal or termination of a previously acquired business, any associated goodwill is included in the determination of profit or loss on disposal.
The acquired goodwill can be attributed to the expected future cash flows of the acquired businesses associated with the collective experience of management and staff and the synergies expected to be achieved as a result of full integration into the Computershare Group. Where acquisitions have been made during the period, the Group has 12 months from the acquisition date in which to finalise the accounting, including calculation of goodwill. Until finalisation of acquisition accounting within the 12-month period, provisional amounts are included in the consolidated results.
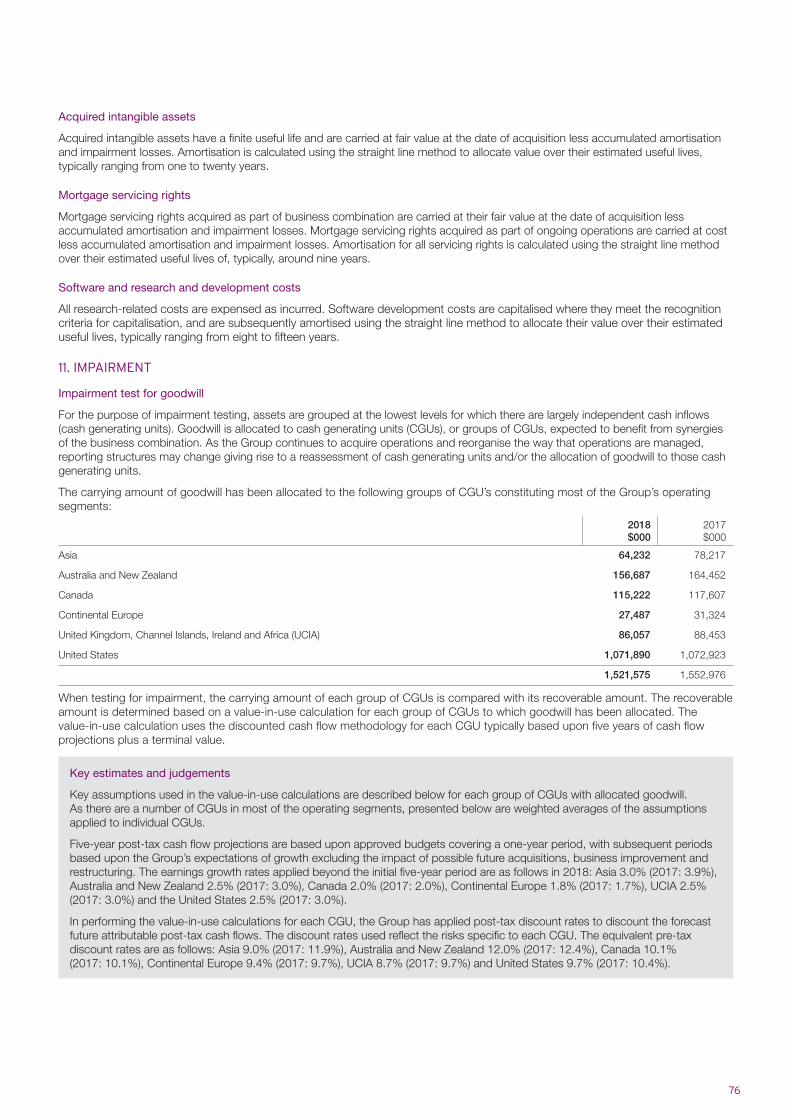
76
Acquired intangible assets
Acquired intangible assets have a finite useful life and are carried at fair value at the date of acquisition less accumulated amortisation and impairment losses. Amortisation is calculated using the straight line method to allocate value over their estimated useful lives, typically ranging from one to twenty years.
Mortgage servicing rights
Mortgage servicing rights acquired as part of business combination are carried at their fair value at the date of acquisition less accumulated amortisation and impairment losses. Mortgage servicing rights acquired as part of ongoing operations are carried at cost less accumulated amortisation and impairment losses. Amortisation for all servicing rights is calculated using the straight line method over their estimated useful lives of, typically, around nine years.
Software and research and development costs
All research-related costs are expensed as incurred. Software development costs are capitalised where they meet the recognition criteria for capitalisation, and are subsequently amortised using the straight line method to allocate their value over their estimated useful lives, typically ranging from eight to fifteen years.
11. IMPAIRMENT
Impairment test for goodwill
For the purpose of impairment testing, assets are grouped at the lowest levels for which there are largely independent cash inflows (cash generating units). Goodwill is allocated to cash generating units (CGUs), or groups of CGUs, expected to benefit from synergies of the business combination. As the Group continues to acquire operations and reorganise the way that operations are managed, reporting structures may change giving rise to a reassessment of cash generating units and/or the allocation of goodwill to those cash generating units.
The carrying amount of goodwill has been allocated to the following groups of CGU’s constituting most of the Group’s operating segments:
2018$000
2017$000
Asia 64,232 78,217
Australia and New Zealand 156,687 164,452
Canada 115,222 117,607
Continental Europe 27,487 31,324
United Kingdom, Channel Islands, Ireland and Africa (UCIA) 86,057 88,453
United States 1,071,890 1,072,923
1,521,575 1,552,976
When testing for impairment, the carrying amount of each group of CGUs is compared with its recoverable amount. The recoverable amount is determined based on a value-in-use calculation for each group of CGUs to which goodwill has been allocated. The value-in-use calculation uses the discounted cash flow methodology for each CGU typically based upon five years of cash flow projections plus a terminal value.
Key estimates and judgements
Key assumptions used in the value-in-use calculations are described below for each group of CGUs with allocated goodwill. As there are a number of CGUs in most of the operating segments, presented below are weighted averages of the assumptions applied to individual CGUs.
Five-year post-tax cash flow projections are based upon approved budgets covering a one-year period, with subsequent periods based upon the Group’s expectations of growth excluding the impact of possible future acquisitions, business improvement and restructuring. The earnings growth rates applied beyond the initial five-year period are as follows in 2018: Asia 3.0% (2017: 3.9%), Australia and New Zealand 2.5% (2017: 3.0%), Canada 2.0% (2017: 2.0%), Continental Europe 1.8% (2017: 1.7%), UCIA 2.5% (2017: 3.0%) and the United States 2.5% (2017: 3.0%).
In performing the value-in-use calculations for each CGU, the Group has applied post-tax discount rates to discount the forecast future attributable post-tax cash flows. The discount rates used reflect the risks specific to each CGU. The equivalent pre-tax discount rates are as follows: Asia 9.0% (2017: 11.9%), Australia and New Zealand 12.0% (2017: 12.4%), Canada 10.1% (2017: 10.1%), Continental Europe 9.4% (2017: 9.7%), UCIA 8.7% (2017: 9.7%) and United States 9.7% (2017: 10.4%).
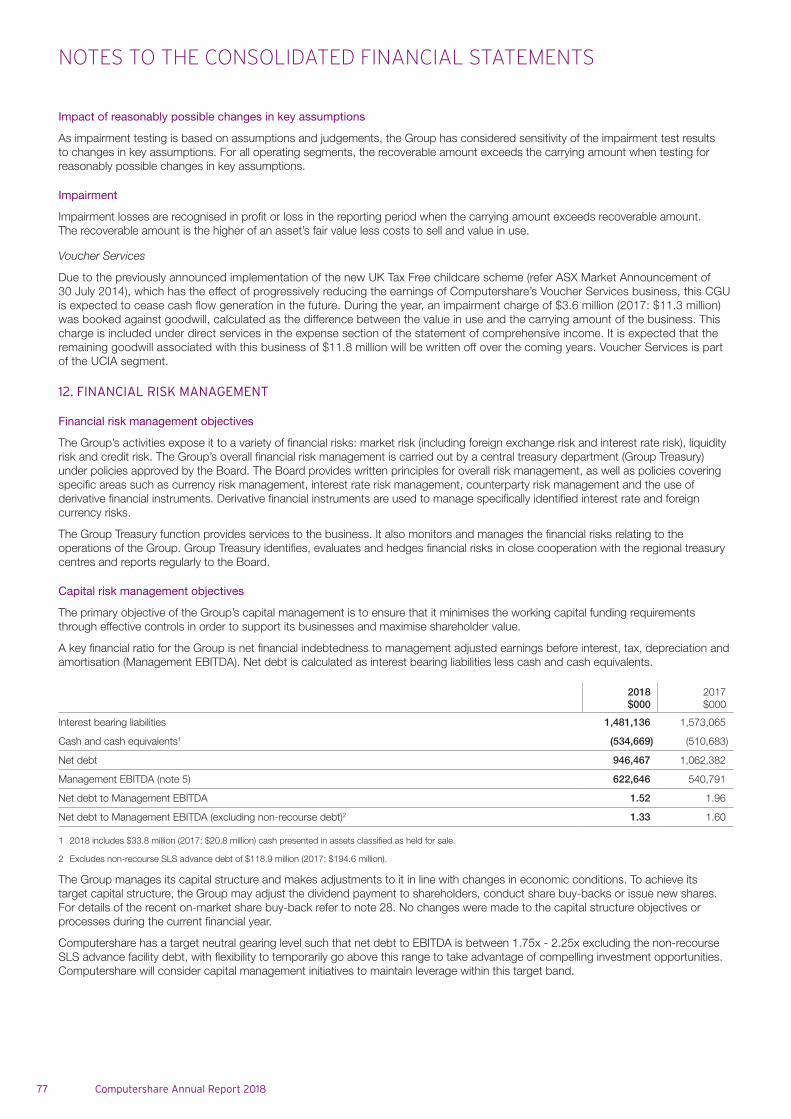
NOTES TO THE CONSOLIDATED FINANCIAL STATEMENTS
77 Computershare Annual Report 2018
Impact of reasonably possible changes in key assumptions
As impairment testing is based on assumptions and judgements, the Group has considered sensitivity of the impairment test results to changes in key assumptions. For all operating segments, the recoverable amount exceeds the carrying amount when testing for reasonably possible changes in key assumptions.
Impairment
Impairment losses are recognised in profit or loss in the reporting period when the carrying amount exceeds recoverable amount. The recoverable amount is the higher of an asset’s fair value less costs to sell and value in use.
Voucher Services
Due to the previously announced implementation of the new UK Tax Free childcare scheme (refer ASX Market Announcement of 30 July 2014), which has the effect of progressively reducing the earnings of Computershare’s Voucher Services business, this CGU is expected to cease cash flow generation in the future. During the year, an impairment charge of $3.6 million (2017: $11.3 million) was booked against goodwill, calculated as the difference between the value in use and the carrying amount of the business. This charge is included under direct services in the expense section of the statement of comprehensive income. It is expected that the remaining goodwill associated with this business of $11.8 million will be written off over the coming years. Voucher Services is part of the UCIA segment.
12. FINANCIAL RISK MANAGEMENT
Financial risk management objectives
The Group’s activities expose it to a variety of financial risks: market risk (including foreign exchange risk and interest rate risk), liquidity risk and credit risk. The Group’s overall financial risk management is carried out by a central treasury department (Group Treasury) under policies approved by the Board. The Board provides written principles for overall risk management, as well as policies covering specific areas such as currency risk management, interest rate risk management, counterparty risk management and the use of derivative financial instruments. Derivative financial instruments are used to manage specifically identified interest rate and foreign currency risks.
The Group Treasury function provides services to the business. It also monitors and manages the financial risks relating to the operations of the Group. Group Treasury identifies, evaluates and hedges financial risks in close cooperation with the regional treasury centres and reports regularly to the Board.
Capital risk management objectives
The primary objective of the Group’s capital management is to ensure that it minimises the working capital funding requirements through effective controls in order to support its businesses and maximise shareholder value.
A key financial ratio for the Group is net financial indebtedness to management adjusted earnings before interest, tax, depreciation and amortisation (Management EBITDA). Net debt is calculated as interest bearing liabilities less cash and cash equivalents.
2018$000
2017$000
Interest bearing liabilities 1,481,136 1,573,065
Cash and cash equivalents1 (534,669) (510,683)
Net debt 946,467 1,062,382
Management EBITDA (note 5) 622,646 540,791
Net debt to Management EBITDA 1.52 1.96
Net debt to Management EBITDA (excluding non-recourse debt)2 1.33 1.60
1 2018 includes $33.8 million (2017: $20.8 million) cash presented in assets classified as held for sale.
2 Excludes non-recourse SLS advance debt of $118.9 million (2017: $194.6 million).
The Group manages its capital structure and makes adjustments to it in line with changes in economic conditions. To achieve its target capital structure, the Group may adjust the dividend payment to shareholders, conduct share buy-backs or issue new shares. For details of the recent on-market share buy-back refer to note 28. No changes were made to the capital structure objectives or processes during the current financial year.
Computershare has a target neutral gearing level such that net debt to EBITDA is between 1.75x - 2.25x excluding the non-recourse SLS advance facility debt, with flexibility to temporarily go above this range to take advantage of compelling investment opportunities. Computershare will consider capital management initiatives to maintain leverage within this target band.
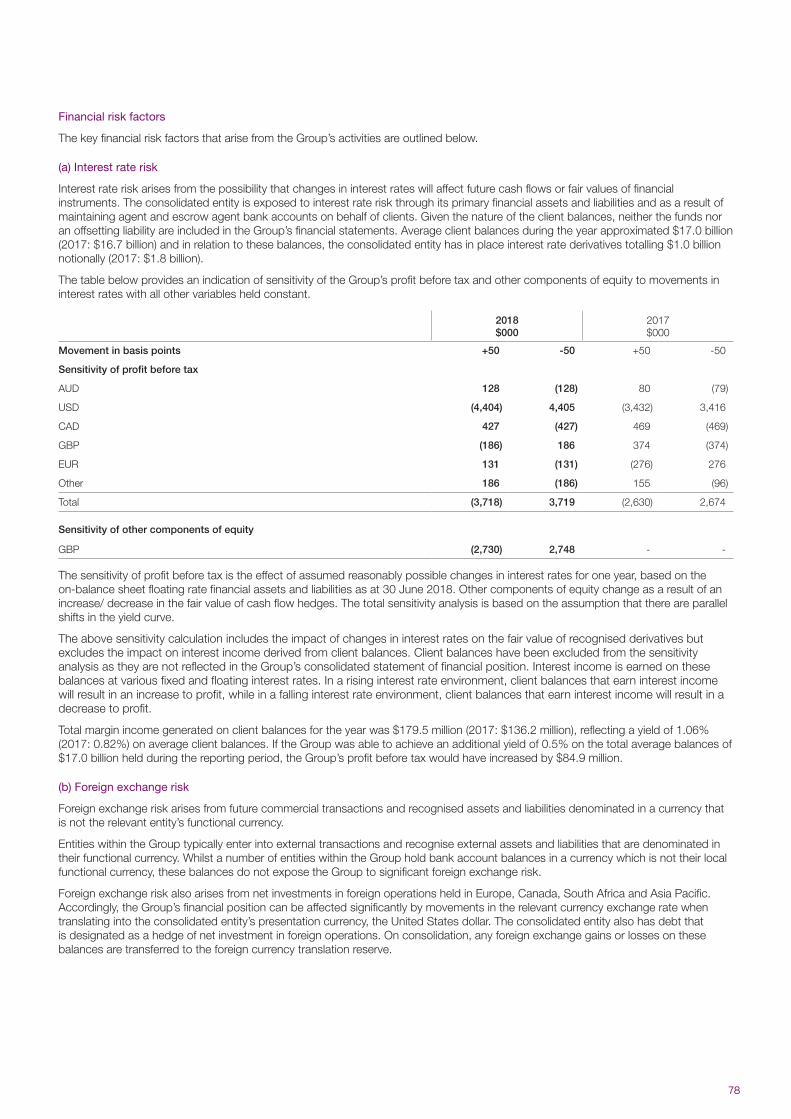
78
Financial risk factors
The key financial risk factors that arise from the Group’s activities are outlined below.
(a) Interest rate risk
Interest rate risk arises from the possibility that changes in interest rates will affect future cash flows or fair values of financial instruments. The consolidated entity is exposed to interest rate risk through its primary financial assets and liabilities and as a result of maintaining agent and escrow agent bank accounts on behalf of clients. Given the nature of the client balances, neither the funds nor an offsetting liability are included in the Group’s financial statements. Average client balances during the year approximated $17.0 billion (2017: $16.7 billion) and in relation to these balances, the consolidated entity has in place interest rate derivatives totalling $1.0 billion notionally (2017: $1.8 billion).
The table below provides an indication of sensitivity of the Group’s profit before tax and other components of equity to movements in interest rates with all other variables held constant.
2018$000
2017$000
Movement in basis points +50 -50 +50 -50
Sensitivity of profit before tax
AUD 128 (128) 80 (79)
USD (4,404) 4,405 (3,432) 3,416
CAD 427 (427) 469 (469)
GBP (186) 186 374 (374)
EUR 131 (131) (276) 276
Other 186 (186) 155 (96)
Total (3,718) 3,719 (2,630) 2,674
Sensitivity of other components of equity
GBP (2,730) 2,748 - -
The sensitivity of profit before tax is the effect of assumed reasonably possible changes in interest rates for one year, based on the on-balance sheet floating rate financial assets and liabilities as at 30 June 2018. Other components of equity change as a result of an increase/ decrease in the fair value of cash flow hedges. The total sensitivity analysis is based on the assumption that there are parallel shifts in the yield curve.
The above sensitivity calculation includes the impact of changes in interest rates on the fair value of recognised derivatives but excludes the impact on interest income derived from client balances. Client balances have been excluded from the sensitivity analysis as they are not reflected in the Group’s consolidated statement of financial position. Interest income is earned on these balances at various fixed and floating interest rates. In a rising interest rate environment, client balances that earn interest income will result in an increase to profit, while in a falling interest rate environment, client balances that earn interest income will result in a decrease to profit.
Total margin income generated on client balances for the year was $179.5 million (2017: $136.2 million), reflecting a yield of 1.06% (2017: 0.82%) on average client balances. If the Group was able to achieve an additional yield of 0.5% on the total average balances of $17.0 billion held during the reporting period, the Group’s profit before tax would have increased by $84.9 million.
(b) Foreign exchange risk
Foreign exchange risk arises from future commercial transactions and recognised assets and liabilities denominated in a currency that is not the relevant entity’s functional currency.
Entities within the Group typically enter into external transactions and recognise external assets and liabilities that are denominated in their functional currency. Whilst a number of entities within the Group hold bank account balances in a currency which is not their local functional currency, these balances do not expose the Group to significant foreign exchange risk.
Foreign exchange risk also arises from net investments in foreign operations held in Europe, Canada, South Africa and Asia Pacific. Accordingly, the Group’s financial position can be affected significantly by movements in the relevant currency exchange rate when translating into the consolidated entity’s presentation currency, the United States dollar. The consolidated entity also has debt that is designated as a hedge of net investment in foreign operations. On consolidation, any foreign exchange gains or losses on these balances are transferred to the foreign currency translation reserve.
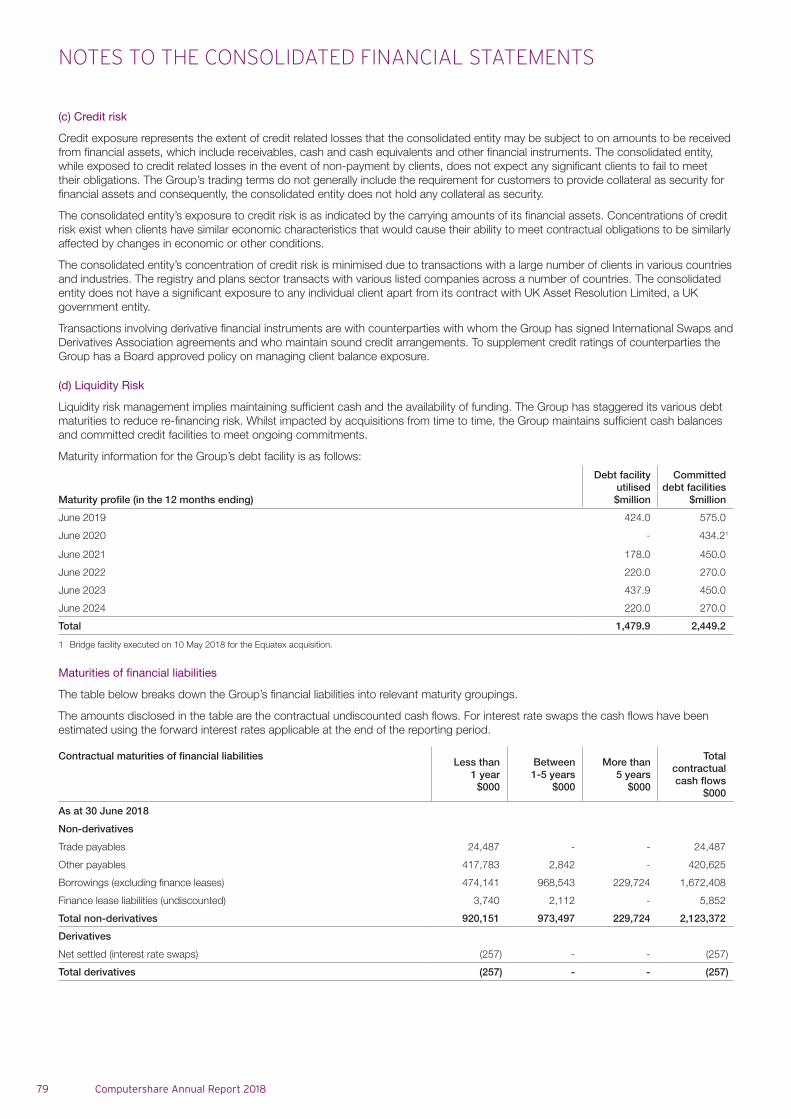
NOTES TO THE CONSOLIDATED FINANCIAL STATEMENTS
79 Computershare Annual Report 2018
(c) Credit risk
Credit exposure represents the extent of credit related losses that the consolidated entity may be subject to on amounts to be received from financial assets, which include receivables, cash and cash equivalents and other financial instruments. The consolidated entity, while exposed to credit related losses in the event of non-payment by clients, does not expect any significant clients to fail to meet their obligations. The Group’s trading terms do not generally include the requirement for customers to provide collateral as security for financial assets and consequently, the consolidated entity does not hold any collateral as security.
The consolidated entity’s exposure to credit risk is as indicated by the carrying amounts of its financial assets. Concentrations of credit risk exist when clients have similar economic characteristics that would cause their ability to meet contractual obligations to be similarly affected by changes in economic or other conditions.
The consolidated entity’s concentration of credit risk is minimised due to transactions with a large number of clients in various countries and industries. The registry and plans sector transacts with various listed companies across a number of countries. The consolidated entity does not have a significant exposure to any individual client apart from its contract with UK Asset Resolution Limited, a UK government entity.
Transactions involving derivative financial instruments are with counterparties with whom the Group has signed International Swaps and Derivatives Association agreements and who maintain sound credit arrangements. To supplement credit ratings of counterparties the Group has a Board approved policy on managing client balance exposure.
(d) Liquidity Risk
Liquidity risk management implies maintaining sufficient cash and the availability of funding. The Group has staggered its various debt maturities to reduce re-financing risk. Whilst impacted by acquisitions from time to time, the Group maintains sufficient cash balances and committed credit facilities to meet ongoing commitments.
Maturity information for the Group’s debt facility is as follows:
Maturity profile (in the 12 months ending)
Debt facility utilised $million
Committed debt facilities
$million
June 2019 424.0 575.0
June 2020 - 434.21
June 2021 178.0 450.0
June 2022 220.0 270.0
June 2023 437.9 450.0
June 2024 220.0 270.0
Total 1,479.9 2,449.2
1 Bridge facility executed on 10 May 2018 for the Equatex acquisition.
Maturities of financial liabilities
The table below breaks down the Group’s financial liabilities into relevant maturity groupings.
The amounts disclosed in the table are the contractual undiscounted cash flows. For interest rate swaps the cash flows have been estimated using the forward interest rates applicable at the end of the reporting period.
Contractual maturities of financial liabilitiesLess than
1 year$000
Between 1-5 years
$000
More than 5 years
$000
Total contractual cash flows
$000
As at 30 June 2018
Non-derivatives
Trade payables 24,487 - - 24,487
Other payables 417,783 2,842 - 420,625
Borrowings (excluding finance leases) 474,141 968,543 229,724 1,672,408
Finance lease liabilities (undiscounted) 3,740 2,112 - 5,852
Total non-derivatives 920,151 973,497 229,724 2,123,372
Derivatives
Net settled (interest rate swaps) (257) - - (257)
Total derivatives (257) - - (257)
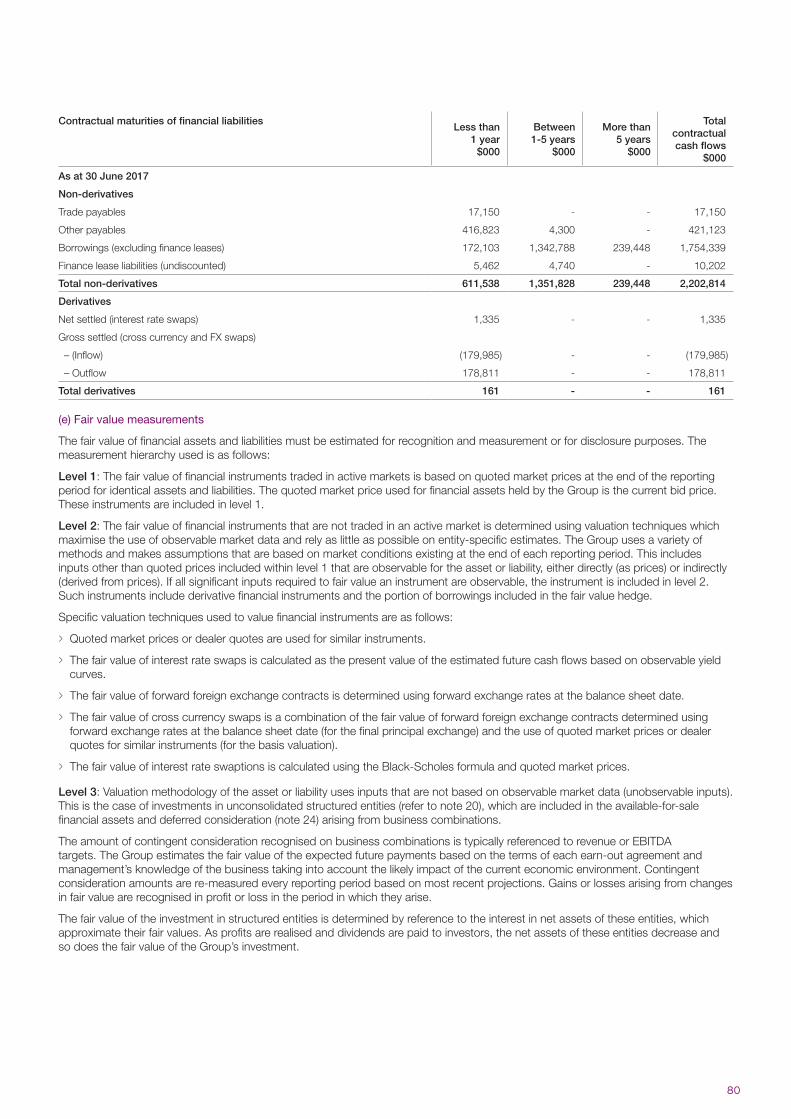
80
Contractual maturities of financial liabilitiesLess than
1 year$000
Between 1-5 years
$000
More than 5 years
$000
Total contractual cash flows
$000
As at 30 June 2017
Non-derivatives
Trade payables 17,150 - - 17,150
Other payables 416,823 4,300 - 421,123
Borrowings (excluding finance leases) 172,103 1,342,788 239,448 1,754,339
Finance lease liabilities (undiscounted) 5,462 4,740 - 10,202
Total non-derivatives 611,538 1,351,828 239,448 2,202,814
Derivatives
Net settled (interest rate swaps) 1,335 - - 1,335
Gross settled (cross currency and FX swaps)
– (Inflow) (179,985) - - (179,985)
– Outflow 178,811 - - 178,811
Total derivatives 161 - - 161
(e) Fair value measurements
The fair value of financial assets and liabilities must be estimated for recognition and measurement or for disclosure purposes. The measurement hierarchy used is as follows:
Level 1: The fair value of financial instruments traded in active markets is based on quoted market prices at the end of the reporting period for identical assets and liabilities. The quoted market price used for financial assets held by the Group is the current bid price. These instruments are included in level 1.
Level 2: The fair value of financial instruments that are not traded in an active market is determined using valuation techniques which maximise the use of observable market data and rely as little as possible on entity-specific estimates. The Group uses a variety of methods and makes assumptions that are based on market conditions existing at the end of each reporting period. This includes inputs other than quoted prices included within level 1 that are observable for the asset or liability, either directly (as prices) or indirectly (derived from prices). If all significant inputs required to fair value an instrument are observable, the instrument is included in level 2. Such instruments include derivative financial instruments and the portion of borrowings included in the fair value hedge.
Specific valuation techniques used to value financial instruments are as follows:
> Quoted market prices or dealer quotes are used for similar instruments.
> The fair value of interest rate swaps is calculated as the present value of the estimated future cash flows based on observable yield curves.
> The fair value of forward foreign exchange contracts is determined using forward exchange rates at the balance sheet date.
> The fair value of cross currency swaps is a combination of the fair value of forward foreign exchange contracts determined using forward exchange rates at the balance sheet date (for the final principal exchange) and the use of quoted market prices or dealer quotes for similar instruments (for the basis valuation).
> The fair value of interest rate swaptions is calculated using the Black-Scholes formula and quoted market prices.
Level 3: Valuation methodology of the asset or liability uses inputs that are not based on observable market data (unobservable inputs). This is the case of investments in unconsolidated structured entities (refer to note 20), which are included in the available-for-sale financial assets and deferred consideration (note 24) arising from business combinations.
The amount of contingent consideration recognised on business combinations is typically referenced to revenue or EBITDA targets. The Group estimates the fair value of the expected future payments based on the terms of each earn-out agreement and management’s knowledge of the business taking into account the likely impact of the current economic environment. Contingent consideration amounts are re-measured every reporting period based on most recent projections. Gains or losses arising from changes in fair value are recognised in profit or loss in the period in which they arise.
The fair value of the investment in structured entities is determined by reference to the interest in net assets of these entities, which approximate their fair values. As profits are realised and dividends are paid to investors, the net assets of these entities decrease and so does the fair value of the Group’s investment.
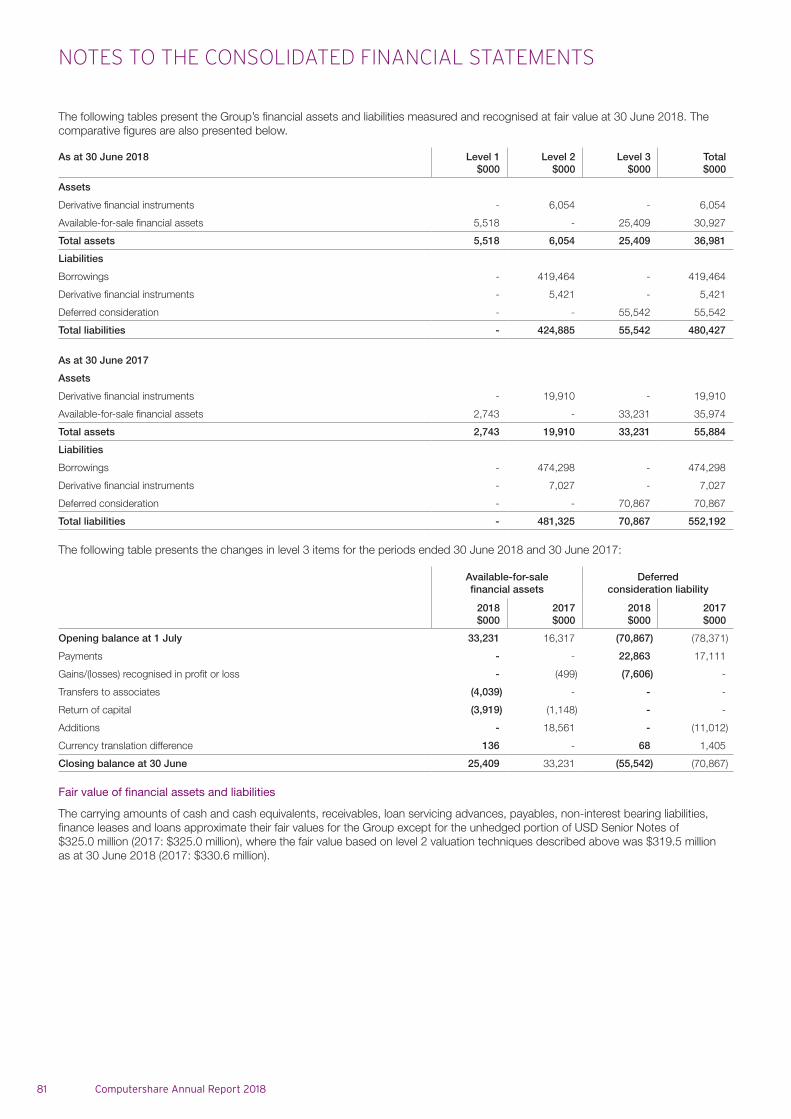
NOTES TO THE CONSOLIDATED FINANCIAL STATEMENTS
81 Computershare Annual Report 2018
The following tables present the Group’s financial assets and liabilities measured and recognised at fair value at 30 June 2018. The comparative figures are also presented below.
As at 30 June 2018 Level 1$000
Level 2$000
Level 3$000
Total$000
Assets
Derivative financial instruments - 6,054 - 6,054
Available-for-sale financial assets 5,518 - 25,409 30,927
Total assets 5,518 6,054 25,409 36,981
Liabilities
Borrowings - 419,464 - 419,464
Derivative financial instruments - 5,421 - 5,421
Deferred consideration - - 55,542 55,542
Total liabilities - 424,885 55,542 480,427
As at 30 June 2017
Assets
Derivative financial instruments - 19,910 - 19,910
Available-for-sale financial assets 2,743 - 33,231 35,974
Total assets 2,743 19,910 33,231 55,884
Liabilities
Borrowings - 474,298 - 474,298
Derivative financial instruments - 7,027 - 7,027
Deferred consideration - - 70,867 70,867
Total liabilities - 481,325 70,867 552,192
The following table presents the changes in level 3 items for the periods ended 30 June 2018 and 30 June 2017:
Available-for-sale financial assets
Deferred consideration liability
2018$000
2017$000
2018$000
2017$000
Opening balance at 1 July 33,231 16,317 (70,867) (78,371)
Payments - - 22,863 17,111
Gains/(losses) recognised in profit or loss - (499) (7,606) -
Transfers to associates (4,039) - - -
Return of capital (3,919) (1,148) - -
Additions - 18,561 - (11,012)
Currency translation difference 136 - 68 1,405
Closing balance at 30 June 25,409 33,231 (55,542) (70,867)
Fair value of financial assets and liabilities
The carrying amounts of cash and cash equivalents, receivables, loan servicing advances, payables, non-interest bearing liabilities, finance leases and loans approximate their fair values for the Group except for the unhedged portion of USD Senior Notes of $325.0 million (2017: $325.0 million), where the fair value based on level 2 valuation techniques described above was $319.5 million as at 30 June 2018 (2017: $330.6 million).
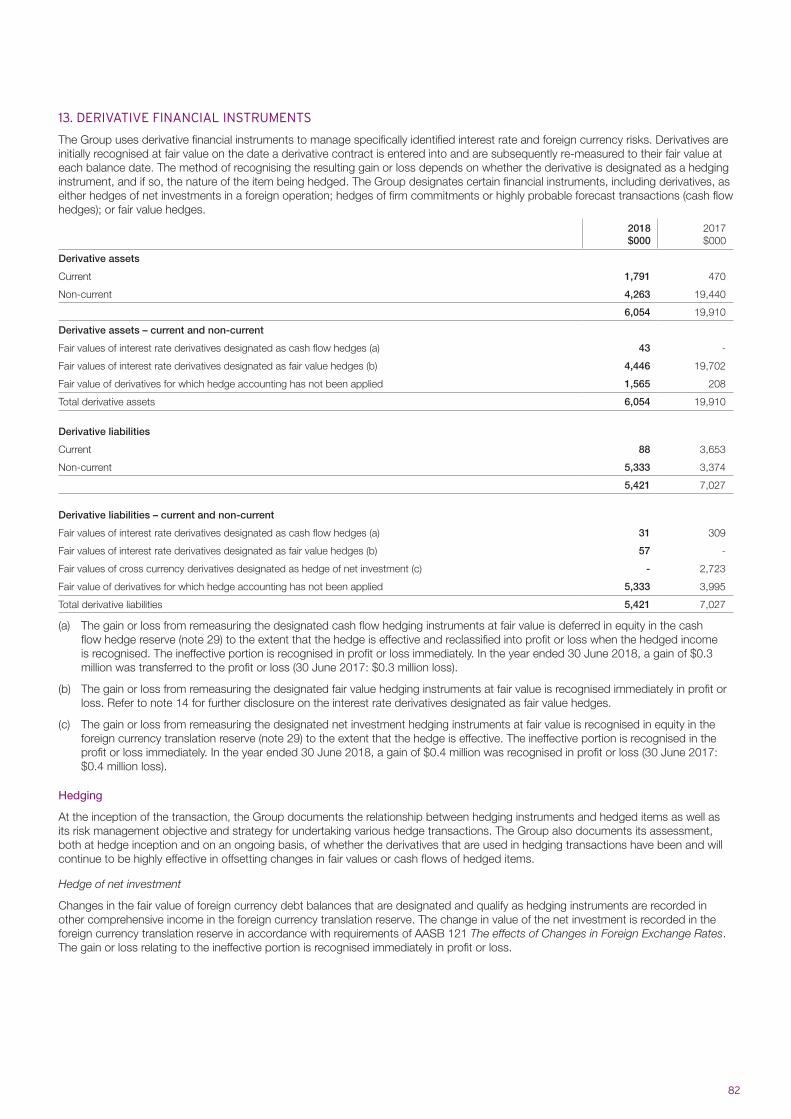
82
13. DERIVATIVE FINANCIAL INSTRUMENTS
The Group uses derivative financial instruments to manage specifically identified interest rate and foreign currency risks. Derivatives are initially recognised at fair value on the date a derivative contract is entered into and are subsequently re-measured to their fair value at each balance date. The method of recognising the resulting gain or loss depends on whether the derivative is designated as a hedging instrument, and if so, the nature of the item being hedged. The Group designates certain financial instruments, including derivatives, as either hedges of net investments in a foreign operation; hedges of firm commitments or highly probable forecast transactions (cash flow hedges); or fair value hedges.
2018$000
2017$000
Derivative assets
Current 1,791 470
Non-current 4,263 19,440
6,054 19,910
Derivative assets – current and non-current
Fair values of interest rate derivatives designated as cash flow hedges (a) 43 -
Fair values of interest rate derivatives designated as fair value hedges (b) 4,446 19,702
Fair value of derivatives for which hedge accounting has not been applied 1,565 208
Total derivative assets 6,054 19,910
Derivative liabilities
Current 88 3,653
Non-current 5,333 3,374
5,421 7,027
Derivative liabilities – current and non-current
Fair values of interest rate derivatives designated as cash flow hedges (a) 31 309
Fair values of interest rate derivatives designated as fair value hedges (b) 57 -
Fair values of cross currency derivatives designated as hedge of net investment (c) - 2,723
Fair value of derivatives for which hedge accounting has not been applied 5,333 3,995
Total derivative liabilities 5,421 7,027
(a) The gain or loss from remeasuring the designated cash flow hedging instruments at fair value is deferred in equity in the cash flow hedge reserve (note 29) to the extent that the hedge is effective and reclassified into profit or loss when the hedged income is recognised. The ineffective portion is recognised in profit or loss immediately. In the year ended 30 June 2018, a gain of $0.3 million was transferred to the profit or loss (30 June 2017: $0.3 million loss).
(b) The gain or loss from remeasuring the designated fair value hedging instruments at fair value is recognised immediately in profit or loss. Refer to note 14 for further disclosure on the interest rate derivatives designated as fair value hedges.
(c) The gain or loss from remeasuring the designated net investment hedging instruments at fair value is recognised in equity in the foreign currency translation reserve (note 29) to the extent that the hedge is effective. The ineffective portion is recognised in the profit or loss immediately. In the year ended 30 June 2018, a gain of $0.4 million was recognised in profit or loss (30 June 2017: $0.4 million loss).
Hedging
At the inception of the transaction, the Group documents the relationship between hedging instruments and hedged items as well as its risk management objective and strategy for undertaking various hedge transactions. The Group also documents its assessment, both at hedge inception and on an ongoing basis, of whether the derivatives that are used in hedging transactions have been and will continue to be highly effective in offsetting changes in fair values or cash flows of hedged items.
Hedge of net investment
Changes in the fair value of foreign currency debt balances that are designated and qualify as hedging instruments are recorded in other comprehensive income in the foreign currency translation reserve. The change in value of the net investment is recorded in the foreign currency translation reserve in accordance with requirements of AASB 121 The effects of Changes in Foreign Exchange Rates. The gain or loss relating to the ineffective portion is recognised immediately in profit or loss.
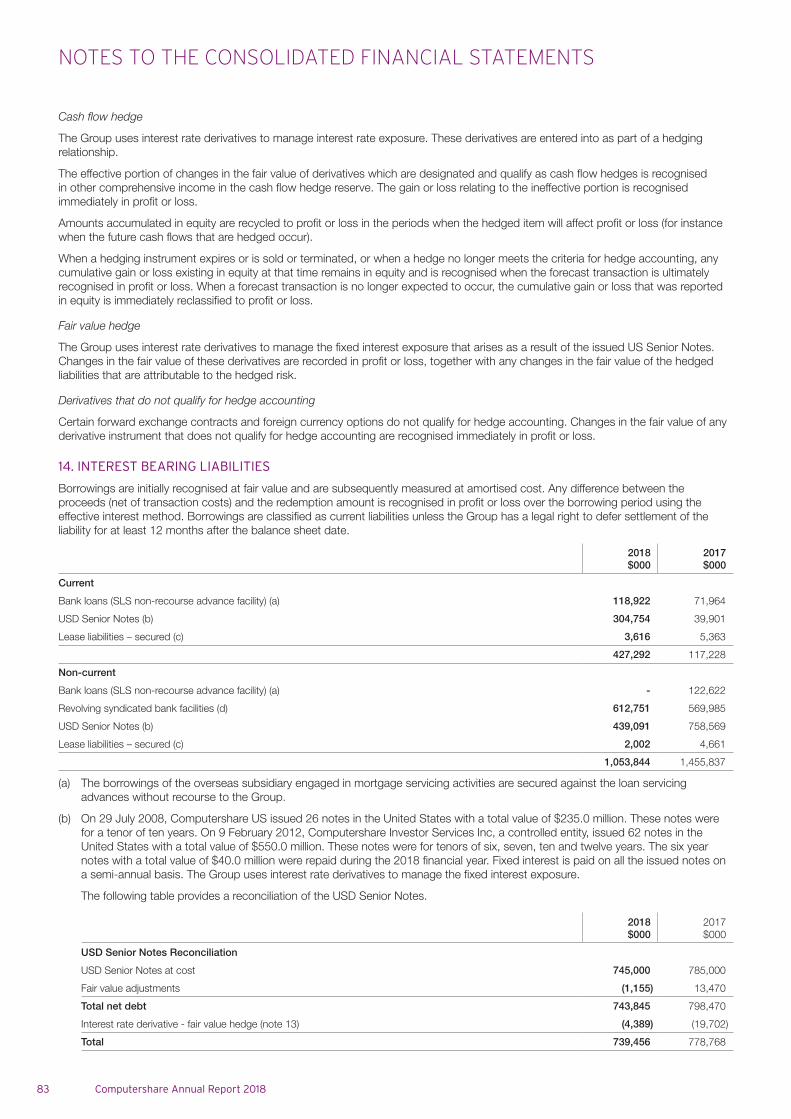
NOTES TO THE CONSOLIDATED FINANCIAL STATEMENTS
83 Computershare Annual Report 2018
Cash flow hedge
The Group uses interest rate derivatives to manage interest rate exposure. These derivatives are entered into as part of a hedging relationship.
The effective portion of changes in the fair value of derivatives which are designated and qualify as cash flow hedges is recognised in other comprehensive income in the cash flow hedge reserve. The gain or loss relating to the ineffective portion is recognised immediately in profit or loss.
Amounts accumulated in equity are recycled to profit or loss in the periods when the hedged item will affect profit or loss (for instance when the future cash flows that are hedged occur).
When a hedging instrument expires or is sold or terminated, or when a hedge no longer meets the criteria for hedge accounting, any cumulative gain or loss existing in equity at that time remains in equity and is recognised when the forecast transaction is ultimately recognised in profit or loss. When a forecast transaction is no longer expected to occur, the cumulative gain or loss that was reported in equity is immediately reclassified to profit or loss.
Fair value hedge
The Group uses interest rate derivatives to manage the fixed interest exposure that arises as a result of the issued US Senior Notes. Changes in the fair value of these derivatives are recorded in profit or loss, together with any changes in the fair value of the hedged liabilities that are attributable to the hedged risk.
Derivatives that do not qualify for hedge accounting
Certain forward exchange contracts and foreign currency options do not qualify for hedge accounting. Changes in the fair value of any derivative instrument that does not qualify for hedge accounting are recognised immediately in profit or loss.
14. INTEREST BEARING LIABILITIES
Borrowings are initially recognised at fair value and are subsequently measured at amortised cost. Any difference between the proceeds (net of transaction costs) and the redemption amount is recognised in profit or loss over the borrowing period using the effective interest method. Borrowings are classified as current liabilities unless the Group has a legal right to defer settlement of the liability for at least 12 months after the balance sheet date.
2018$000
2017$000
Current
Bank loans (SLS non-recourse advance facility) (a) 118,922 71,964
USD Senior Notes (b) 304,754 39,901
Lease liabilities – secured (c) 3,616 5,363
427,292 117,228
Non-current
Bank loans (SLS non-recourse advance facility) (a) - 122,622
Revolving syndicated bank facilities (d) 612,751 569,985
USD Senior Notes (b) 439,091 758,569
Lease liabilities – secured (c) 2,002 4,661
1,053,844 1,455,837
(a) The borrowings of the overseas subsidiary engaged in mortgage servicing activities are secured against the loan servicing advances without recourse to the Group.
(b) On 29 July 2008, Computershare US issued 26 notes in the United States with a total value of $235.0 million. These notes were for a tenor of ten years. On 9 February 2012, Computershare Investor Services Inc, a controlled entity, issued 62 notes in the United States with a total value of $550.0 million. These notes were for tenors of six, seven, ten and twelve years. The six year notes with a total value of $40.0 million were repaid during the 2018 financial year. Fixed interest is paid on all the issued notes on a semi-annual basis. The Group uses interest rate derivatives to manage the fixed interest exposure.
The following table provides a reconciliation of the USD Senior Notes.
2018$000
2017$000
USD Senior Notes Reconciliation
USD Senior Notes at cost 745,000 785,000
Fair value adjustments (1,155) 13,470
Total net debt 743,845 798,470
Interest rate derivative - fair value hedge (note 13) (4,389) (19,702)
Total 739,456 778,768
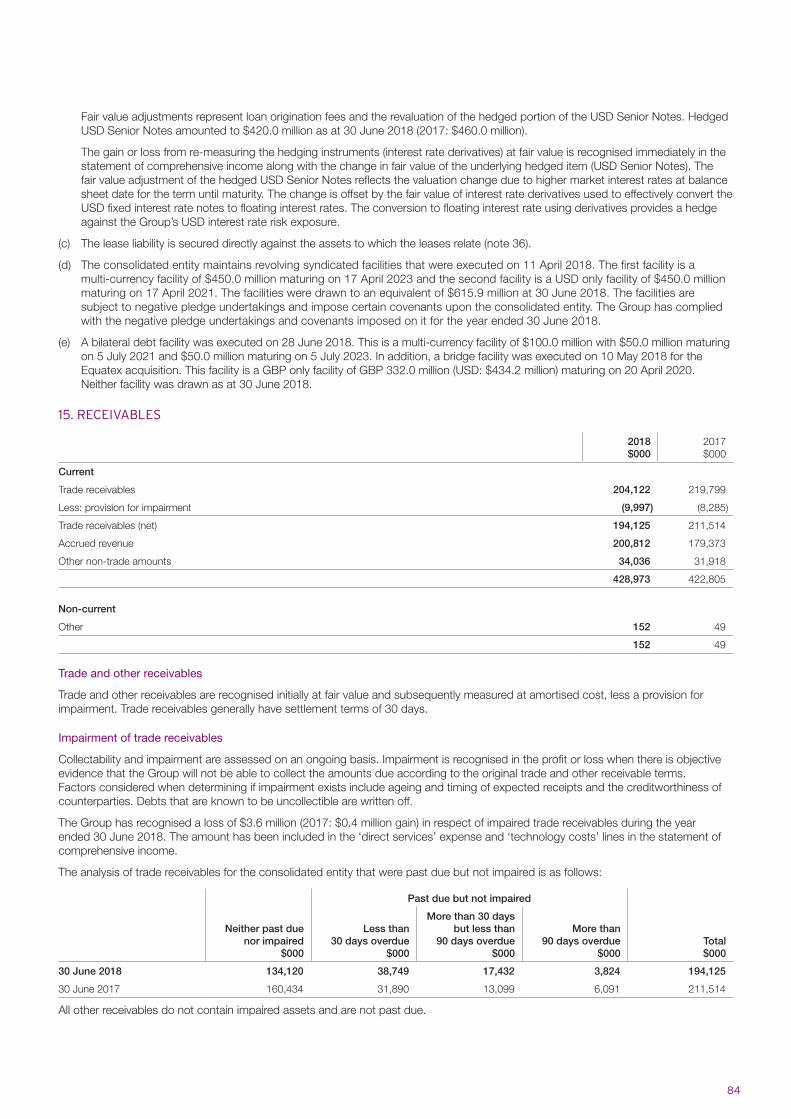
84
Fair value adjustments represent loan origination fees and the revaluation of the hedged portion of the USD Senior Notes. Hedged USD Senior Notes amounted to $420.0 million as at 30 June 2018 (2017: $460.0 million).
The gain or loss from re-measuring the hedging instruments (interest rate derivatives) at fair value is recognised immediately in the statement of comprehensive income along with the change in fair value of the underlying hedged item (USD Senior Notes). The fair value adjustment of the hedged USD Senior Notes reflects the valuation change due to higher market interest rates at balance sheet date for the term until maturity. The change is offset by the fair value of interest rate derivatives used to effectively convert the USD fixed interest rate notes to floating interest rates. The conversion to floating interest rate using derivatives provides a hedge against the Group’s USD interest rate risk exposure.
(c) The lease liability is secured directly against the assets to which the leases relate (note 36).
(d) The consolidated entity maintains revolving syndicated facilities that were executed on 11 April 2018. The first facility is a multi-currency facility of $450.0 million maturing on 17 April 2023 and the second facility is a USD only facility of $450.0 million maturing on 17 April 2021. The facilities were drawn to an equivalent of $615.9 million at 30 June 2018. The facilities are subject to negative pledge undertakings and impose certain covenants upon the consolidated entity. The Group has complied with the negative pledge undertakings and covenants imposed on it for the year ended 30 June 2018.
(e) A bilateral debt facility was executed on 28 June 2018. This is a multi-currency facility of $100.0 million with $50.0 million maturing on 5 July 2021 and $50.0 million maturing on 5 July 2023. In addition, a bridge facility was executed on 10 May 2018 for the Equatex acquisition. This facility is a GBP only facility of GBP 332.0 million (USD: $434.2 million) maturing on 20 April 2020. Neither facility was drawn as at 30 June 2018.
15. RECEIVABLES
2018$000
2017$000
Current
Trade receivables 204,122 219,799
Less: provision for impairment (9,997) (8,285)
Trade receivables (net) 194,125 211,514
Accrued revenue 200,812 179,373
Other non-trade amounts 34,036 31,918
428,973 422,805
Non-current
Other 152 49
152 49
Trade and other receivables
Trade and other receivables are recognised initially at fair value and subsequently measured at amortised cost, less a provision for impairment. Trade receivables generally have settlement terms of 30 days.
Impairment of trade receivables
Collectability and impairment are assessed on an ongoing basis. Impairment is recognised in the profit or loss when there is objective evidence that the Group will not be able to collect the amounts due according to the original trade and other receivable terms. Factors considered when determining if impairment exists include ageing and timing of expected receipts and the creditworthiness of counterparties. Debts that are known to be uncollectible are written off.
The Group has recognised a loss of $3.6 million (2017: $0.4 million gain) in respect of impaired trade receivables during the year ended 30 June 2018. The amount has been included in the ‘direct services’ expense and ‘technology costs’ lines in the statement of comprehensive income.
The analysis of trade receivables for the consolidated entity that were past due but not impaired is as follows:
Neither past due nor impaired
$000
Past due but not impaired
Total$000
Less than 30 days overdue
$000
More than 30 days but less than
90 days overdue$000
More than 90 days overdue
$000
30 June 2018 134,120 38,749 17,432 3,824 194,125
30 June 2017 160,434 31,890 13,099 6,091 211,514
All other receivables do not contain impaired assets and are not past due.
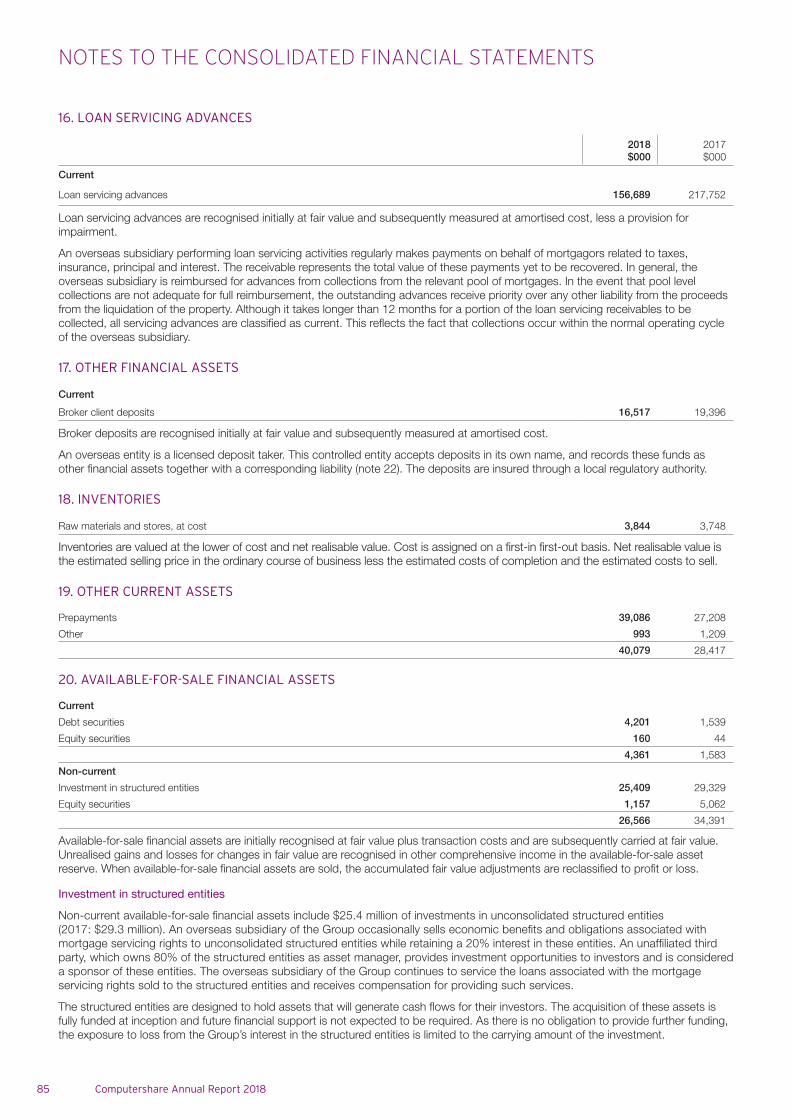
NOTES TO THE CONSOLIDATED FINANCIAL STATEMENTS
85 Computershare Annual Report 2018
16. LOAN SERVICING ADVANCES
2018$000
2017$000
Current
Loan servicing advances 156,689 217,752
Loan servicing advances are recognised initially at fair value and subsequently measured at amortised cost, less a provision for impairment.
An overseas subsidiary performing loan servicing activities regularly makes payments on behalf of mortgagors related to taxes, insurance, principal and interest. The receivable represents the total value of these payments yet to be recovered. In general, the overseas subsidiary is reimbursed for advances from collections from the relevant pool of mortgages. In the event that pool level collections are not adequate for full reimbursement, the outstanding advances receive priority over any other liability from the proceeds from the liquidation of the property. Although it takes longer than 12 months for a portion of the loan servicing receivables to be collected, all servicing advances are classified as current. This reflects the fact that collections occur within the normal operating cycle of the overseas subsidiary.
17. OTHER FINANCIAL ASSETS
Current
Broker client deposits 16,517 19,396
Broker deposits are recognised initially at fair value and subsequently measured at amortised cost.
An overseas entity is a licensed deposit taker. This controlled entity accepts deposits in its own name, and records these funds as other financial assets together with a corresponding liability (note 22). The deposits are insured through a local regulatory authority.
18. INVENTORIES
Raw materials and stores, at cost 3,844 3,748
Inventories are valued at the lower of cost and net realisable value. Cost is assigned on a first-in first-out basis. Net realisable value is the estimated selling price in the ordinary course of business less the estimated costs of completion and the estimated costs to sell.
19. OTHER CURRENT ASSETS
Prepayments 39,086 27,208
Other 993 1,209
40,079 28,417
20. AVAILABLE-FOR-SALE FINANCIAL ASSETS
Current
Debt securities 4,201 1,539
Equity securities 160 44
4,361 1,583
Non-current
Investment in structured entities 25,409 29,329
Equity securities 1,157 5,062
26,566 34,391
Available-for-sale financial assets are initially recognised at fair value plus transaction costs and are subsequently carried at fair value. Unrealised gains and losses for changes in fair value are recognised in other comprehensive income in the available-for-sale asset reserve. When available-for-sale financial assets are sold, the accumulated fair value adjustments are reclassified to profit or loss.
Investment in structured entities
Non-current available-for-sale financial assets include $25.4 million of investments in unconsolidated structured entities (2017: $29.3 million). An overseas subsidiary of the Group occasionally sells economic benefits and obligations associated with mortgage servicing rights to unconsolidated structured entities while retaining a 20% interest in these entities. An unaffiliated third party, which owns 80% of the structured entities as asset manager, provides investment opportunities to investors and is considered a sponsor of these entities. The overseas subsidiary of the Group continues to service the loans associated with the mortgage servicing rights sold to the structured entities and receives compensation for providing such services.
The structured entities are designed to hold assets that will generate cash flows for their investors. The acquisition of these assets is fully funded at inception and future financial support is not expected to be required. As there is no obligation to provide further funding, the exposure to loss from the Group’s interest in the structured entities is limited to the carrying amount of the investment.
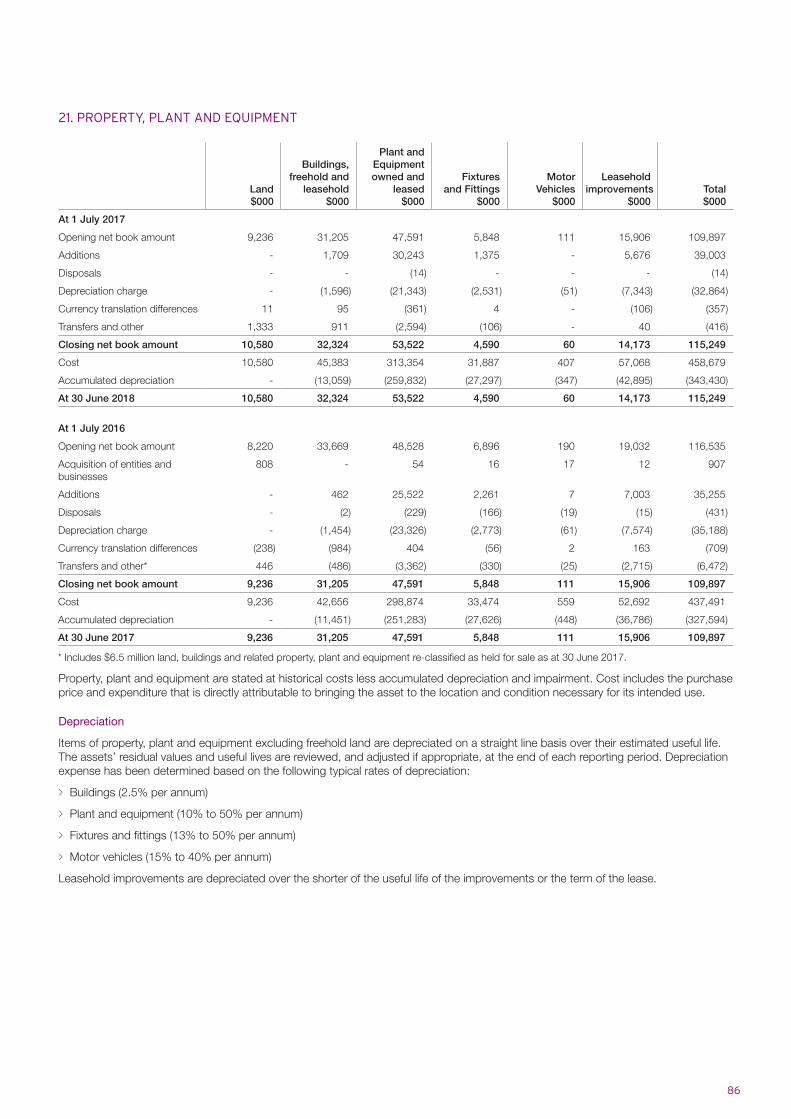
86
21. PROPERTY, PLANT AND EQUIPMENT
Land $000
Buildings, freehold and
leasehold$000
Plant and Equipment owned and
leased$000
Fixtures and Fittings
$000
Motor Vehicles
$000
Leasehold improvements
$000Total$000
At 1 July 2017
Opening net book amount 9,236 31,205 47,591 5,848 111 15,906 109,897
Additions - 1,709 30,243 1,375 - 5,676 39,003
Disposals - - (14) - - - (14)
Depreciation charge - (1,596) (21,343) (2,531) (51) (7,343) (32,864)
Currency translation differences 11 95 (361) 4 - (106) (357)
Transfers and other 1,333 911 (2,594) (106) - 40 (416)
Closing net book amount 10,580 32,324 53,522 4,590 60 14,173 115,249
Cost 10,580 45,383 313,354 31,887 407 57,068 458,679
Accumulated depreciation - (13,059) (259,832) (27,297) (347) (42,895) (343,430)
At 30 June 2018 10,580 32,324 53,522 4,590 60 14,173 115,249
At 1 July 2016
Opening net book amount 8,220 33,669 48,528 6,896 190 19,032 116,535
Acquisition of entities and businesses
808 - 54 16 17 12 907
Additions - 462 25,522 2,261 7 7,003 35,255
Disposals - (2) (229) (166) (19) (15) (431)
Depreciation charge - (1,454) (23,326) (2,773) (61) (7,574) (35,188)
Currency translation differences (238) (984) 404 (56) 2 163 (709)
Transfers and other* 446 (486) (3,362) (330) (25) (2,715) (6,472)
Closing net book amount 9,236 31,205 47,591 5,848 111 15,906 109,897
Cost 9,236 42,656 298,874 33,474 559 52,692 437,491
Accumulated depreciation - (11,451) (251,283) (27,626) (448) (36,786) (327,594)
At 30 June 2017 9,236 31,205 47,591 5,848 111 15,906 109,897
* Includes $6.5 million land, buildings and related property, plant and equipment re-classified as held for sale as at 30 June 2017.
Property, plant and equipment are stated at historical costs less accumulated depreciation and impairment. Cost includes the purchase price and expenditure that is directly attributable to bringing the asset to the location and condition necessary for its intended use.
Depreciation
Items of property, plant and equipment excluding freehold land are depreciated on a straight line basis over their estimated useful life. The assets’ residual values and useful lives are reviewed, and adjusted if appropriate, at the end of each reporting period. Depreciation expense has been determined based on the following typical rates of depreciation:
> Buildings (2.5% per annum)
> Plant and equipment (10% to 50% per annum)
> Fixtures and fittings (13% to 50% per annum)
> Motor vehicles (15% to 40% per annum)
Leasehold improvements are depreciated over the shorter of the useful life of the improvements or the term of the lease.
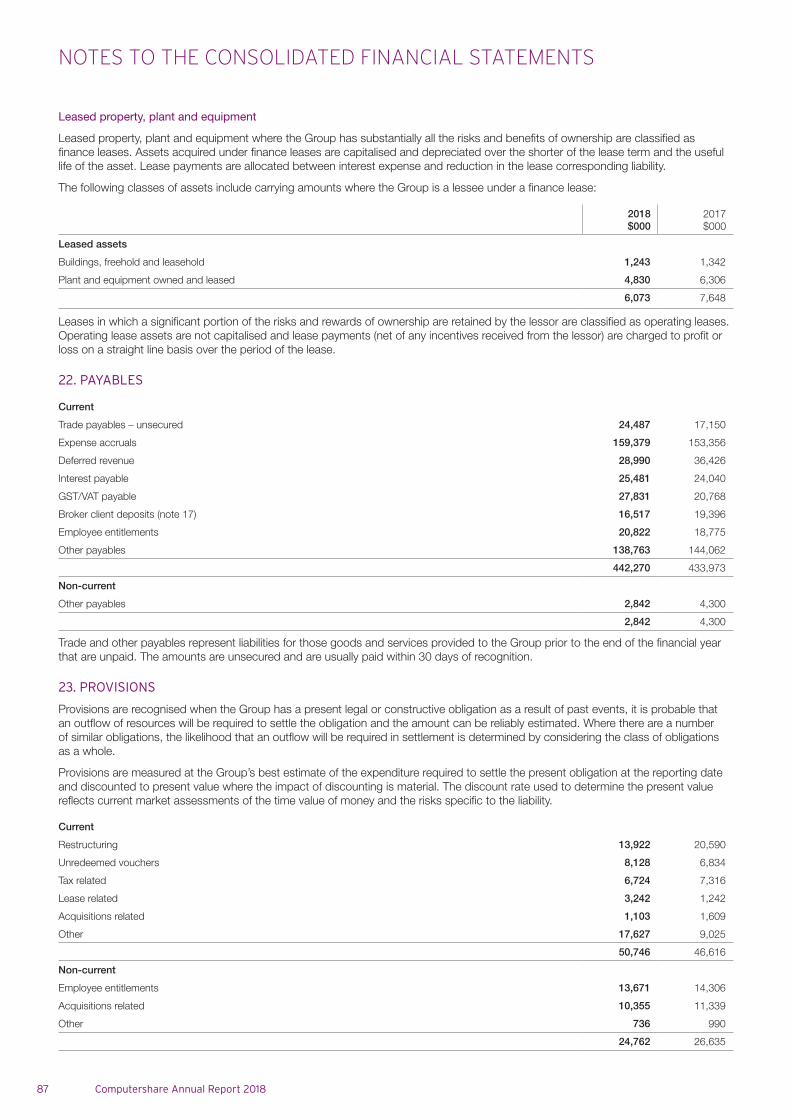
NOTES TO THE CONSOLIDATED FINANCIAL STATEMENTS
87 Computershare Annual Report 2018
Leased property, plant and equipment
Leased property, plant and equipment where the Group has substantially all the risks and benefits of ownership are classified as finance leases. Assets acquired under finance leases are capitalised and depreciated over the shorter of the lease term and the useful life of the asset. Lease payments are allocated between interest expense and reduction in the lease corresponding liability.
The following classes of assets include carrying amounts where the Group is a lessee under a finance lease:
2018$000
2017$000
Leased assets
Buildings, freehold and leasehold 1,243 1,342
Plant and equipment owned and leased 4,830 6,306
6,073 7,648
Leases in which a significant portion of the risks and rewards of ownership are retained by the lessor are classified as operating leases. Operating lease assets are not capitalised and lease payments (net of any incentives received from the lessor) are charged to profit or loss on a straight line basis over the period of the lease.
22. PAYABLES
Current
Trade payables – unsecured 24,487 17,150
Expense accruals 159,379 153,356
Deferred revenue 28,990 36,426
Interest payable 25,481 24,040
GST/VAT payable 27,831 20,768
Broker client deposits (note 17) 16,517 19,396
Employee entitlements 20,822 18,775
Other payables 138,763 144,062
442,270 433,973
Non-current
Other payables 2,842 4,300
2,842 4,300
Trade and other payables represent liabilities for those goods and services provided to the Group prior to the end of the financial year that are unpaid. The amounts are unsecured and are usually paid within 30 days of recognition.
23. PROVISIONS
Provisions are recognised when the Group has a present legal or constructive obligation as a result of past events, it is probable that an outflow of resources will be required to settle the obligation and the amount can be reliably estimated. Where there are a number of similar obligations, the likelihood that an outflow will be required in settlement is determined by considering the class of obligations as a whole.
Provisions are measured at the Group’s best estimate of the expenditure required to settle the present obligation at the reporting date and discounted to present value where the impact of discounting is material. The discount rate used to determine the present value reflects current market assessments of the time value of money and the risks specific to the liability.
Current
Restructuring 13,922 20,590
Unredeemed vouchers 8,128 6,834
Tax related 6,724 7,316
Lease related 3,242 1,242
Acquisitions related 1,103 1,609
Other 17,627 9,025
50,746 46,616
Non-current
Employee entitlements 13,671 14,306
Acquisitions related 10,355 11,339
Other 736 990
24,762 26,635
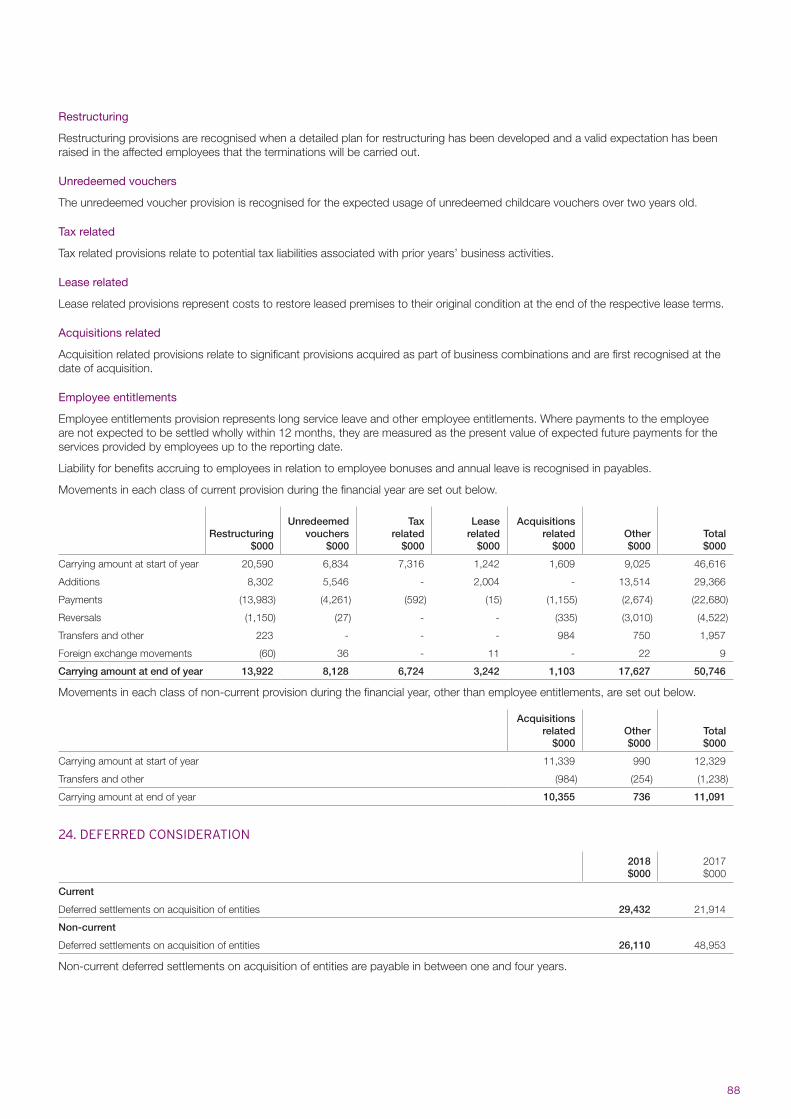
88
Restructuring
Restructuring provisions are recognised when a detailed plan for restructuring has been developed and a valid expectation has been raised in the affected employees that the terminations will be carried out.
Unredeemed vouchers
The unredeemed voucher provision is recognised for the expected usage of unredeemed childcare vouchers over two years old.
Tax related
Tax related provisions relate to potential tax liabilities associated with prior years’ business activities.
Lease related
Lease related provisions represent costs to restore leased premises to their original condition at the end of the respective lease terms.
Acquisitions related
Acquisition related provisions relate to significant provisions acquired as part of business combinations and are first recognised at the date of acquisition.
Employee entitlements
Employee entitlements provision represents long service leave and other employee entitlements. Where payments to the employee are not expected to be settled wholly within 12 months, they are measured as the present value of expected future payments for the services provided by employees up to the reporting date.
Liability for benefits accruing to employees in relation to employee bonuses and annual leave is recognised in payables.
Movements in each class of current provision during the financial year are set out below.
Restructuring$000
Unredeemed vouchers
$000
Tax related
$000
Lease related
$000
Acquisitions related
$000Other$000
Total$000
Carrying amount at start of year 20,590 6,834 7,316 1,242 1,609 9,025 46,616
Additions 8,302 5,546 - 2,004 - 13,514 29,366
Payments (13,983) (4,261) (592) (15) (1,155) (2,674) (22,680)
Reversals (1,150) (27) - - (335) (3,010) (4,522)
Transfers and other 223 - - - 984 750 1,957
Foreign exchange movements (60) 36 - 11 - 22 9
Carrying amount at end of year 13,922 8,128 6,724 3,242 1,103 17,627 50,746
Movements in each class of non-current provision during the financial year, other than employee entitlements, are set out below.
Acquisitions related
$000Other$000
Total$000
Carrying amount at start of year 11,339 990 12,329
Transfers and other (984) (254) (1,238)
Carrying amount at end of year 10,355 736 11,091
24. DEFERRED CONSIDERATION
2018$000
2017$000
Current
Deferred settlements on acquisition of entities 29,432 21,914
Non-current
Deferred settlements on acquisition of entities 26,110 48,953
Non-current deferred settlements on acquisition of entities are payable in between one and four years.
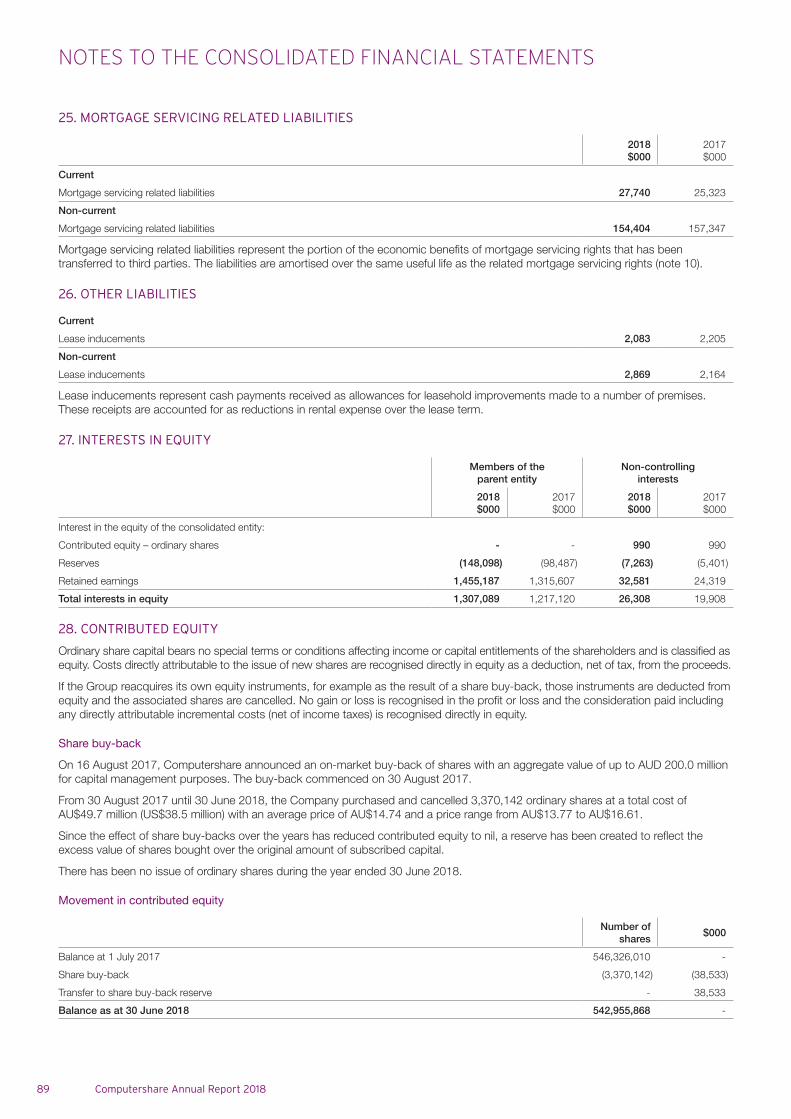
NOTES TO THE CONSOLIDATED FINANCIAL STATEMENTS
89 Computershare Annual Report 2018
25. MORTGAGE SERVICING RELATED LIABILITIES
2018$000
2017$000
Current
Mortgage servicing related liabilities 27,740 25,323
Non-current
Mortgage servicing related liabilities 154,404 157,347
Mortgage servicing related liabilities represent the portion of the economic benefits of mortgage servicing rights that has been transferred to third parties. The liabilities are amortised over the same useful life as the related mortgage servicing rights (note 10).
26. OTHER LIABILITIES
Current
Lease inducements 2,083 2,205
Non-current
Lease inducements 2,869 2,164
Lease inducements represent cash payments received as allowances for leasehold improvements made to a number of premises. These receipts are accounted for as reductions in rental expense over the lease term.
27. INTERESTS IN EQUITY
Members of the parent entity
Non-controlling interests
2018$000
2017$000
2018$000
2017$000
Interest in the equity of the consolidated entity:
Contributed equity – ordinary shares - - 990 990
Reserves (148,098) (98,487) (7,263) (5,401)
Retained earnings 1,455,187 1,315,607 32,581 24,319
Total interests in equity 1,307,089 1,217,120 26,308 19,908
28. CONTRIBUTED EQUITY
Ordinary share capital bears no special terms or conditions affecting income or capital entitlements of the shareholders and is classified as equity. Costs directly attributable to the issue of new shares are recognised directly in equity as a deduction, net of tax, from the proceeds.
If the Group reacquires its own equity instruments, for example as the result of a share buy-back, those instruments are deducted from equity and the associated shares are cancelled. No gain or loss is recognised in the profit or loss and the consideration paid including any directly attributable incremental costs (net of income taxes) is recognised directly in equity.
Share buy-back
On 16 August 2017, Computershare announced an on-market buy-back of shares with an aggregate value of up to AUD 200.0 million for capital management purposes. The buy-back commenced on 30 August 2017.
From 30 August 2017 until 30 June 2018, the Company purchased and cancelled 3,370,142 ordinary shares at a total cost of AU$49.7 million (US$38.5 million) with an average price of AU$14.74 and a price range from AU$13.77 to AU$16.61.
Since the effect of share buy-backs over the years has reduced contributed equity to nil, a reserve has been created to reflect the excess value of shares bought over the original amount of subscribed capital.
There has been no issue of ordinary shares during the year ended 30 June 2018.
Movement in contributed equity
Number of shares
$000
Balance at 1 July 2017 546,326,010 -
Share buy-back (3,370,142) (38,533)
Transfer to share buy-back reserve - 38,533
Balance as at 30 June 2018 542,955,868 -
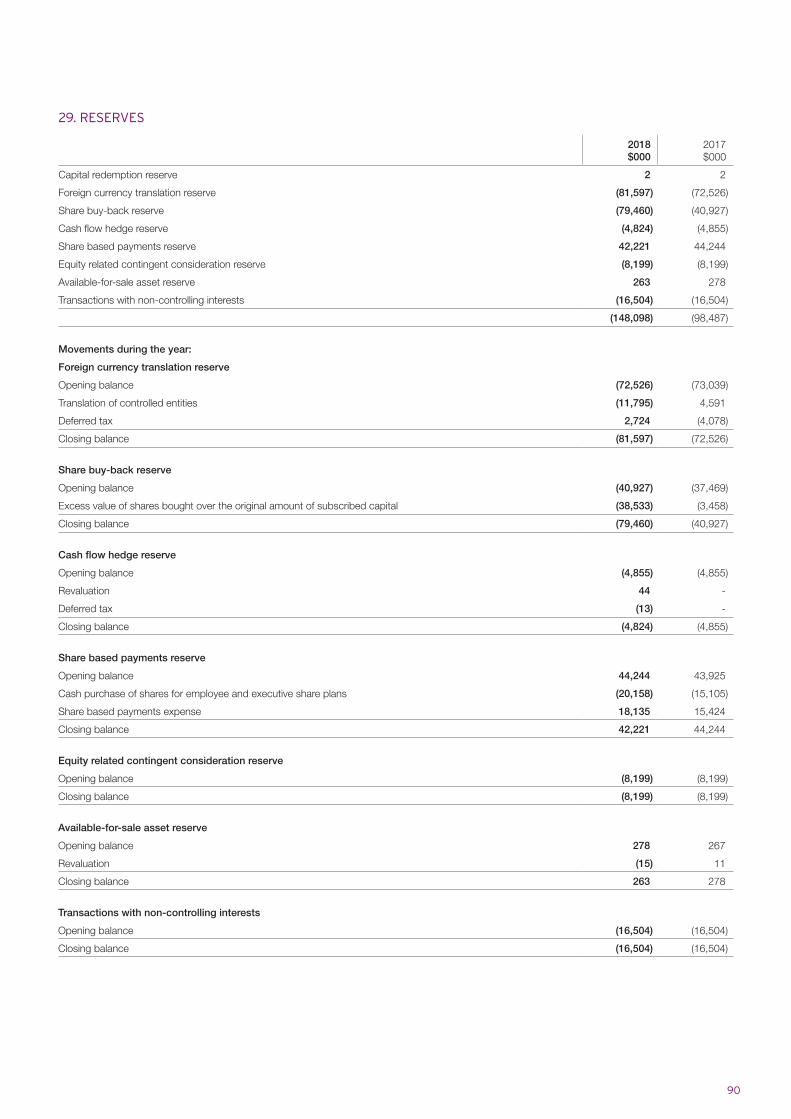
90
29. RESERVES
2018$000
2017$000
Capital redemption reserve 2 2
Foreign currency translation reserve (81,597) (72,526)
Share buy-back reserve (79,460) (40,927)
Cash flow hedge reserve (4,824) (4,855)
Share based payments reserve 42,221 44,244
Equity related contingent consideration reserve (8,199) (8,199)
Available-for-sale asset reserve 263 278
Transactions with non-controlling interests (16,504) (16,504)
(148,098) (98,487)
Movements during the year:
Foreign currency translation reserve
Opening balance (72,526) (73,039)
Translation of controlled entities (11,795) 4,591
Deferred tax 2,724 (4,078)
Closing balance (81,597) (72,526)
Share buy-back reserve
Opening balance (40,927) (37,469)
Excess value of shares bought over the original amount of subscribed capital (38,533) (3,458)
Closing balance (79,460) (40,927)
Cash flow hedge reserve
Opening balance (4,855) (4,855)
Revaluation 44 -
Deferred tax (13) -
Closing balance (4,824) (4,855)
Share based payments reserve
Opening balance 44,244 43,925
Cash purchase of shares for employee and executive share plans (20,158) (15,105)
Share based payments expense 18,135 15,424
Closing balance 42,221 44,244
Equity related contingent consideration reserve
Opening balance (8,199) (8,199)
Closing balance (8,199) (8,199)
Available-for-sale asset reserve
Opening balance 278 267
Revaluation (15) 11
Closing balance 263 278
Transactions with non-controlling interests
Opening balance (16,504) (16,504)
Closing balance (16,504) (16,504)
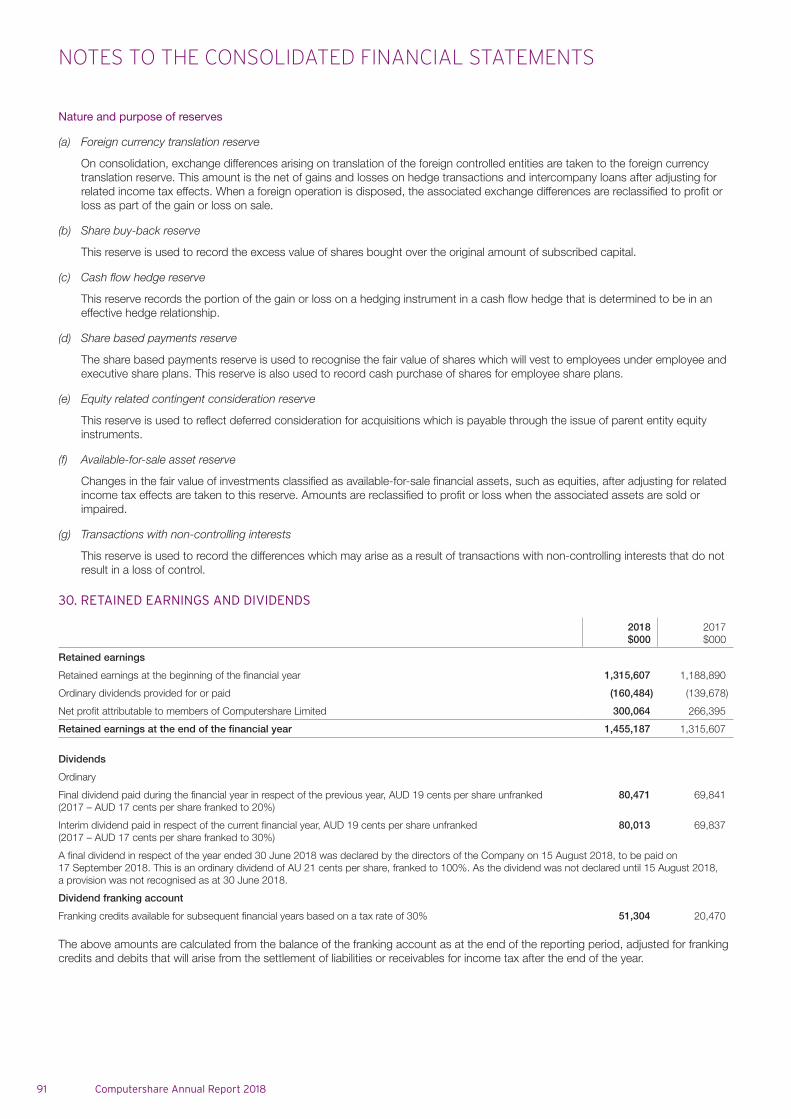
NOTES TO THE CONSOLIDATED FINANCIAL STATEMENTS
91 Computershare Annual Report 2018
Nature and purpose of reserves
(a) Foreign currency translation reserve
On consolidation, exchange differences arising on translation of the foreign controlled entities are taken to the foreign currency translation reserve. This amount is the net of gains and losses on hedge transactions and intercompany loans after adjusting for related income tax effects. When a foreign operation is disposed, the associated exchange differences are reclassified to profit or loss as part of the gain or loss on sale.
(b) Share buy-back reserve
This reserve is used to record the excess value of shares bought over the original amount of subscribed capital.
(c) Cash flow hedge reserve
This reserve records the portion of the gain or loss on a hedging instrument in a cash flow hedge that is determined to be in an effective hedge relationship.
(d) Share based payments reserve
The share based payments reserve is used to recognise the fair value of shares which will vest to employees under employee and executive share plans. This reserve is also used to record cash purchase of shares for employee share plans.
(e) Equity related contingent consideration reserve
This reserve is used to reflect deferred consideration for acquisitions which is payable through the issue of parent entity equity instruments.
(f) Available-for-sale asset reserve
Changes in the fair value of investments classified as available-for-sale financial assets, such as equities, after adjusting for related income tax effects are taken to this reserve. Amounts are reclassified to profit or loss when the associated assets are sold or impaired.
(g) Transactions with non-controlling interests
This reserve is used to record the differences which may arise as a result of transactions with non-controlling interests that do not result in a loss of control.
30. RETAINED EARNINGS AND DIVIDENDS
2018$000
2017$000
Retained earnings
Retained earnings at the beginning of the financial year 1,315,607 1,188,890
Ordinary dividends provided for or paid (160,484) (139,678)
Net profit attributable to members of Computershare Limited 300,064 266,395
Retained earnings at the end of the financial year 1,455,187 1,315,607
Dividends
Ordinary
Final dividend paid during the financial year in respect of the previous year, AUD 19 cents per share unfranked (2017 – AUD 17 cents per share franked to 20%)
80,471 69,841
Interim dividend paid in respect of the current financial year, AUD 19 cents per share unfranked (2017 – AUD 17 cents per share franked to 30%)
80,013 69,837
A final dividend in respect of the year ended 30 June 2018 was declared by the directors of the Company on 15 August 2018, to be paid on 17 September 2018. This is an ordinary dividend of AU 21 cents per share, franked to 100%. As the dividend was not declared until 15 August 2018, a provision was not recognised as at 30 June 2018.
Dividend franking account
Franking credits available for subsequent financial years based on a tax rate of 30% 51,304 20,470
The above amounts are calculated from the balance of the franking account as at the end of the reporting period, adjusted for franking credits and debits that will arise from the settlement of liabilities or receivables for income tax after the end of the year.
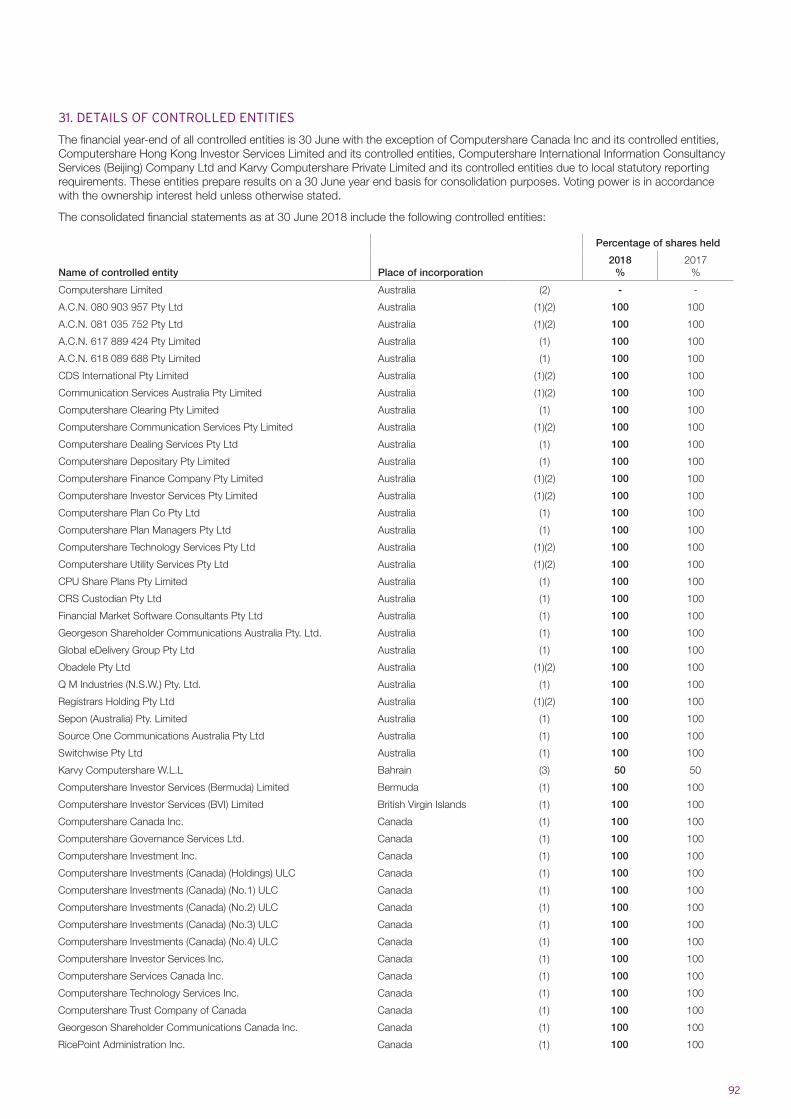
92
31. DETAILS OF CONTROLLED ENTITIES
The financial year-end of all controlled entities is 30 June with the exception of Computershare Canada Inc and its controlled entities, Computershare Hong Kong Investor Services Limited and its controlled entities, Computershare International Information Consultancy Services (Beijing) Company Ltd and Karvy Computershare Private Limited and its controlled entities due to local statutory reporting requirements. These entities prepare results on a 30 June year end basis for consolidation purposes. Voting power is in accordance with the ownership interest held unless otherwise stated.
The consolidated financial statements as at 30 June 2018 include the following controlled entities:
Name of controlled entity Place of incorporation
Percentage of shares held
2018%
2017%
Computershare Limited Australia (2) - -
A.C.N. 080 903 957 Pty Ltd Australia (1)(2) 100 100
A.C.N. 081 035 752 Pty Ltd Australia (1)(2) 100 100
A.C.N. 617 889 424 Pty Limited Australia (1) 100 100
A.C.N. 618 089 688 Pty Limited Australia (1) 100 100
CDS International Pty Limited Australia (1)(2) 100 100
Communication Services Australia Pty Limited Australia (1)(2) 100 100
Computershare Clearing Pty Limited Australia (1) 100 100
Computershare Communication Services Pty Limited Australia (1)(2) 100 100
Computershare Dealing Services Pty Ltd Australia (1) 100 100
Computershare Depositary Pty Limited Australia (1) 100 100
Computershare Finance Company Pty Limited Australia (1)(2) 100 100
Computershare Investor Services Pty Limited Australia (1)(2) 100 100
Computershare Plan Co Pty Ltd Australia (1) 100 100
Computershare Plan Managers Pty Ltd Australia (1) 100 100
Computershare Technology Services Pty Ltd Australia (1)(2) 100 100
Computershare Utility Services Pty Ltd Australia (1)(2) 100 100
CPU Share Plans Pty Limited Australia (1) 100 100
CRS Custodian Pty Ltd Australia (1) 100 100
Financial Market Software Consultants Pty Ltd Australia (1) 100 100
Georgeson Shareholder Communications Australia Pty. Ltd. Australia (1) 100 100
Global eDelivery Group Pty Ltd Australia (1) 100 100
Obadele Pty Ltd Australia (1)(2) 100 100
Q M Industries (N.S.W.) Pty. Ltd. Australia (1) 100 100
Registrars Holding Pty Ltd Australia (1)(2) 100 100
Sepon (Australia) Pty. Limited Australia (1) 100 100
Source One Communications Australia Pty Ltd Australia (1) 100 100
Switchwise Pty Ltd Australia (1) 100 100
Karvy Computershare W.L.L Bahrain (3) 50 50
Computershare Investor Services (Bermuda) Limited Bermuda (1) 100 100
Computershare Investor Services (BVI) Limited British Virgin Islands (1) 100 100
Computershare Canada Inc. Canada (1) 100 100
Computershare Governance Services Ltd. Canada (1) 100 100
Computershare Investment Inc. Canada (1) 100 100
Computershare Investments (Canada) (Holdings) ULC Canada (1) 100 100
Computershare Investments (Canada) (No.1) ULC Canada (1) 100 100
Computershare Investments (Canada) (No.2) ULC Canada (1) 100 100
Computershare Investments (Canada) (No.3) ULC Canada (1) 100 100
Computershare Investments (Canada) (No.4) ULC Canada (1) 100 100
Computershare Investor Services Inc. Canada (1) 100 100
Computershare Services Canada Inc. Canada (1) 100 100
Computershare Technology Services Inc. Canada (1) 100 100
Computershare Trust Company of Canada Canada (1) 100 100
Georgeson Shareholder Communications Canada Inc. Canada (1) 100 100
RicePoint Administration Inc. Canada (1) 100 100
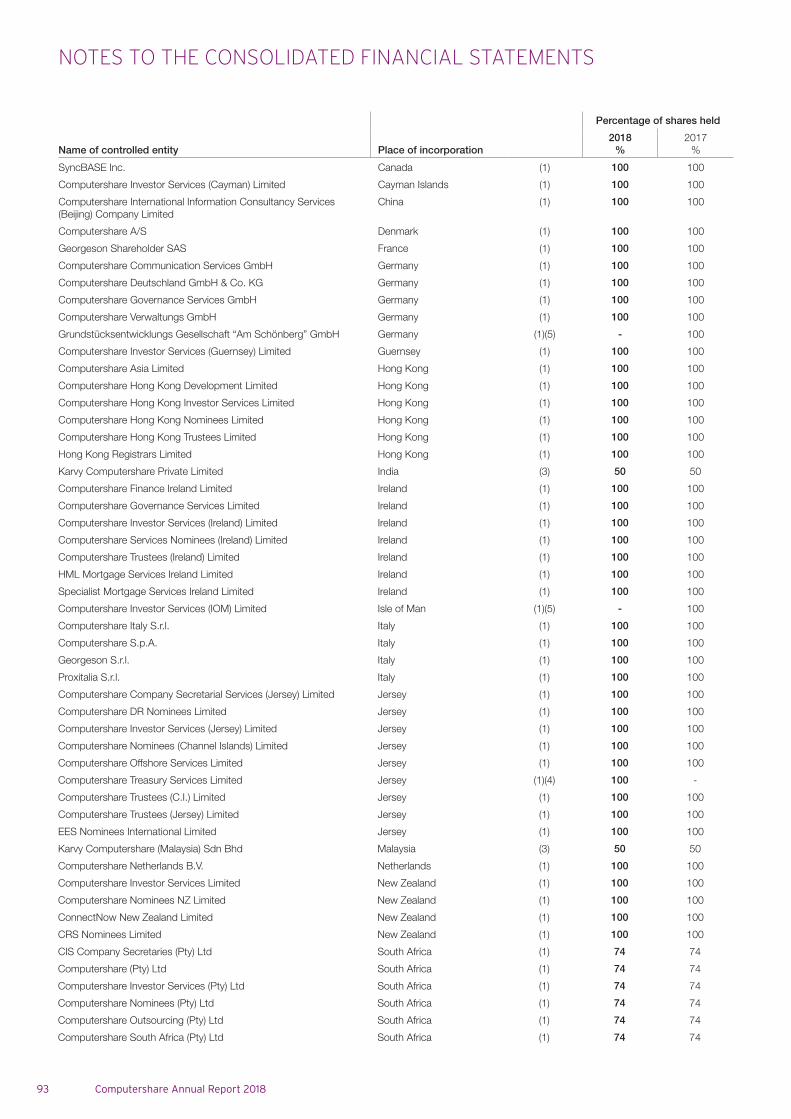
NOTES TO THE CONSOLIDATED FINANCIAL STATEMENTS
93 Computershare Annual Report 2018
Name of controlled entity Place of incorporation
Percentage of shares held
2018%
2017%
SyncBASE Inc. Canada (1) 100 100
Computershare Investor Services (Cayman) Limited Cayman Islands (1) 100 100
Computershare International Information Consultancy Services (Beijing) Company Limited
China (1) 100 100
Computershare A/S Denmark (1) 100 100
Georgeson Shareholder SAS France (1) 100 100
Computershare Communication Services GmbH Germany (1) 100 100
Computershare Deutschland GmbH & Co. KG Germany (1) 100 100
Computershare Governance Services GmbH Germany (1) 100 100
Computershare Verwaltungs GmbH Germany (1) 100 100
Grundstücksentwicklungs Gesellschaft “Am Schönberg” GmbH Germany (1)(5) - 100
Computershare Investor Services (Guernsey) Limited Guernsey (1) 100 100
Computershare Asia Limited Hong Kong (1) 100 100
Computershare Hong Kong Development Limited Hong Kong (1) 100 100
Computershare Hong Kong Investor Services Limited Hong Kong (1) 100 100
Computershare Hong Kong Nominees Limited Hong Kong (1) 100 100
Computershare Hong Kong Trustees Limited Hong Kong (1) 100 100
Hong Kong Registrars Limited Hong Kong (1) 100 100
Karvy Computershare Private Limited India (3) 50 50
Computershare Finance Ireland Limited Ireland (1) 100 100
Computershare Governance Services Limited Ireland (1) 100 100
Computershare Investor Services (Ireland) Limited Ireland (1) 100 100
Computershare Services Nominees (Ireland) Limited Ireland (1) 100 100
Computershare Trustees (Ireland) Limited Ireland (1) 100 100
HML Mortgage Services Ireland Limited Ireland (1) 100 100
Specialist Mortgage Services Ireland Limited Ireland (1) 100 100
Computershare Investor Services (IOM) Limited Isle of Man (1)(5) - 100
Computershare Italy S.r.l. Italy (1) 100 100
Computershare S.p.A. Italy (1) 100 100
Georgeson S.r.l. Italy (1) 100 100
Proxitalia S.r.l. Italy (1) 100 100
Computershare Company Secretarial Services (Jersey) Limited Jersey (1) 100 100
Computershare DR Nominees Limited Jersey (1) 100 100
Computershare Investor Services (Jersey) Limited Jersey (1) 100 100
Computershare Nominees (Channel Islands) Limited Jersey (1) 100 100
Computershare Offshore Services Limited Jersey (1) 100 100
Computershare Treasury Services Limited Jersey (1)(4) 100 -
Computershare Trustees (C.I.) Limited Jersey (1) 100 100
Computershare Trustees (Jersey) Limited Jersey (1) 100 100
EES Nominees International Limited Jersey (1) 100 100
Karvy Computershare (Malaysia) Sdn Bhd Malaysia (3) 50 50
Computershare Netherlands B.V. Netherlands (1) 100 100
Computershare Investor Services Limited New Zealand (1) 100 100
Computershare Nominees NZ Limited New Zealand (1) 100 100
ConnectNow New Zealand Limited New Zealand (1) 100 100
CRS Nominees Limited New Zealand (1) 100 100
CIS Company Secretaries (Pty) Ltd South Africa (1) 74 74
Computershare (Pty) Ltd South Africa (1) 74 74
Computershare Investor Services (Pty) Ltd South Africa (1) 74 74
Computershare Nominees (Pty) Ltd South Africa (1) 74 74
Computershare Outsourcing (Pty) Ltd South Africa (1) 74 74
Computershare South Africa (Pty) Ltd South Africa (1) 74 74
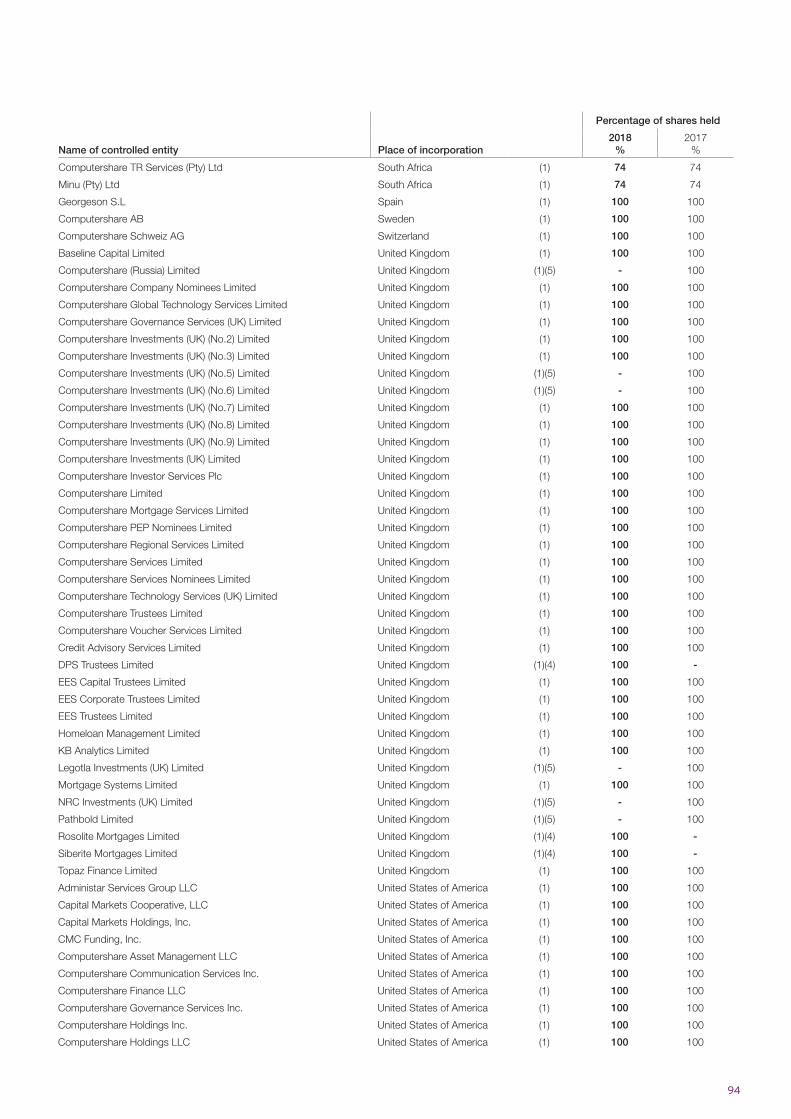
94
Name of controlled entity Place of incorporation
Percentage of shares held
2018%
2017%
Computershare TR Services (Pty) Ltd South Africa (1) 74 74
Minu (Pty) Ltd South Africa (1) 74 74
Georgeson S.L Spain (1) 100 100
Computershare AB Sweden (1) 100 100
Computershare Schweiz AG Switzerland (1) 100 100
Baseline Capital Limited United Kingdom (1) 100 100
Computershare (Russia) Limited United Kingdom (1)(5) - 100
Computershare Company Nominees Limited United Kingdom (1) 100 100
Computershare Global Technology Services Limited United Kingdom (1) 100 100
Computershare Governance Services (UK) Limited United Kingdom (1) 100 100
Computershare Investments (UK) (No.2) Limited United Kingdom (1) 100 100
Computershare Investments (UK) (No.3) Limited United Kingdom (1) 100 100
Computershare Investments (UK) (No.5) Limited United Kingdom (1)(5) - 100
Computershare Investments (UK) (No.6) Limited United Kingdom (1)(5) - 100
Computershare Investments (UK) (No.7) Limited United Kingdom (1) 100 100
Computershare Investments (UK) (No.8) Limited United Kingdom (1) 100 100
Computershare Investments (UK) (No.9) Limited United Kingdom (1) 100 100
Computershare Investments (UK) Limited United Kingdom (1) 100 100
Computershare Investor Services Plc United Kingdom (1) 100 100
Computershare Limited United Kingdom (1) 100 100
Computershare Mortgage Services Limited United Kingdom (1) 100 100
Computershare PEP Nominees Limited United Kingdom (1) 100 100
Computershare Regional Services Limited United Kingdom (1) 100 100
Computershare Services Limited United Kingdom (1) 100 100
Computershare Services Nominees Limited United Kingdom (1) 100 100
Computershare Technology Services (UK) Limited United Kingdom (1) 100 100
Computershare Trustees Limited United Kingdom (1) 100 100
Computershare Voucher Services Limited United Kingdom (1) 100 100
Credit Advisory Services Limited United Kingdom (1) 100 100
DPS Trustees Limited United Kingdom (1)(4) 100 -
EES Capital Trustees Limited United Kingdom (1) 100 100
EES Corporate Trustees Limited United Kingdom (1) 100 100
EES Trustees Limited United Kingdom (1) 100 100
Homeloan Management Limited United Kingdom (1) 100 100
KB Analytics Limited United Kingdom (1) 100 100
Legotla Investments (UK) Limited United Kingdom (1)(5) - 100
Mortgage Systems Limited United Kingdom (1) 100 100
NRC Investments (UK) Limited United Kingdom (1)(5) - 100
Pathbold Limited United Kingdom (1)(5) - 100
Rosolite Mortgages Limited United Kingdom (1)(4) 100 -
Siberite Mortgages Limited United Kingdom (1)(4) 100 -
Topaz Finance Limited United Kingdom (1) 100 100
Administar Services Group LLC United States of America (1) 100 100
Capital Markets Cooperative, LLC United States of America (1) 100 100
Capital Markets Holdings, Inc. United States of America (1) 100 100
CMC Funding, Inc. United States of America (1) 100 100
Computershare Asset Management LLC United States of America (1) 100 100
Computershare Communication Services Inc. United States of America (1) 100 100
Computershare Finance LLC United States of America (1) 100 100
Computershare Governance Services Inc. United States of America (1) 100 100
Computershare Holdings Inc. United States of America (1) 100 100
Computershare Holdings LLC United States of America (1) 100 100
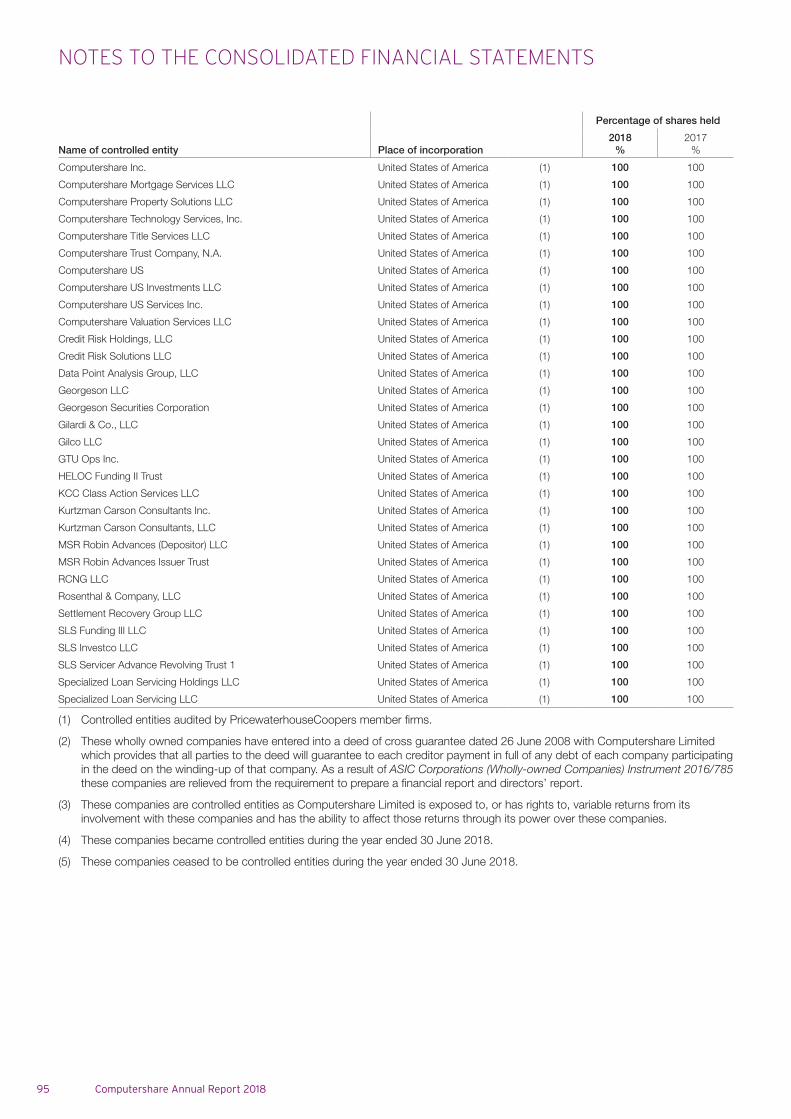
NOTES TO THE CONSOLIDATED FINANCIAL STATEMENTS
95 Computershare Annual Report 2018
Name of controlled entity Place of incorporation
Percentage of shares held
2018%
2017%
Computershare Inc. United States of America (1) 100 100
Computershare Mortgage Services LLC United States of America (1) 100 100
Computershare Property Solutions LLC United States of America (1) 100 100
Computershare Technology Services, Inc. United States of America (1) 100 100
Computershare Title Services LLC United States of America (1) 100 100
Computershare Trust Company, N.A. United States of America (1) 100 100
Computershare US United States of America (1) 100 100
Computershare US Investments LLC United States of America (1) 100 100
Computershare US Services Inc. United States of America (1) 100 100
Computershare Valuation Services LLC United States of America (1) 100 100
Credit Risk Holdings, LLC United States of America (1) 100 100
Credit Risk Solutions LLC United States of America (1) 100 100
Data Point Analysis Group, LLC United States of America (1) 100 100
Georgeson LLC United States of America (1) 100 100
Georgeson Securities Corporation United States of America (1) 100 100
Gilardi & Co., LLC United States of America (1) 100 100
Gilco LLC United States of America (1) 100 100
GTU Ops Inc. United States of America (1) 100 100
HELOC Funding II Trust United States of America (1) 100 100
KCC Class Action Services LLC United States of America (1) 100 100
Kurtzman Carson Consultants Inc. United States of America (1) 100 100
Kurtzman Carson Consultants, LLC United States of America (1) 100 100
MSR Robin Advances (Depositor) LLC United States of America (1) 100 100
MSR Robin Advances Issuer Trust United States of America (1) 100 100
RCNG LLC United States of America (1) 100 100
Rosenthal & Company, LLC United States of America (1) 100 100
Settlement Recovery Group LLC United States of America (1) 100 100
SLS Funding III LLC United States of America (1) 100 100
SLS Investco LLC United States of America (1) 100 100
SLS Servicer Advance Revolving Trust 1 United States of America (1) 100 100
Specialized Loan Servicing Holdings LLC United States of America (1) 100 100
Specialized Loan Servicing LLC United States of America (1) 100 100
(1) Controlled entities audited by PricewaterhouseCoopers member firms.
(2) These wholly owned companies have entered into a deed of cross guarantee dated 26 June 2008 with Computershare Limited which provides that all parties to the deed will guarantee to each creditor payment in full of any debt of each company participating in the deed on the winding-up of that company. As a result of ASIC Corporations (Wholly-owned Companies) Instrument 2016/785 these companies are relieved from the requirement to prepare a financial report and directors’ report.
(3) These companies are controlled entities as Computershare Limited is exposed to, or has rights to, variable returns from its involvement with these companies and has the ability to affect those returns through its power over these companies.
(4) These companies became controlled entities during the year ended 30 June 2018.
(5) These companies ceased to be controlled entities during the year ended 30 June 2018.
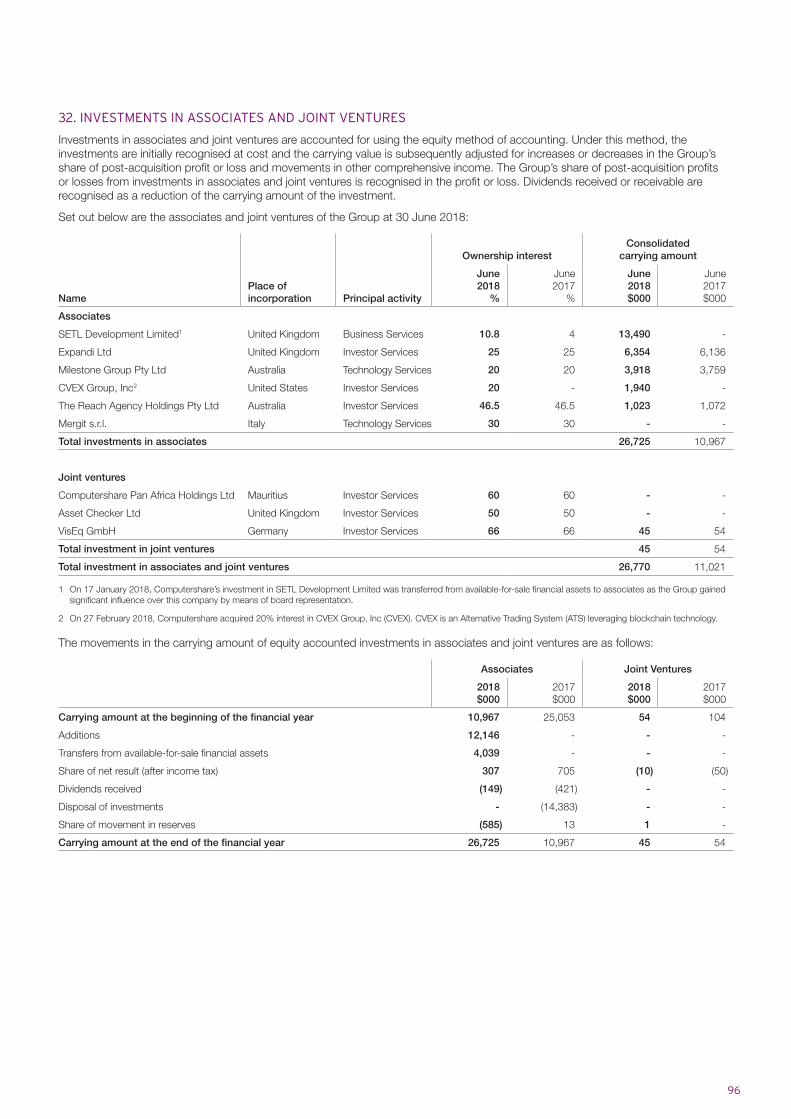
96
32. INVESTMENTS IN ASSOCIATES AND JOINT VENTURES
Investments in associates and joint ventures are accounted for using the equity method of accounting. Under this method, the investments are initially recognised at cost and the carrying value is subsequently adjusted for increases or decreases in the Group’s share of post-acquisition profit or loss and movements in other comprehensive income. The Group’s share of post-acquisition profits or losses from investments in associates and joint ventures is recognised in the profit or loss. Dividends received or receivable are recognised as a reduction of the carrying amount of the investment.
Set out below are the associates and joint ventures of the Group at 30 June 2018:
NamePlace of incorporation Principal activity
Ownership interestConsolidated
carrying amount
June2018
%
June2017
%
June2018$000
June2017$000
Associates
SETL Development Limited1 United Kingdom Business Services 10.8 4 13,490 -
Expandi Ltd United Kingdom Investor Services 25 25 6,354 6,136
Milestone Group Pty Ltd Australia Technology Services 20 20 3,918 3,759
CVEX Group, Inc2 United States Investor Services 20 - 1,940 -
The Reach Agency Holdings Pty Ltd Australia Investor Services 46.5 46.5 1,023 1,072
Mergit s.r.l. Italy Technology Services 30 30 - -
Total investments in associates 26,725 10,967
Joint ventures
Computershare Pan Africa Holdings Ltd Mauritius Investor Services 60 60 - -
Asset Checker Ltd United Kingdom Investor Services 50 50 - -
VisEq GmbH Germany Investor Services 66 66 45 54
Total investment in joint ventures 45 54
Total investment in associates and joint ventures 26,770 11,021
1 On 17 January 2018, Computershare’s investment in SETL Development Limited was transferred from available-for-sale financial assets to associates as the Group gained significant influence over this company by means of board representation.
2 On 27 February 2018, Computershare acquired 20% interest in CVEX Group, Inc (CVEX). CVEX is an Alternative Trading System (ATS) leveraging blockchain technology.
The movements in the carrying amount of equity accounted investments in associates and joint ventures are as follows:
Associates Joint Ventures
2018$000
2017$000
2018$000
2017$000
Carrying amount at the beginning of the financial year 10,967 25,053 54 104
Additions 12,146 - - -
Transfers from available-for-sale financial assets 4,039 - - -
Share of net result (after income tax) 307 705 (10) (50)
Dividends received (149) (421) - -
Disposal of investments - (14,383) - -
Share of movement in reserves (585) 13 1 -
Carrying amount at the end of the financial year 26,725 10,967 45 54
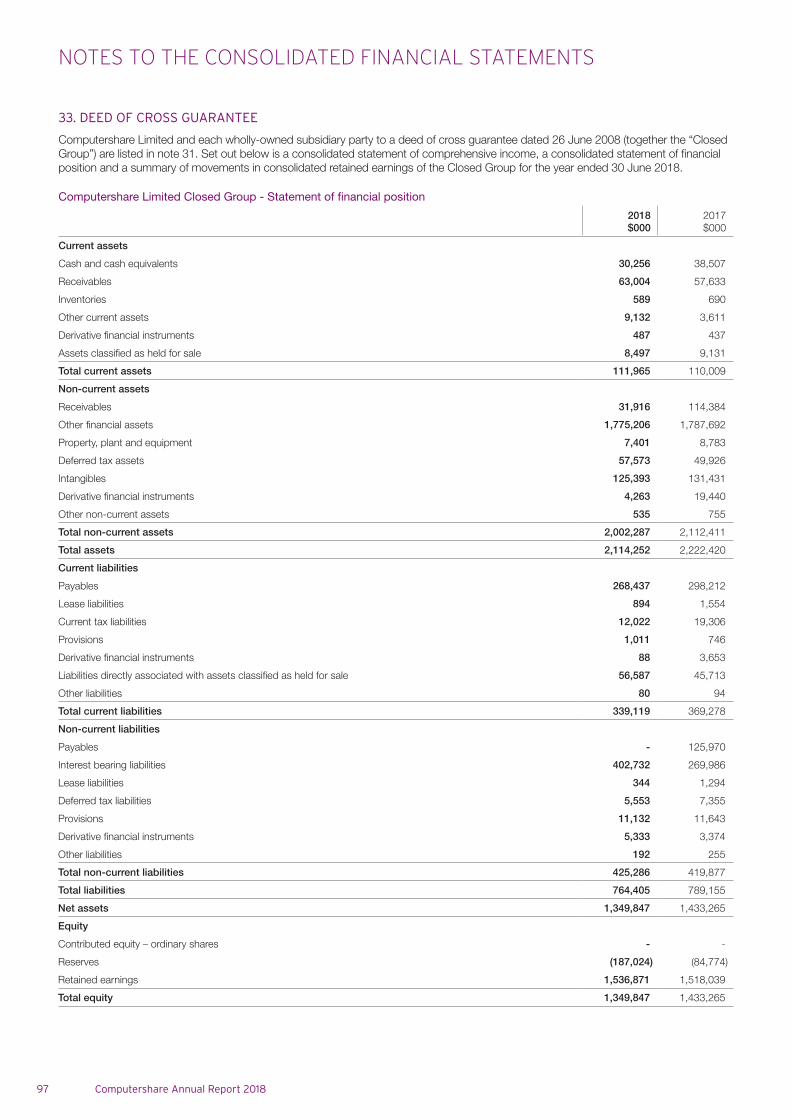
NOTES TO THE CONSOLIDATED FINANCIAL STATEMENTS
97 Computershare Annual Report 2018
33. DEED OF CROSS GUARANTEE
Computershare Limited and each wholly-owned subsidiary party to a deed of cross guarantee dated 26 June 2008 (together the “Closed Group”) are listed in note 31. Set out below is a consolidated statement of comprehensive income, a consolidated statement of financial position and a summary of movements in consolidated retained earnings of the Closed Group for the year ended 30 June 2018.
Computershare Limited Closed Group - Statement of financial position
2018$000
2017$000
Current assets
Cash and cash equivalents 30,256 38,507
Receivables 63,004 57,633
Inventories 589 690
Other current assets 9,132 3,611
Derivative financial instruments 487 437
Assets classified as held for sale 8,497 9,131
Total current assets 111,965 110,009
Non-current assets
Receivables 31,916 114,384
Other financial assets 1,775,206 1,787,692
Property, plant and equipment 7,401 8,783
Deferred tax assets 57,573 49,926
Intangibles 125,393 131,431
Derivative financial instruments 4,263 19,440
Other non-current assets 535 755
Total non-current assets 2,002,287 2,112,411
Total assets 2,114,252 2,222,420
Current liabilities
Payables 268,437 298,212
Lease liabilities 894 1,554
Current tax liabilities 12,022 19,306
Provisions 1,011 746
Derivative financial instruments 88 3,653
Liabilities directly associated with assets classified as held for sale 56,587 45,713
Other liabilities 80 94
Total current liabilities 339,119 369,278
Non-current liabilities
Payables - 125,970
Interest bearing liabilities 402,732 269,986
Lease liabilities 344 1,294
Deferred tax liabilities 5,553 7,355
Provisions 11,132 11,643
Derivative financial instruments 5,333 3,374
Other liabilities 192 255
Total non-current liabilities 425,286 419,877
Total liabilities 764,405 789,155
Net assets 1,349,847 1,433,265
Equity
Contributed equity – ordinary shares - -
Reserves (187,024) (84,774)
Retained earnings 1,536,871 1,518,039
Total equity 1,349,847 1,433,265
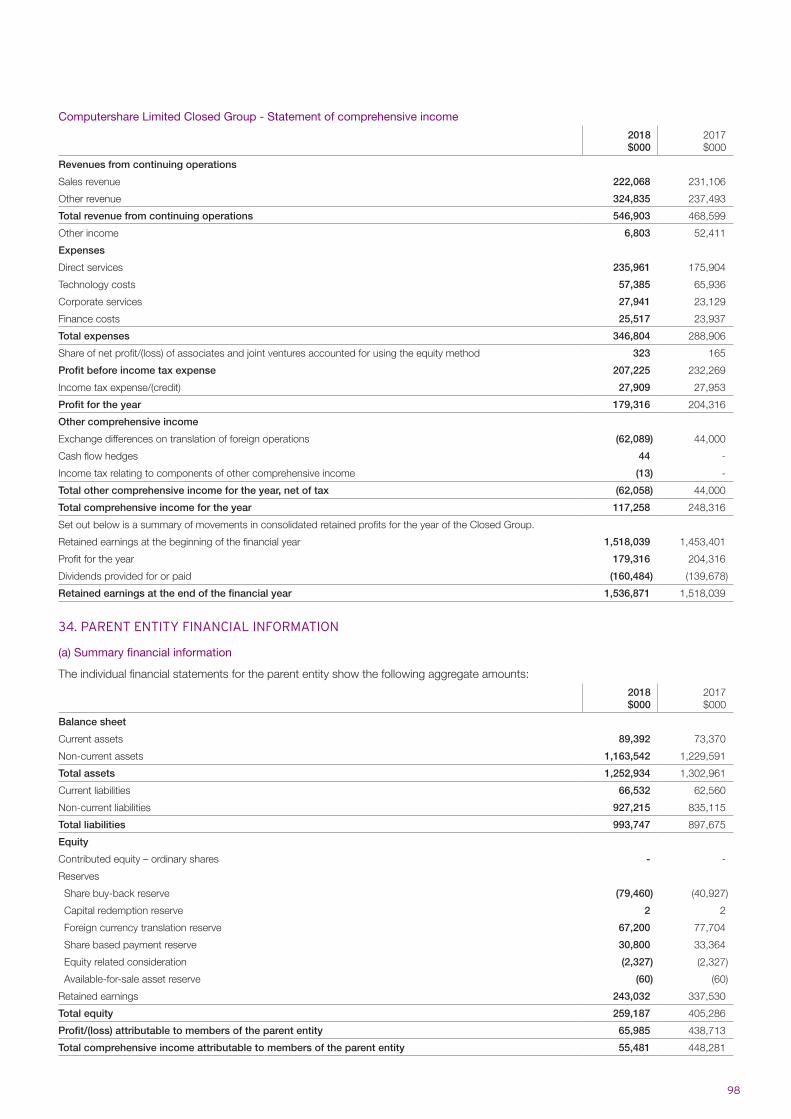
98
Computershare Limited Closed Group - Statement of comprehensive income
2018$000
2017$000
Revenues from continuing operations
Sales revenue 222,068 231,106
Other revenue 324,835 237,493
Total revenue from continuing operations 546,903 468,599
Other income 6,803 52,411
Expenses
Direct services 235,961 175,904
Technology costs 57,385 65,936
Corporate services 27,941 23,129
Finance costs 25,517 23,937
Total expenses 346,804 288,906
Share of net profit/(loss) of associates and joint ventures accounted for using the equity method 323 165
Profit before income tax expense 207,225 232,269
Income tax expense/(credit) 27,909 27,953
Profit for the year 179,316 204,316
Other comprehensive income
Exchange differences on translation of foreign operations (62,089) 44,000
Cash flow hedges 44 -
Income tax relating to components of other comprehensive income (13) -
Total other comprehensive income for the year, net of tax (62,058) 44,000
Total comprehensive income for the year 117,258 248,316
Set out below is a summary of movements in consolidated retained profits for the year of the Closed Group.
Retained earnings at the beginning of the financial year 1,518,039 1,453,401
Profit for the year 179,316 204,316
Dividends provided for or paid (160,484) (139,678)
Retained earnings at the end of the financial year 1,536,871 1,518,039
34. PARENT ENTITY FINANCIAL INFORMATION
(a) Summary financial information
The individual financial statements for the parent entity show the following aggregate amounts:
2018$000
2017$000
Balance sheet
Current assets 89,392 73,370
Non-current assets 1,163,542 1,229,591
Total assets 1,252,934 1,302,961
Current liabilities 66,532 62,560
Non-current liabilities 927,215 835,115
Total liabilities 993,747 897,675
Equity
Contributed equity – ordinary shares - -
Reserves
Share buy-back reserve (79,460) (40,927)
Capital redemption reserve 2 2
Foreign currency translation reserve 67,200 77,704
Share based payment reserve 30,800 33,364
Equity related consideration (2,327) (2,327)
Available-for-sale asset reserve (60) (60)
Retained earnings 243,032 337,530
Total equity 259,187 405,286
Profit/(loss) attributable to members of the parent entity 65,985 438,713
Total comprehensive income attributable to members of the parent entity 55,481 448,281
NOTES TO THE CONSOLIDATED FINANCIAL STATEMENTS
99 Computershare Annual Report 2018
(b) Guarantees
The parent entity’s financial guarantees have been outlined in note 35.
(c) Contingent liabilities
The parent entity did not have any contingent liabilities as at 30 June 2018 or 30 June 2017 other than the Australian thin capitalisation contingent liability outlined in note 6 and the matters outlined in note 35.
(d) Parent entity financial information
The financial information for the parent entity, Computershare Limited has been prepared on the same basis as the consolidated financial statements, except as set out below.
Investments in controlled entities, associates and joint venture entities
Investments in controlled entities, associates and joint venture entities are accounted for at cost in the financial statements of Computershare Limited. Dividends received from associates and joint ventures are recognised in the parent entity’s profit or loss, rather than being deducted from the carrying amount of these investments.
Tax consolidation legislation
Computershare Limited and its wholly-owned Australian controlled entities formed a tax consolidation group with effect from 1 July 2002.
Members of the tax consolidated group also entered into a tax sharing deed, which includes a tax funding arrangement. As a consequence, Computershare Limited, as the head entity in the tax consolidation group, has recognised the current tax liability (or receivable) relating to the wholly owned Australian controlled entities in this group in the financial statements as if that liability (or receivable) was its own. Amounts receivable or payable under the tax sharing deed are recognised separately as intercompany payables or receivables.
35. CONTINGENT LIABILITIES
(a) Guarantees and Indemnities
Computershare Limited, ACN 081 035 752 Pty Ltd, Computershare Investments (UK) (No. 3) Ltd, Computershare Finance Company Pty Ltd, Computershare US and Computershare Investor Services Inc are parties to a Guarantor Deed Poll dated 11 April 2018 in respect to the following Facility Agreements:
> $450.0 million 5-year multi-currency Syndicated Facility Agreement executed on 11 April 2018;
> $450.0 million 3-year USD Syndicated Facility Agreement executed on 11 April 2018;
> GBP 332.0 million GBP only Bridge Facility Agreement executed on 10 May 2018; and
> $100.0 million multi-currency Bilateral Facility Agreement executed on 28 June 2018 (refer to note 14 for further detail).
Guarantees and indemnities of $745.0 million (2017: $785.0 million) have been given to US Institutional Accredited Investors by Computershare Limited, ACN 081 035 752 Pty Ltd, Computershare Finance Company Pty Ltd, Computershare US, Computershare Investments (UK) (No. 3) Ltd and Computershare Investor Services Inc under a Note and Guarantee Agreement dated 22 March 2005, 29 July 2008 and 9 February 2012.
Bank guarantees of AUD 2.7 million (2017: AUD 3.1 million) have been given in respect of facilities provided to Australian subsidiaries.
Bank guarantees of ZAR 6.8 million (2017: ZAR 7.8 million) have been given in respect of facilities provided to South African subsidiaries.
A performance guarantee of ZAR 16.0 million (2017: ZAR 16.0 million) has been given by Computershare (Pty) Ltd to provide security for the performance of obligations as a Central Securities Depository Participant.
(b) Legal and Regulatory Matters
Due to the nature of operations, certain commercial claims in the normal course of business have been made against the consolidated entity in various countries. An inherent difficulty in predicting the outcome of such matters exists, but in the opinion of the Group, based on current knowledge and in consultation with legal counsel, we do not expect any material liability to the Group to eventuate. The status of all claims is monitored on an ongoing basis, together with the adequacy of any provisions recorded in the Group’s financial statements. For the Australian thin capitalisation contingent liability refer to note 6.
(c) Other
The Group is subject to regulatory capital requirements administered by relevant regulatory bodies in countries where Computershare operates. Failure to meet minimum capital requirements, or other ongoing regulatory requirements, can initiate action by the regulators that, if undertaken, could revoke or suspend the Group’s ability to provide trust services to customers in these markets. At all relevant times Group controlled entities have met all minimum capital requirements.
Computershare Limited (Australia) has issued a letter of warrant to Computershare (Pty) Ltd. This obligates Computershare Limited (Australia) to maintain combined tier one capital of at least ZAR 455.0 million.
100
Potential withholding and other tax liabilities arising from distribution of all retained distributable earnings of all foreign incorporated controlled entities are $40.2 million (2017: $ 41.3 million). No provision is made for withholding tax on unremitted earnings of applicable foreign incorporated controlled entities as there is currently no intention to remit these earnings to the parent entity.
In consideration of the Australian Securities and Investments Commission agreeing to allow AUD 5.0 million to form part of the net tangible assets of Computershare Clearing Pty Ltd so that it can meet certain financial requirements under the conditions of its Australian Financial Services Licence, Computershare Limited has agreed to make, at the request of Computershare Clearing Pty Ltd, a AUD 5.0 million loan to it. Computershare Limited has agreed to subordinate its loan to any other unsecured creditors of Computershare Clearing Pty Ltd. The loan was made pursuant to a deed of subordination dated 7 January 2004.
In consideration of the Australian Securities and Investments Commission agreeing to allow AUD 5.0 million to form part of the net tangible assets of Computershare Share Plans Pty Ltd so that it can meet certain financial requirements under the conditions of its Australian Financial Services Licence, Computershare Limited has agreed to make, at the request of Computershare Share Plans Pty Ltd, a AUD 5.0 million loan to it. Computershare Limited has agreed to subordinate its loan to any other unsecured creditors of Computershare Share Plans Pty Ltd. The loan was made pursuant to a deed of subordination dated 5 July 2007.
Computershare Limited (Australia), as the parent entity, has undertaken to own, either directly or indirectly, all of the equity interests and to guarantee performance of the obligations of Computershare Investor Services Pty Ltd, Computershare Trust Company NA, Georgeson LLC, Georgeson Securities Corporation, Computershare Trust Company of Canada and Computershare Investor Services Inc with respect to any financial accommodation related to transactional services provided by BMO Harris Bank, Chicago.
36. COMMITMENTS
(a) Retirement benefits
Defined Contribution Funds
The Group maintains defined contribution superannuation schemes which provide benefits to all employees upon their disability, retirement or death. Employee contributions to the funds are based upon various percentages of employees’ gross salaries as set out below:
Australian controlled entities contribute to the defined contribution funds as follows:
> Category 1 – Management (employer contributions, voluntary employee contributions)
> Category 2 – Staff (statutory employer contributions of 9.5%, voluntary employee contributions)
> Category 3 – SGC Staff and casual and fixed term employees (statutory employer contributions, voluntary employee contributions)
Foreign controlled entities contribute to the defined contribution funds as follows:
> United Kingdom entities – between 7% and 10% of employees’ gross salaries
> United States entities – voluntary employee contributions with matching employer contribution up to 4% of employees’ base salaries
> Canadian entities – between 2% and 7% of employees’ base salaries dependent upon years of service
> South African entities – 12% of employees’ gross salaries
> New Zealand entities – voluntary employee contributions with matching employer contribution up to 6% of employees’ base salaries
> Hong Kong entities – between 5% and 20% of employees’ base salary dependent upon years of service
> Indian entity – 12% of employees’ gross salaries
Defined Benefit Funds
Where material to the Group, a liability or asset in respect of these plans is recognised in the consolidated statement of financial position, and is measured as the present value of the defined benefit obligation at the reporting date plus unrecognised actuarial gains (less unrecognised actuarial losses) less the fair value of the superannuation fund’s assets at that date and any unrecognised past service cost.
Karvy Computershare Private Limited maintained a defined benefit superannuation scheme which provides benefits to 4,847 employees (2017: 4,303). Actuarial valuation of the scheme is provided by the Life Insurance Corporation, which maintains the fund. The net liability is not material to the Group.
Computershare Deutschland GmbH & Co. KG and Computershare Communication Services GmbH maintained a defined benefit scheme which provides benefits to 8 employees (2017: 9) An actuarial assessment of the scheme was completed as at 30 June 2018 and defined benefit plan liability recognised in accordance with the actuarial valuation. The net liability is not material to the Group.
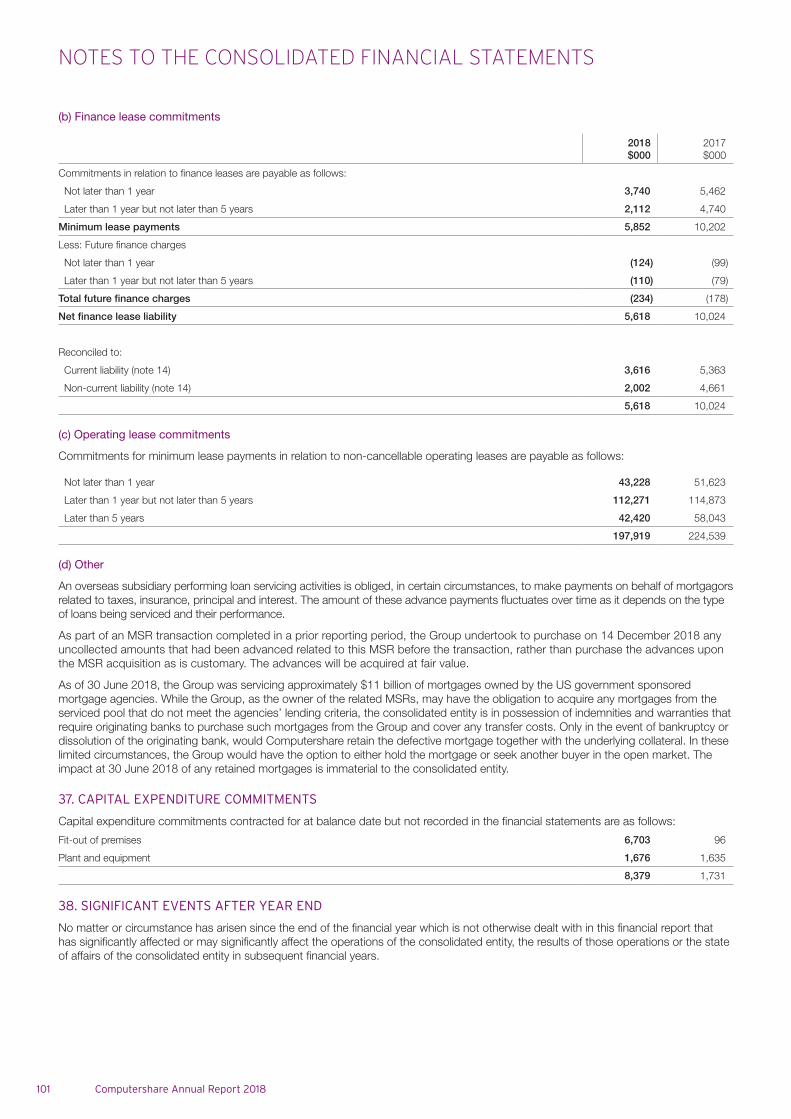
NOTES TO THE CONSOLIDATED FINANCIAL STATEMENTS
101 Computershare Annual Report 2018
(b) Finance lease commitments
2018$000
2017$000
Commitments in relation to finance leases are payable as follows:
Not later than 1 year 3,740 5,462
Later than 1 year but not later than 5 years 2,112 4,740
Minimum lease payments 5,852 10,202
Less: Future finance charges
Not later than 1 year (124) (99)
Later than 1 year but not later than 5 years (110) (79)
Total future finance charges (234) (178)
Net finance lease liability 5,618 10,024
Reconciled to:
Current liability (note 14) 3,616 5,363
Non-current liability (note 14) 2,002 4,661
5,618 10,024
(c) Operating lease commitments
Commitments for minimum lease payments in relation to non-cancellable operating leases are payable as follows:
Not later than 1 year 43,228 51,623
Later than 1 year but not later than 5 years 112,271 114,873
Later than 5 years 42,420 58,043
197,919 224,539
(d) Other
An overseas subsidiary performing loan servicing activities is obliged, in certain circumstances, to make payments on behalf of mortgagors related to taxes, insurance, principal and interest. The amount of these advance payments fluctuates over time as it depends on the type of loans being serviced and their performance.
As part of an MSR transaction completed in a prior reporting period, the Group undertook to purchase on 14 December 2018 any uncollected amounts that had been advanced related to this MSR before the transaction, rather than purchase the advances upon the MSR acquisition as is customary. The advances will be acquired at fair value.
As of 30 June 2018, the Group was servicing approximately $11 billion of mortgages owned by the US government sponsored mortgage agencies. While the Group, as the owner of the related MSRs, may have the obligation to acquire any mortgages from the serviced pool that do not meet the agencies’ lending criteria, the consolidated entity is in possession of indemnities and warranties that require originating banks to purchase such mortgages from the Group and cover any transfer costs. Only in the event of bankruptcy or dissolution of the originating bank, would Computershare retain the defective mortgage together with the underlying collateral. In these limited circumstances, the Group would have the option to either hold the mortgage or seek another buyer in the open market. The impact at 30 June 2018 of any retained mortgages is immaterial to the consolidated entity.
37. CAPITAL EXPENDITURE COMMITMENTS
Capital expenditure commitments contracted for at balance date but not recorded in the financial statements are as follows:
Fit-out of premises 6,703 96
Plant and equipment 1,676 1,635
8,379 1,731
38. SIGNIFICANT EVENTS AFTER YEAR END
No matter or circumstance has arisen since the end of the financial year which is not otherwise dealt with in this financial report that has significantly affected or may significantly affect the operations of the consolidated entity, the results of those operations or the state of affairs of the consolidated entity in subsequent financial years.
102
39. RELATED PARTY DISCLOSURES
Key management personnel disclosures are included in note 40. Detailed remuneration disclosures are provided in the remuneration report.
Directors’ shareholdings Shares in the parent entity
2018 2017
Ordinary shares held at the end of the financial year 46,060,592 46,885,493
Net ordinary shares purchased/(sold) by directors during the financial year (834,901) (3,337,279)
2018$
2017$
Ordinary dividends received during the year in respect of those ordinary shares 13,780,129 12,643,464
(a) Wholly owned Group – intercompany transactions and outstanding balances
The parent entity and its controlled entities entered into the following transactions during the year within the wholly owned Group:
> Loans were advanced and repayments received on loans and intercompany accounts
> Fees were exchanged between entities
> Interest was charged between entities
> The parent entity and its Australian controlled entities have been parties to a tax sharing deed, which includes a tax funding arrangement (note 34)
> Dividends were paid between entities
> Bank guarantees were provided by the parent entity to its controlled entities (note 35)
These transactions were undertaken on commercial terms and conditions.
Ultimate controlling entity
The ultimate controlling entity of the Group is Computershare Limited.
(b) Ownership interests in related parties
Interests in controlled entities are set out in note 31. Interests held in associates and joint ventures are disclosed in note 32.
(c) Transactions with associates and joint ventures
The following transactions were entered into with associates and joint ventures:
2018$
2017$
Sales and purchases of goods and services
Sales to 158,431 125,220
Purchases from 1,516,243 1,111,348
Outstanding balances arising from sales and purchases of goods and services
Trade receivables 9,951 54,457
Trade payables 236,715 3,331
These transactions were undertaken on commercial terms and conditions.
NOTES TO THE CONSOLIDATED FINANCIAL STATEMENTS
103 Computershare Annual Report 2018
40. KEY MANAGEMENT PERSONNEL DISCLOSURES
Key management personnel compensation
2018$
2017$
Short-term employee benefits 10,744,949 8,121,378
Other long-term benefits 51,598 60,603
Post-employment benefits 215,998 257,680
Share based payments 3,832,350 2,580,944
Other 1,028,212 369,716
Total 15,873,107 11,390,321
For detailed remuneration disclosures please refer to section A to F of the remuneration report within the Directors’ Report.
41. EMPLOYEE AND EXECUTIVE BENEFITS
Certain employees are entitled to participate in share and performance rights schemes. A transaction is classified as share-based compensation where the Group receives services from an employee and pays for these in shares or similar equity instruments.
For each of the Group’s share plans, the fair value is measured at grant date and the expense is recognised over the relevant vesting period in the income statement with a corresponding increase in the share based payments reserve. The expense is adjusted to reflect actual and expected levels of vesting.
(a) Share plans
Exempt Employee Share Plan
During the year ended 30 June 2001 the Group introduced an Exempt Employee Share Plan. The plan gives Computershare employees in Australia the opportunity to acquire shares in Computershare Limited. Each year, participating employees can make contributions from their pre-tax salary to acquire AUD 500 worth of shares. Such employee contributions are matched by the Group with an additional AUD 500 worth of shares being acquired for each participating employee. All permanent employees in Australia with at least 6 months service and employed at the allocation date are entitled to participate in this plan.
Deferred Employee Share Plan
During the year ended 30 June 2002 a Deferred Employee Share Plan was established to enable Computershare to match dollar for dollar any employee pre-tax contributions to a maximum of AUD 3,000 per employee. Shares purchased and funded by an employee’s pre-tax salary must remain in the plan for a minimum of one year. Matching shares funded by the Group must be kept in the plan for a minimum of two years or they will be forfeited. All permanent employees in Australia employed at the allocation date are entitled to participate in this plan. A derivative of this plan and the Exempt Employee Share Plan have been made available to employees in New Zealand, Hong Kong, China, the United Kingdom, Ireland, Jersey, Germany, Canada, South Africa and the US.
Subject to the discretion of the Board, shares in the parent entity may also be allocated to selected employees on a discretionary basis having regard to special circumstances as determined by the Remuneration Committee. Such shares may be subject to vesting and performance criteria as determined by the Board or the Remuneration Committee.
Deferred Short-Term Incentive (DSTI) Share Plan
The Group also provides DSTI awards to key management personnel and other senior executives as part of a structured STI plan and other high performing employees on a discretionary basis. Recipients of DSTI awards must complete specified periods of service as a minimum before any share awards under the DSTI plan become unconditional.
Number of employee shares held Ordinary shares
2018 2017
Opening balance 10,795,057 10,522,529
Shares purchased on the market 2,785,101 3,741,252
Forfeited shares reissued 120,726 303,124
Shares forfeited (107,166) (256,280)
Shares withdrawn (3,098,483) (3,515,568)
Closing balance 10,495,235 10,795,057
Fair value of shares granted through the employee share plan ($000)* 32,360 32,277
* Weighted average fair value of shares is determined by the closing price at the end of the day’s trading on the Australian Securities Exchange on the allocation date. The average price per share purchased on market was AUD $14.35.
104
Phantom Share Awards Plan
The Phantom Share Awards Plan (Phantom Plan) was introduced in 2013 as an alternative to the DSTI Share Plan to employees who are resident for tax purposes in countries where the taxation and/or legal requirements mean the DSTI Share Plan does not achieve the most effective outcome for Computershare or those employees. Awards under the Phantom Plan are cash-settled and vest after specified periods of service have been completed.
(b) Performance rights
Long-Term Incentive Plan
The Board has offered to eligible key management personnel and senior group executives in the Group performance rights under long-term incentive plans.
In 2014, the Board approved the terms of the Long-Term Incentive Plan, known as the LTI Plan, which replaced the DLI plan. Performance rights are granted for no consideration and carry no dividend or voting rights. Each performance right carries an entitlement to one fully paid ordinary share in Computershare Limited subject to satisfaction of performance hurdles and continued employment over a three year performance period. Under the plan, 50% of each award of performance rights is subject to EPS hurdle criteria and 50% is subject to TSR Performance criteria. Unvested performance rights lapse on employee’s termination, subject to Board discretion.
Set out below are summaries of performance rights granted under the LTI Plan:
Grant date
Approximate exercise
date Exercise
price
Balance at beginning of
the year
Granted during
the year
Exercised during
the year
Lapsed during
the year
Balance at end of the year
Exercisable at end of the year
1 Dec 2014 Sep 2017 $0.00 564,529 - - (564,529) - -
1 Dec 2015 Sep 2018 $0.00 716,916 - - - 716,916 -
16 Dec 2016 Sep 2019 $0.00 750,375 - - - 750,375 -
5 Dec 2017 Sep 2020 $0.00 - 494,774 - - 494,774 -
Total 2,031,820 494,774 - (564,529) 1,962,065 -
The fair value of performance rights granted under the 2018 LTI plan were assessed using the following parameters:
2018 Plan – EPS 2018 Plan – TSR
Grant Date 5 Dec 2017 5 Dec 2017
Hurdle start date 1 Jul 2017 1 Jul 2017
Hurdle end date 30 Jun 2020 30 Jun 2020
Share price at grant date AUD16.25 AUD16.25
Fair value at measurement date (i) AUD15.27 AUD10.33
Exercise price AUD0.00 AUD0.00
Expected volatility (ii) 24.20% 24.20%
Option life 3 years 3 years
Expected dividend yield p.a (iii) 2.22% 2.22%
Risk free rate p.a (iv) 2.03% N/A
i) To allow for the TSR hurdle, a Monte Carlo simulation was used to value the performance rights. To allow for the EPS hurdle, a closed form Black Scholes model was used to value the performance rights.
ii) Expected volatility is based on historical daily share price for the three-year period preceding the grant date.
iii) Expected dividend yield is based on historic yield for the three-year period immediately preceding the grant date.
iv) Risk free interest rate is based on the three-year Australian Bank Bill Swap Rate at grant date.
NOTES TO THE CONSOLIDATED FINANCIAL STATEMENTS
105 Computershare Annual Report 2018
Deferred Long-Term Incentive Plan
The previous long-term incentive plan, known as the DLI Plan, was offered to eligible key management personnel and senior managers in the Group. Performance rights were granted for no consideration and carried no dividend or voting rights. Under the DLI Plan each performance right carried an entitlement to one fully paid ordinary share in Computershare Limited subject to satisfaction of performance hurdles and/or continued employment over a five year performance period.
Set out below are summaries of performance rights granted under the plan:
Grant date
Approximate exercise
dateExercise
price
Balance at beginning of the year
Granted during
the year
Exercised during
the year
Lapsed during
the year
Balance at end of the year
Exercisable at end of the year
25 Sep 2012 Sep 2017 $0.00 950,000 - (475,000) (475,000) - -
Total 950,000 - (475,000) (475,000) - -
(c) Employee benefits recognised
2018$000
2017$000
Performance rights expense 3,426 2,240
Share plan and options expense 15,866 14,430
Aggregate employee entitlement liability (note 22 and 23) 34,493 33,081
42. REMUNERATION OF AUDITORS
During the year the following fees were paid or payable for services provided by the auditor of the parent entity, its network firms and non-related audit firms:
Assurance services:
Auditing or review of financial statements
– PricewaterhouseCoopers Australia 1,073 925
– Network firms of PricewaterhouseCoopers Australia 2,644 2,849
3,717 3,774
Other assurance services
– PricewaterhouseCoopers Australia 447 380
– Network firms of PricewaterhouseCoopers Australia 1,776 1,698
2,223 2,078
Taxation services
– Related practices of PricewaterhouseCoopers Australia 150 -
150 -
Remuneration received, or due and receivable, by auditors other than the auditor of the parent entity and its affiliates for:
Auditing or review of financial statements 170 220
106
In the directors’ opinion:
(a) the financial statements and notes set out on pages 56 to 105 are in accordance with the Corporations Act 2001, including:
(i) complying with Accounting Standards, the Corporations Regulations 2001 and other mandatory professional reporting requirements; and
(ii) giving a true and fair view of the consolidated entity’s financial position as at 30 June 2018 and of its performance for the financial year ended on that date; and
(b) there are reasonable grounds to believe that the Company will be able to pay its debts as and when they become due and payable; and
(c) at the date of this declaration, there are reasonable grounds to believe that the members of the Closed Group identified in note 31 will be able to meet any obligations or liabilities to which they are, or may become, subject to by virtue of the deed of cross guarantee described in note 33.
Note 1 confirms that the financial statements also comply with International Financial Reporting Standards as issued by the International Accounting Standards Board.
The directors have been given the declarations by the Chief Executive Officer and Chief Financial Officer required by section 295A of the Corporations Act 2001.
Signed in accordance with a resolution of the directors.
SD JonesChairman
SJ IrvingDirector
17 September 2018
DIRECTORS’ DECLARATION
107 Computershare Annual Report 2018
The Chief Executive Officer and Chief Financial Officer state that:
(a) the financial records of the consolidated entity for the financial year ended 30 June 2018 have been properly maintained in accordance with section 286 of the Corporations Act 2001; and
(b) the financial statements, and the notes to the financial statements, of the consolidated entity, for the financial year ended 30 June 2018:
(i) comply with Accounting Standards, the Corporations Regulations 2001 and other mandatory professional reporting requirements; and
(ii) give a true and fair view of the consolidated entity’s financial position as at 30 June 2018 and of their performance for the financial year ended on that date.
SJ IrvingChief Executive Officer
MB DavisChief Financial Officer
17 September 2018
DECLARATION TO THE BOARD OF DIRECTORS
108
PricewaterhouseCoopers, ABN 52 780 433 7572 Riverside Quay, SOUTHBANK VIC 3006, GPO Box 1331, MELBOURNE VIC 3001 T: 61 3 8603 1000, F: 61 3 8603 1999, www.pwc.com.au
Liability limited by a scheme approved under Professional Standards Legislation.
Independent auditor’s report To the members of Computershare Limited
Report on the audit of the financial report
Our opinion In our opinion:
(a) The accompanying financial report of Computershare Limited (the Company) and its controlled entities (together the Group) is in accordance with the Corporations Act 2001, including:
i. giving a true and fair view of the Group's financial position as at 30 June 2018 and of its financial performance for the year then ended
ii. complying with Australian Accounting Standards and the Corporations Regulations 2001.
(b) The financial report and notes also comply with International Financial Reporting Standards as disclosed in Note 1.
What we have audited The Group financial report comprises:
the consolidated statement of financial position as at 30 June 2018 the consolidated statement of comprehensive income for the year then ended the consolidated statement of changes in equity for the year then ended the consolidated cash flow statement for the year then ended the notes to the consolidated financial statements, which include a summary of significant
accounting policies the directors’ declaration.
Basis for opinion We conducted our audit in accordance with Australian Auditing Standards. Our responsibilities under those standards are further described in the Auditor’s responsibilities for the audit of the financial report section of our report.
We believe that the audit evidence we have obtained is sufficient and appropriate to provide a basis for our opinion.
Independence We are independent of the Group in accordance with the auditor independence requirements of the Corporations Act 2001 and the ethical requirements of the Accounting Professional and Ethical Standards Board’s APES 110 Code of Ethics for Professional Accountants (the Code) that are relevant to our audit of the financial report in Australia. We have also fulfilled our other ethical responsibilities in accordance with the Code.
INDEPENDENT AUDITOR’S REPORT
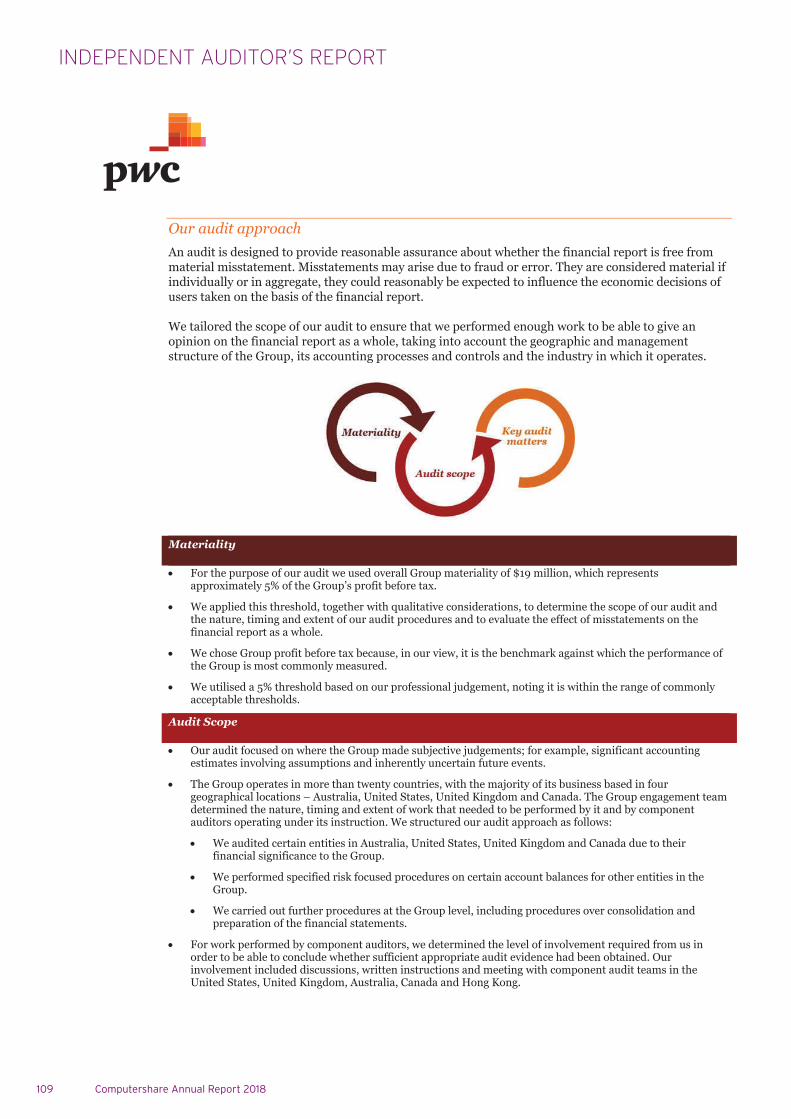
109 Computershare Annual Report 2018
Our audit approach An audit is designed to provide reasonable assurance about whether the financial report is free from material misstatement. Misstatements may arise due to fraud or error. They are considered material if individually or in aggregate, they could reasonably be expected to influence the economic decisions of users taken on the basis of the financial report.
We tailored the scope of our audit to ensure that we performed enough work to be able to give an opinion on the financial report as a whole, taking into account the geographic and management structure of the Group, its accounting processes and controls and the industry in which it operates.
Materiality
For the purpose of our audit we used overall Group materiality of $19 million, which represents approximately 5% of the Group’s profit before tax.
We applied this threshold, together with qualitative considerations, to determine the scope of our audit and the nature, timing and extent of our audit procedures and to evaluate the effect of misstatements on the financial report as a whole.
We chose Group profit before tax because, in our view, it is the benchmark against which the performance of the Group is most commonly measured.
We utilised a 5% threshold based on our professional judgement, noting it is within the range of commonly acceptable thresholds.
Audit Scope
Our audit focused on where the Group made subjective judgements; for example, significant accounting estimates involving assumptions and inherently uncertain future events.
The Group operates in more than twenty countries, with the majority of its business based in four geographical locations – Australia, United States, United Kingdom and Canada. The Group engagement team determined the nature, timing and extent of work that needed to be performed by it and by component auditors operating under its instruction. We structured our audit approach as follows:
We audited certain entities in Australia, United States, United Kingdom and Canada due to their financial significance to the Group.
We performed specified risk focused procedures on certain account balances for other entities in the Group.
We carried out further procedures at the Group level, including procedures over consolidation and preparation of the financial statements.
For work performed by component auditors, we determined the level of involvement required from us in order to be able to conclude whether sufficient appropriate audit evidence had been obtained. Our involvement included discussions, written instructions and meeting with component audit teams in the United States, United Kingdom, Australia, Canada and Hong Kong.
INDEPENDENT AUDITOR’S REPORT
110
Key audit matters Key audit matters are those matters that, in our professional judgement, were of most significance in our audit of the financial report for the current period. The key audit matters were addressed in the context of our audit of the financial report as a whole, and in forming our opinion thereon, and we do not provide a separate opinion on these matters. Further, any commentary on the outcomes of a particular audit procedure is made in that context. We communicated the key audit matters to the Risk and Audit Committee.
Key audit matter How our audit addressed the key audit matter
Uncertain tax positions - Australian thincapitalisation (Refer to note 6 of the financial statements) The Group had been working with the Australian Taxation Office (ATO) and Her Majesty’s Revenue and Customs to renew an existing bilateral advanced pricing arrangement in relation to remuneration paid to the Australian tax consolidated group from its subsidiaries regarding its ownership and licensing of certain intangible assets. As part of that process, the ATO undertook review activities in relation to the Group’s compliance with thin capitalisation rules. Under Australian thin capitalisation rules, the amount of debt used to fund Australian operations or investments is limited. Once certain limits are exceeded, debt deductions claimable against Australian assessable income are disallowed.
In April 2017, the ATO issued a draft position paper to the Group to indicate that it disagreed with the basis applied by the Group in calculating its thin capitalisation position in the 2011–2014 income tax years. In particular, the ATO questioned the recognition of certain intangible assets within the calculation. The Group responded to the ATO’s position paper during the year, outlining the rationale for its thin capitalisation treatment. A contingent liability continues to be disclosed as at 30 June 2018.
We considered this a key audit matter, given the significance of the contingent liability, in addition to the significant judgement required by the Group in assessing whether the accounting treatment remained appropriate as at balance sheet date and the adequacy of disclosures in the financial report, as required under Australian Accounting Standards.
Our audit procedures included:
Reading correspondence between the Group and the ATO that took place during the year.
Interviewing the Group Tax Director, the Chief Financial Officer, and considering the views of the Group’s independent expert to determine if there had been a change to their strategy, position and approach in relation to the ATO draft position paper.
Considering whether the current accounting treatment applied by the Group remains appropriate based on the information obtained from the procedures listed above.
Considering the adequacy of the Group’s contingent liability by obtaining a copy of the Group’s calculations and determining if the methodology applied in the calculations was consistent with existing facts and circumstances.
Assessing the disclosures in light of the requirements of Australian Accounting Standards.
Impairment assessment of goodwill(Refer to note 11 of the financial statements)
The Group had a goodwill balance of $1.5 billion at 30 June 2018, representing approximately 39% of the total assets of the Group.
The Group is required to perform an impairment assessment of its goodwill balance at least annually under Australian Accounting Standards.
For the year ended 30 June 2018, the Group performed
We evaluated whether the Group’s identification of CGUs, which are the smallest identifiable groups of assets that can generate largely independent cash inflows, was consistent with our knowledge of the Group’s operations and internal Group reporting.
In relation to the models, we performed the following procedures, amongst others:
Tested the mathematical accuracy of the models’ calculations.
Compared cash flow forecasts to Board
111 Computershare Annual Report 2018
Key audit matter How our audit addressed the key audit matter
an impairment assessment over the goodwill balancesby calculating the value in use for each operating segment, which is comprised of groups of cash generating units (CGUs), using discounted cash flow models (the models). These valuations were then compared to respective book values to determine the need for any impairment. In each operating segment, the Group’s valuations exceeded book values. The models accounted for sensitivity by assessing hypothetical fluctuations in key assumptions, which did not identify any impairment.
We considered the carrying value of goodwill to be a key audit matter as the balance is significant to the statement of financial position and significant judgement is required by the Group in estimating future cash flows, particularly with respect to determining appropriate:
Discount rates
Five-year cash flow projections (cash flow forecasts)
Earnings growth rates applied beyond the initial five-year period (terminal growth rates).
approved business plans.
Compared previous cash flow forecasts to actual results to assess the Group’s historical accuracy of forecasting.
Compared discount rates contained in the models to a range of acceptable discount rates as determined by PwC valuation experts, with reference to valuations of similar companies and other relevant external data.
Tested whether cash flow forecasts and terminal growth rates used in the models were consistent with our knowledge of current business conditions, externally derived data (where possible) and our understanding of the business.
For each operating segment, we performed a sensitivity analysis by reducing the cash flow forecasts and terminal growth rates, and increasing the discount rates in the models, within a reasonably foreseeable range.
We also considered the adequacy of the Group’s financial report disclosures in relation to this matter in light of the requirements of Australian Accounting Standards.
Revenue recognition – Computershare Mortgage Services’ (CMS) fixed fee revenue (Refer to note 2 of the financial statements)
In 2016, Computershare was appointed by UK Asset Resolution (UKAR) to undertake its mortgage servicing activities. The arrangement involved a fixed fee payable to Computershare over a total of four years for the provision of infrastructure to support the contract (CMS fixed fee revenue). Under Australian Accounting Standards, the fixed fee is to be recognised on a percentage of completion basis, which requires the Group to reassess the total forecast infrastructure costs incurred at each reporting period to determine the appropriate percentage of completion.
We continue to consider the recognition of CMS fixed fee revenue a key audit matter given the judgement required by the Group in determining the total forecast infrastructure costs and the recognition of costs incurred to date.
We performed the following procedures, amongst others, over the recognition of CMS fixed fee revenue:
Agreed the revenue recognition policies to those applied in the prior year to assess consistency.
Confirmed that the Group had reassessed the total infrastructure costs and obtained a copy of the latest projections of the total expected infrastructure costs.
Considered the appropriateness of key assumptions used in determining the recognition of revenue, by: Agreeing the total forecast infrastructure
costs to the Group’s approved business plan.
Comparing a sample of current year costs included in the Group’s cash flow forecasts against actual costs incurred to assess the appropriateness of their recognition.
Recalculated the percentage of completion.
INDEPENDENT AUDITOR’S REPORT
112
Other information The directors are responsible for the other information. The other information comprises the information included in the annual report for the year ended 30 June 2018, including the Overview, Corporate Governance Statement, Directors' Report, Declaration to the Board of Directors and Further Information included in the Group's annual report for the year ended 30 June 2018, but does not include the financial report and our auditor’s report thereon.
Our opinion on the financial report does not cover the other information and accordingly we do not express any form of assurance conclusion thereon.
In connection with our audit of the financial report, our responsibility is to read the other information identified above and, in doing so, consider whether the other information is materially inconsistent with the financial report or our knowledge obtained in the audit, or otherwise appears to be materially misstated.
If, based on the work we have performed, we conclude that there is a material misstatement of this other information, we are required to report that fact. We have nothing to report in this regard.
Responsibilities of the directors for the financial report The directors of the Company are responsible for the preparation of the financial report that gives a true and fair view in accordance with Australian Accounting Standards and the Corporations Act 2001 and for such internal control as the directors determine is necessary to enable the preparation of the financial report that gives a true and fair view and is free from material misstatement, whether due to fraud or error. In Note 1, the directors also state, in accordance with Accounting Standard AASB 101 Presentation of Financial Statements, that the financial statements comply with International Financial Reporting Standards.
In preparing the financial report, the directors are responsible for assessing the ability of the Group to continue as a going concern, disclosing, as applicable, matters related to going concern and using the going concern basis of accounting unless the directors either intend to liquidate the Group or to cease operations, or have no realistic alternative but to do so.
Auditor’s responsibilities for the audit of the financial report Our objectives are to obtain reasonable assurance about whether the financial report as a whole is free from material misstatement, whether due to fraud or error, and to issue an auditor’s report that includes our opinion. Reasonable assurance is a high level of assurance, but is not a guarantee that an audit conducted in accordance with the Australian Auditing Standards will always detect a material misstatement when it exists. Misstatements can arise from fraud or error and are considered material if, individually or in the aggregate, they could reasonably be expected to influence the economic decisions of users taken on the basis of the financial report.
A further description of our responsibilities for the audit of the financial report is located at the Auditing and Assurance Standards Board website at: http://www.auasb.gov.au/auditors_responsibilities/ar1.pdf. This description forms part of our auditor's report.
113 Computershare Annual Report 2018
Report on the remuneration report
Our opinion on the remuneration report We have audited the remuneration report included in pages 41 to 53 of the Directors’ Report for the year ended 30 June 2018.
In our opinion, the remuneration report of Computershare Limited for the year ended 30 June 2018 complies with section 300A of the Corporations Act 2001.
Responsibilities The directors of the Company are responsible for the preparation and presentation of the remuneration report in accordance with section 300A of the Corporations Act 2001. Our responsibility is to express an opinion on the remuneration report, based on our audit conducted in accordance with Australian Auditing Standards.
PricewaterhouseCoopers
Anton Linschoten MelbournePartner 17 September 2018
INDEPENDENT AUDITOR’S REPORT
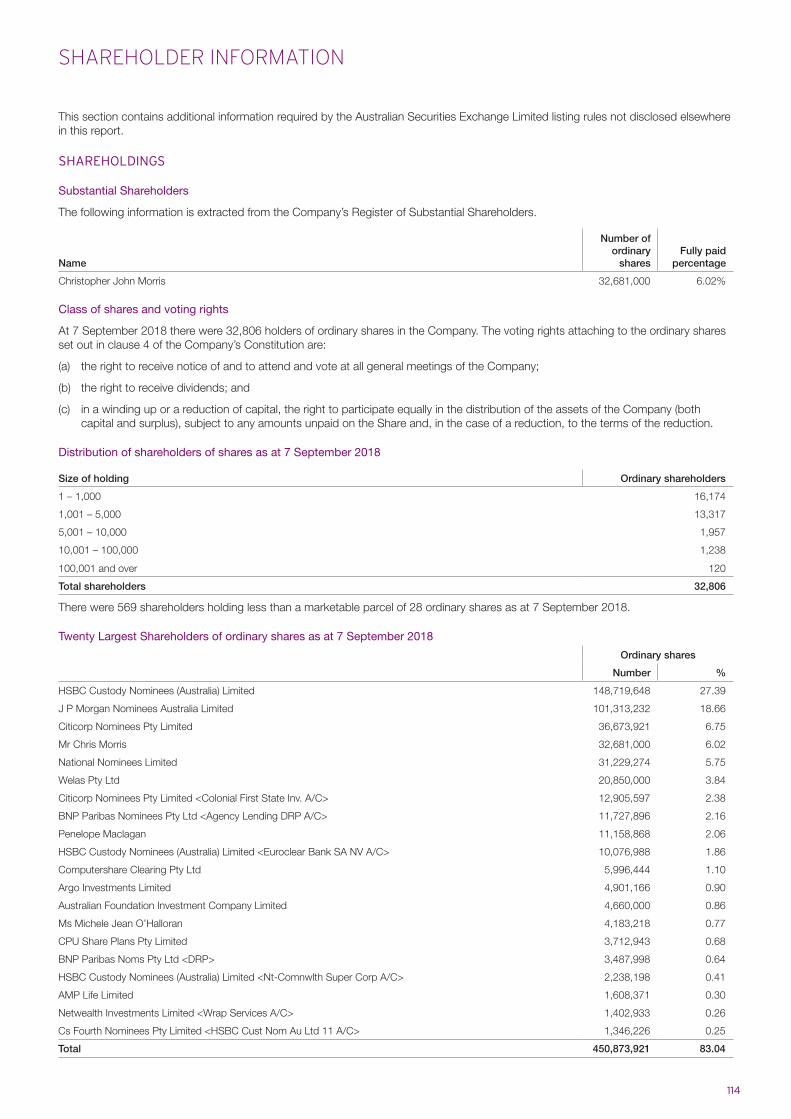
114
This section contains additional information required by the Australian Securities Exchange Limited listing rules not disclosed elsewhere in this report.
SHAREHOLDINGS
Substantial Shareholders
The following information is extracted from the Company’s Register of Substantial Shareholders.
Name
Number of ordinary
sharesFully paid
percentage
Christopher John Morris 32,681,000 6.02%
Class of shares and voting rights
At 7 September 2018 there were 32,806 holders of ordinary shares in the Company. The voting rights attaching to the ordinary shares set out in clause 4 of the Company’s Constitution are:
(a) the right to receive notice of and to attend and vote at all general meetings of the Company;
(b) the right to receive dividends; and
(c) in a winding up or a reduction of capital, the right to participate equally in the distribution of the assets of the Company (both capital and surplus), subject to any amounts unpaid on the Share and, in the case of a reduction, to the terms of the reduction.
Distribution of shareholders of shares as at 7 September 2018
Size of holding Ordinary shareholders
1 – 1,000 16,174
1,001 – 5,000 13,317
5,001 – 10,000 1,957
10,001 – 100,000 1,238
100,001 and over 120
Total shareholders 32,806
There were 569 shareholders holding less than a marketable parcel of 28 ordinary shares as at 7 September 2018.
Twenty Largest Shareholders of ordinary shares as at 7 September 2018
Ordinary shares
Number %
HSBC Custody Nominees (Australia) Limited 148,719,648 27.39
J P Morgan Nominees Australia Limited 101,313,232 18.66
Citicorp Nominees Pty Limited 36,673,921 6.75
Mr Chris Morris 32,681,000 6.02
National Nominees Limited 31,229,274 5.75
Welas Pty Ltd 20,850,000 3.84
Citicorp Nominees Pty Limited <Colonial First State Inv. A/C> 12,905,597 2.38
BNP Paribas Nominees Pty Ltd <Agency Lending DRP A/C> 11,727,896 2.16
Penelope Maclagan 11,158,868 2.06
HSBC Custody Nominees (Australia) Limited <Euroclear Bank SA NV A/C> 10,076,988 1.86
Computershare Clearing Pty Ltd 5,996,444 1.10
Argo Investments Limited 4,901,166 0.90
Australian Foundation Investment Company Limited 4,660,000 0.86
Ms Michele Jean O’Halloran 4,183,218 0.77
CPU Share Plans Pty Limited 3,712,943 0.68
BNP Paribas Noms Pty Ltd <DRP> 3,487,998 0.64
HSBC Custody Nominees (Australia) Limited <Nt-Comnwlth Super Corp A/C> 2,238,198 0.41
AMP Life Limited 1,608,371 0.30
Netwealth Investments Limited <Wrap Services A/C> 1,402,933 0.26
Cs Fourth Nominees Pty Limited <HSBC Cust Nom Au Ltd 11 A/C> 1,346,226 0.25
Total 450,873,921 83.04
SHAREHOLDER INFORMATION
115 Computershare Annual Report 2018
CORPORATE DIRECTORY
DIRECTORSSimon David Jones(Chairman)Stuart James Irving(President and Chief Executive Officer)Abigail Pip ClelandTiffany Lee FullerLisa Mary GayPenelope Jane MaclaganChristopher John Morris Arthur Leslie OwenJoseph Mark Velli
COMPANY SECRETARYDominic Matthew Horsley
REGISTERED OFFICEYarra Falls452 Johnston StreetAbbotsford VIC 3067
Telephone +61 3 9415 5000Facsimile +61 3 9476 2500
STOCK EXCHANGE LISTINGAustralian Securities Exchange
SOLICITORSMinter EllisonLevel 23, Rialto Towers525 Collins StreetMelbourne VIC 3000
AUDITORSPricewaterhouseCoopers2 Riverside QuaySouthbank VIC 3006
SHARE REGISTRYComputershare Investor Services Pty LimitedYarra Falls452 Johnston StreetAbbotsford VIC 3067
PO BOX 103Abbotsford VIC 3067
Telephone 1300 307 613(within Australia) + 61 3 9415 4222Facsimile + 61 3 9473 2500
INVESTOR RELATIONSYarra Falls452 Johnston StreetAbbotsford VIC 3067
Telephone +61 3 9415 5000Facsimile +61 3 9476 2500
Websitewww.computershare.com

116
NOTES

117 Computershare Annual Report 2018
NOTES

COMPUTERSHAREHEAD OFFICE
Computershare LimitedABN 71 005 485 825
Yarra Falls452 Johnston StreetAbbotsford Victoria 3067Australia
Telephone: +61 3 9415 5000Facsimile: +61 3 9473 2500
The Annual Reportis available online atwww.computershare.com
Co
mp
utersh
are | AN
NU
AL
RE
PO
RT
| 2018