Embed Size (px)
Citation preview

COMPUTERSHARE
LIMITED Strategic growth and cyclical recovery
2018 Half Year Results Presentation
Mark Davis
Chief Financial Officer
14 February 2018
Stuart Irving
Chief Executive Officer and President
Executive summary
1H18 results – strategic growth and cyclical recovery
2
1H18 Management EBITDA grew strongly (+20%) driven by good progress in US Mortgage Services, increased event activity in Stakeholder
Relationship Management and Class Actions, cyclical recovery in Corporate Actions and margin income and disciplined cost management
Statutory EPS
Actual
31.43 cents2
Free cash flow
Actual
$166.3m3
Dividend per share
Interim
AU 19 cents
Management results1
Revenue
$1,111.9m 10.8%
14.4%
EBITDA
$289.6m
EPS
30.22 cents
10.9%
20.0%
11.8%
17.4%
1 Management results are expressed in constant currency throughout this presentation unless otherwise stated. Constant currency equals 1H18 results translated to USD at 1H17 average exchange rates. All figures in this presentation are presented in USD millions, unless otherwise stated 2 Reconciliation of statutory to management results can be found on slide 23 3 References in this presentation to free cash flow and net debt exclude SLS advances/non-recourse debt as appropriate

FY18 guidance – further upgraded
3
Outlook improved
› At last November’s AGM, we said that we expected FY18 Management EPS in constant currency to increase by around +10% on FY17
› Given the strong 1H18 result and the outlook for 2H18, we now expect Management EPS for FY18 in constant currency to increase by around +12.5% on FY17 with a positive bias
Assumptions
› This outlook assumes that equity markets remain at current levels and interest rate markets remain in line with current market expectations
› This outlook also assumes the Karvy sale completes in 2H18, share buy-back continues (negligible contribution to Management EPS in FY18) and a small positive impact in FY18 from US tax reform
› Consistent with FY17 guidance approach, this guidance assumes that FY17 average exchange rates are used to translate the FY18 earnings to USD (refer to slide 58)
› For comparative purposes, the base FY17 Management EPS is 54.41 cents

Good progress on executing strategic priorities
4
Growth Profitability Capital Management
› Mortgage Services EBITDA up 72.1%, now making a significant contribution to Group EBITDA (19.4%)
› US Mortgage Services continuing to drive scale, UPB up 19.1% since 30 June, revenue and margin expansion
› US subservicing UPB up 107.1% with improved market penetration
› UK Mortgage Services intensive integration workload underway and on track
› Share Plans increased earnings potential: $131.9bn of assets under administration, over half in the money
› Corporate Actions revenue strengthening from FY17 cyclical lows, up 31.0%
› Margin income accelerating, up $11.8m
› $17.3bn of 1H18 average client balances – yield up to 0.92%
› Stakeholder Relationship Management EBITDA up $16.5m, driven by a large event for a US Fund
› Stage 1 and 2 cost out program delivering benefits. Stage 3 details in April
› Group EBITDA margin up 190bps to 26.0% with further expansion in US Registry margin
› Strong free cash flow $166.3m, up 10.9%
› Net debt to EBITDA continues to reduce - 1.58x – after self funding growth engines, strategic investments, share buy-back and increased dividends
› AUD49.7m of CPU shares acquired at an average price of $14.74
› Buy-back expected to continue in March
› AU 19 cents interim dividend +11.8%
› Karvy sale now expected to complete in 2H18 ~ $90m sale proceeds
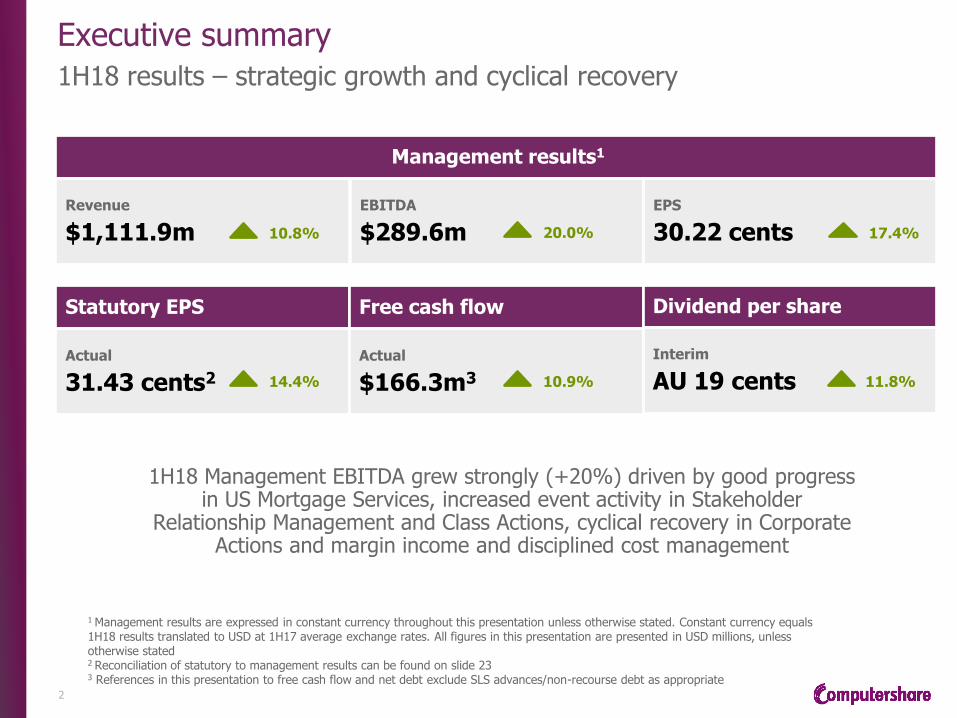
Growth: Mortgage Services
US › Growth engine performing well with UPB up 19.1% to $71.1bn – on track to achieve scale and
target returns = 20% PBT margins and 12-14% post tax free cash flow return on average invested capital
› Pleasing growth in high margin capital light subservicing, UPB +107.1%, improved network of servicing agreements
› Continued growth in high margin non base servicing fee revenues driving improved returns
› Stable regulatory environment with ongoing structural trend towards servicing quality
UK › UKAR - Intensive integration underway, contract generating expected returns
› Move to a single platform progressing well, releases significant synergy savings in FY19 and FY20
› Three challenger banks now live and generating new servicing volumes, implementation fees assisted revenue
5
1H18 @ CC 1H17 Actual CC Variance
US Mortgage Services revenue $143.4 $123.7 +15.9%
UK Mortgage Services revenue $119.0 $117.3 +1.4%
Total Mortgage Services revenue $262.4 $241.0 +8.9%
Total Mortgage Services EBITDA $56.1 $32.6 +72.1%
Performing well, now contributes 19.4% of Group EBITDA
Note: US MSR amortisation in the period is $16.0m ($9.8m pcp)

Growth: Employee Share Plans
6
1H18 @ CC 1H17 Actual CC Variance
Transactional revenue $38.7 $36.8 +5.2%
Fee revenue $50.5 $53.0 -4.7%
Margin income $6.9 $8.0 -13.8%
Other revenue $8.7 $8.5 +2.4%
Total Employee Share Plans revenue $104.7 $106.3 -1.5%
Employee Share Plans EBITDA $22.3 $24.7 -9.7%
EBITDA margin % 21.3% 23.2% -190bps
EBITDA ex margin income $15.4 $16.7 -7.8%
EBITDA margin ex margin income % 15.7% 17.0% -130bps
› Good growth in transactional revenue +5.2% driven by stronger equity markets - solid result given Brexit inflated pcp
› EBITDA affected by lower margin income (lower deposit returns) and less high margin implementation fees
› Continued growth in Asia leveraging off market leading design and data analytics capability
› Investing For the Future program - improvements in customer facing and business development technologies - new platform successfully deployed in China, step change improvement in usage metrics
› Increase in assets under administration to $131.9bn - enhanced earnings potential
Investing for sustained growth with enhanced earnings potential
Profitability: Register Maintenance and Corporate Actions
7
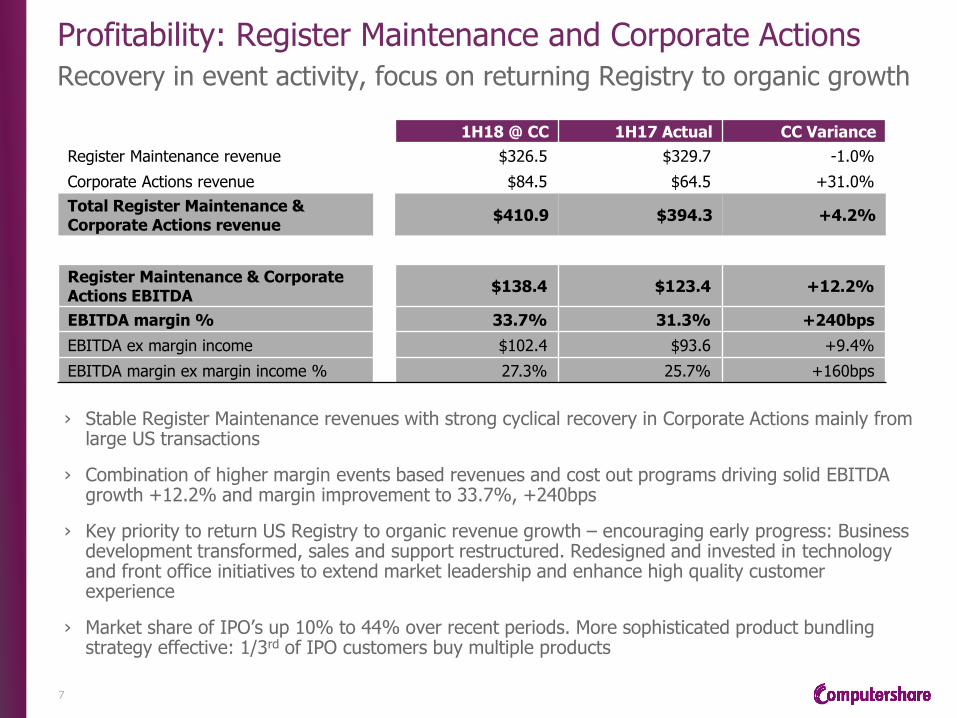
1H18 @ CC 1H17 Actual CC Variance
Register Maintenance revenue $326.5 $329.7 -1.0%
Corporate Actions revenue $84.5 $64.5 +31.0%
Total Register Maintenance & Corporate Actions revenue
$410.9 $394.3 +4.2%
Register Maintenance & Corporate Actions EBITDA
$138.4 $123.4 +12.2%
EBITDA margin % 33.7% 31.3% +240bps
EBITDA ex margin income $102.4 $93.6 +9.4%
EBITDA margin ex margin income % 27.3% 25.7% +160bps
› Stable Register Maintenance revenues with strong cyclical recovery in Corporate Actions mainly from large US transactions
› Combination of higher margin events based revenues and cost out programs driving solid EBITDA growth +12.2% and margin improvement to 33.7%, +240bps
› Key priority to return US Registry to organic revenue growth – encouraging early progress: Business development transformed, sales and support restructured. Redesigned and invested in technology and front office initiatives to extend market leadership and enhance high quality customer experience
› Market share of IPO’s up 10% to 44% over recent periods. More sophisticated product bundling strategy effective: 1/3rd of IPO customers buy multiple products
Recovery in event activity, focus on returning Registry to organic growth

Profitability: Structural cost out programs progressing well
8
› Stage 1 and 2 cost out programs progressing well and delivering substantial benefits across multiple business streams. Total benefits, staging and timetable affirmed
› Stage 1 Louisville project personnel centralisation almost complete with property rationalisation to follow
› Stage 2 underway. Spans of control savings delivered with ongoing progress across other initiatives
› Further cost savings anticipated with Stage 3 expected to be detailed in April 18
Activity Total cost savings estimates $m
Benefit realisation (cumulative)
FY17A FY18E FY19E FY20E
Stage 1 Louisville
25 - 30 28% 50% 70% 100%
Stage 2 Spans of control
~15 45% 95% 100%
Operational efficiencies 10 - 15 - 20% 80% 100%
Procurement 5 - 8 - 50% 100%
Process automation ~20 - 20% 80% 100%
Other 10 - 12 - 50% 100%
Total cost savings estimate 85 - 100 13.7 43.4 78.1 92.8
• Estimates of total cash costs to deliver Stage 1 remain unchanged at $80-85m, circa 65% opex. Estimates of stage 2 total cash costs also remain unchanged at $30-40m, circa 75% opex. All opex costs to be expensed and included in Management adjustments
• Expected FY18 post tax management adjustment of $15-20m for Stages 1 and 2 (FY17 post tax management adjustments $20.5m)
Stage 1 and 2 benefits and timetable affirmed. Stage 3 details in April

Capital management: enhancing shareholder returns
9
Cash generative business model › Strong free cash flow* $166.3m, up 10.9%. Recurring revenues, high margins and low maintenance
capex, funds strategic investments and shareholder returns Strategic investments › Self funding growth engines with investments in US MSR purchases $67.4m, up 9.4% › Invested a further GBP7.5m in SETL with Board representation Acquisitions › Ongoing exploration of acquisition opportunities to leverage core strengths and alignment with CPU
core competencies and financially accretive Share buy-back › AUD49.7m of CPU shares acquired at an average price of $14.74 › Buy-back expected to continue in March post payment of the FY18 interim dividend Dividend › Interim dividend of AU 19 cents unfranked, +11.8% on pcp. At the conclusion of the share buy-
back, CPU intends to distribute the full value of available franking credits Leverage ratio › Net debt to EBITDA ratio down to 1.58x from 1.60x › The sale of Computershare’s interest in Karvy now expected to close in 2H18, ~$90m expected sale
proceeds
* Excluding SLS advances

1H18 Management Results summary
10
1 Excluding SLS advances/non-recourse SLS Advance debt as applicable 2 1H18 Management tax rate 26.3% (1H17 23.5%) largely reflects growing share of US earnings
1H18 @ CC 1H17 Actual CC Variance 1H18 Actual
Total Revenue $1,111.9 $1,003.2 +10.8% $1,127.8
Margin income $78.4 $66.6 +17.7% $79.6
Operating Costs $823.0 $762.3 +8.0% $835.1
EBITDA $289.6 $241.3 +20.0% $293.4
EBITDA Margin % 26.0% 24.1% +190bps 26.0%
Depreciation $16.1 $17.4 -7.5% $16.4
Amortisation $16.2 $9.9 +63.6% $16.2
EBIT $257.3 $214.0 +20.2% $260.8
Interest Expense $28.3 $26.4 +7.2% $28.6
Profit Before Tax $229.0 $187.6 +22.1% $232.2
Income Tax Expense2 $60.1 $44.2 +36.0% $61.1
NPAT $164.6 $140.6 +17.1% $166.8
Management EPS (cents) 30.22 25.74 +17.4% 30.62
1H18 Actual 1H17 Actual Variance
Net operating cash flow1 $199.3 $173.3 +15.0%
Free cash flow1 $166.3 $150.0 +10.9%
Net debt to EBITDA ratio1 1.58 times 1.91 times -0.33 times
Strong earnings growth and free cash flow
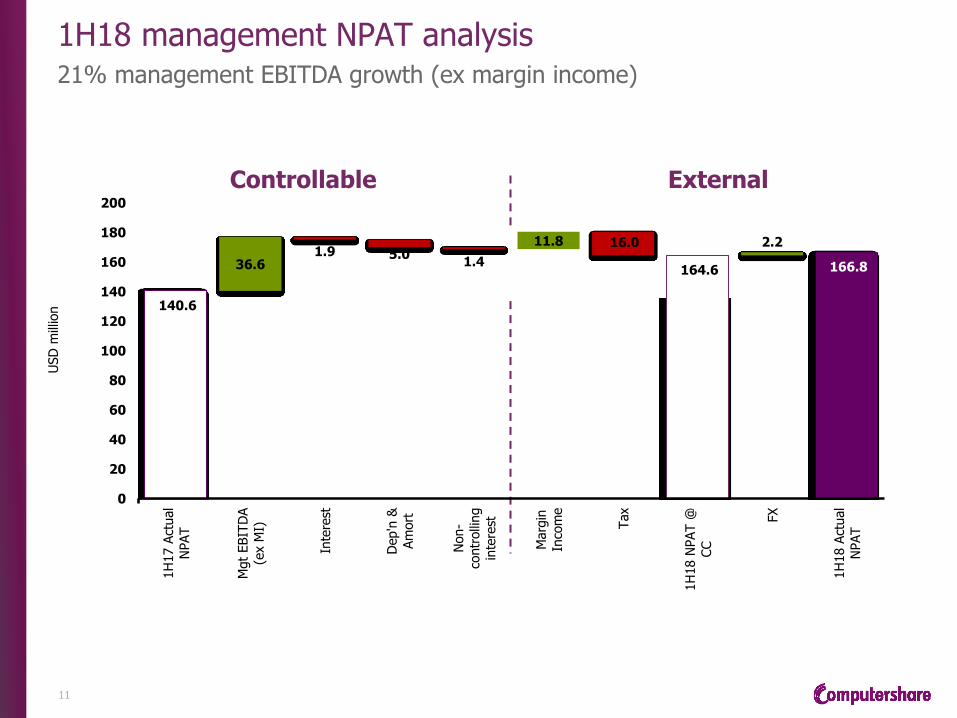
1H18 management NPAT analysis 21% management EBITDA growth (ex margin income)
11
Controllable External
USD
mill
ion 140.6
164.6 166.8 36.6
11.8 2.2 1.9 5.0
1.4
16.0
0
20
40
60
80
100
120
140
160
180
200
1H
17 A
ctual
NPAT
Mgt
EBIT
DA
(ex M
I)
Inte
rest
Dep'n
&
Am
ort
Non-
contr
olli
ng
inte
rest
Marg
in
Inco
me
Tax
1H
18 N
PAT @
CC
FX
1H
18 A
ctual
NPAT

Management revenue breakdown
12
Business stream 1H18 @ CC 1H17 Actual CC Variance 1H18 Actual
Business Services $435.3 $375.7 +15.9% $441.4
Register Maintenance $326.5 $329.7 -1.0% $330.8
Corporate Actions $84.5 $64.5 +31.0% $85.2
Employee Share Plans $104.7 $106.3 -1.5% $106.5
Communication Services $88.8 $88.8 +0.0% $91.4
Stakeholder Relationship Mgt $57.3 $21.4 +167.8% $57.5
Technology & Other Revenue $14.7 $16.8 -12.5% $15.0
Total Management Revenue $1,111.9 $1,003.2 +10.8% $1,127.8
› Business Services growing strongly – improved revenue from Class Actions +78.6% coupled with growth in US Mortgage Services revenue
› Corporate Actions revenue improved from FY17 cyclical lows. Primarily driven by the US, with growth in Asia and Canada
› Employee Share Plans revenues ex margin income stable, -0.4%. Transactional revenues increased above Brexit inflated pcp, +5.2%. Margin income yield affected by UK deposit rates
› Stakeholder Relationship Management revenues increased by $35.9m primarily driven by a large proxy solicitation event for a US Fund
› Margin income increased by $11.8m to $78.4m: Registry Maintenance $2.3m, Corporate Actions $3.9m, Business Services $6.7m partly offset by Employee Share Plans ($1.1m)
Strategic growth, cyclical recovery and increased event activity

Management revenue bridge
Multiple growth contributors
13
USD
mill
ion
1,003.2
1,111.9
1,127.8
5.5
0.4 2.1
52.9
16.1
36.0
0.0 11.8
15.9
940
960
980
1,000
1,020
1,040
1,060
1,080
1,100
1,120
1,140
1H
17 A
ctual M
gt
Revenue
Busi
ness
Serv
ices
Regis
ter
Main
tenance
Corp
ora
te
Act
ions
Sta
kehold
er
Rela
tionsh
ip M
gt
Em
plo
yee
Share
Pla
ns
Com
munic
ation
Serv
ices
Tech
& O
ther
Revenue
Marg
in I
nco
me
1H
18 T
ota
l M
gt
Revenue @
CC FX
1H
18 A
ctual M
gt
Revenue
USA +$12.5m
HK +$2.6m
- Growth in Class Actions +$33.9m
- Growth in US Mortgage Services +$15.8m
- Other Business Services +$3.2m
Large event for US Fund
Impacted by AUD, GBP and CAD
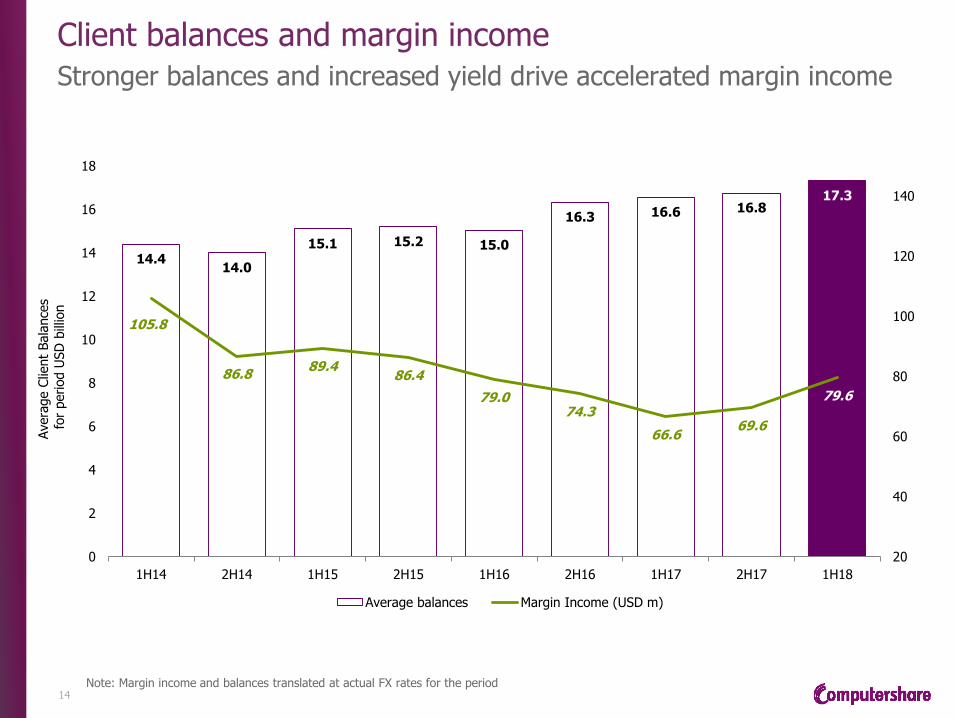
Client balances and margin income
14
Avera
ge C
lient
Bala
nce
s f
or
period U
SD
bill
ion
Stronger balances and increased yield drive accelerated margin income
Note: Margin income and balances translated at actual FX rates for the period
14.4 14.0
15.1 15.2 15.0
16.3 16.6 16.8 17.3
105.8
86.8 89.4
86.4
79.0 74.3
66.6 69.6
79.6
20
40
60
80
100
120
140
0
2
4
6
8
10
12
14
16
18
1H14 2H14 1H15 2H15 1H16 2H16 1H17 2H17 1H18
Average balances Margin Income (USD m)

EBITDA and margins by business stream
15
Business Stream
1H18 @ CC 1H17 Actual
CC Variance 1H18 EBITDA Margin in CC
%
1H17 Actual EBITDA Margin
%
Business Services $111.5 $76.4 +45.9% 25.6% 20.3%
Register Maintenance & Corporate Actions $138.4 $123.4 +12.2% 33.7% 31.3%
Employee Share Plans $22.3 $24.7 -9.7% 21.3% 23.2%
Communication Services $13.8 $13.3 +3.8% 15.6% 14.9%
Stakeholder Relationship Mgt $13.6 ($2.9) +569.0% 23.7% -13.5%
Technology & Other ($10.0) $6.4 -256.3% n/a n/a
Total Management EBITDA $289.6 $241.3 +20.0% 26.0% 24.1%
› Strong growth in Business Services EBITDA, with Mortgage Services contributing $56.1m, +72.1% and enhanced profitability and margins in Class Actions
› US Register Maintenance margins continue to improve underpinned by productivity gains. Corporate Actions profitability increased on higher revenues
› Strong improvement in Stakeholder Relationship Management EBITDA driven by a large event for a US Fund – largest proxy solicitation campaign in US mutual fund history, covering ~ 35m investor accounts
› Employee Share Plans EBITDA affected by lower margin income and less high margin implementation fees. Investing For the Future program to drive sustained growth - improvements in customer facing and business development technologies - new platform successfully deployed in China, step change improvement in usage metrics
20% EBITDA growth with margin expansion to 26%

EBITDA and margin income by business stream
16
Business Stream
1H18 EBITDA
@ CC
1H18 MI
@ CC
1H18 EBITDA ex MI @
CC
1H17 EBITDA
1H17 MI
1H17 EBITDA
ex MI
CC Variance
Business Services $111.5 $35.5 $76.0 $76.4 $28.8 $47.6 +59.7%
Register Maintenance & Corporate Actions
$138.4 $36.0 $102.4 $123.4 $29.8 $93.6 +9.4%
Employee Share Plans $22.3 $6.9 $15.4 $24.7 $8.0 $16.7 -7.8%
Communication Services $13.8 $0.0 $13.8 $13.3 $0.0 $13.3 +3.8%
Stakeholder Relationship Mgt $13.6 $0.0 $13.6 ($2.9) $0.0 ($2.9) +569.0%
Technology & Other ($10.0) $0.0 ($10.0) $6.4 $0.0 $6.4 n/a
Total Group $289.6 $78.4 $211.3 $241.3 $66.6 $174.7 +21.0%
› Margin income accelerated to $78.4m ($66.6m pcp) with broad based increases across all US and Canadian exposed balances
› Business Services margin income grew by $6.7m with increases in US Mortgage Services and Class Actions
› Register Maintenance & Corporate Actions margin income increased on improved revenues with margins increasing to 27.3% (25.7% pcp) excluding margin income
Robust underlying performance continues - EBITDA ex MI +21%
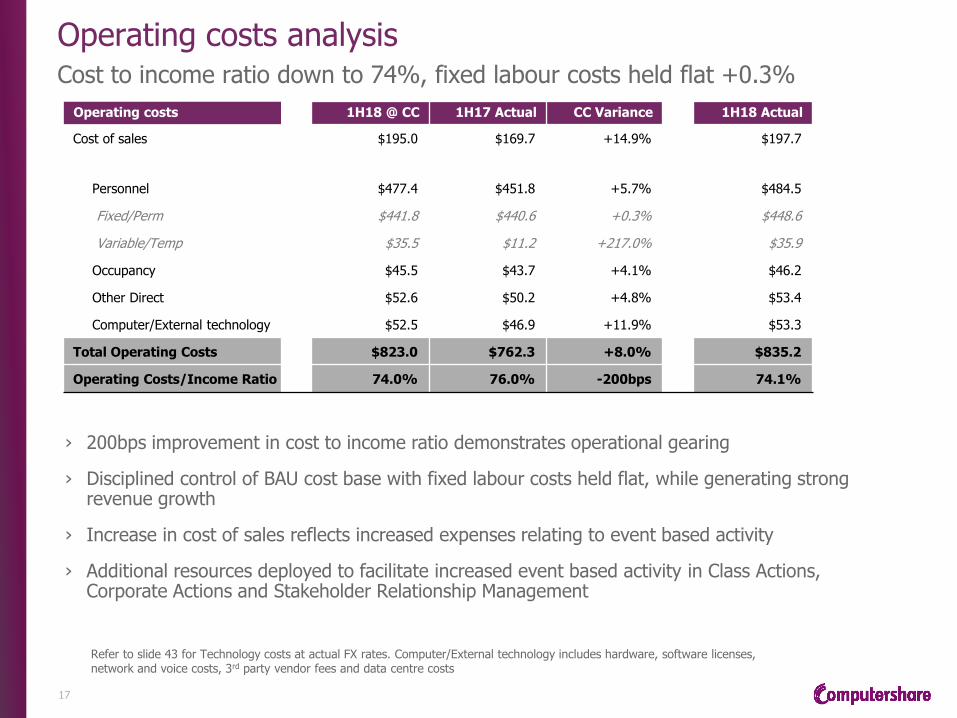
Operating costs analysis
17
Refer to slide 43 for Technology costs at actual FX rates. Computer/External technology includes hardware, software licenses, network and voice costs, 3rd party vendor fees and data centre costs
Cost to income ratio down to 74%, fixed labour costs held flat +0.3%
Operating costs 1H18 @ CC 1H17 Actual CC Variance 1H18 Actual
Cost of sales $195.0 $169.7 +14.9% $197.7
Personnel $477.4 $451.8 +5.7% $484.5
Fixed/Perm $441.8 $440.6 +0.3% $448.6
Variable/Temp $35.5 $11.2 +217.0% $35.9
Occupancy $45.5 $43.7 +4.1% $46.2
Other Direct $52.6 $50.2 +4.8% $53.4
Computer/External technology $52.5 $46.9 +11.9% $53.3
Total Operating Costs $823.0 $762.3 +8.0% $835.2
Operating Costs/Income Ratio 74.0% 76.0% -200bps 74.1%
› 200bps improvement in cost to income ratio demonstrates operational gearing
› Disciplined control of BAU cost base with fixed labour costs held flat, while generating strong revenue growth
› Increase in cost of sales reflects increased expenses relating to event based activity
› Additional resources deployed to facilitate increased event based activity in Class Actions, Corporate Actions and Stakeholder Relationship Management
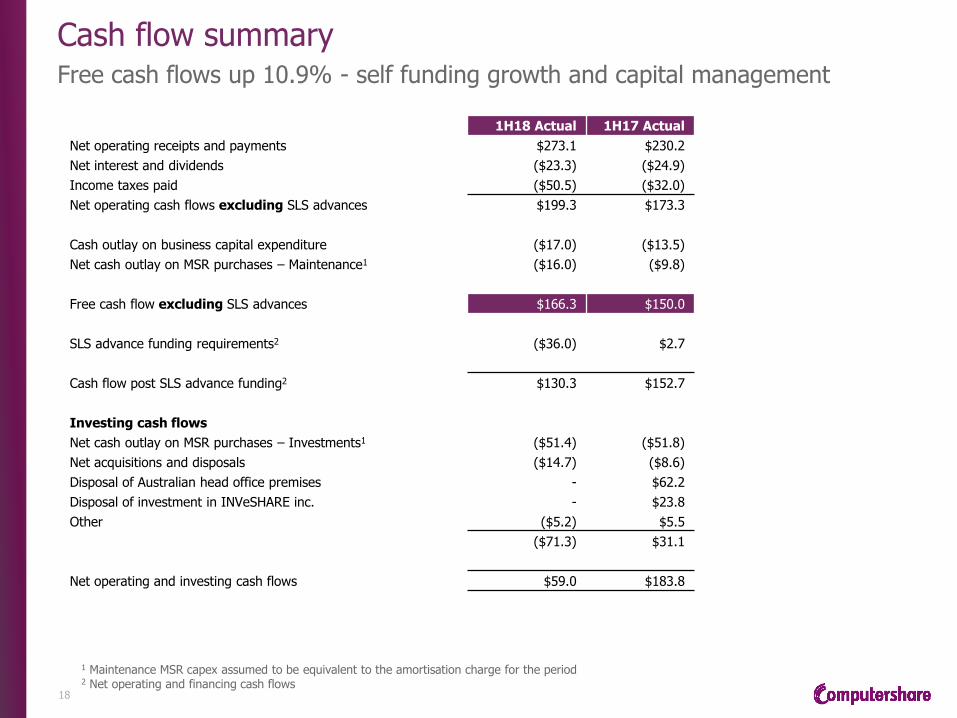
Cash flow summary Free cash flows up 10.9% - self funding growth and capital management
18
1H18 Actual 1H17 Actual
Net operating receipts and payments $273.1 $230.2
Net interest and dividends ($23.3) ($24.9)
Income taxes paid ($50.5) ($32.0)
Net operating cash flows excluding SLS advances $199.3 $173.3
Cash outlay on business capital expenditure ($17.0) ($13.5)
Net cash outlay on MSR purchases – Maintenance1 ($16.0) ($9.8)
Free cash flow excluding SLS advances $166.3 $150.0
SLS advance funding requirements2 ($36.0) $2.7
Cash flow post SLS advance funding2 $130.3 $152.7
Investing cash flows
Net cash outlay on MSR purchases – Investments1 ($51.4) ($51.8)
Net acquisitions and disposals ($14.7) ($8.6)
Disposal of Australian head office premises - $62.2
Disposal of investment in INVeSHARE inc. - $23.8
Other ($5.2) $5.5
($71.3) $31.1
Net operating and investing cash flows $59.0 $183.8
1 Maintenance MSR capex assumed to be equivalent to the amortisation charge for the period 2 Net operating and financing cash flows

Balance sheet Leverage ratio down to 1.58x after funding strategic investments, share buy-back and dividend increase
19
Dec 17 Jun 17 Variance
Current Assets $1,261.7 $1,251.7 +0.8%
Non-Current Assets $2,699.8 $2,695.3 +0.2%
Total Assets $3,961.5 $3,947.0 +0.4%
Current Liabilities $1,041.4 $753.1 +38.3%
Non-Current Liabilities $1,618.7 $1,956.9 -17.3%
Total Liabilities $2,660.0 $2,710.0 -1.8%
Total Equity $1,301.5 $1,237.0 +5.2%
Net debt1 $936.9 $867.7 +8.0%
Net debt to EBITDA ratio1 1.58 times 1.60 times -0.02 times
ROE2 26.4% 25.6% +80bps
ROIC3 16.2% 15.5% +70bps
1 Excluding non-recourse SLS Advance debt 2 Return on equity (ROE) = rolling 12 month Mgt NPAT/rolling 12 mth avg Total Equity 3 Return on invested capital (ROIC) = (Mgt EBITDA less depreciation & amortisation less income tax expense)/(net debt + total equity). Net debt includes cash classified as an asset held for sale in Dec17 and Jun17

Market issues
US tax reform, Brexit and Blockchain
20
US Tax Reform - earnings impacts
› For the full year FY18, the US Federal corporate tax rate for Computershare is expected to be around 28% compared to 35% in FY17. This will fall to 21% in FY19. In FY18, Computershare also expects to continue to benefit from certain US tax deductions that will either reduce or cease to be available from 1 July 2018.
› Given the above, and commenting specifically on US Tax Reform, for FY18 Computershare expects the US Federal tax reforms to contribute an additional $6.0m benefit to the full year Management net profit after tax. Approximately, $2.5m of this has been recorded in 1H18.
› The Group’s statutory income tax expense reduced in 1H18 due to a one-off income tax benefit of $42.4m from restating the US deferred tax balances based on the lower US Federal corporate tax rates enacted under US Tax Reform. This one-time benefit has been excluded from the Company’s management earnings.
› For FY18 we now expect that the management effective tax rate for the Group will be slightly lower than in FY17 (29.2%).
› In FY19, a number of factors are relevant including the introduction of new taxes (eg. BEAT and GILTI) and the reduction or cessation of certain US tax deductions. We continue to examine the implications, which may outweigh the benefits of the lower corporate tax rate, and the options to minimise the impact of the new rules.
Brexit
› We continue to closely monitor Brexit developments and where appropriate, we have prepared plans to deal with potential impacts. We already have established capabilities in the EU which provide a range of options that we may implement once the UK’s transitional arrangements and longer term relationship with the EU become clearer.
Blockchain
› In all of the markets in which we operate, including Australia, where it is proposed that blockchain technology will replace the current CHESS technology infrastructure, we remain firmly of the view that the registrar function will continue to be a sustainable and integral component of the market infrastructure. With a view to exploring a broader range of commercial opportunities that blockchain may enable, we have increased our equity stake in SETL to 11.3% with Board representation.
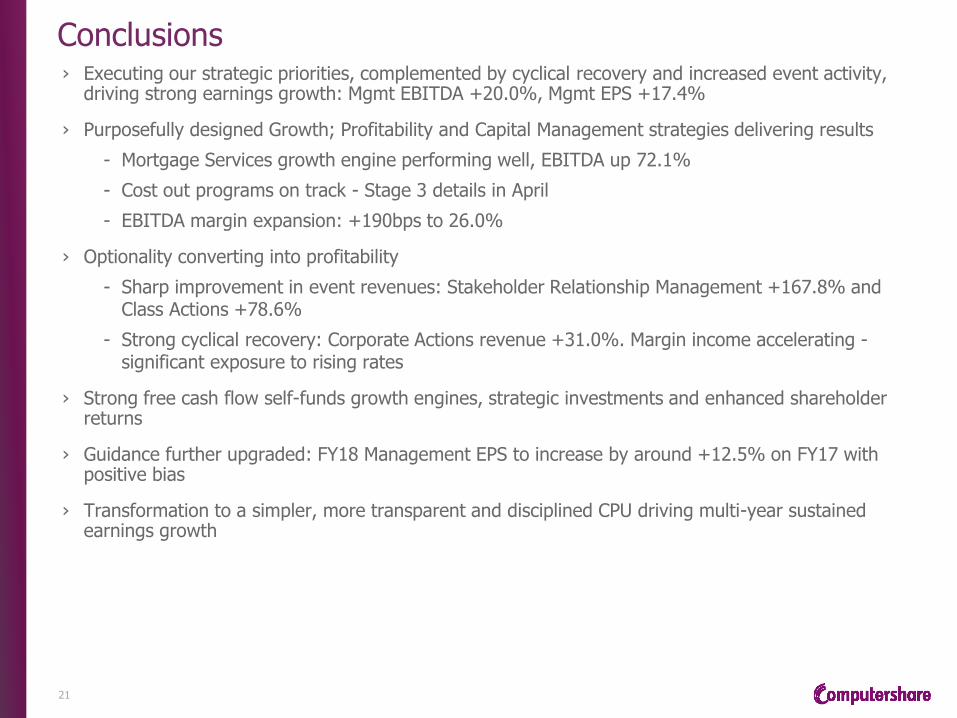
Conclusions
21
› Executing our strategic priorities, complemented by cyclical recovery and increased event activity, driving strong earnings growth: Mgmt EBITDA +20.0%, Mgmt EPS +17.4%
› Purposefully designed Growth; Profitability and Capital Management strategies delivering results
- Mortgage Services growth engine performing well, EBITDA up 72.1%
- Cost out programs on track - Stage 3 details in April
- EBITDA margin expansion: +190bps to 26.0%
› Optionality converting into profitability
- Sharp improvement in event revenues: Stakeholder Relationship Management +167.8% and Class Actions +78.6%
- Strong cyclical recovery: Corporate Actions revenue +31.0%. Margin income accelerating - significant exposure to rising rates
› Strong free cash flow self-funds growth engines, strategic investments and enhanced shareholder returns
› Guidance further upgraded: FY18 Management EPS to increase by around +12.5% on FY17 with positive bias
› Transformation to a simpler, more transparent and disciplined CPU driving multi-year sustained earnings growth

APPENDICES
Statutory results
Company Overview
1H18 Computershare at a glance
Management EBITDA (ex MI)
Financial performance by half year at actual FX rates
Revenue and EBITDA by business stream at actual FX rates
Global Registry Maintenance and Employee Share Plans
Business Services revenue excluding mortgage services
Management revenue by region
Management EPS – AUD equivalent
Technology costs
CAPEX versus depreciation
Client balances
Debt facility maturity profile
Key financial ratios
Effective tax rate
Dividend history and franking
Mortgage Servicing
Exchange rates
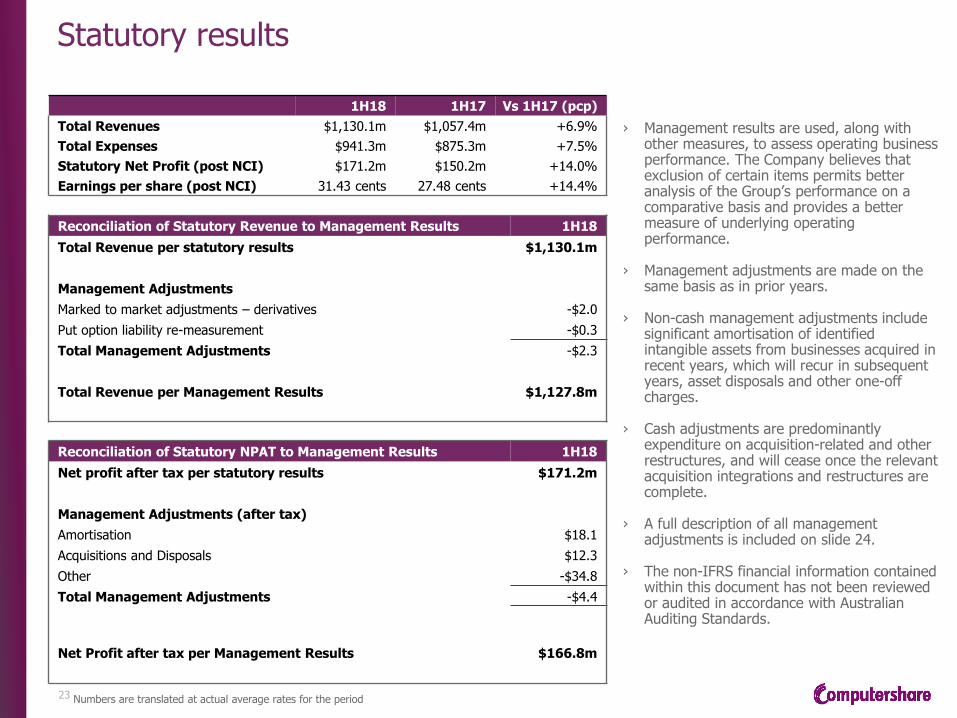
Statutory results
23
› Management results are used, along with other measures, to assess operating business performance. The Company believes that exclusion of certain items permits better analysis of the Group’s performance on a comparative basis and provides a better measure of underlying operating performance.
› Management adjustments are made on the same basis as in prior years.
› Non-cash management adjustments include significant amortisation of identified intangible assets from businesses acquired in recent years, which will recur in subsequent years, asset disposals and other one-off charges.
› Cash adjustments are predominantly expenditure on acquisition-related and other restructures, and will cease once the relevant acquisition integrations and restructures are complete.
› A full description of all management adjustments is included on slide 24.
› The non-IFRS financial information contained within this document has not been reviewed or audited in accordance with Australian Auditing Standards.
Reconciliation of Statutory Revenue to Management Results 1H18
Total Revenue per statutory results $1,130.1m
Management Adjustments
Marked to market adjustments – derivatives -$2.0
Put option liability re-measurement -$0.3
Total Management Adjustments -$2.3
Total Revenue per Management Results $1,127.8m
Reconciliation of Statutory NPAT to Management Results 1H18
Net profit after tax per statutory results $171.2m
Management Adjustments (after tax)
Amortisation $18.1
Acquisitions and Disposals $12.3
Other -$34.8
Total Management Adjustments -$4.4
Net Profit after tax per Management Results $166.8m
1H18 1H17 Vs 1H17 (pcp)
Total Revenues $1,130.1m $1,057.4m +6.9%
Total Expenses $941.3m $875.3m +7.5%
Statutory Net Profit (post NCI) $171.2m $150.2m +14.0%
Earnings per share (post NCI) 31.43 cents 27.48 cents +14.4%
Numbers are translated at actual average rates for the period

Management adjustment items
Appendix 4D Note 2
24
Management adjustment items net of tax for the half-year ended 31 December 2017 were as follows:
Amortisation
› Customer contracts and other intangible assets that are recognised on business combinations or major asset acquisitions are amortised over their useful life in the statutory results but excluded from management earnings. The amortisation of these intangibles in the half-year ended 31 December 2017 was $18.1 million. Amortisation of intangibles purchased outside of business combinations (e.g. mortgage servicing rights) is included as a charge against management earnings.
Acquisitions and disposals
› Tax expense of $5.5 million was booked when the agreement to sell the Group’s investment in the Indian venture Karvy was signed in August 2017. The associated accounting gain on disposal will only be recognised once the disposal is completed pending the required regulatory approvals.
› An expense of $4.7 million was recognised for re-measurement of contingent consideration payable to the sellers of RicePoint Administration Inc.
› Disposal related expenses of $1.9 million were incurred in relation to Karvy. Acquisition related expenses of $0.1m were incurred associated with recent acquisitions.
Other
› A restatement of deferred tax balances due to the US tax reform resulted in a tax benefit of $42.4 million (refer to Appendix 4D note 4).
› Costs of $5.8 million were incurred in relation to the major operations rationalisation underway in Louisville, USA and the Global Technology Centre in Edinburgh, UK.
› As the remaining cash flows of Computershare’s Voucher Services continue being realised, an impairment charge of $3.5 million was booked against goodwill related to this business. It is expected that the remaining goodwill of $12.1 million associated with Voucher Services will be written off over the coming periods.
› Derivatives that have not received hedge designation are marked to market at the reporting date and taken to profit and loss in the statutory results. The marked to market valuation resulted in a gain of $1.4 million.
› The put option liability re-measurement resulted in a gain of $0.3 million related to the Karvy joint venture arrangement in India.

Company overview
A leading global provider of administration services in our selected markets
25
Who we are
› Global market leader in transfer agency and share registration, employee equity plan administration, proxy solicitation and stakeholder communications
› Also specialise in mortgage servicing, corporate trust, bankruptcy, class action administration and a range of other business services
Our capabilities
› Renowned for our expertise in high integrity data management, high volume transaction processing, reconciliation, payments and stakeholder communications
› Many of the world’s leading organisations use Computershare’s services to streamline and maximise the value of relationships with their investors, employees, customers and other stakeholders
Our strategy and model
Growth drivers
› Our strategy is to be the leading provider of services in our selected markets by leveraging our core competencies to deliver outstanding client outcomes from engaged staff
› We focus on new products and services to reinforce market leadership in established markets and invest in technology and innovation to deliver productivity gains and improve cost outcomes
› We have a combination of annuity and activity based revenue streams, strong free cash flow and high ROE
› Organic: Investment in mortgage servicing and employee share plans and enterprise wide cost out program coupled with property rationalisation benefits to drive growth and improved returns
› Macro: Leverage to rising interest rates on client balances, corporate action and equity market activity
› Structural: Emerging trend of new non-share registry opportunities due to rising compliance, technology complexity and requirement for efficient processing, payments and reconciliations

1H18 Computershare at a glance
26
Management revenue @ CC Management EBITDA @ CC B
y g
eo
gra
ph
y
ANZ
6% Asia
10%
UCIA
16%
CEU
0%
USA
53%
Canada
15%
$289.6m
ANZ
12% Asia
7%
UCIA
20%
CEU
3%
USA
49%
Canada
9%
$1,111.9m
By b
usin
ess s
tre
am
Register Maintenance
29%
Corporate Actions
8% Business Services*
39%
Stakeholder Relationship
Mgt 5%
Employee Share Plans
9%
Communication Services
8%
Technology & other 2%
$1,111.9m
Register Maintenance & Corporate
Actions 45%
Business Services*
36%
Stakeholder Relationship
Mgt 4%
Employee Share Plans
7%
Communication Services
5%
Technology & other -3%
$289.6m
* Mortgage Services (included in Business Services) revenue is $262.4m and Management EBITDA $56.1m in constant currency
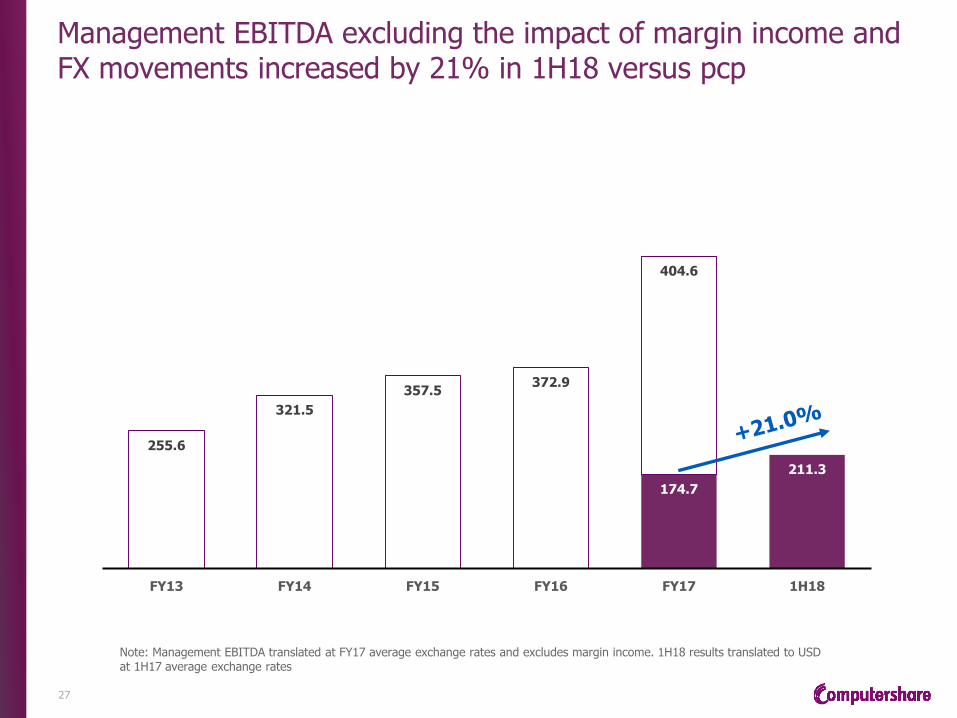
Management EBITDA excluding the impact of margin income and FX movements increased by 21% in 1H18 versus pcp
27
Note: Management EBITDA translated at FY17 average exchange rates and excludes margin income. 1H18 results translated to USD at 1H17 average exchange rates
174.7
211.3
255.6
321.5
357.5 372.9
404.6
FY13 FY14 FY15 FY16 FY17 1H18

Financial performance by half year at actual FX rates
28
1H18 2H17 1H17 2H16 1H16 2H15 1H15 2H14 1H14 2H13 1H13
Total Management Revenue
$1,127.8 $1,110.8 $1,003.2 $1,035.5 $938.7 $1,016.5 $959.5 $1,045.7 $976.9 $1,037.5 $987.6
Operating Costs $835.2 $811.6 $762.3 $744.5 $695.7 $720.7 $699.0 $771.7 $709.2 $767.6 $747.6
Management EBITDA $293.4 $299.5 $241.3 $290.3 $242.3 $294.8 $259.3 $273.6 $267.0 $268.4 $241.4
EBITDA Margin % 26.0% 27.0% 24.1% 28.0% 25.8% 29.0% 27.0% 26.2% 27.3% 25.9% 24.4%
Management Profit Before Tax
$232.2 $239.6 $187.6 $235.0 $192.2 $244.2 $211.1 $220.9 $215.0 $213.7 $184.9
Management NPAT $166.8 $156.7 $140.6 $159.7 $143.8 $172.1 $160.6 $171.5 $163.6 $155.6 $149.3
Management EPS (US cents)
30.62 28.67 25.74 29.11 25.98 30.94 28.88 30.83 29.41 27.98 26.87
Management EPS (AU cents)
39.38 38.22 34.13 39.78 35.96 39.28 32.03 33.93 31.98 27.30 25.97
Statutory EPS (US cents)
31.43 21.28 27.48 13.33 15.22 24.82 2.79 20.13 25.07 11.23 17.02
Net operating cash flows^
$199.3 $247.0 $173.3 $214.5 $158.5 $247.3 $169.4 $221.7 $223.7 $189.5 $170.5
Days Sales Outstanding
57 60 56 56 53 48 46 45 42 45 48
Net debt to EBITDA* 1.58 1.60 1.91 2.12 2.06 1.86 2.10 1.96 2.09 2.33 2.57
Notable acquisitions: Morgan Stanley GSPS (1st Jun 13), Olympia Finance Group Inc (7th Oct 13), Registrar and Transfer Company (1st May 14), Homeloan Management Limited (17th Nov 14), Valiant (1st May 15), Gilardi & Co. LLC (28th Aug 15), SyncBASE Inc (1st Feb 16), Capital Markets Cooperative LLC (29th Apr 16). Notable divestments: IML (30th Jun 13), Highland Insurance (27th Jun 14), Pepper (30th Jun 14), ConnectNow (30th Jun 15), Closed Joint Stock Company "Computershare Registrar" and Computershare LLC Russia (16th Jul 15), VEM Aktienbank AG (31st Jul 15), INVeSHARE (16th Sep 16).
^ Excluding SLS advances * Ratio excluding non-recourse SLS Advance debt

Revenue and EBITDA by business stream at actual FX rates
29
1H18 Revenue
1H18 EBITDA
1H18 Actual
EBITDA Margin
%
1H17 Revenue
1H17 EBITDA
1H17 Actual
EBITDA Margin
%
Business Services $441.4 $113.5 +25.7% $375.7 $76.4 +20.3%
Register Maintenance $330.8 $329.7
Corporate Actions $85.2 $64.5
Register Maintenance & Corporate Actions
$416.0 $139.6 +33.6% $394.2 $123.4 +31.3%
Employee Share Plans $106.5 $22.5 +21.2% $106.3 $24.7 +23.2%
Communication Services $91.4 $14.1 +15.5% $88.8 $13.3 +15.0%
Stakeholder Relationship Mgt $57.5 $13.6 +23.7% $21.4 ($2.9) -13.6%
Technology & Other $15.0 ($10.0) n/a $16.8 $6.4 n/a
Total Group $1,127.8 $293.4 +26.0% $1,003.2 $241.3 +24.1%

Global Registry Maintenance and Employee Share Plans revenue
30
Registry Maintenance @ CC Employee Share Plans @ CC 1
H1
8 @
CC
1
H1
7
Issuer paid
68%
Margin
Income 4%
Holder/Bro
ker paid
28%
Fee
48%
TX
37%
MI
7%
Oth Rev
8%
Issuer paid
69%
Margin
Income
3%
Holder/Bro
ker paid
28%
Fee
50%
TX
35%
MI
7%
Oth Rev
8%
$326.5m $104.7m
$329.7m $106.3m
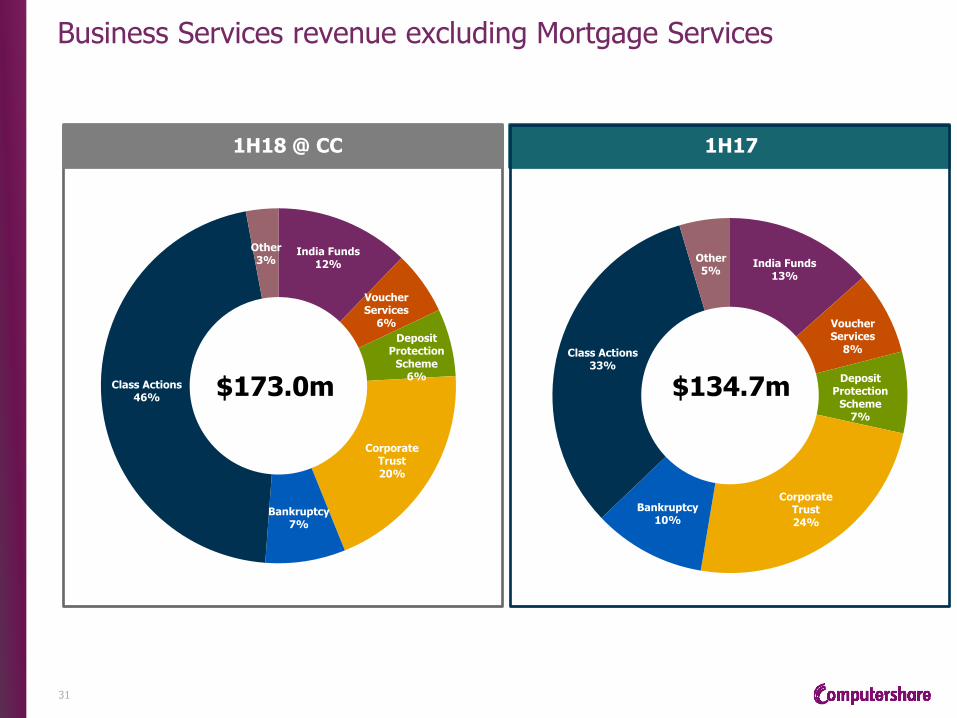
Business Services revenue excluding Mortgage Services
31
1H17
India Funds 13%
Voucher Services
8%
Deposit Protection
Scheme 7%
Corporate Trust 24%
Bankruptcy 10%
Class Actions 33%
Other 5%
1H18 @ CC
India Funds 12%
Voucher Services
6%
Deposit Protection
Scheme 6%
Corporate Trust 20%
Bankruptcy 7%
Class Actions 46%
Other 3%
$173.0m $134.7m

Management revenue and EBITDA at actual FX rates
Regional Analysis
32
138.0 117.2 133.9
66.6 69.6
75.4
225.7 227.7 230.0
34.2 59.6 40.0
456.2
538.2 544.9
82.4
98.5 103.5 1,003.2
1,110.9 1,127.8
0
200
400
600
800
1,000
1,200
1H17 2H17 1H18
Revenue by region
Australia & NZ Asia UCIA Continental Europe USA Canada
21.4 7.2 16.9
24.4
24.0 29.4
48.1
48.5
48.4
2.4 17.6
1.4
106.2
159.7 152.2
38.7
42.5 45.1
241.3
299.5 293.4
0
50
100
150
200
250
300
350
1H17 2H17 1H18
EBITDA by region
Australia & NZ Asia UCIA Continental Europe USA Canada
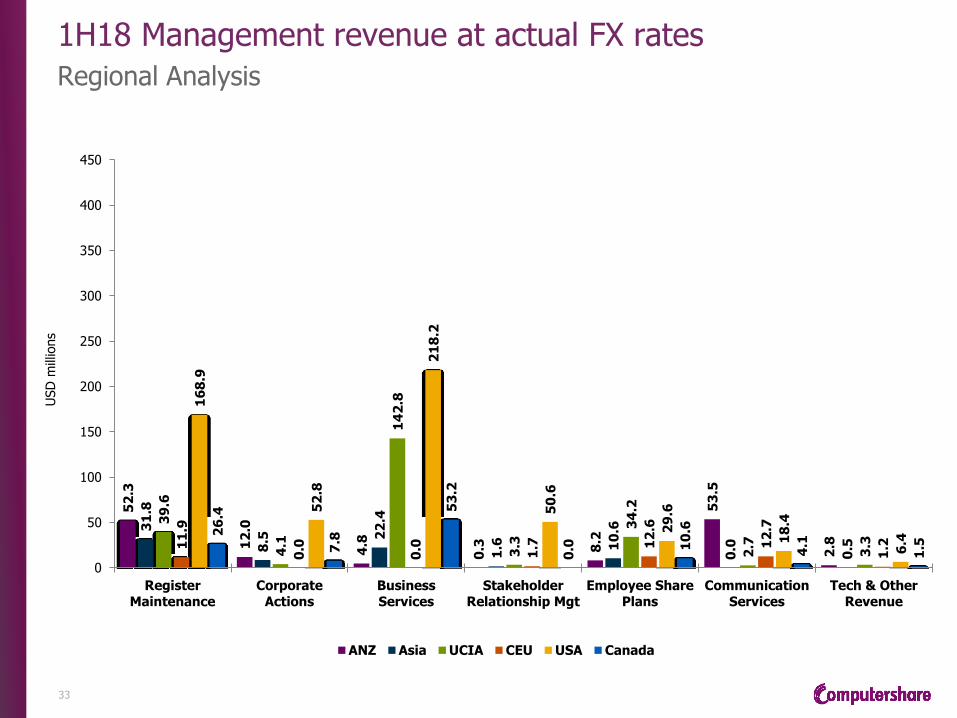
1H18 Management revenue at actual FX rates
Regional Analysis
33
52
.3
12
.0
4.8
0.3
8.2
53
.5
2.8
31
.8
8.5
22
.4
1.6
10
.6
0.0
0.5
39
.6
4.1
14
2.8
3.3
34
.2
2.7
3.3
11
.9
0.0
0.0
1.7
12
.6
12
.7
1.2
16
8.9
52
.8
21
8.2
50
.6
29
.6
18
.4
6.4
26
.4
7.8
53
.2
0.0
10
.6
4.1
1.5
0
50
100
150
200
250
300
350
400
450
Register
Maintenance
Corporate
Actions
Business
Services
Stakeholder
Relationship Mgt
Employee Share
Plans
Communication
Services
Tech & Other
Revenue
USD
mill
ions
ANZ Asia UCIA CEU USA Canada

Australia
34
Management revenue: AUD million
1H17 2H17 1H18
174.6m 150.4m 165.0m
66.3
13.0
7.8
0.8
10.2
73.0
3.5
51.1
13.6
5.3
0.5
9.8
68.2
1.9
61.9
13.5
6.2
0.4
10.5
68.9
3.6
Register
Maintenance
Corporate
Actions
Business
Services
Stakeholder
Relationship Mgt
Employee Share
Plans
Communication
Services
Tech & Other
Revenue
1H17 2H17 1H18

Hong Kong
35
Management revenue: HKD million
1H17 2H17 1H18
315.8m 315.9m 344.7m
199.9
37.6
12.0
66.3
191.7
35.8
8.2
80.3
196.1
57.4
12.5
78.6
Register Maintenance Corporate Actions Stakeholder Relationship Mgt Employee Share Plans
1H17 2H17 1H18
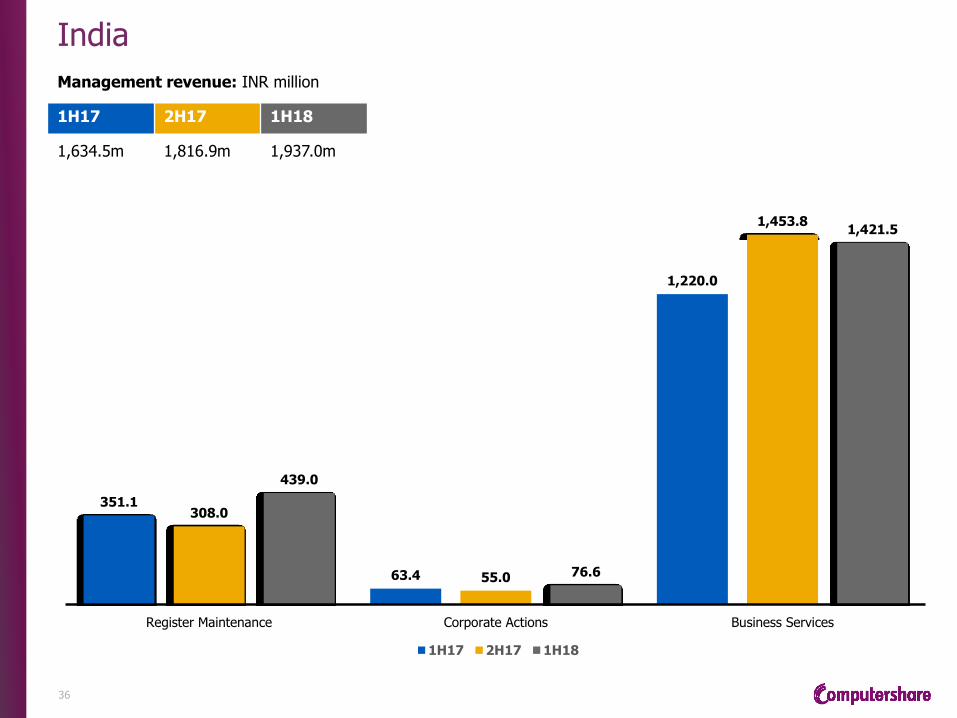
India
36
Management revenue: INR million
1H17 2H17 1H18
1,634.5m 1,816.9m 1,937.0m
351.1
63.4
1,220.0
308.0
55.0
1,453.8
439.0
76.6
1,421.5
Register Maintenance Corporate Actions Business Services
1H17 2H17 1H18
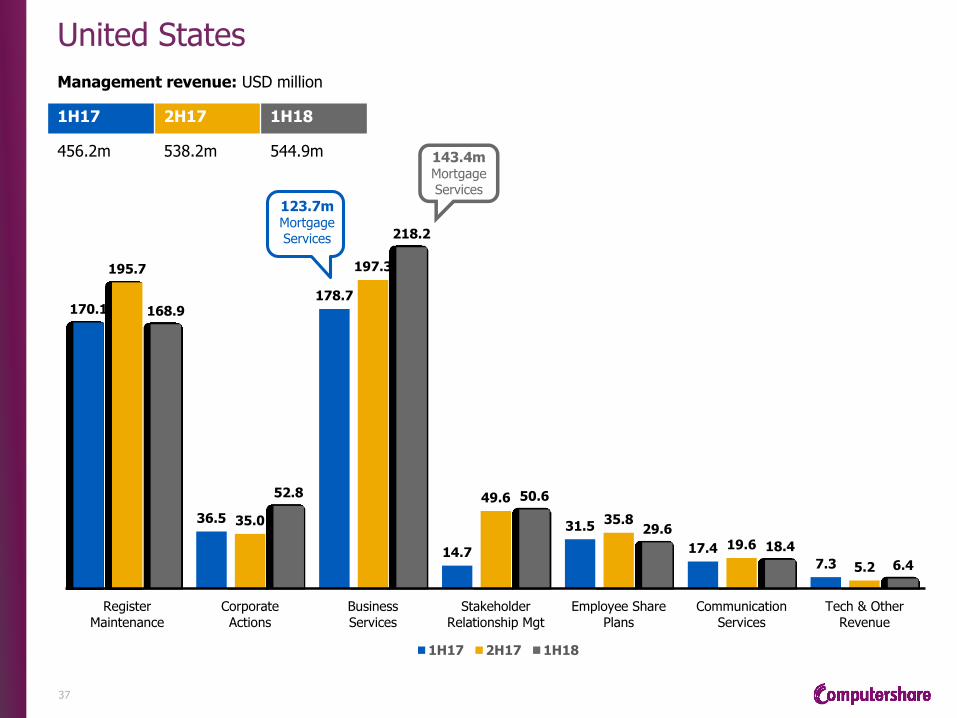
United States
37
Management revenue: USD million
1H17 2H17 1H18
456.2m 538.2m 544.9m
170.1
36.5
178.7
14.7
31.5
17.4 7.3
195.7
35.0
197.3
49.6
35.8
19.6
5.2
168.9
52.8
218.2
50.6
29.6
18.4
6.4
Register
Maintenance
Corporate
Actions
Business
Services
Stakeholder
Relationship Mgt
Employee Share
Plans
Communication
Services
Tech & Other
Revenue
1H17 2H17 1H18
123.7m Mortgage Services
143.4m Mortgage Services

Canada
38
Management revenue: CAD million
1H17 2H17 1H18
108.7m 131.6m 131.6m
36.6
8.6
43.8
15.0
3.6 1.1
44.1
8.7
59.2
13.3
4.9
1.5
33.5
9.9
67.7
13.4
5.2 1.9
Register Maintenance Corporate
Actions
Business
Services
Employee Share Plans Communication Services Tech & Other Revenue
1H17 2H17 1H18

United Kingdom and Channel Islands
39
Management revenue: GBP million
1H17 2H17 1H18
162.8m 168.5m 160.8m
19.3
2.1
108.2
1.7
26.2
2.1 3.2
20.1
1.7
113.3
2.5
28.0
2.7 0.0
20.5
1.5
108.3
2.0
24.4
2.0 2.0
Register
Maintenance
Corporate
Actions
Business
Services
Stakeholder
Relationship Mgt
Employee Share
Plans
Communication
Services
Tech & Other
Revenue
1H17 2H17 1H18
91.1m Mortgage Services
92.4m Mortgage Services

South Africa
40
Management revenue: RAND million
1H17 2H17 1H18
132.3m 124.5m 134.3m
111.4
11.8
0.4
8.7
105.9
10.0
0.3
8.2
115.3
8.9
1.2
9.0
Register Maintenance Corporate Actions Stakeholder Relationship Mgt Employee Share Plans
1H17 2H17 1H18

Germany
41
Management revenue: EUR million
1H17 2H17 1H18
14.0m 25.7m 15.4m
2.6
1.1
9.9
0.4
13.3
2.0
10.1
0.1
2.1 2.2
10.8
0.3
Register Maintenance Employee Share Plans Communication Services Tech & Other Revenue
1H17 2H17 1H18

Management EPS – AUD equivalent
42
› AUD equivalent EPS (actual) was impacted by the stronger AUD
AUD/USD average exchange rate
~
~ 53.27
65.92 71.31
75.74 72.35
39.39
1.0297
0.9139
0.8389
0.7273 0.7521
0.7774
0
20
40
60
80
100
120
FY13 FY14 FY15 FY16 FY17 1H18
Cents
per
share
Management EPS (AUD)
Note: Management EPS (AUD) for 1H17 was 34.13

Technology costs at actual FX rates
43
USD
mill
ion
Tech
costs a
s a %
of re
venue
39.6 36.2 37.3
46.8 45.0
50.6
42.2 42.0
38.2
5.3 4.3
4.8
133.9 127.4
130.8
13.3%
11.5% 11.6%
0%
2%
4%
6%
8%
10%
12%
0
20
40
60
80
100
120
140
160
1H17 2H17 1H18
Development Infrastructure Maintenance Admin Technology costs as a % of revenue
Technology costs include personnel, occupancy and other direct costs attributable to technology services

Capital expenditure versus depreciation at actual FX rates
44
Capex
USD
mill
ion
Depre
ciatio
n
USD
millio
n
6.6
14.1
10.0
1.4
0.3
0.5 5.1
5.9
3.6
1.1
0.7
0.5
14.3
21.1
14.6
0
5
10
15
20
25
30
1H17 2H17 1H18
Information Technology Communication Services Facilities Occupancy Other Depreciation

Breakdown of client balances Significant leverage to rising interest rate cycle – $11bn of average exposed balances in 1H18
45
$17.3bn Total balances
$17.3bn Total balances
$6.3bn Non-exposed balances
$6.3bn Non-exposed balances
$11.0bn Exposed balances
$11.0bn Exposed balances
$8.2bn Non-hedged balances
$8.2bn Non-hedged balances
$2.8bn Hedged balances
$2.8bn Hedged balances
$1.6bn Fixed Rate Deposits
$1.6bn Fixed Rate Deposits
$1.2bn Fixed Rate Swaps
$1.2bn Fixed Rate Swaps
$6.9bn Non-hedged
balances
$6.9bn Non-hedged
balances
$1.3bn Natural hedge
floating rate debt
$1.3bn Natural hedge
floating rate debt
Lagged impact from rate changes Immediate impact from rate changes

Client balances
Strong leverage to rising rates
46
1 Achieved yield = annualised total margin income divided by the average balance for each reporting period 2 Market yield = avg. cash rate weighted according to the client balance currency composition for each reporting period 3 Futures yield = avg. implied rates weighted according to the client balance currency composition at 31 December 17 * CPU floating rate debt will operate as a natural hedge against exposed balances
1 2 3
0.00%
0.50%
1.00%
1.50%
2.00%
2.50%
3.00%
Dec-
08
Jun-0
9
Dec-
09
Jun-1
0
Dec-
10
Jun-1
1
Dec-
11
Jun-1
2
Dec-
12
Jun-1
3
Dec-
13
Jun-1
4
Dec-
14
Jun-1
5
Dec-
15
Jun-1
6
Dec-
16
Jun-1
7
Dec-
17
Jun-1
8
Dec-
18
Jun-1
9
Dec-
19
Jun-2
0
Dec-
20
Jun-2
1
Achieved Yield Market Yield Futures Yield
Assuming an increase of 100bps
on our 1H18 exposed non-hedged
balances ($8.2bn) CPU would generate an additional $82m annualised EBITDA*
Assuming an increase of 100bps
on our 1H18 exposed non-hedged
balances ($8.2bn) CPU would generate an additional $82m annualised EBITDA*

Exposed and non-exposed balances by business
47
Business Activity 1H18 Balances (billions) Margin income (millions)
Exposed Non-exposed
Register Maintenance 2.3 0.4 12.8
Corporate Actions 2.7 1.0 23.3
Employee Share Plans 1.6 0.2 7.1
Business Services 4.4 4.7 36.3
Totals 11.0bn 6.3bn 79.6m
17.3bn
Margin income $64.3m
$15.3m
Average annualised yield 1.17%
0.49%

CAD
3%
GBP
64%
USD
33% AUD
3% CAD
13%
GBP
32%
USD
47%
Other
6%
Breakdown of exposed balances by currency
Currently most exposed to USD rates though GBP and CAD remain important
48
Average exposed balances prior to hedging
USD 11.0bn
(USD 17.3bn x 64%)
AUD
4% CAD
16%
GBP
22% USD
52%
Other
6%
USD 8.2bn
Average exposed balances un-hedged
(USD 11.0bn x 75%)
USD 2.8bn
(USD 11.0bn x 25%)
Average exposed balances hedged
Average balances during 1H18

Profile of our swap and deposit book Short duration fixed rate hedging – enhances yield without preventing the benefit of potential rate rises
49
Floating rate deposits comprise both exposed and non-exposed balances
USD
mill
ion
USD
mill
ion
0
500
1,000
1,500
2,000
2,500
Jan-18 Jan-19 Jan-20 Jan-21 Jan-22
Fixed rate deposits Swaps
0
1,000
2,000
3,000
4,000
5,000
6,000
7,000
Jan-18 Jan-19 Jan-20 Jan-21 Jan-22

235.0
40.0
70.0
220.0 220.0
152.6
237.0
446.0
295
450
0.0
100.0
200.0
300.0
400.0
500.0
600.0
700.0
FY18 FY19 FY20 FY21 FY22 FY23 FY24 FY25
USPP SLS non-recourse advance facilities drawn Syndicated debt drawn Undrawn
Debt facility maturity profile
50
Maturity Dates USD million
Debt Drawn
Committed Debt
Facilities
Bank Debt
Facility
Private Placement
Facility
SLS Advance
Facility
FY18 Feb-18 40.0 40.0 40.0 FY19 Jul-18 235.0 235.0 235.0
Dec-18 47.7 95.0 95.0 Dec-18 104.9 200.0 200.0 Feb-19 70.0 70.0 70.0
FY20 Jul-19 237.0 450.0 450.0 FY21 Jul-20 446.0 450.0 450.0 FY22 Feb-22 220.0 220.0 220.0 FY24 Feb-24 220.0 220.0 220.0
TOTAL $1,620.6 $1,980.0 $900.0 $785.0 $295.0
Note: Average debt facility maturity is 2.3 years as at 31-Dec-17
USD
mill
ion
$325m fixed $1,295.6m floating
Work underway to retire/refinance
Now repaid

Key financial ratios
51
Dec 17 USD m
Jun 17 USD m
Variance Dec 17 to Jun 17
Interest Bearing Liabilities including SLS advance debt $1,634.7 $1,573.1 +3.9%
Less Cash* ($545.2) ($510.7) +6.8%
Net Debt (including SLS advance debt) $1,089.5 $1,062.4 +2.6%
Management EBITDA $592.9 $540.8 +9.6%
Net Financial Indebtedness to EBITDA 1.84 times 1.96 times Down 0.12 times
Net Financial Indebtedness to EBITDA# 1.58 times 1.60 times Down 0.02 times
# excludes non-recourse SLS advance debt
* Includes cash that is classified as an asset held for sale
9.1
9.9 10.2
0.0
2.0
4.0
6.0
8.0
10.0
12.0
1H17 2H17 1H18
Tim
es
EBITDA Interest Coverage
1.91
1.60 1.58
2.29
1.96 1.84
0.0
0.5
1.0
1.5
2.0
2.5
1H17 2H17 1H18
Tim
es
Net Financial Indebtedness to EBITDA
Net debt (excl. non-recourse SLS Advance debt) to EBITDA ratio
Net debt to EBITDA ratio

Effective tax rate
Statutory and management (at actual FX rates)
52
Tax rate %
› The Group’s statutory effective tax rate has decreased from 16.2% in 1H17 to 7.4% in 1H18. This is primarily driven by the restatement of deferred tax balances due to US tax reform giving rise to a tax credit of $42.4 million. 1H18 tax expense also included capital gains tax for the pending disposal of Karvy Computershare Private Limited
› The Group’s management effective tax rate has increased from 23.5% in 1H17 to 26.3% in 1H18 primarily driven by an increase in US profits which is subject to a higher effective tax rate
16.2%
25.7%
7.4%
23.5%
29.2%
26.3%
0%
5%
10%
15%
20%
25%
30%
35%
1H17 FY17 1H18
Statutory Management

Dividend history and franking
53
14
15 15
16 16
17 17
19 19
20% 20% 20%
25%
100%
20%
30%
0% 0%
0%
10%
20%
30%
40%
50%
60%
70%
80%
90%
100%
0.0
2.0
4.0
6.0
8.0
10.0
12.0
14.0
16.0
18.0
20.0
1H14 2H14 1H15 2H15 1H16 2H16 1H17 2H17 1H18
Dividend (AU cents) Franking (%)
AU
cents
Franking suspended due to share buy-back

US and UK mortgage services - UPB and number of loans
54
1 CPU owns the MSR outright 2 CPU has sold part of the MSR to a third party investor 3 Servicing performed on a contractual basis
US mortgage services UPB up 19.1% ($71.1bn v $59.7bn)
Performing Non-performing
At 31 Dec 17 At 30 Jun 17 At 31 Dec 17 At 30 Jun 17
U.S
.
$15.1bn 67K Loans
$8.5bn 38K Loans
$10.9bn 89K Loans
$12.4bn 103K Loans
Fully-Owned MSRs 1
Excess strip deals $13.3bn
62K Loans
Excess strip deals $14.6bn
66K Loans
SPV deals $14.3bn
67K Loans
SPV deals $15.8bn
72K Loans
Part-Owned MSRs 2
$3.2bn
13K Loans
$1.8bn
5K Loans
$14.2bn 140K Loans
$6.6bn 88K Loans Subservicing 3
$31.6bn $24.9bn $39.5bn $34.8bn Total US UPB
£55.7bn 437K Loans
£60.0bn 485K Loans
£3.8bn 32K Loans
£4.3bn 37K Loans
Fee for Service 3 U
.K.
Mort
gage S
erv
icin
g
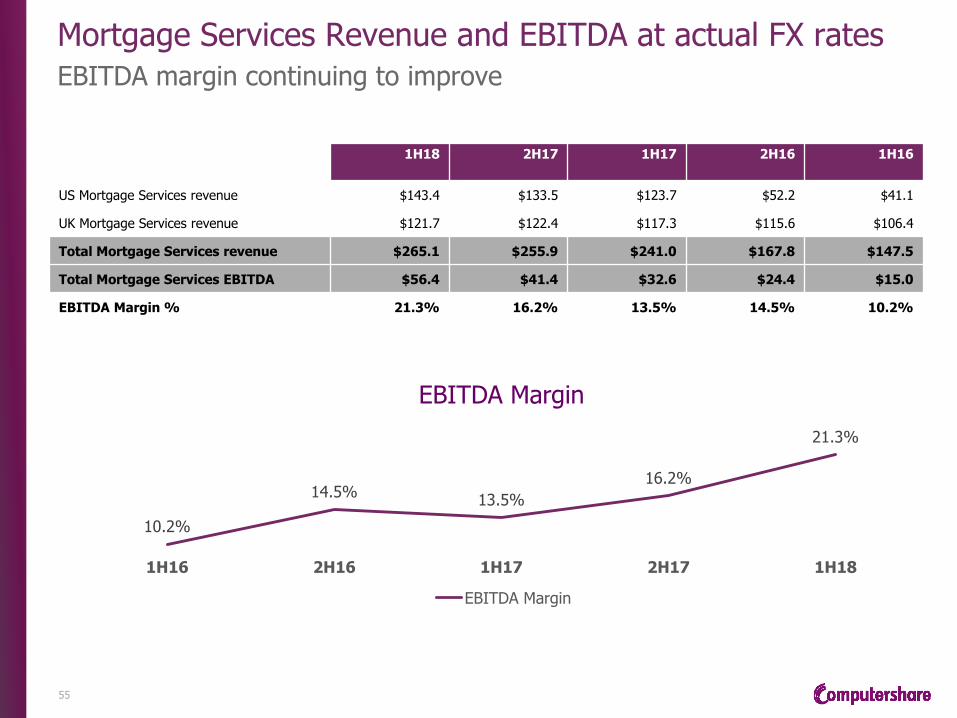
Mortgage Services Revenue and EBITDA at actual FX rates
EBITDA margin continuing to improve
55
1H18 2H17 1H17 2H16 1H16
US Mortgage Services revenue $143.4 $133.5 $123.7 $52.2 $41.1
UK Mortgage Services revenue $121.7 $122.4 $117.3 $115.6 $106.4
Total Mortgage Services revenue $265.1 $255.9 $241.0 $167.8 $147.5
Total Mortgage Services EBITDA $56.4 $41.4 $32.6 $24.4 $15.0
EBITDA Margin % 21.3% 16.2% 13.5% 14.5% 10.2%
10.2%
14.5% 13.5%
16.2%
21.3%
1H16 2H16 1H17 2H17 1H18
EBITDA Margin
EBITDA Margin

Financial Snapshot – US Mortgage Servicing
56
1H18 revenue composition
Base
servicing
fees 55%
Servicing related
fees 21%
Other
service
fees 24%
$143.4m
Dec-17 Jun-17 FY17 Annual Report reference
Net Loan Servicing Advances $59.1 $23.2 • Note 16 Loan servicing advances • Note 14 Interest bearing liabilities
Loan servicing advances SLS non-recourse lending facility
Net MSR intangible asset $268.8 $217.7 • Note 10 Intangible assets • Note 25 Mortgage servicing related liabilities
Mortgage servicing rights Mortgage servicing related liabilities
Investment in SPVs $27.1 $29.3 • Note 20 Available-for-sale financial assets Non current equity securities
Other intangible assets1 $68.1 $69.7 • Note 10 Intangible assets Goodwill; Other
Total invested capital $423.1 $339.9 Expected to decline in 2H – excess strip sales
Net cash payments for MSR purchases
$67.4 $85.82 • Cashflow statement
Investing cash flow - Payments for purchase of controlled entities and businesses (net of cash acquired) and intangible assets
MSR amortisation $16.0 $23.93 • Note 3 Expenses Total Amortisation (net)
• Base servicing fees, $79.3m, +25.8%
• Servicing related fees $29.5m,
+8.4% • Other services fees $34.5m,
+3.4%
1 Other intangibles are largely goodwill and acquired client lists related to the CMC acquisition 2 Dec-16 (1H17) = $61.6 3 Dec-16 (1H17) = $9.8

Mortgage services key terms
57
Performing servicing: Servicing of a mortgage which is less than 30 days delinquent. Typically loans that meet the criteria of the Government Sponsored Entities e.g. “Fannie Mae”, “Freddie Mac”.
Non-performing servicing: Servicing of a mortgage that is over 30 days delinquent up to management of the foreclosure process. Typically, non-performing servicing is performed over loans that are part of a securitization arrangement. Mortgage servicing rights: Intangible assets representing an ownership right to service the mortgage for a fee for the life of the mortgage. The owner of the MSR can either service the loan itself or appoint a sub-servicer to do so. Servicing advances: The owner of the MSR is required to fund various obligations required to protect a mortgage if the borrower is unable to do so. Advances receive a priority in any liquidation and are often financed in standalone non-recourse servicing advance facilities. Part owned MSRs › An Excess Strip Sale refers to the sale of a stream of cash flows associated with the servicing fee on a performing MSR. The
seller of the servicing strip has the ability to service the mortgage.
› An SPV deal refers to the sale of the rights to the MSR and associated servicing advances into an SPV. CPU typically takes a 20% equity stake in the SPV and performs all servicing on the loans via a sub-servicing fee for service relationship.
US mortgage services – revenue definitions Base fees – Fees received for base servicing activities › Fees are generally assessed in bps for owned or structured deals, while subservicing is usually paid as a $ fee › Subservicing fees vary by loan delinquency or category
Servicing related fees – Additional fees received from servicing a loan › Loss mitigation fees e.g. for loan modifications › Ancillary Fees e.g. late fees › Margin income
Other service fees › Includes valuation, real estate disposition services, loan fulfilment services and CMC Coop Services

Exchange rates
58
› Average FX rates used to translate profit and loss to US dollars for key reporting currencies
› The USD has weakened in 1H18 against pcp against major operating currency – GBP, CAD and AUD
Currency 1H18 FY17 1H17 Var 1H USD has:
USD 1.0000 1.0000 1.0000
AUD 1.28627 1.32964 1.32591 -3.0% Weakened
HKD 7.80946 7.76304 7.75635 0.7% Strengthened
NZD 1.39691 1.40496 1.39457 0.2% Strengthened
INR 64.63232 66.62415 67.23397 -3.9% Weakened
CAD 1.27087 1.32777 1.31820 -3.6% Weakened
GBP 0.75881 0.78623 0.77617 -2.2% Weakened
EUR 0.85331 0.91855 0.90632 -5.8% Weakened
RAND 13.39206 13.73011 14.12585 -5.2% Weakened

Important notice Summary information
• This announcement contains summary information about Computershare and its activities current as at the date of this announcement.
• This announcement is for information purposes only and is not a prospectus or product disclosure statement, financial product or investment advice or a recommendation to acquire Computershare’s shares or other securities. It has been prepared without taking into account the objectives, financial situation or needs of a particular investor or a potential investor. Before making an investment decision, a prospective investor should consider the appropriateness of this information having regard to his or her own objectives, financial situation and needs and seek specialist professional advice.
Financial data
• Management results are used, along with other measures, to assess operating business performance. The company believes that exclusion of certain items permits better analysis of the Group’s performance on a comparative basis and provides a better measure of underlying operating performance.
• Management adjustments are made on the same basis as in prior years.
• The non-IFRS financial information contained within this document has not been reviewed or audited in accordance with Australian Auditing Standards.
• All amounts are in United States dollars, unless otherwise stated.
Past performance
• Computershare’s past performance, including past share price performance and financial information given in this announcement is given for illustrative purposes only and does not give an indication or guarantee of future performance.
Future performance and forward-looking statements
• This announcement may contain forward-looking statements regarding Computershare’s intent, belief or current expectations with respect to Computershare’s business and operations, market conditions, results of operations and financial condition, specific provisions and risk management practices.
• When used in this announcement, the words ‘may’, ‘will’, ‘expect’, ‘intend’, ‘plan’, ‘estimate’, ‘anticipate’, ‘believe’, ‘continue’, ‘should’, ‘could’, ‘objectives’, ‘outlook’, ‘guidance’ and similar expressions, are intended to identify forward-looking statements. Indications of, and guidance on, plans, strategies, management objectives, sales, future earnings and financial performance are also forward-looking statements.
• Forward-looking statements are provided as a general guide only and should not be relied upon as a guarantee of future performance. They involve known and unknown risks, uncertainties, contingencies, assumptions and other important factors that are outside the control of Computershare.
• Actual results, performance or achievements may differ materially from those expressed or implied in such statements and any projections and assumptions on which these statements are based. Computershare makes no representation or undertaking that it will update or revise such statements.
Disclaimer
• No representation or warranty, expressed or implied, is made as to the fairness, accuracy, completeness or correctness of the information, opinions and conclusions contained in this announcement. To the maximum extent permitted by law, none of Computershare or its related bodies corporate, or their respective directors, employees or agents, nor any other person accepts liability for any loss arising from the use of this announcement or its contents or otherwise arising in connection with it, including, without limitation, any liability from fault or negligence.
Not intended for foreign recipients
• No part of this announcement is intended for recipients outside Australia. Accordingly, recipients represent and warrant that they are able to receive this announcement without contravention of any applicable legal or regulatory restrictions in the jurisdiction in which they reside or conduct business.
59


![110698 Computershare Case study infographic v4[1] · 110698 Computershare Case study infographic v4[1].jpg Author: Toni Bailey Created Date: 20140812090936Z](https://img.pdfslide.net/doc/110x75/5fccd3b35153d101ed283957/110698-computershare-case-study-infographic-v41-110698-computershare-case-study.jpg)