Embed Size (px)
Citation preview

Computing and Mathematical SciencesLiverpool John Moores University
Robust methodologies for partition clustering
Paulo Lisboa Terence Etchells, Ian Jarman and Simon Chambers

Overview
-5000500 -350-300-250-200-150-100-50050100150
-500
-400
-300
-200
-100
0
100
200
300
24
Original data projected onto the first 3 eigenvalues of the scatter matrix in the original domain - Clusters r+:1 go:2 ms:3 c*:4 bv:5 kp:6 y.:7 kx:8
Projection onto axis 2
5
10
8
18
1
22
1125
23
20
9
19
Pro
ject
ion
onto
axi
s 3
Projection onto axis 1
Partition clustering - critique
Decomposition of the covariance matrix
Landscape mapping of cluster solutions
Validation for two synthetic data sets and metabolic sub-typing 0.65 0.7 0.75 0.8 0.85 0.9 0.95 1
2
4
6
8
10
12
14
16
18 Clustering Performance: Median Cramer V of individual Clusters Vs Invariant J value
Median Cramer V Concordance Value
Invariant
J V
alu
e
2 clusters3 clusters
4 clusters
5 clusters
6 clusters7 clusters
8 clusters
9 clusters
10 clusters11 clusters
12 clusters
13 clusters
14 clusters15 clusters.

BioinformaticsNottingham Tenovous Primary
Breast Carcinoma Series
Consecutive series of 1,944 cases of primary operable invasive breast cancer(n=1,076 with all markers present)
Patients presenting during 1986-98
Protein expression comprising
25 immunohistochemical markers related to tumour malignancyderived through high-throughput protein expression using TMA
Abd El-Rehim et al, Int J Cancer, 116, 340-350, 2005.

Partition clustering – relevance to bioinformatics
-0.6 -0.5 -0.4 -0.3 -0.2 -0.1 0 0.1 0.2-0.2
0
0.2
0.4
0.6
0.8
1
1.2Clusters r+:1 go:2 bs:3 c*:4 mv:5 kd:6
18
-300 -200 -100 0 100 200 300 400 500 600 700-800
-600
-400
-200
0
200
400
600
1
23
45
67
89
1011
12
13
14
15
1617
181920
21
22
23
2425
Original data projected onto the space of cluster means then onto 2D using scatter matrices - Clusters r+:1 go:2 ms:3 c*:4 bv:5 kp:6 y.:7
C-erbB-2
p53
PgRER
CK 5/6
BRCA1

Identify a suitable algorithm:
Model-based or model-free ?
Hierarchical, K-means, PAM ?
Return {Sa,...,Sz} solutions
Validate & interpret each solution
K-means
i. Assume #K
ii. Initialise #N ?
iii. Sort by optimality ?
iv. Select best for #K ?
v. Select #K(s) ?
vi. Single cluster or ensemble ?
Partition clustering –open issues
-300 -200 -100 0 100 200 300 400 500 600 700-800
-600
-400
-200
0
200
400
600
1
23
45
67
89
1011
12
13
14
15
1617
181920
21
22
23
2425
Original data projected onto the space of cluster means then onto 2D using scatter matrices - Clusters r+:1 go:2 ms:3 c*:4 bv:5 kp:6 y.:7
-0.6 -0.5 -0.4 -0.3 -0.2 -0.1 0 0.1 0.2-0.2
0
0.2
0.4
0.6
0.8
1
1.2Clusters r+:1 go:2 bs:3 c*:4 mv:5 kd:6
18

Scatter matrices
Separation index:Decomposition of the scatter matrix
BWT SSS
Nc
jjTjjB
Nc
j
N
iji
TjiW
N
ii
TiT
mmmmNS
mXmXS
mXmXS
j
1.
1 1
1
.
.
.
S
B
SW
1
SW
2

Invariant separation matrix and index
S
B
SW
1
SW
2
BW SSM .1
BW SStrJ .1
Separation index:Decomposition of the scatter matrix
)()..(
..~
.(.)
.(.)
~.
~
MtrAMTAtrJ
AMTAM
ASTAS
XAX

Nc
i
Ti
C aXXX
1
ˆ.
a1
a2
a3
BW SSM
.1
BW SStrJ
.1
N.B. If |ST|=0 → Project onto subspace of cohort means

UU
UUN
S
where
XX
D
X
T
X
D
X
TT
X
X
..
..
.~
21
21
21
a1
a2
a3
~
~
~
Theorem: is invariant to dimensionality reduction under Mahalanobis rotations
J
Nc
i
iTi aaXX
1
ˆˆ.~
BW SSM~
.~~ 1
1.W BJ tr S S J

~
2xx
x
~ ~
:{ }j jp x x C
~
~
:
min{ }
i
jj
x C
i x p
K-means clustering

~
2xx
x
~ ~ ~ ~
1 2 .x p x p
~ ~ ~
. . ii
x p x
Adaptive Resonance Theory (ART) clustering

Adaptive Resonance Theory (ART) clustering

Concordance measure
22
1 1
N Mij ij
iji j
O E
E
)1,1min(.
2
MNnCV
ClusterMembership
1 … M
1… O11 … O1M
N ON1 … ONM

Optimality principle
Reproducibility with
Best Separation - max(J)
Best Concordance – max(CV)
under repeated initialisations
i. N initialisations
ii. Sort by J
iii. Select top p%
iv. Calculate pairwise CV
v. Retain med(CV)
vi. Plot (J, med_CV)

-4
-3
-2
-1
0
1
2
3
-3-2
-10
12
34
56
-8
-6
-4
-2
0
2
4
X
Artificial Data Showing 10 Cluster Allocations
Y
Z
Cluster 1
Cluster 2Cluster 3
Cluster 4
Cluster 5
Cluster 6
Cluster 7
Cluster 8Cluster 9
Cluster 10
Synthetic data (10 cohorts)

0.7 0.75 0.8 0.85 0.9 0.95 19
10
11
12
13
14
15
16
17
18
19 Clustering Performance: Median Cramer V of individual Clusters Vs Invariant J value
Median Cramer V Concordance Value
Invariant J V
alu
e
5 clusters6 clusters7 clusters8 clusters9 clusters10 clustersBest 20 for 5 ClustersBest 20 for 6 ClustersBest 20 for 7 ClustersBest 20 for 8 ClustersBest 20 for 9 ClustersBest 20 for 10 Clusters
Synthetic data (10 cohorts)

Synthetic data (10 cohorts)
Mean Covariance Matrix (i,j)
x y z 11 12 13 21 22 23 31 32 33 N
C1 -0.799 -1.011 -3.336 0.336 0.044 0.074 0.044 0.371 0.210 0.074 0.210 0.582 64
C2 -0.441 -0.569 -2.331 0.428 0.060 -0.002 0.060 0.123 0.157 -0.002 0.157 0.648 42
C3 0.649 -0.344 -4.154 0.620 0.023 -0.035 0.023 0.137 0.070 -0.035 0.070 0.446 61
C4 1.077 0.072 -2.815 0.366 -0.002 0.076 -0.002 0.043 0.104 0.076 0.104 0.563 32
C5 -0.390 -0.242 0.256 0.536 0.013 0.031 0.013 0.348 -0.117 0.031 -0.117 0.689 197
C6 -1.358 -0.658 1.639 0.309 -0.060 -0.055 -0.060 0.245 -0.013 -0.055 -0.013 0.532 131
C7 1.261 0.125 0.862 0.323 0.017 0.027 0.017 0.386 -0.060 0.027 -0.060 0.403 163
C8 -0.593 3.024 -0.498 0.776 0.033 0.175 0.033 0.491 0.003 0.175 0.003 0.695 97
C9 0.251 -0.539 -0.530 0.711 -0.025 0.055 -0.025 0.352 -0.081 0.055 -0.081 0.576 106
C10 0.374 -0.267 1.973 0.390 -0.097 0.041 -0.097 0.343 -0.014 0.041 -0.014 0.322 183
C1 C2 C3 C4 C5 C6 C7 C8 C9
C2 0.7805 . C3 1.2105 1.4828 . C4 1.5054 1.1924 1.0687 . C5 2.4975 1.7636 3.0649 2.3119 . C6 3.3913 2.8294 4.476 3.8029 1.1757 . C7 3.2516 2.5575 3.7002 2.7302 1.2151 2.2233 . C8 2.9776 2.4341 3.0901 2.4774 2.025 2.6082 2.2314 . C9 2.0388 1.2969 2.4543 1.6846 0.7109 1.8176 1.2393 2.2086 .C10 3.7087 3.0487 4.4727 3.5977 1.2717 1.4141 1.233 2.5497 1.6952
Solution with 8 Clusters
Total2 4 7 1 3 5 8 6Originalcohorts
1 58 2 . 4 . . . . 64
2 28 1 . 13 . . . . 42
3 11 50 . . . . . . 61
4 1 26 . 5 . . . . 32
5 . . 109 43 13 16 15 1 197
9 2 . 23 64 . 14 3 . 106
6 . . 25 . 103 . 3 . 131
7 . . 4 4 . 134 21 . 163
10 . . 10 . 16 9 148 . 183
8 . . 1 . . . . 96 97
Total 100 79 172 133 132 173 190 97 1076

-1.5 -1 -0.5 0 0.5 1 1.5 2-2.5
-2
-1.5
-1
-0.5
0
0.5
1
1.5
2
1
2
3
4
5
6
7
8
9
10
Synthetic data – mixing structure (Sammon Map)

Synthetic data – Visualisation in data space

117
388
92
383
96
192
190
97
208
212
177
23
93
28
177
183
84
164
190
29
96
1
2
3
4
5
1
2
3
4
5
6
219
177
97
160
192
113
1
2
3
4
5
6
118
7
47
144
19
170
97
150
54
21
173
59
118
133
100
132
79
173
97
1
2
3
4
5
6
172
7
190
8
78
137
169
97
132
28
185
52
45
55
63
69
161
124
129
44
176
1
2
3
4
5
6
95
7
181
8
97
9
95
89
85
129
55
18
24
161
143
24
177
127
153
176
96
48
127
1
2
3
4
5
6
60
7
42
8
181
9
66
10
59
142
112
126
42
171
95
177
38
58
98
978
1
2
238
100
738
3
1
2
98
238
738
189
97
335
3
1
2
455
4
96
97
294
101
88
238
455
49
189
94
361
Synthetic data (10 cohorts)

Synthetic data (10 cohorts)
0.75 0.8 0.85 0.9 0.95 10.7
0.8
0.9
Cra
me
r V
of B
est c
f S
olut
ion
Median Cramer V of Solution
C ra me r V me a sure s for 5 Cl uste rs
0.75 0.8 0.85 0.9 0.95 10.7
0.8
0.9
Cra
me
r V
of B
est c
f S
olut
ion
Median Cramer V of Solution
C ra me r V me a sure s for 6 Cl uste rs
0.75 0.8 0.85 0.9 0.95 10.7
0.8
0.9
Cra
me
r V
of B
est c
f S
olut
ion
Median Cramer V of Solution
C ra me r V me a sure s for 7 Cl uste rs
0.75 0.8 0.85 0.9 0.95 10.7
0.8
0.9
Cra
me
r V
of B
est c
f S
olut
ion
Median Cramer V of Solution
C ra me r V me a sure s for 8 Cl uste rs
0.75 0.8 0.85 0.9 0.95 10.7
0.75
0.8
0.85
0.9
0.95
Cra
me
r V
of B
est c
f S
olut
ion
Median Cramer V of Solution
C ra me r V me a sure s for 9 Cl uste rs
0.75 0.8 0.85 0.9 0.95 10.7
0.75
0.8
0.85
0.9
0.95
Cra
me
r V
of B
est c
f S
olut
ion
Median Cramer V of Solution
C ra me r V me a sure s for 1 0 Cl uste rs
Max J
SeCoMax Cv

BioinformaticsNottingham Tenovous Primary
Breast Carcinoma Series
Consecutive series of 1,944 cases of primary operable invasive breast cancer(n=1,076 with all markers present)
Patients presenting during 1986-98
Protein expression comprising
25 immunohistochemical markers related to tumour malignancyderived through high-throughput protein expression using TMA
Abd El-Rehim et al, Int J Cancer, 116, 340-350, 2005.
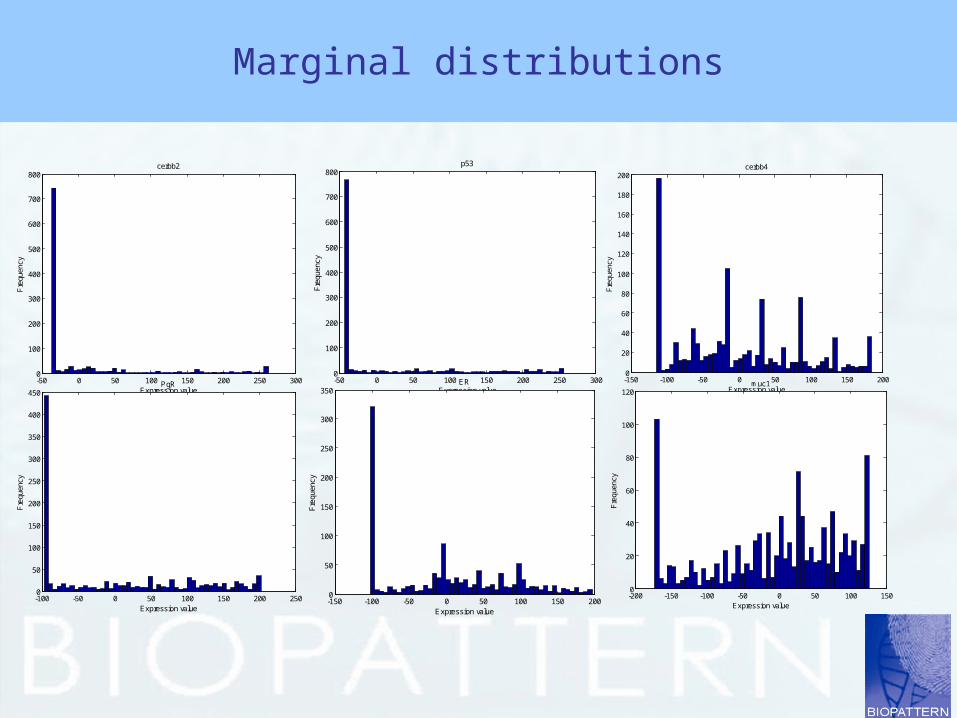
Marginal distributions
-50 0 50 100 150 200 250 3000
100
200
300
400
500
600
700
800cerbb2
Expression value
Fre
quen
cy
-50 0 50 100 150 200 250 3000
100
200
300
400
500
600
700
800p53
Expression value
Fre
quen
cy
-100 -50 0 50 100 150 200 2500
50
100
150
200
250
300
350
400
450PgR
Expression value
Fre
quen
cy
-150 -100 -50 0 50 100 150 2000
50
100
150
200
250
300
350ER
Expression value
Fre
quen
cy
-150 -100 -50 0 50 100 150 2000
20
40
60
80
100
120
140
160
180
200cerbb4
Expression value
Fre
quen
cy
-200 -150 -100 -50 0 50 100 1500
20
40
60
80
100
120muc1
Expression valueF
requ
ency

Landscape map (SeCo)
0.65 0.7 0.75 0.8 0.85 0.9 0.95 12
4
6
8
10
12
14
16
18 Clustering Performance: Median Cramer V of individual Clusters Vs Invariant J value
Median Cramer V Concordance Value
Invariant
J V
alu
e
2 clusters3 clusters
4 clusters
5 clusters
6 clusters7 clusters
8 clusters
9 clusters
10 clusters11 clusters
12 clusters
13 clusters
14 clusters15 clusters.

Stability index (Cv)
2 3 4 5 6 7 8 9 10 11 12 13 14 150
0.1
0.2
0.3
0.4
0.5
0.6
0.7
0.8
0.9
1
Blue=Median, Green=MeanBlue=Median, Green=MeanBlue=Median, Green=MeanBlue=Median, Green=MeanBlue=Median, Green=MeanBlue=Median, Green=MeanBlue=Median, Green=MeanBlue=Median, Green=MeanBlue=Median, Green=MeanBlue=Median, Green=MeanBlue=Median, Green=MeanBlue=Median, Green=MeanBlue=Median, Green=MeanBlue=Median, Green=Mean
Box Plots of the Exhaustive Cramer V values
Number of Cluster Centres
Cra
mer
V v
alue
s

ATotal
1 2 3 8 7 5 6 4 1
B 1118 4 0 1 6 1 0 12
142
521 125 0 33 0 0 0 0
179
737 0 122 4 0 2 0 2
167
60 0 29 145 0 0 0 0
174
80 2 6 0 98 0 0 0
106
20 0 6 0 0 94 1 5
106
31 0 0 0 1 0 64 42
108
4 0 0 0 0 1 0 61 32 94
Total 177 131 163 183 106 97 126 93 1076

Landscape map (SeCo)
0.65 0.7 0.75 0.8 0.85 0.9 0.95 12
4
6
8
10
12
14
16
18 Clustering Performance: Median Cramer V of individual Clusters Vs Invariant J value
Median Cramer V Concordance Value
Invariant
J V
alu
e
2 clusters3 clusters
4 clusters
5 clusters
6 clusters7 clusters
8 clusters
9 clusters
10 clusters11 clusters
12 clusters
13 clusters
14 clusters15 clusters.

Cluster hierarchy (1)
322
51
244
C3, 459
C2, 373
C1, 244
C1, 781
C2, 295
458
407
246
24
208
24
65
C3, 130
C4, 430
C3, 285
C2, 209
C1, 152
C1, 266
C2, 198
C5, 205
C4, 277
240
103
62
114
201
79116
C1, 121
C4, 230
C5, 192
C3, 215
C2, 109
C6, 209
206
44
107
22 202
169
219
91
C4, 116
C3, 205
C6, 119
C2, 234
C5, 120
C7, 186
C1, 96
160
105
112
67
93
112
26
186
127
107
C4, 94
C7, 167
C1, 142
C8, 106
C2, 106
C5, 179
C6, 174
C3, 108
159
105
94
105
172
51
94
102
44
101

Cluster hierarchy (2)
322
51
243
C3, 459
C2, 373
C1, 244
C1, 781
C2, 295
458
300
209
124
229
C1, 241
C1, 338
C2, 365
C3, 238
C4, 135
C5, 237
C2, 229
C4, 252
C3, 117
134
105
240
228
201
116
117
C1, 119
C5, 184
C2, 198
C6, 120
C4, 209
C3, 246
167
46
161
78
151
113
198
99
C2, 249
C1, 90
C5, 104
C7, 138
C4, 189
C3, 185
C6, 121
172
183
228
114
101
17
62
116
C3, 163
C4, 93
C6, 126
C7, 106
C2, 131
C1, 177
C5, 97
C8, 183
164
120
15
65
125
102
93
116
66
155
91
19
136
20

Solution A
-250 -200 -150 -100 -50 0 50 100 150 200 250
-5000
500
-500
-400
-300
-200
-100
0
100
200
300
8
9
24
1
1018
Original data projected onto the first 3 eigenvalues of the scatter matrix in the original domain - Clusters r+:1 go:2 ms:3 c*:4 bv:5 kp:6 y.:7 kx:8
19
20
23
11
Projection onto axis 1
5
4
22
Projection onto axis 2
Pro
ject
ion
onto
axi
s 3

-5000
500
-400 -300 -200 -100 0 100 200
-500
-400
-300
-200
-100
0
100
200
300
Projection onto axis 1
1923
10
8
2018
4
91511
Projection onto axis 2
22
Original data projected onto the first 3 eigenvalues of the scatter matrix in the original domain - Clusters r+:1 go:2 ms:3 c*:4 bv:5 kp:6 y.:7 kx:8
24
Pro
ject
ion
onto
axi
s 3
Solution A

-250 -200 -150 -100 -50 0 50 100 150 200 250
-500
0
500
-500
-400
-300
-200
-100
0
100
200
300
8
2418
1
1922
911
23
Original data projected onto the first 3 eigenvalues of the scatter matrix in the original domain - Clusters r+:1 go:2 ms:3 c*:4 bv:5 kp:6 y.:7 kx:8
1020
25
Projection onto axis 1
5
Projection onto axis 2
Pro
ject
ion
onto
axi
s 3
Solution B

-5000500 -350-300-250-200-150-100-50050100150
-500
-400
-300
-200
-100
0
100
200
300
24
Original data projected onto the first 3 eigenvalues of the scatter matrix in the original domain - Clusters r+:1 go:2 ms:3 c*:4 bv:5 kp:6 y.:7 kx:8
Projection onto axis 2
5
10
8
18
1
22
1125
23
20
9
19
Pro
ject
ion
onto
axi
s 3
Projection onto axis 1
Solution A

Sub-type profiling
Clusters A Clusters B
300
250
200
150
100
50
0
e-c
ad
cerb
b2
ck5/6
p53
pgr
ck14
act
in
p-c
ad1
ck19
ck7/8
ck18
gcd
fper
ar
chro
mo
synapto
egfr
p63
fhit
nbrc
a1
cerb
b4
cerb
b3
muc1
muc1
co
muc2
Cluster 1 of 8 (m4)
300
250
200
150
100
50
0
e-c
ad
cerb
b2
ck5/6
p5
3
pg
r
ck14
act
in
p-c
ad1
ck19
ck7/8
ck18
gcd
fper
ar
chro
mo
syna
pto
eg
fr
p6
3
fhit
nb
rca1
cerb
b4
cerb
b3
muc1
muc1
co
muc2
Cluster 1 of 8 (m9)
300
250
200
150
100
50
0
e-c
ad
cerb
b2
ck5
/6
p5
3
pg
r
ck1
4
act
in
p-c
ad1
ck1
9
ck7
/8
ck1
8
gcd
fper
ar
chro
mo
syna
pto
eg
fr
p6
3
fhit
nb
rca1
cerb
b4
cerb
b3
muc1
mu
c1 c
o
muc2
Cluster 5 of 8 (m4)
300
250
200
150
100
50
0
e-c
ad
cerb
b2
ck5
/6
p5
3
pg
r
ck1
4
act
in
p-c
ad
1
ck1
9
ck7
/8
ck1
8
gcd
fper
ar
chro
mo
syn
ap
to
eg
fr
p6
3
fhit
nb
rca
1
cerb
b4
cerb
b3
mu
c1
mu
c1 c
o
mu
c2
Cluster 2 of 8 (m9)Luminal N
Luminal New 2

Sub-type profiling
300
250
200
150
100
50
0
e-c
ad
cerb
b2
ck5
/6
p5
3
pg
r
ck1
4
act
in
p-c
ad
1
ck1
9
ck7
/8
ck1
8
gcd
fper
ar
chro
mo
syn
ap
to
eg
fr
p6
3
fhit
nb
rca
1
cerb
b4
cerb
b3
mu
c1
mu
c1 c
o
mu
c2
Cluster 8 of 8 (m9)
Clusters A Clusters B
300
250
200
150
100
50
0
e-c
ad
cerb
b2
ck5
/6
p5
3
pg
r
ck1
4
act
in
p-c
ad
1
ck1
9
ck7
/8
ck1
8
gcd
fper
ar
chro
mo
syn
ap
to
eg
fr
p6
3
fhit
nb
rca
1
cerb
b4
cerb
b3
mu
c1
mu
c1 c
o
mu
c2
Cluster 5 of 8 (m9)
300
250
200
150
100
50
0
e-c
ad
cerb
b2
ck5/6
p5
3
pg
r
ck14
act
in
p-c
ad1
ck19
ck7/8
ck18
gcd
fper
ar
chro
mo
syna
pto
eg
fr
p6
3
fhit
nb
rca1
cerb
b4
cerb
b3
muc1
muc1
co
muc2
Cluster 2 of 8 (m4) HER2
300
250
200
150
100
50
0
e-c
ad
cerb
b2
ck5
/6
p5
3
pg
r
ck1
4
act
in
p-c
ad
1
ck1
9
ck7
/8
ck1
8
gcd
fper
ar
chro
mo
syn
ap
to
eg
fr
p6
3
fhit
nb
rca
1
cerb
b4
cerb
b3
mu
c1
mu
c1 c
o
mu
c2
Cluster 6 of 8 (m4) Luminal A

Sub-type profiling
300
250
200
150
100
50
0
e-c
ad
cerb
b2
ck5/6
p53
pgr
ck14
act
in
p-c
ad1
ck19
ck7/8
ck18
gcd
fper
ar
chro
mo
synapto
egfr
p63
fhit
nbrc
a1
cerb
b4
cerb
b3
muc1
muc1
co
muc2
Cluster 3 of 8 (m4)
300
250
200
150
100
50
0
e-c
ad
cerb
b2
ck5/6
p53
pgr
ck14
actin
p-c
ad1
ck19
ck7/8
ck18
gcdfper
ar
ch
rom
o
synapto
egfr
p63
fhit
nbrc
a1
cerb
b4
cerb
b3
mu
c1
muc1 c
o
mu
c2
Cluster 6 of 8 (m9)
300
250
200
150
100
50
0
e-c
ad
cerb
b2
ck5/6
p5
3
pgr
ck14
actin
p-c
ad1
ck19
ck7/8
ck18
gcdfper
ar
ch
rom
o
syn
ap
to
eg
fr
p6
3
fhit
nb
rca1
cerb
b4
cerb
b3
mu
c1
muc1 c
o
mu
c2
Cluster 4 of 8 (m4)
300
250
200
150
100
50
0
e-c
ad
cerb
b2
ck5/6
p53
pgr
ck14
actin
p-c
ad1
ck19
ck7/8
ck18
gcdfper
ar
chro
mo
synapto
egfr
p63
fhit
nbrc
a1
cerb
b4
cerb
b3
muc1
muc1 c
o
muc2
Cluster 4 of 8 (m9)Basal p53 -
Basal muc1 -
Basal muc1 +
Basal p53 +
Clusters A Clusters B

ClusterA* Clusters in Green at al (2007) Crosstabulation
Count
107 0 0 0 6 0 113
45 4 9 0 4 2 64
0 65 0 0 0 0 65
0 0 58 2 0 1 61
0 0 2 80 0 0 82
0 0 0 0 138 0 138
1 8 0 0 54 2 65
0 0 0 0 0 75 75
153 77 69 82 202 80 663
5
1
2
3
4
6
7
8
Cluster A
Total
2 6 5 4 1 3
Clusters in Green at al (2007)
Total
Consistency with consensus clustering
ClusterB * Clusters in Green at al (2007) Crosstabulation
Count
67 0 7 0 0 2 76
124 7 0 0 0 0 131
1 100 0 0 0 1 102
0 0 60 0 0 0 60
0 0 0 57 43 1 101
0 0 6 24 21 0 51
0 0 0 1 0 75 76
10 46 4 0 5 1 66
202 153 77 82 69 80 663
3
8
2
5
6
4
7
1
Cluster B
Total
1 2 6 4 5 3
Clusters in Green at al (2007)
Total
CoRe 5 Clusters Solution
2 3 1 4 5
Clusters inGreen et al2007
C1 129 4 0 3 66
C2 1 138 0 7 7
C3 14 11 37 16 2
C4 0 0 65 17 0
C5 0 0 56 13 0
C6 1 8 1 37 30
NC 58 72 54 119 110

Molecular sub-typing

Molecular sub-typing
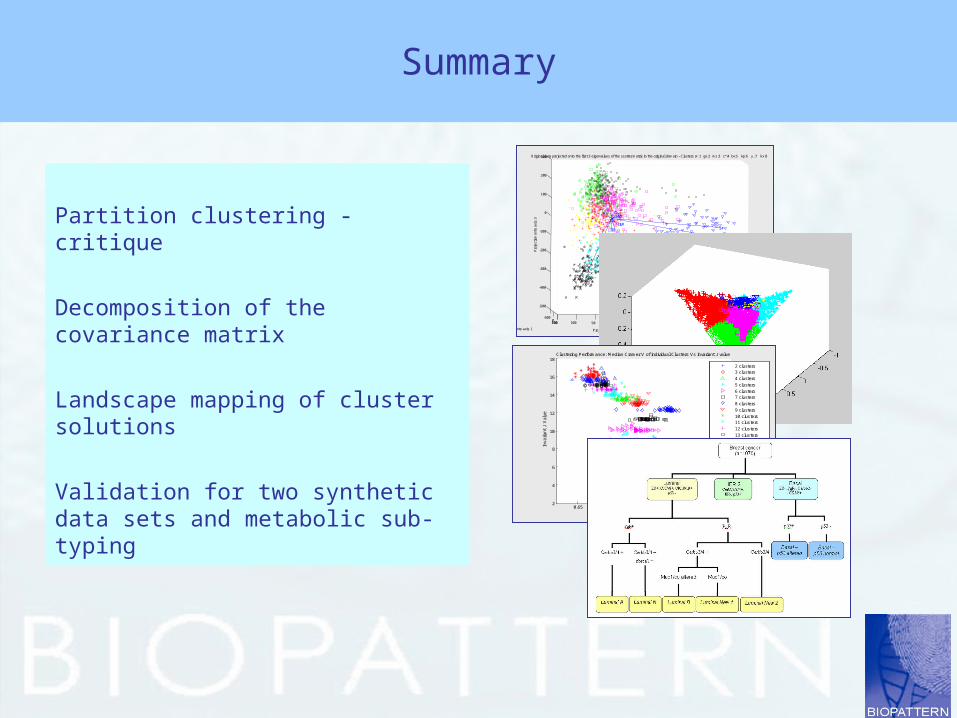
Summary
-5000500 -350-300-250-200-150-100-50050100150
-500
-400
-300
-200
-100
0
100
200
300
24
Original data projected onto the first 3 eigenvalues of the scatter matrix in the original domain - Clusters r+:1 go:2 ms:3 c*:4 bv:5 kp:6 y.:7 kx:8
Projection onto axis 2
5
10
8
18
1
22
1125
23
20
9
19
Pro
ject
ion
onto
axi
s 3
Projection onto axis 1
Partition clustering - critique
Decomposition of the covariance matrix
Landscape mapping of cluster solutions
Validation for two synthetic data sets and metabolic sub-typing 0.65 0.7 0.75 0.8 0.85 0.9 0.95 1
2
4
6
8
10
12
14
16
18 Clustering Performance: Median Cramer V of individual Clusters Vs Invariant J value
Median Cramer V Concordance Value
Invariant
J V
alu
e
2 clusters3 clusters
4 clusters
5 clusters
6 clusters7 clusters
8 clusters
9 clusters
10 clusters11 clusters
12 clusters
13 clusters
14 clusters15 clusters.

Ferrara data (n=633)
0 0.2 0.4 0.6 0.8 10
5
10
15
20
25
30 Clustering Performance: Median Cramer V of individual Clusters Vs Invariant J value
Median Cramer V Concordance Value
Invariant
J V
alu
e
2 clusters
3 clusters4 clusters
5 clusters
6 clusters
7 clusters
8 clusters9 clusters
10 clusters.
er pr PROLIND neu P53

2 3 4 5 6 7 8 9 100
0.1
0.2
0.3
0.4
0.5
0.6
0.7
0.8
0.9
1
Blue=Median, Green=MeanBlue=Median, Green=MeanBlue=Median, Green=MeanBlue=Median, Green=MeanBlue=Median, Green=MeanBlue=Median, Green=MeanBlue=Median, Green=MeanBlue=Median, Green=MeanBlue=Median, Green=Mean
Box Plots of the Exhaustive Cramer V values
Number of Cluster Centres
Cra
mer
V v
alue
s
Ferrara data (n=633)

SeCo method Total
1 2 3 4 5
Ambrogi et al [7] 1 213 13 0 4 26 256
2 0 203 0 1 3 207
3 0 1 68 0 22 91
4 0 2 0 77 0 79
Total 213 219 68 82 51 633
Ferrara data (n=633)

Ferrara data (n=633)
P5
3
ne
u
PR
OL
IND
pr
er
100
80
60
40
20
0
P5
3
ne
u
PR
OL
IND
pr
er
100
80
60
40
20
0
P5
3
ne
u
PR
OL
IND
pr
er
100
80
60
40
20
0
P5
3
ne
u
PR
OL
IND
pr
er
100
80
60
40
20
0
P53
neu
PR
OLI
NDprer
100
80
60
40
20
0
JMU Cluster 3/5
P53
neu
PR
OLI
NDprer
100
80
60
40
20
0
JMU Cluster 4/5
P53
neu
PR
OLI
NDprer
100
80
60
40
20
0
JMU Cluster 5/5
P53
neu
PR
OLI
NDprer
100
80
60
40
20
0
JMU Cluster 1/5
P53
neu
PR
OLI
NDprer
100
80
60
40
20
0
JMU Cluster 2/5

-200
-150
-100
-50
0
50
-100-50050100150
-200
-150
-100
-50
0
50
5
Original data projected onto the first 3 eigenvalues of the scatter matrix in the original domain - Clusters r+:1 go:2 ms:3 c*:4 bv:5 kp:6 y.:7 kx:8
3
Projection onto axis 2
4
Projection onto axis 1
Pro
ject
ion
onto
axi
s 3
-200-150
-100-50
050 -100
-50
0
50
100
150
-200
-150
-100
-50
0
50
Projection onto axis 2
3
5
Original data projected onto the first 3 eigenvalues of the scatter matrix in the original domain - Clusters r+:1 go:2 ms:3 c*:4 bv:5 kp:6 y.:7 kx:8
Projection onto axis 1
4
Pro
ject
ion
onto
axi
s 3
Ferrara data (n=633)

0 10 20 30 40 50 60 70 80 90 1000
20
40
60
80
100
0
10
20
30
40
50
60
70
80
90
100
Pr
P53
er
Cluster 1 (213)
Cluster 2 (219)
Cluster 3 (68)Cluster 4 (82)
Cluster 5 (51)
Ferrara data (n=633)