Embed Size (px)
Citation preview
COMSOL NEWS 1
COMSOL NEWS
www.comsol.com
THE MULTIPHYSICS SIMULATION MAGAZINE
Harnessing Tidal Power
Simulated Turbine Design Protects Sea Life
PAGE 26
2 COMSOL NEWS
INTERACT WITH THE COMSOL COMMUNITY BLOG comsol.com/blogsFORUM comsol.com/forum LinkedIn™ linkedin.com/company/comsol-inc-Facebook® facebook.com/multiphysics Twitter® twitter.com/@COMSOL_Inc
© 2021 COMSOL. COMSOL, COMSOL Multiphysics, Capture the Concept, COMSOL Desktop, COMSOL Server, COMSOL Compiler, and LiveLink are either registered trademarks or trademarks of COMSOL AB. All other trademarks are the property of their respective owners, and COMSOL AB and its subsidiaries and products are not affiliated with, endorsed by, sponsored by, or supported by those trademark owners. For a list of such trademark owners, see www.comsol.com/trademarks.
LinkedIn is a trademark of LinkedIn Corporation and its affiliates in the United States and/or other countries. Facebook is a registered trademark of Facebook, Inc. TWITTER, TWEET, RETWEET and the Twitter logo are trademarks of Twitter, Inc. or its affiliates.
We welcome your comments on COMSOL News;
contact us at [email protected].
In this issue of COMSOL News, we highlight 12 organizations benefiting from multiphysics modeling and simulation apps.
You will find several use cases from R&D teams that frontload their design workflow with modeling to create new products, productivity gains, and future growth. For example, Dolby Laboratories is combining modeling and measurement for the creation of a truly immersive audio experience with ultrathin speakers. The story on power cable simulation at NKT illustrates the value of virtual testing to lower costs and speed up development when physical testing is prohibitively expensive and time consuming. Consultancy Physixfactor used simulation to develop a water turbine design that uses the ocean’s tides for sustainable hydropower.
You will also find articles on the creation and deployment of simulation apps. COMSOL Multiphysics users are building their own simulation tools and making them available to large groups of people. Examples include automotive apps at Mahindra, audio product design at L-Acoustics, material testing apps and equipment at Plastometrex, and virtual labs for remote learning at the New Jersey Institute of Technology.
We hope you enjoy this issue of COMSOL News!
Brianne Christopher COMSOL, Inc.
Simulation Enhances Productivity, Innovation, and Green Engineering
INTRODUCTION
Simulation helps bring high-quality sound to
massive venuesPAGE 30
TABLE OF CONTENTS
SIMULATION-BASED PRODUCT DEVELOPMENT
4 Developing Ultrathin Dolby Atmos® Enabled Speaker Technology for Home Entertainment SystemsDolby Laboratories, California, USA
10 3D Modeling of Armor Losses in High-Voltage CablesNKT, Sweden
24 Investigating Intrabody Communication for Leadless Cardiac Pacemakers MicroPort CRM, France
GUEST EDITORIAL
44 Apps are Supporting the Digitization of the Testing, Inspection, and Certification IndustryBy James Dean, Plastometrex, United Kingdom
RESEARCH SPOTLIGHT
20 Greening the Heart of the City: An Urban Rooftop Drainage System Inside a Garden FenceTL-Engineering, Denmark
34 Investigating Vibroacoustic Properties in Moth Wings for Acoustic CamouflageUniversity of Bristol, United Kingdom
41 Optimizing a CVD Process for a High-Performance Tungsten MaterialForschungszentrum Jülich GmbH, Germany
DEMOCRATIZING SIMULATION
7 Bringing Lab Courses to Remote Learning Students with Simulation ApplicationsNew Jersey Institute of Technology, New Jersey, USA
14 Advancing Automotive Product Development with Simulation AppsMahindra & Mahindra Limited, India
30 The Sight of Sound: Revealing the Effects of Enclosure Design on Loudspeaker PerformanceL-Acoustics, France
DESIGN OPTIMIZATION
17 Optimizing Heat Exchanger Designs for Refrigeration and Cooling Technologythermofin GmbH, Germany
26 Producing Power, Protecting Fish with a Darrieus Water TurbinePhysixfactor, Netherlands
38 Designing Smart Solutions for Gas Flow Devices with Multiphysics SimulationRaychem RPG, India
TABLE OF CONTENTS
4 COMSOL NEWS
SIMULATION-BASED PRODUCT DEVELOPMENT
Raindrops splash against the tree leaves above. Toucans chirp in the distance. A rustling of branches fills your left ear. You look over and see a jaguar staring back at you. Although it may sound like you are on a trek in the Amazon rainforest, you are actually sitting in your living room watching a movie. 3D surround sound enhances the way you experience home entertainment by creating an optimal soundscape that completely envelops you in the story on the screen.
As the digital world and real world continue to blend, more consumers are expecting this type of memorable and lifelike audio experience from their home entertainment systems. Dolby Laboratories, a leading developer of innovative audio systems and technologies, is bringing 3D multidimensional audio technology to the home through their Dolby Atmos® audio format.
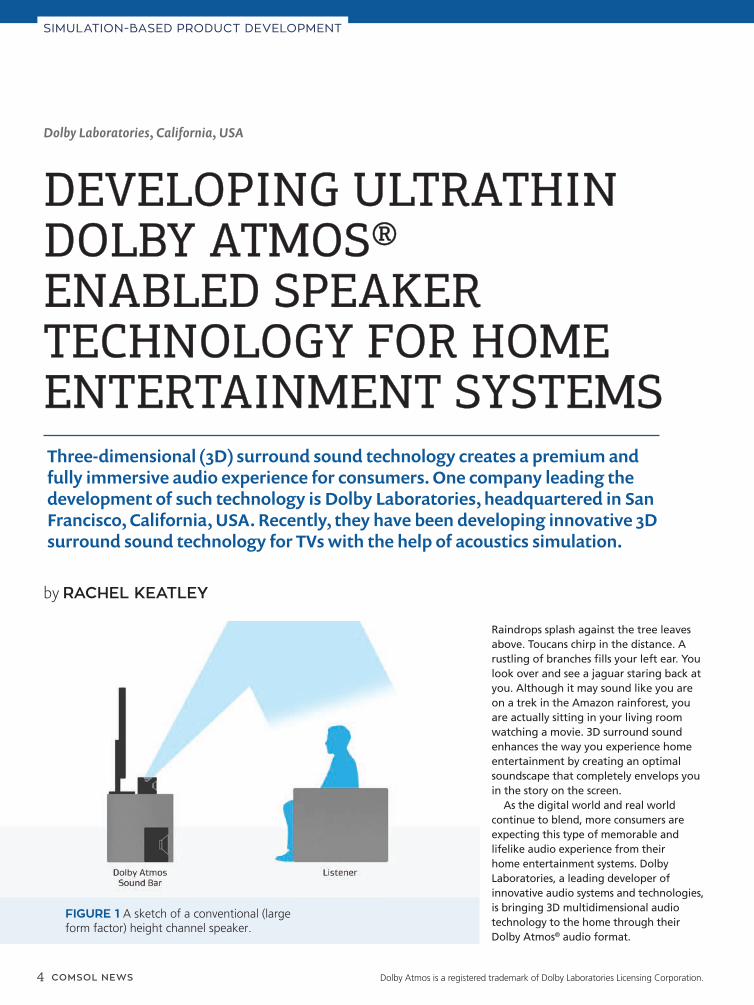
FIGURE 1 A sketch of a conventional (large form factor) height channel speaker.
Dolby Laboratories, California, USA
DEVELOPING ULTRATHIN DEVELOPING ULTRATHIN DOLBY ATMOS® DOLBY ATMOS® ENABLED SPEAKER ENABLED SPEAKER TECHNOLOGY FOR HOME TECHNOLOGY FOR HOME ENTERTAINMENT SYSTEMSENTERTAINMENT SYSTEMS
by RACHEL KEATLEY
Three-dimensional (3D) surround sound technology creates a premium and fully immersive audio experience for consumers. One company leading the development of such technology is Dolby Laboratories, headquartered in San Francisco, California, USA. Recently, they have been developing innovative 3D surround sound technology for TVs with the help of acoustics simulation.
Dolby Atmos is a registered trademark of Dolby Laboratories Licensing Corporation.
COMSOL NEWS 5
made more compact, the shape and area available for the upward-firing speaker diaphragm, which is closely coupled to a boundary surface, becomes more restricted by the thickness of the TV, resulting in a narrow height channel ceiling image.
Designing slim Dolby Atmos® enabled TV speakers that are able to provide large sweet spot coverage around the typical position of a listener is a key challenge, according to Tipparaju. "A sweet spot coverage area is the region where we can consistently perceive height channel image on the ceiling. The ceiling image is compromised when we move away from the sweet spot coverage area," said Tipparaju.
In order to design a DAES that is both thin enough to be built into modern televisions and provides large sweet spot coverage, Dolby Laboratories turned to acoustics simulation. Tipparaju believes a key benefit of simulation technology is that it allows him to evaluate the performance of new speaker designs prior to building and testing an actual physical prototype — saving valuable time and resources.
» ACOUSTICAL FEM AND BEM ANALYSESUsing acoustics modeling in the COMSOL Multiphysics® simulation software, Tipparaju explored several different upward-firing speaker design concepts for optimizing the sweet spot coverage.
"Initially, we built a speaker that was 2 inches thick," said Tipparaju. (A typical soundbar is about 5 inches, or
SIMULATION-BASED PRODUCT DEVELOPMENT
In 2014, Dolby Laboratories introduced Dolby Atmos® enabled speaker (DAES) technology for home theater systems and later expanded this technology for soundbar products. Now they are developing DAES technology for TVs to push the boundaries of what is possible for immersive home audio technology.
» THE SCIENCE OF DOLBY ATMOS® ENABLED SPEAKERS To reproduce realistic overhead sound, DAES technology employs an upward-
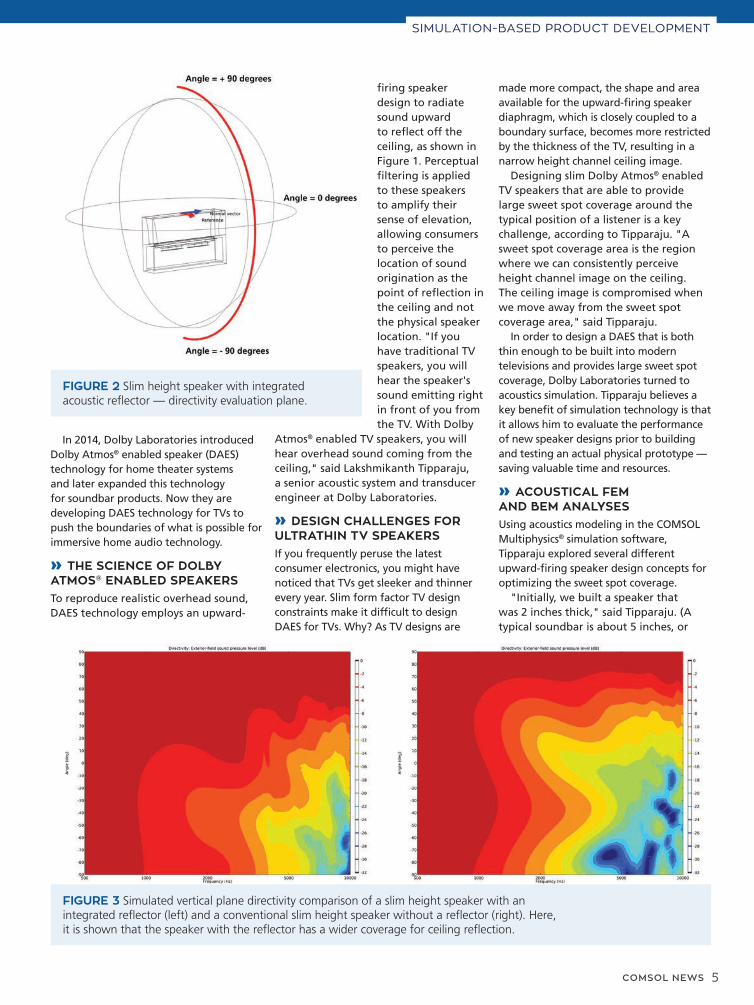
firing speaker design to radiate sound upward to reflect off the ceiling, as shown in Figure 1. Perceptual filtering is applied to these speakers to amplify their sense of elevation, allowing consumers to perceive the location of sound origination as the point of reflection in the ceiling and not the physical speaker location. "If you have traditional TV speakers, you will hear the speaker's sound emitting right in front of you from the TV. With Dolby
Atmos® enabled TV speakers, you will hear overhead sound coming from the ceiling," said Lakshmikanth Tipparaju, a senior acoustic system and transducer engineer at Dolby Laboratories.
» DESIGN CHALLENGES FOR ULTRATHIN TV SPEAKERSIf you frequently peruse the latest consumer electronics, you might have noticed that TVs get sleeker and thinner every year. Slim form factor TV design constraints make it difficult to design DAES for TVs. Why? As TV designs are
FIGURE 2 Slim height speaker with integrated acoustic reflector — directivity evaluation plane.
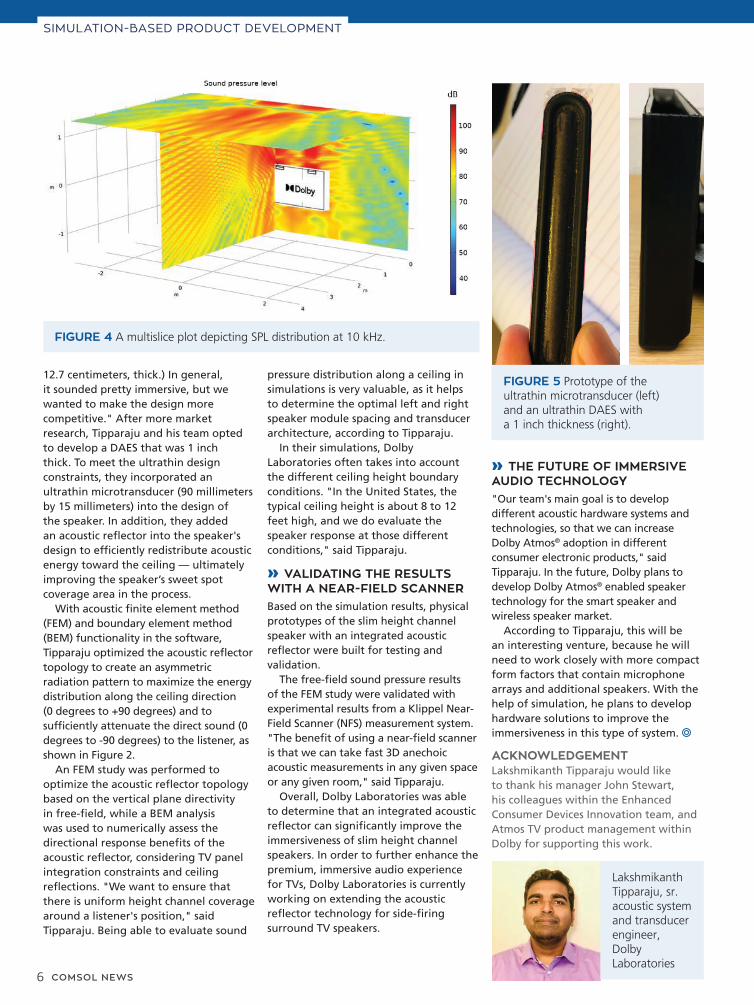
FIGURE 3 Simulated vertical plane directivity comparison of a slim height speaker with an integrated reflector (left) and a conventional slim height speaker without a reflector (right). Here, it is shown that the speaker with the reflector has a wider coverage for ceiling reflection.
6 COMSOL NEWS
» THE FUTURE OF IMMERSIVE AUDIO TECHNOLOGY"Our team's main goal is to develop different acoustic hardware systems and technologies, so that we can increase Dolby Atmos® adoption in different consumer electronic products," said Tipparaju. In the future, Dolby plans to develop Dolby Atmos® enabled speaker technology for the smart speaker and wireless speaker market.
According to Tipparaju, this will be an interesting venture, because he will need to work closely with more compact form factors that contain microphone arrays and additional speakers. With the help of simulation, he plans to develop hardware solutions to improve the immersiveness in this type of system.
Lakshmikanth Tipparaju, sr. acoustic system and transducer engineer, Dolby Laboratories
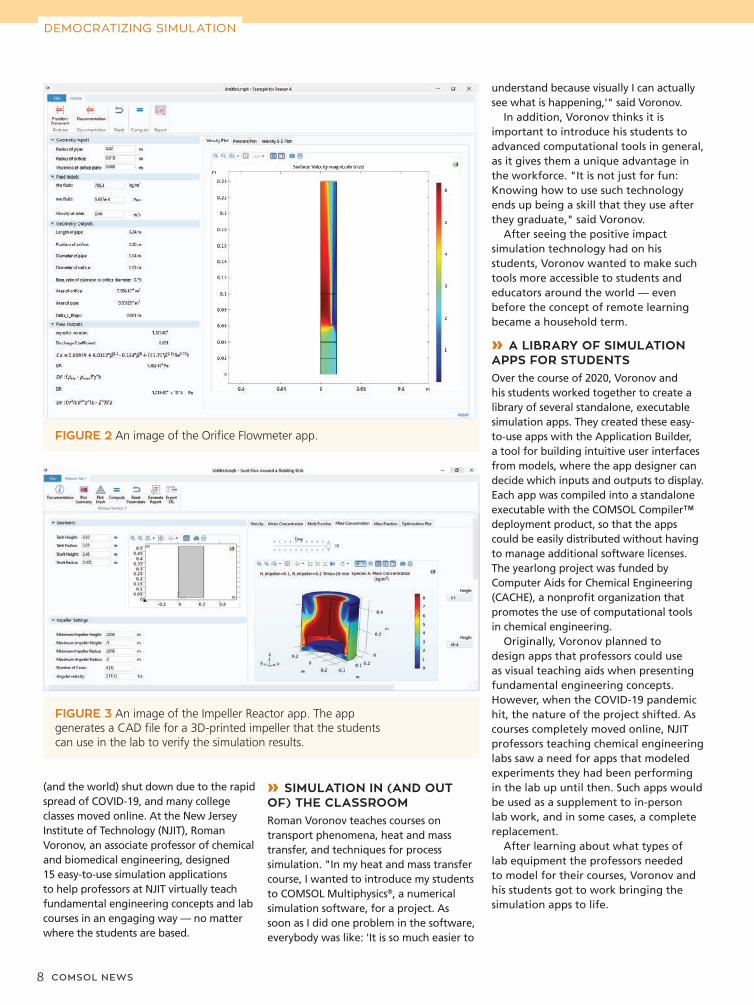
12.7 centimeters, thick.) In general, it sounded pretty immersive, but we wanted to make the design more competitive." After more market research, Tipparaju and his team opted to develop a DAES that was 1 inch thick. To meet the ultrathin design constraints, they incorporated an ultrathin microtransducer (90 millimeters by 15 millimeters) into the design of the speaker. In addition, they added an acoustic reflector into the speaker's design to efficiently redistribute acoustic energy toward the ceiling — ultimately improving the speaker’s sweet spot coverage area in the process.
With acoustic finite element method (FEM) and boundary element method (BEM) functionality in the software, Tipparaju optimized the acoustic reflector topology to create an asymmetric radiation pattern to maximize the energy distribution along the ceiling direction (0 degrees to +90 degrees) and to sufficiently attenuate the direct sound (0 degrees to -90 degrees) to the listener, as shown in Figure 2.
An FEM study was performed to optimize the acoustic reflector topology based on the vertical plane directivity in free-field, while a BEM analysis was used to numerically assess the directional response benefits of the acoustic reflector, considering TV panel integration constraints and ceiling reflections. "We want to ensure that there is uniform height channel coverage around a listener's position," said Tipparaju. Being able to evaluate sound
pressure distribution along a ceiling in simulations is very valuable, as it helps to determine the optimal left and right speaker module spacing and transducer architecture, according to Tipparaju.
In their simulations, Dolby Laboratories often takes into account the different ceiling height boundary conditions. "In the United States, the typical ceiling height is about 8 to 12 feet high, and we do evaluate the speaker response at those different conditions," said Tipparaju.
» VALIDATING THE RESULTS WITH A NEAR-FIELD SCANNERBased on the simulation results, physical prototypes of the slim height channel speaker with an integrated acoustic reflector were built for testing and validation.
The free-field sound pressure results of the FEM study were validated with experimental results from a Klippel Near-Field Scanner (NFS) measurement system. "The benefit of using a near-field scanner is that we can take fast 3D anechoic acoustic measurements in any given space or any given room," said Tipparaju.
Overall, Dolby Laboratories was able to determine that an integrated acoustic reflector can significantly improve the immersiveness of slim height channel speakers. In order to further enhance the premium, immersive audio experience for TVs, Dolby Laboratories is currently working on extending the acoustic reflector technology for side-firing surround TV speakers.
FIGURE 5 Prototype of the ultrathin microtransducer (left) and an ultrathin DAES with a 1 inch thickness (right).
ACKNOWLEDGEMENT Lakshmikanth Tipparaju would like to thank his manager John Stewart, his colleagues within the Enhanced Consumer Devices Innovation team, and Atmos TV product management within Dolby for supporting this work.
SIMULATION-BASED PRODUCT DEVELOPMENT
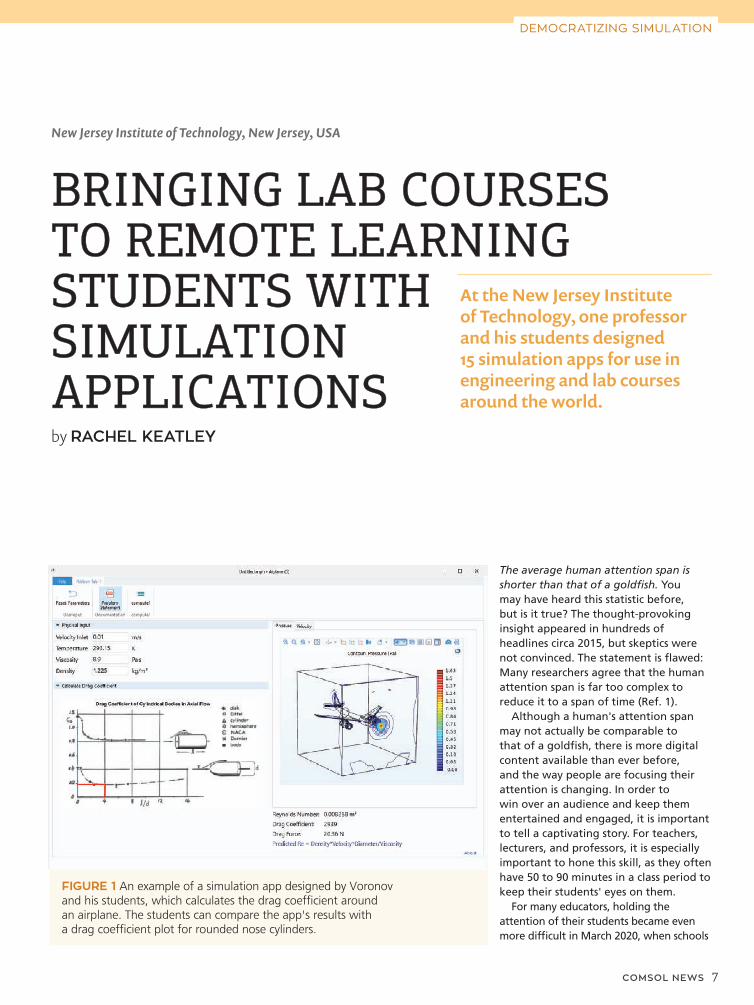
FIGURE 4 A multislice plot depicting SPL distribution at 10 kHz.
COMSOL NEWS 7
New Jersey Institute of Technology, New Jersey, USA
BRINGING LAB COURSES BRINGING LAB COURSES TO REMOTE LEARNING TO REMOTE LEARNING STUDENTS WITH STUDENTS WITH SIMULATION SIMULATION APPLICATIONSAPPLICATIONSby RACHEL KEATLEY
At the New Jersey Institute of Technology, one professor and his students designed 15 simulation apps for use in engineering and lab courses around the world.
FIGURE 1 An example of a simulation app designed by Voronov and his students, which calculates the drag coefficient around an airplane. The students can compare the app's results with a drag coefficient plot for rounded nose cylinders.
The average human attention span is shorter than that of a goldfish. You may have heard this statistic before, but is it true? The thought-provoking insight appeared in hundreds of headlines circa 2015, but skeptics were not convinced. The statement is flawed: Many researchers agree that the human attention span is far too complex to reduce it to a span of time (Ref. 1).
Although a human's attention span may not actually be comparable to that of a goldfish, there is more digital content available than ever before, and the way people are focusing their attention is changing. In order to win over an audience and keep them entertained and engaged, it is important to tell a captivating story. For teachers, lecturers, and professors, it is especially important to hone this skill, as they often have 50 to 90 minutes in a class period to keep their students' eyes on them.
For many educators, holding the attention of their students became even more difficult in March 2020, when schools
DEMOCRATIZING SIMULATION
8 COMSOL NEWS
(and the world) shut down due to the rapid spread of COVID-19, and many college classes moved online. At the New Jersey Institute of Technology (NJIT), Roman Voronov, an associate professor of chemical and biomedical engineering, designed 15 easy-to-use simulation applications to help professors at NJIT virtually teach fundamental engineering concepts and lab courses in an engaging way — no matter where the students are based.
» SIMULATION IN (AND OUT OF) THE CLASSROOMRoman Voronov teaches courses on transport phenomena, heat and mass transfer, and techniques for process simulation. "In my heat and mass transfer course, I wanted to introduce my students to COMSOL Multiphysics®, a numerical simulation software, for a project. As soon as I did one problem in the software, everybody was like: 'It is so much easier to
FIGURE 2 An image of the Orifice Flowmeter app.
FIGURE 3 An image of the Impeller Reactor app. The app generates a CAD file for a 3D-printed impeller that the students can use in the lab to verify the simulation results.
understand because visually I can actually see what is happening,'" said Voronov.
In addition, Voronov thinks it is important to introduce his students to advanced computational tools in general, as it gives them a unique advantage in the workforce. "It is not just for fun: Knowing how to use such technology ends up being a skill that they use after they graduate," said Voronov.
After seeing the positive impact simulation technology had on his students, Voronov wanted to make such tools more accessible to students and educators around the world — even before the concept of remote learning became a household term.
» A LIBRARY OF SIMULATION APPS FOR STUDENTSOver the course of 2020, Voronov and his students worked together to create a library of several standalone, executable simulation apps. They created these easy-to-use apps with the Application Builder, a tool for building intuitive user interfaces from models, where the app designer can decide which inputs and outputs to display. Each app was compiled into a standalone executable with the COMSOL Compiler™ deployment product, so that the apps could be easily distributed without having to manage additional software licenses. The yearlong project was funded by Computer Aids for Chemical Engineering (CACHE), a nonprofit organization that promotes the use of computational tools in chemical engineering.
Originally, Voronov planned to design apps that professors could use as visual teaching aids when presenting fundamental engineering concepts. However, when the COVID-19 pandemic hit, the nature of the project shifted. As courses completely moved online, NJIT professors teaching chemical engineering labs saw a need for apps that modeled experiments they had been performing in the lab up until then. Such apps would be used as a supplement to in-person lab work, and in some cases, a complete replacement.
After learning about what types of lab equipment the professors needed to model for their courses, Voronov and his students got to work bringing the simulation apps to life.
DEMOCRATIZING SIMULATION
COMSOL NEWS 9
air distribution on a car in pressure plots and airflow passing over the car in velocity plots.
All of the apps mentioned here, and 12 others, can be accessed on the New Jersey Institute of Technology website (Ref. 3). (Running the apps requires a free installation of COMSOL Runtime™ on the app user's operating system.)
» AN AWARD-WINNING APPMany of Roman Voronov's students from NJIT have gone on to use simulation in their careers — and even win awards. For example, Vasilios Halkias, a 2020 graduate of NJIT and one of Voronov's former students, developed an app that earned him the 2020 NAFEMS Student Award (Ref. 4). The prize-winning app simulates mass transfer, heat transfer, and reaction kinetics in a tubular flow reactor. Tubular flow reactors are important in the design of a variety of chemical-based applications.
Voronov believes the use of simulation applications will have a place inside the classroom, beyond virtual and hybrid learning. "I think using simulation apps truly gives students a fundamental understanding of what is happening inside the system they are testing. It gives them a different point of view and a lot of clarity."
REFERENCES 1. S. Maybin, “Busting the attention span myth,” BBC News, 2017. 2. "Development of Computational-Based Tools and Modules for Chemical Engineering Education," Computer Aids for Chemical Engineering, 2020. 3. R. Voronov, "COMSOL Apps," New Jersey Institute of Technology, 2020. https://web.njit.edu/~rvoronov/comsol-apps/4. R. Tara, "Unable to Take Lab Course to Graduate, Student Turns to Simulation," Engineering.com, 2020.
» EXPLORING 3 SPECIALIZED APPSUpon completion of the CACHE project, Roman Voronov and his students designed 15 simulation applications (Ref. 2). Several of the apps were designed to be used in specific engineering courses and labs at NJIT, but they may also be of interest to anyone studying fundamental chemical engineering processes.
When discussing the importance of simulation technology for lab courses, Voronov said: "In the lab, students can experiment and do what you ask them to do, but they do not always understand the physical processes that are occurring in the experiment, like they do with simulation."
One app Voronov and his students created can be used to simulate compressible fluid flow in pipes. The Orifice Flowmeter app was specifically made for a chemical engineering lab at NJIT, which required students to perform a fluid flow experiment. In the experiment, students had to measure pressure drops at multiple locations in pipes of varying lengths. Using the app, modeled after the intended experiment, students can change the geometry of the pipes and make modifications to the fluid inputs to see how this affects the results. The app features a 3D velocity
plot and a pressure plot so that students get a visualization of the physical phenomena occurring within the process.
Using the Impeller Reactor app, students can simulate the reaction between two species in a noncatalytic batch reactor with a rotating disc-shaped impeller. The app gives students insight into how changing the dimensions of the impeller can affect the molar concentration, mole and mass fraction, and mass concentrations in a batch reactor. (Batch reactors are often used to develop a variety of products in fine chemical, pharmaceutical, and food industries.) In addition, the app goes over how to model the impeller with a parametric sweep. "The idea is that the results will show the optimal impeller shape and size," said Voronov. Based on the simulation results, students can generate a CAD file for a 3D-printed impeller. Then, they can print out the impeller component and find out how it performs in reality.
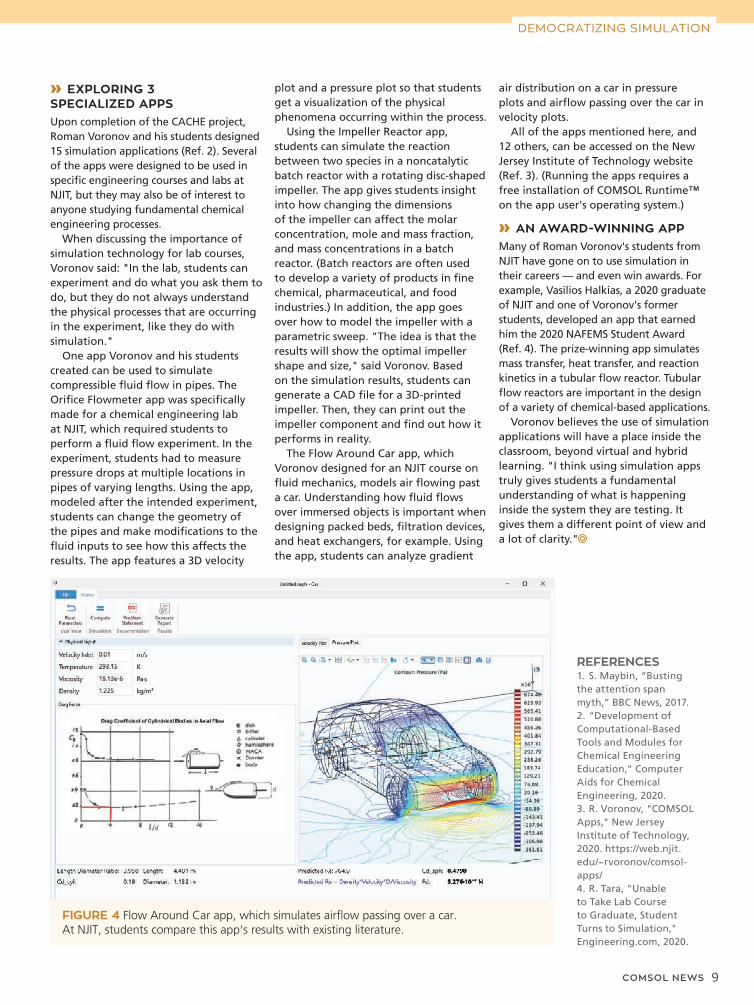
The Flow Around Car app, which Voronov designed for an NJIT course on fluid mechanics, models air flowing past a car. Understanding how fluid flows over immersed objects is important when designing packed beds, filtration devices, and heat exchangers, for example. Using the app, students can analyze gradient
FIGURE 4 Flow Around Car app, which simulates airflow passing over a car. At NJIT, students compare this app's results with existing literature.
DEMOCRATIZING SIMULATION
10 COMSOL NEWS
SIMULATION-BASED PRODUCT DEVELOPMENT
Wires and cables make up a global industry worth hundreds of billions of dollars. In fact, Infinium Global Research reports that the cable market is poised to reach $220 billion by 2025 (Ref. 1). A major portion of the rapidly growing cable industry’s revenue is from installation, maintenance, and development. For instance, the NorNed cable, a joint cable project connecting the power grids of Norway and the Netherlands, cost roughly €600 million (approx. $700 million USD) to install, and that was back in 2008 (Ref. 2). When cables of this magnitude need to be repaired or replaced, it can also be expensive. A 2010 report from the SubOptic submarine cable conference estimated that submarine cable repairs can cost more than $12,000 a day, and over $1 million per project. (Ref. 3) Since cable costs are so large, getting a return on investment also takes many years.
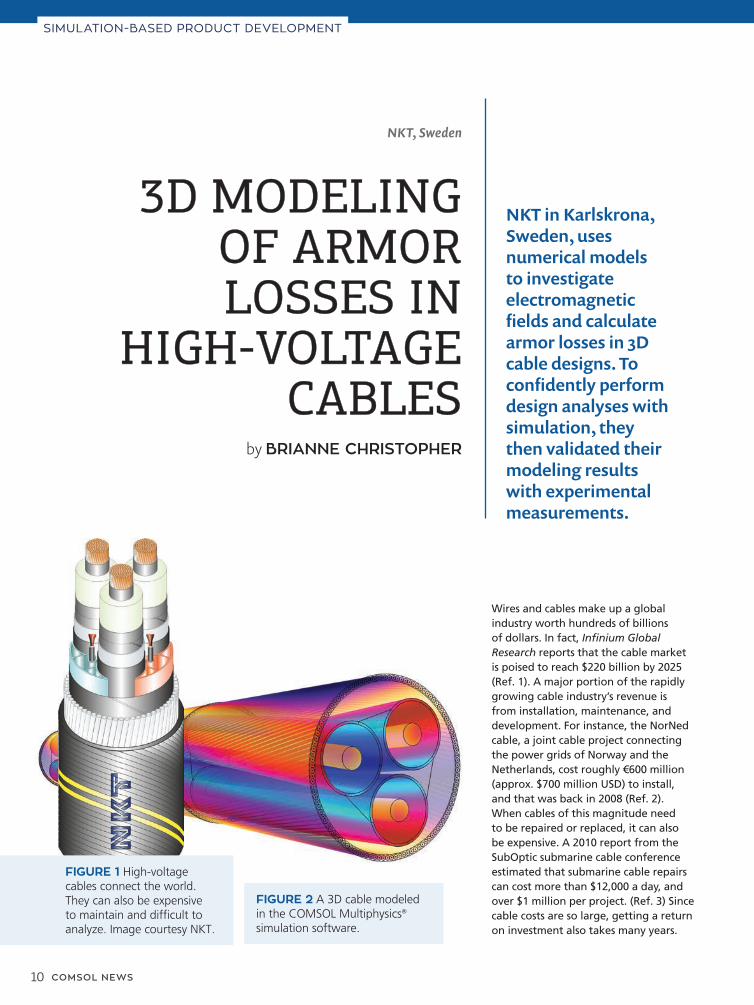
FIGURE 1 High-voltage cables connect the world. They can also be expensive to maintain and difficult to analyze. Image courtesy NKT.
FIGURE 2 A 3D cable modeled in the COMSOL Multiphysics® simulation software.
NKT, Sweden
3D MODELING 3D MODELING OF ARMOR OF ARMOR LOSSES IN LOSSES IN
HIGH-VOLTAGE HIGH-VOLTAGE CABLESCABLES
by BRIANNE CHRISTOPHER
NKT in Karlskrona, Sweden, uses numerical models to investigate electromagnetic fields and calculate armor losses in 3D cable designs. To confidently perform design analyses with simulation, they then validated their modeling results with experimental measurements.
COMSOL NEWS 11
that you have the cable. Almost all high-voltage offshore cables are custom made and therefore not available to test before a project is sold and manufacturing starts, and cables need to be designed already in the tender phase. With the adoption of numerical analysis, the study of cables and armor wires became easier, but still left a lot to be desired. In fact, the first 3D models of a cable were created less than a decade ago. Even more inhibiting: Models of this kind, up until recently, could take several days to a few weeks to run on a supercomputer. Advancements in both computer hardware and modeling techniques have made cable design and analysis quicker, easier, and more robust. A cable model that used to require a supercomputer, for example, can now be run on a standard laptop and take minutes instead of days. These enhancements have opened up new possibilities for NKT's research.
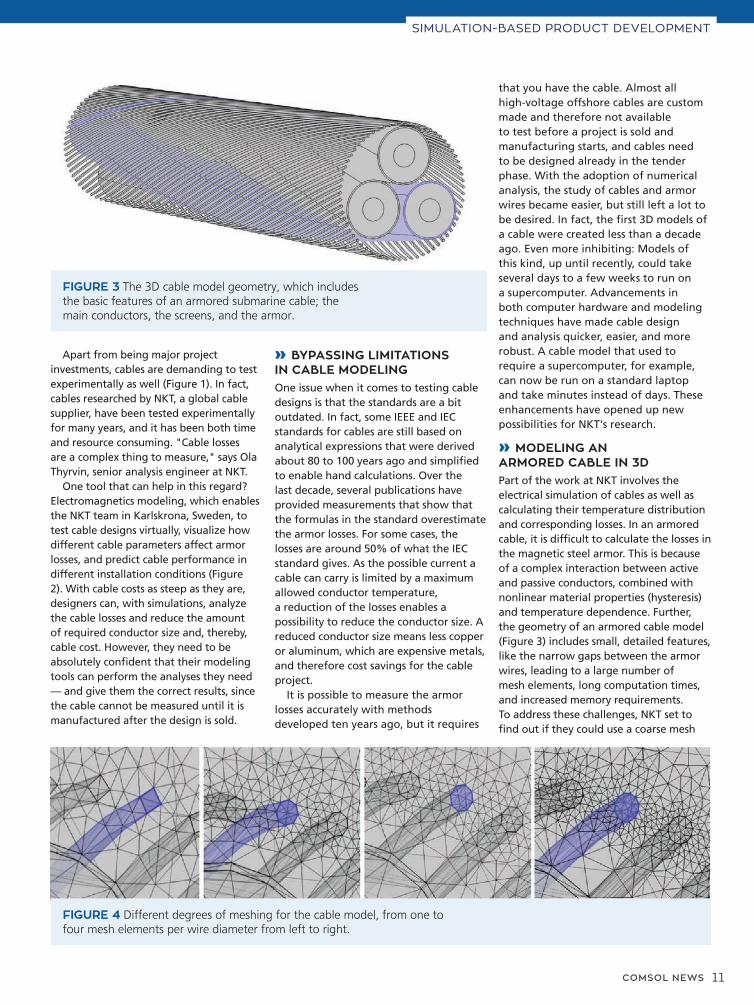
» MODELING AN ARMORED CABLE IN 3DPart of the work at NKT involves the electrical simulation of cables as well as calculating their temperature distribution and corresponding losses. In an armored cable, it is difficult to calculate the losses in the magnetic steel armor. This is because of a complex interaction between active and passive conductors, combined with nonlinear material properties (hysteresis) and temperature dependence. Further, the geometry of an armored cable model (Figure 3) includes small, detailed features, like the narrow gaps between the armor wires, leading to a large number of mesh elements, long computation times, and increased memory requirements. To address these challenges, NKT set to find out if they could use a coarse mesh
SIMULATION-BASED PRODUCT DEVELOPMENT
Apart from being major project investments, cables are demanding to test experimentally as well (Figure 1). In fact, cables researched by NKT, a global cable supplier, have been tested experimentally for many years, and it has been both time and resource consuming. "Cable losses are a complex thing to measure," says Ola Thyrvin, senior analysis engineer at NKT.
One tool that can help in this regard? Electromagnetics modeling, which enables the NKT team in Karlskrona, Sweden, to test cable designs virtually, visualize how different cable parameters affect armor losses, and predict cable performance in different installation conditions (Figure 2). With cable costs as steep as they are, designers can, with simulations, analyze the cable losses and reduce the amount of required conductor size and, thereby, cable cost. However, they need to be absolutely confident that their modeling tools can perform the analyses they need — and give them the correct results, since the cable cannot be measured until it is manufactured after the design is sold.
» BYPASSING LIMITATIONS IN CABLE MODELINGOne issue when it comes to testing cable designs is that the standards are a bit outdated. In fact, some IEEE and IEC standards for cables are still based on analytical expressions that were derived about 80 to 100 years ago and simplified to enable hand calculations. Over the last decade, several publications have provided measurements that show that the formulas in the standard overestimate the armor losses. For some cases, the losses are around 50% of what the IEC standard gives. As the possible current a cable can carry is limited by a maximum allowed conductor temperature, a reduction of the losses enables a possibility to reduce the conductor size. A reduced conductor size means less copper or aluminum, which are expensive metals, and therefore cost savings for the cable project.
It is possible to measure the armor losses accurately with methods developed ten years ago, but it requires
FIGURE 3 The 3D cable model geometry, which includes the basic features of an armored submarine cable; the main conductors, the screens, and the armor.
FIGURE 4 Different degrees of meshing for the cable model, from one to four mesh elements per wire diameter from left to right.
12 COMSOL NEWS
for their cable model (Figure 4) while still accurately describing the nonlinear magnetic behavior of the steel material, a strongly magnetic soft steel with high permeability and large hysteresis losses.
The group turned to the COMSOL Multiphysics® simulation software, as well as the add-on AC/DC Module, which is especially suited for cable analysis. This software enables the 3D modeling of an armored cable in order to analyze the magnetic fields and compute the armor losses (Figure 5). Going back to the computational expense of cable modeling, Ola Thyrvin mentions a feature from the COMSOL® software that he found particularly helpful: the Periodic boundary condition, which enabled the team to model a small piece of the cable, keeping it as short as possible. The reduced size of the model saves on computational time and memory requirements that are specific to this application area, while also ensuring that
all of the relevant physics are captured in the model. "The model needs to capture one conductor meeting one armor wire up until they meet again," says Thyrvin. Another memory-saving modeling approach is the use of infinite elements, which lets the designers include a sufficient amount of air around the cable in the modeling domain, while still limiting the required mesh and memory.
» INCREASED PERFORMANCE, ACCURATE COMPUTATIONSThe NKT team's modeling approach involved three main stages. First, they set up a current-driven model with predefined temperatures. The current is not affected by the cable impedance or variations in temperature and is instead controlled by the system load. Next, the team calculated the eddy current losses as losses that are induced by local currents flowing in the armor wires at the predefined temperature. They found that the losses are dominated by the screening currents
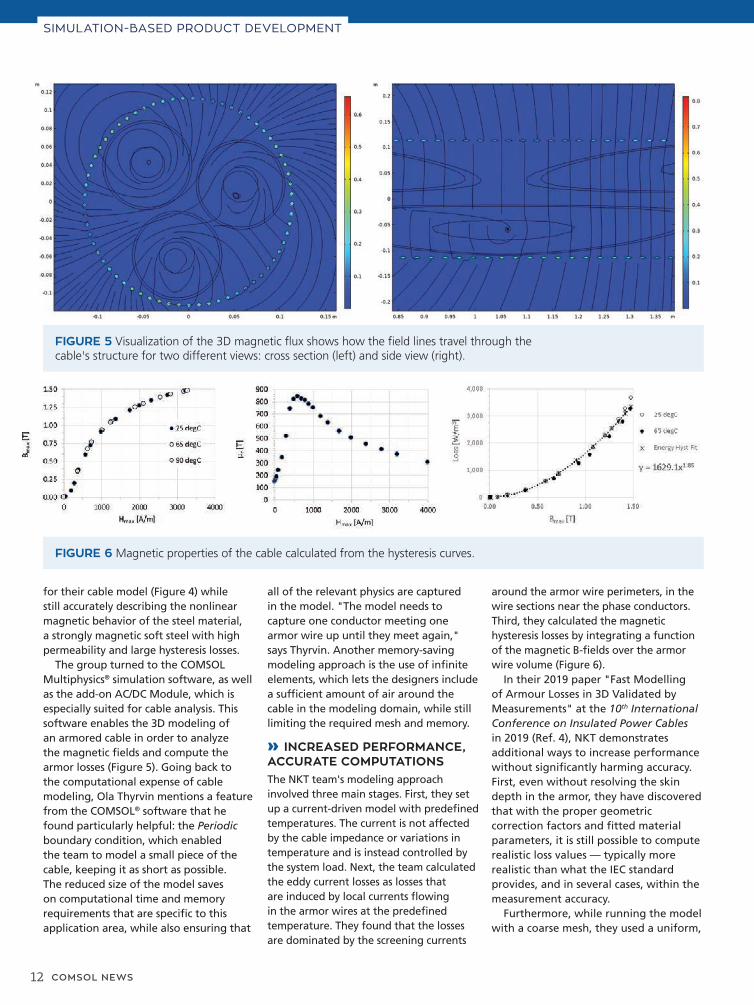
around the armor wire perimeters, in the wire sections near the phase conductors. Third, they calculated the magnetic hysteresis losses by integrating a function of the magnetic B-fields over the armor wire volume (Figure 6).
In their 2019 paper "Fast Modelling of Armour Losses in 3D Validated by Measurements" at the 10th International Conference on Insulated Power Cables in 2019 (Ref. 4), NKT demonstrates additional ways to increase performance without significantly harming accuracy. First, even without resolving the skin depth in the armor, they have discovered that with the proper geometric correction factors and fitted material parameters, it is still possible to compute realistic loss values — typically more realistic than what the IEC standard provides, and in several cases, within the measurement accuracy.
Furthermore, while running the model with a coarse mesh, they used a uniform,
FIGURE 5 Visualization of the 3D magnetic flux shows how the field lines travel through the cable's structure for two different views: cross section (left) and side view (right).
FIGURE 6 Magnetic properties of the cable calculated from the hysteresis curves.
SIMULATION-BASED PRODUCT DEVELOPMENT
COMSOL NEWS 13
» VALIDATING THE CABLE MODEL RESULTSAll of the modeling in the world will not matter, however, if the results of the model do not accurately represent the physics of the device in reality. To make sure that the simulation results for the cable analyses are accurate, Thyrvin and his team validated them with the existing cable data. When computing the armor losses of the cable, they found that the modeled results were within 3% of the losses measured from cables experimentally (Figure 8). While that sounds impressive in itself, these results are actually more accurate than the IEC standard for the type of cable being modeled, in which the total loss differs between 10–30% compared to measurements.
» PUTTING TRUST IN CABLE ANALYSESThe validated results of the 3D cable model proved to NKT that simulation is a reliable and trustworthy way to study cable designs. This knowledge has had far-reaching effects for the organization. For one, they feel confident studying cables without comparing to measurements each time, because they have already confirmed that the simulations are accurate based on the previously validated results. "We can now simulate instead of measure," says Thyrvin. "You can simulate before making, but you cannot measure before making." Now, with simulation software, NKT knows how large the losses are in a cable before manufacturing, based on the simulation analyses.
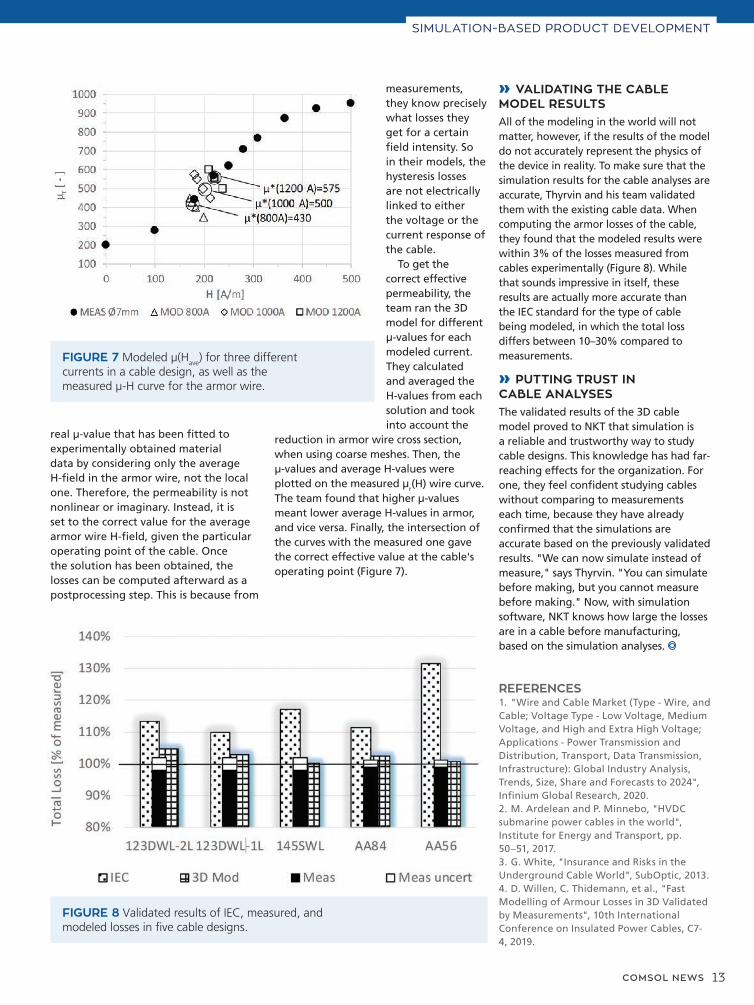
real μ-value that has been fitted to experimentally obtained material data by considering only the average H-field in the armor wire, not the local one. Therefore, the permeability is not nonlinear or imaginary. Instead, it is set to the correct value for the average armor wire H-field, given the particular operating point of the cable. Once the solution has been obtained, the losses can be computed afterward as a postprocessing step. This is because from
measurements, they know precisely what losses they get for a certain field intensity. So in their models, the hysteresis losses are not electrically linked to either the voltage or the current response of the cable.
To get the correct effective permeability, the team ran the 3D model for different μ-values for each modeled current. They calculated and averaged the H-values from each solution and took into account the
reduction in armor wire cross section, when using coarse meshes. Then, the μ-values and average H-values were plotted on the measured μr(H) wire curve. The team found that higher μ-values meant lower average H-values in armor, and vice versa. Finally, the intersection of the curves with the measured one gave the correct effective value at the cable's operating point (Figure 7).
FIGURE 7 Modeled μ(Have
) for three different currents in a cable design, as well as the measured μ-H curve for the armor wire.
SIMULATION-BASED PRODUCT DEVELOPMENT
REFERENCES 1. "Wire and Cable Market (Type - Wire, and Cable; Voltage Type - Low Voltage, Medium Voltage, and High and Extra High Voltage; Applications - Power Transmission and Distribution, Transport, Data Transmission, Infrastructure): Global Industry Analysis, Trends, Size, Share and Forecasts to 2024", Infinium Global Research, 2020. 2. M. Ardelean and P. Minnebo, "HVDC submarine power cables in the world", Institute for Energy and Transport, pp. 50–51, 2017. 3. G. White, "Insurance and Risks in the Underground Cable World", SubOptic, 2013. 4. D. Willen, C. Thidemann, et al., "Fast Modelling of Armour Losses in 3D Validated by Measurements", 10th International Conference on Insulated Power Cables, C7-4, 2019.
FIGURE 8 Validated results of IEC, measured, and modeled losses in five cable designs.
14 COMSOL NEWS
Mahindra & Mahindra Limited, India
ADVANCING ADVANCING AUTOMOTIVE PRODUCT AUTOMOTIVE PRODUCT DEVELOPMENT WITH DEVELOPMENT WITH SIMULATION APPSSIMULATION APPS
by ADITI KARANDIKAR
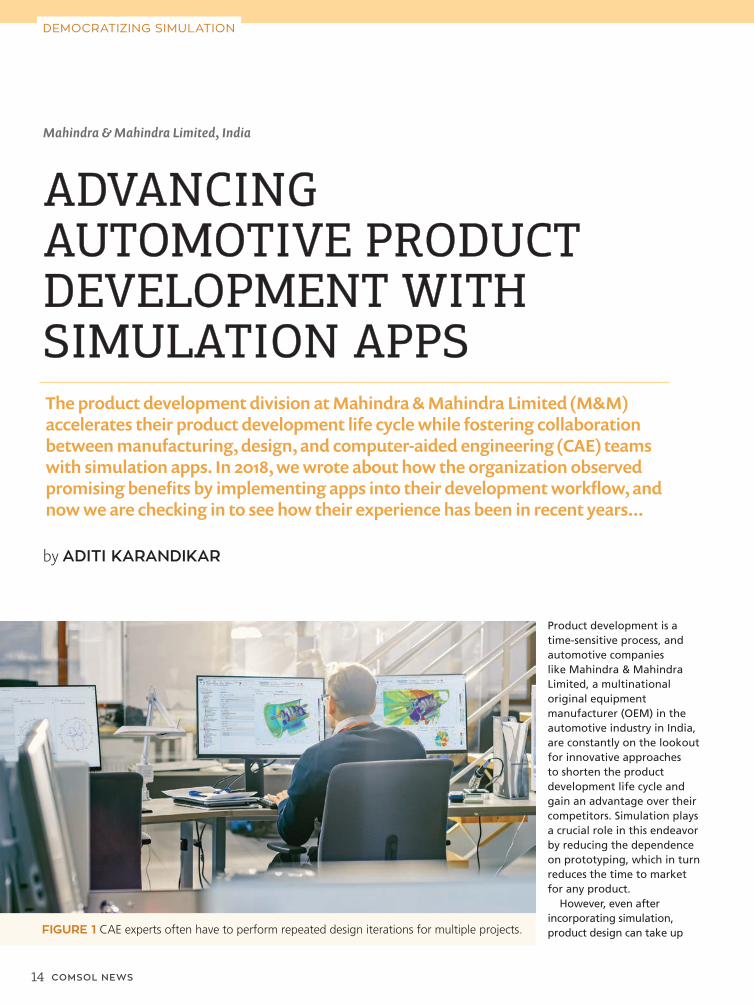
The product development division at Mahindra & Mahindra Limited (M&M) accelerates their product development life cycle while fostering collaboration between manufacturing, design, and computer-aided engineering (CAE) teams with simulation apps. In 2018, we wrote about how the organization observed promising benefits by implementing apps into their development workflow, and now we are checking in to see how their experience has been in recent years...
FIGURE 1 CAE experts often have to perform repeated design iterations for multiple projects.
Product development is a time-sensitive process, and automotive companies like Mahindra & Mahindra Limited, a multinational original equipment manufacturer (OEM) in the automotive industry in India, are constantly on the lookout for innovative approaches to shorten the product development life cycle and gain an advantage over their competitors. Simulation plays a crucial role in this endeavor by reducing the dependence on prototyping, which in turn reduces the time to market for any product.
However, even after incorporating simulation, product design can take up
DEMOCRATIZING SIMULATION
COMSOL NEWS 15
a lot of time. Designers require new concepts to be evaluated quickly, which may not be possible because of the required complexity of the analysis. After the design is evaluated by the CAE team, the design team then modifies the design based on the CAE results and again waits for validation by the CAE experts. These iterations continue until a final design is obtained.
As a result, the design lead time can run into a couple of months for some vehicle components, depending upon the number of iterations required for design finalization. Moreover, the time-intensive CAE analysis between design iterations leaves the CAE experts juggling between intermediate design evaluations across several departments of an organization.
Simulation software like the COMSOL Multiphysics® software, with the built-in Application Builder tool, enable domain experts to harness the power of simulation and help companies like M&M to reduce this bottleneck. The Methods Development team at M&M has developed close to 20 simulation applications, or apps, which are being used across teams working in different domains, including design; testing; and noise, vibration, and harshness (NVH) analysis. The apps are deployed to the organization using both COMSOL Server™ and COMSOL Compiler™.
These apps empower the design team with access to engineering analysis tools, allowing them to actively participate in the validation of new designs right from the concept phase, thus collaborating much more efficiently with
CAE experts.This in turn minimizes the iterations required to arrive at a robust design and frees up time for the CAE team to take on other projects.
» BENEFITS OF SIMULATION APPSThe M&M team found that the use of apps makes concept evaluation and finalization considerably more accessible. With apps, the designers can try out various designs themselves and objectively rank them based on set criteria. The parametric nature of apps offers convenience and flexibility for different design options to be evaluated quickly, leading to a short turnaround time.
Apps are especially beneficial when the design is in the concept stage, since there is no dependence on CAD availability. Earlier, the process was constrained by delivery of the design layout by the CAD team; this further increased the design lead time. With the introduction of apps, the design evaluation can begin much faster. Apps are used as a starting point when the detailed CAD is not available. A number of ideas are evaluated and the CAD is prepared only for shortlisted designs.
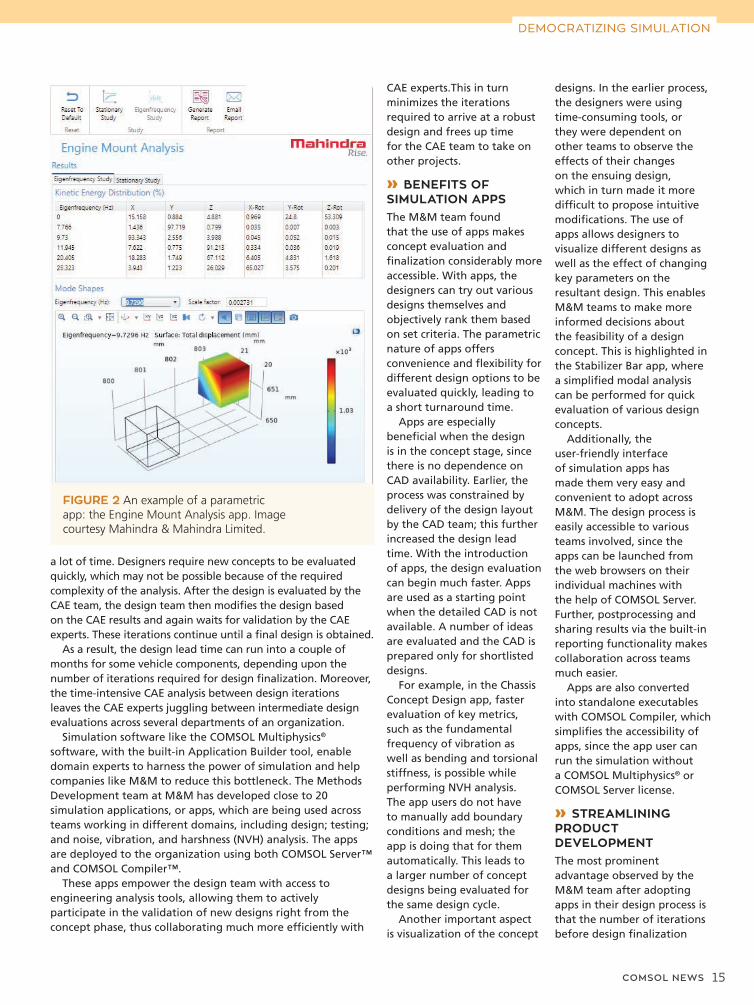
For example, in the Chassis Concept Design app, faster evaluation of key metrics, such as the fundamental frequency of vibration as well as bending and torsional stiffness, is possible while performing NVH analysis. The app users do not have to manually add boundary conditions and mesh; the app is doing that for them automatically. This leads to a larger number of concept designs being evaluated for the same design cycle.
Another important aspect is visualization of the concept
FIGURE 2 An example of a parametric app: the Engine Mount Analysis app. Image courtesy Mahindra & Mahindra Limited.
designs. In the earlier process, the designers were using time-consuming tools, or they were dependent on other teams to observe the effects of their changes on the ensuing design, which in turn made it more difficult to propose intuitive modifications. The use of apps allows designers to visualize different designs as well as the effect of changing key parameters on the resultant design. This enables M&M teams to make more informed decisions about the feasibility of a design concept. This is highlighted in the Stabilizer Bar app, where a simplified modal analysis can be performed for quick evaluation of various design concepts.
Additionally, the user-friendly interface of simulation apps has made them very easy and convenient to adopt across M&M. The design process is easily accessible to various teams involved, since the apps can be launched from the web browsers on their individual machines with the help of COMSOL Server. Further, postprocessing and sharing results via the built-in reporting functionality makes collaboration across teams much easier.
Apps are also converted into standalone executables with COMSOL Compiler, which simplifies the accessibility of apps, since the app user can run the simulation without a COMSOL Multiphysics® or COMSOL Server license.
» STREAMLINING PRODUCT DEVELOPMENTThe most prominent advantage observed by the M&M team after adopting apps in their design process is that the number of iterations before design finalization
DEMOCRATIZING SIMULATION
16 COMSOL NEWS
has reduced drastically, since the early designs emerging due to the use of apps are much closer to the desired outcome. Frontloading of design evaluation means more mature designs that already meet the minimum requirements are passed on to the CAE team for finalization. Even crucial projects such as lightweighting and designing components for a target weight can be driven by the design team from the concept stage itself.
More concept designs generated due to the modified process in turn leads to faster design finalization, which ultimately results in savings of both time and cost. The design team now has the tools to evaluate the proposed designs, allowing them to create innovative designs for upcoming and current projects. This has led to more innovation from various teams across M&M.
» WHAT LIES AHEADThe use of compiled apps has enabled the team at M&M to truly democratize simulation across the organization. With the successful adoption of simulation apps for the design of various components in passenger vehicles, the M&M team plans to build on this momentum in the coming years. They plan to incorporate more load cases and metrics in the existing apps for optimum evaluation
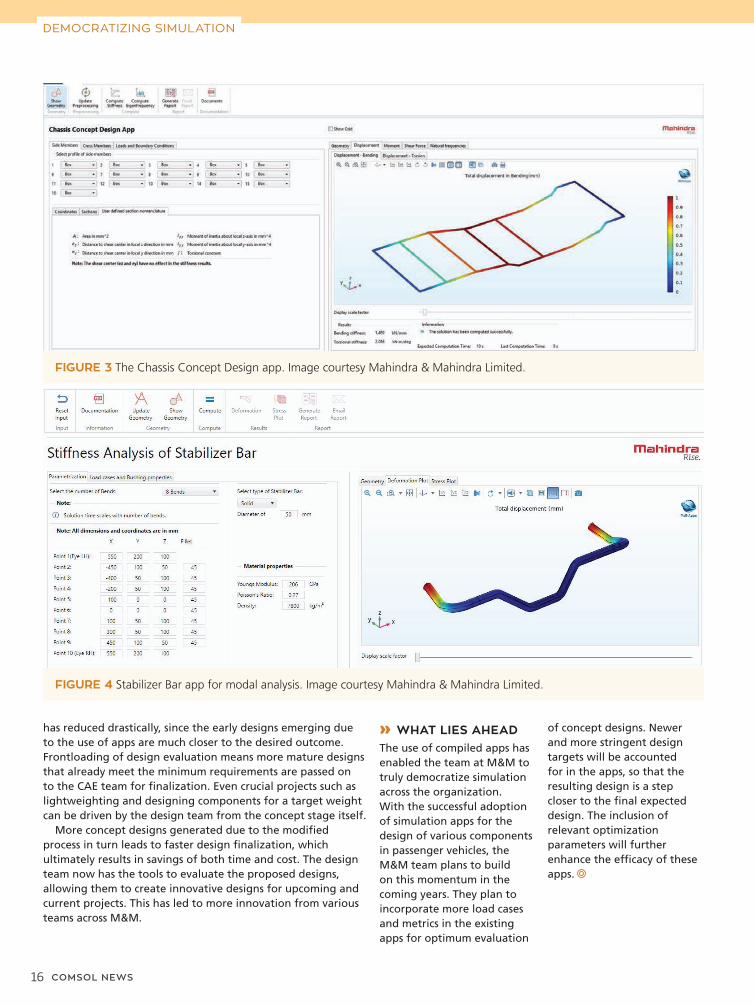
FIGURE 3 The Chassis Concept Design app. Image courtesy Mahindra & Mahindra Limited.
of concept designs. Newer and more stringent design targets will be accounted for in the apps, so that the resulting design is a step closer to the final expected design. The inclusion of relevant optimization parameters will further enhance the efficacy of these apps.
FIGURE 4 Stabilizer Bar app for modal analysis. Image courtesy Mahindra & Mahindra Limited.
DEMOCRATIZING SIMULATION

COMSOL NEWS 17
DESIGN OPTIMIZATION
thermofin GmbH, Germany
OPTIMIZING HEAT OPTIMIZING HEAT EXCHANGER DESIGNS EXCHANGER DESIGNS FOR REFRIGERATION AND FOR REFRIGERATION AND COOLING TECHNOLOGYCOOLING TECHNOLOGY
by RACHEL KEATLEY
Cooling an indoor ski slope, providing air conditioning to a prestigious old castle, or chilling and freezing consumer goods — these scenarios all require heat exchanger technology. thermofin GmbH ensures that their heat exchanger devices are optimized for a variety of client needs using multiphysics simulation.
An estimated 93.4 million tonnes (103 million tons) of food went to waste in the United States alone in 2018 — a number greater than the weight of 600 thousand average-sized blue whales (Ref. 1). A majority of food waste ends up in landfills, where it decomposes and produces methane. The United States
Food and Drug Administration (FDA) even reports that food waste accounts for the largest percentage of material in landfills (Ref. 2). Food can be wasted during any stage of its life cycle, which is why it is important for consumers and the food industry alike to be aware of solutions to help alleviate this problem. One way to help reduce food waste on an industrial level is to ensure that consumer goods are being properly stored before they end up in customers' homes.
thermofin GmbH, a leading manufacturer of heat exchangers, designs technology to help make this solution a reality. Their heat exchangers are used in air conditioning and refrigeration systems in commercial and industrial buildings around
the world. Their devices can be found in supermarkets, cold storage facilities, ice arenas, power plants, and more. Julius Heik, a thermodynamics development engineer at thermofin GmbH, performs simulations to ensure that their heat exchangers are optimized for specific use cases and client needs.
Heik's favorite part about working with simulation? You are able to gain knowledge before actual measurements are carried out.
» DESIGNING OPTIMIZED HEAT EXCHANGERSSince its founding in 2002, thermofin GmbH has expanded from 6 employees to more than 500, with production sites on several continents. Their dependable heat exchangers have made
FIGURE 1 thermofin® heat exchangers are used in a variety of devices, such as blast freezers, hybrid condensers, and gas coolers (shown).
thermofin is a registered trademark of thermofin GmbH.
18 COMSOL NEWS
» COLD STORAGE ROOM SIMULATIONSIn addition to performing simulations of heat exchanger technology, thermofin GmbH also simulates their customers' cold storage warehouses. For one specific project, a customer asked for help designing a meat storage room, which would include several robotic machines that hold the meat. In this storage room, meat enters at room temperature and needs to be cooled before it can be brought into a different cold storage room. "It was important that the air velocity in the room was not too high so that the meat would not fall off the robotic [machines], and on the other hand, it was really important that every area in the room gets the same or similar amount of air," said Heik.
When performing cold storage simulations like this one, there are several criteria that need to be taken into account, including temperature distribution, airflow distribution, relative
them a popular choice in the refrigeration and air conditioning industry.
Heat exchangers sound like a simple concept, but they can actually be quite challenging to design. The essential task in cooling a product is to get rid of unwanted heat so that thermal energy from perishable goods is extracted. This is where the refrigerant of a refrigeration cycle comes into play. By changing the refrigerant phase from a liquid to a vapor state, the heat exchanger is removing heat from its ambient surroundings. This heat then has to be passed over to a second heat exchanger, which emits this energy to the outside environment.
In transcritical CO2 refrigeration cycles, a so-called gas cooler chills the refrigerant inside a heat exchanger. Often, people get confused by the name "gas cooler", as if it uses gas to chill its surroundings. Designing heat exchangers in general, and gas coolers in particular, presents a fair amount of difficulties, according to Heik. When striving for better, more energy-conserving refrigeration cycles, well-engineered heat exchanger designs serve as a main contribution.
Like many cooling systems, gas coolers are designed to have a minimal direct impact on the environment, so they use the natural refrigerant CO2. For example, in the supermarket sector, CO2 is now used almost exclusively because it is classified as a nonhazardous gas (safety group A1). Due to its properties, however, it must dissipate its heat at air temperatures above 20–25°C, in the so-called transcritical range. That is why these systems have a large temperature difference, consist of many different circuits, and are made up of a wide range of materials. Using simulation, Heik is able to efficiently and simultaneously analyze the airflow and material properties of these devices.
Designing the inner finned tubes presents another unique
challenge when developing heat exchangers. These tubes are used in heat exchangers to transform a hot fluid into a cold fluid or vice versa. The arrangement, diameter, material (stainless steel is required if using ammonia), and fin spacing of these finned tubes all depend on the type of heat exchanger in which they are being used. "There is not a lot of measured data available on how these tubes work," said Heik. With simulation, he can get a better understanding of how finned tubes affect a heat exchanger design by modeling multiple tube geometries and investigating their inner and outer heat transfer capabilities. The finned tube geometries that offer the best performance are built and tested at an in-house experimental station. "We look to see if the calculations and results are the same or similar, and then we take the best tube for our industrial line," said Heik.
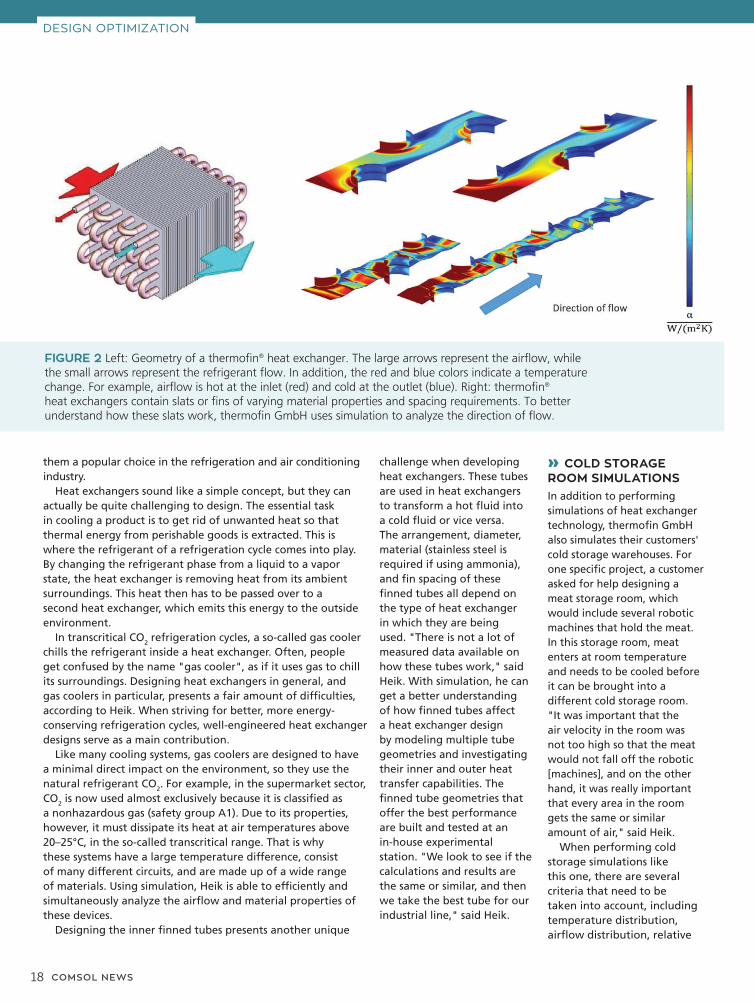
FIGURE 2 Left: Geometry of a thermofin® heat exchanger. The large arrows represent the airflow, while the small arrows represent the refrigerant flow. In addition, the red and blue colors indicate a temperature change. For example, airflow is hot at the inlet (red) and cold at the outlet (blue). Right: thermofin® heat exchangers contain slats or fins of varying material properties and spacing requirements. To better understand how these slats work, thermofin GmbH uses simulation to analyze the direction of flow.
DESIGN OPTIMIZATION
COMSOL NEWS 19
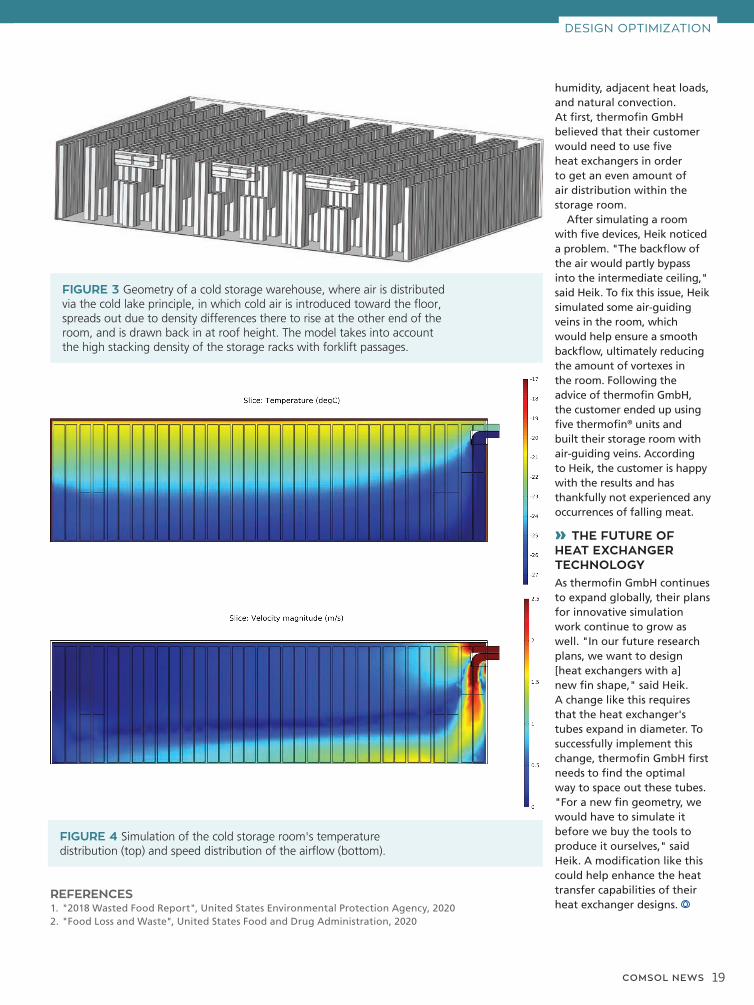
FIGURE 3 Geometry of a cold storage warehouse, where air is distributed via the cold lake principle, in which cold air is introduced toward the floor, spreads out due to density differences there to rise at the other end of the room, and is drawn back in at roof height. The model takes into account the high stacking density of the storage racks with forklift passages.
FIGURE 4 Simulation of the cold storage room's temperature distribution (top) and speed distribution of the airflow (bottom).
humidity, adjacent heat loads, and natural convection. At first, thermofin GmbH believed that their customer would need to use five heat exchangers in order to get an even amount of air distribution within the storage room.
After simulating a room with five devices, Heik noticed a problem. "The backflow of the air would partly bypass into the intermediate ceiling," said Heik. To fix this issue, Heik simulated some air-guiding veins in the room, which would help ensure a smooth backflow, ultimately reducing the amount of vortexes in the room. Following the advice of thermofin GmbH, the customer ended up using five thermofin® units and built their storage room with air-guiding veins. According to Heik, the customer is happy with the results and has thankfully not experienced any occurrences of falling meat.
» THE FUTURE OF HEAT EXCHANGER TECHNOLOGYAs thermofin GmbH continues to expand globally, their plans for innovative simulation work continue to grow as well. "In our future research plans, we want to design [heat exchangers with a] new fin shape," said Heik. A change like this requires that the heat exchanger's tubes expand in diameter. To successfully implement this change, thermofin GmbH first needs to find the optimal way to space out these tubes. "For a new fin geometry, we would have to simulate it before we buy the tools to produce it ourselves," said Heik. A modification like this could help enhance the heat transfer capabilities of their heat exchanger designs.
DESIGN OPTIMIZATION
REFERENCES 1. "2018 Wasted Food Report", United States Environmental Protection Agency, 20202. "Food Loss and Waste", United States Food and Drug Administration, 2020
20 COMSOL NEWS
TL-Engineering, Denmark
GREENING THE HEART GREENING THE HEART OF THE CITY: AN URBAN OF THE CITY: AN URBAN ROOFTOP DRAINAGE ROOFTOP DRAINAGE SYSTEM INSIDE A GARDEN SYSTEM INSIDE A GARDEN FENCEFENCEby ALAN PETRILLO
RESEARCH SPOTLIGHT
A handsome willow-sheathed fence in Copenhagen conceals a secret: It is actually a sustainable urban drainage system (SUDS) that disperses rainwater collected from the roofs of nearby apartment buildings. A collaborative simulation-driven design process turned this infrastructure into an urban amenity, which protects neighborhood gardens, mitigates noise pollution, and helps prevent frequent rain from overflowing city drainage systems.
“The green parts of the city are precious,” says Marina Bergen Jensen, professor of landscape architecture and planning at the University of Copenhagen. They are also frequently under stress. We ask these often-neglected parcels of land to help manage air quality, noise pollution, and drainage, even as we expect them to serve as oases of natural beauty and calm. To make the most of this essential urban space, Prof. Jensen led a project to develop a new kind of infrastructure: a wood-sheathed “green screen” that protects and enhances a densely populated Copenhagen neighborhood — and provides an ingenious system for dispersing rainwater runoff from nearby rooftops.
Much like a city itself, the urban green screen is a fascinating combination of elements that come together to serve multiple purposes. And like city life, it was created by a broad mix of people and organizations, each contributing their distinctive talents to the resulting project. A team of engineers, architects, and citizen stakeholders was guided by Prof. Jensen’s vision for a more livable, sustainable city. The resulting concept could benefit any community where
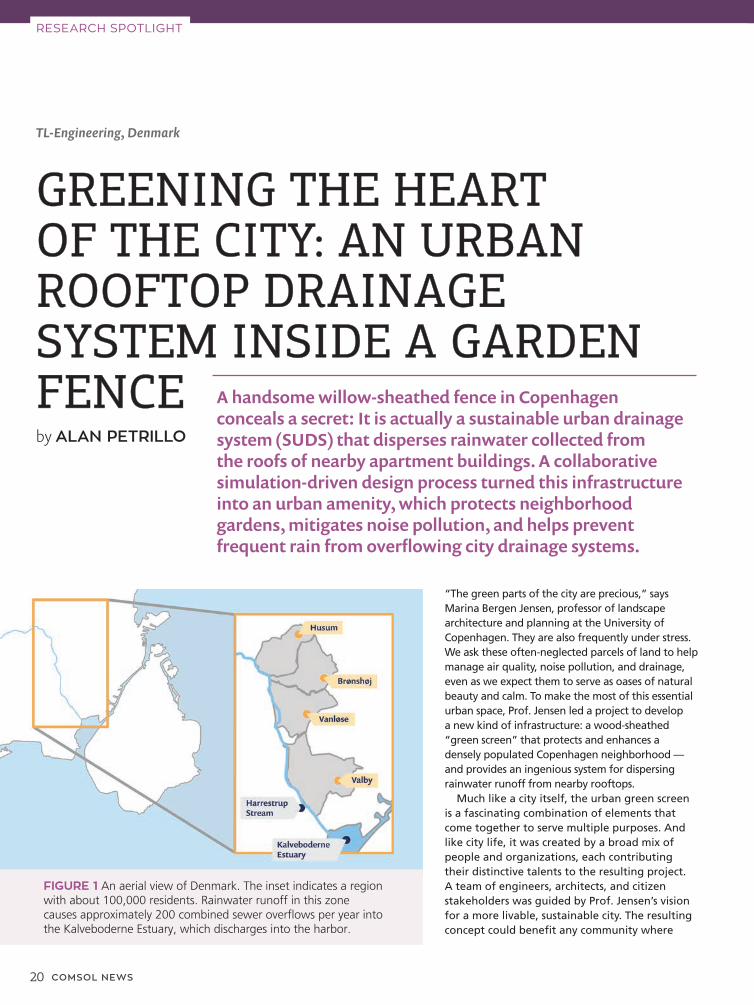
FIGURE 1 An aerial view of Denmark. The inset indicates a region with about 100,000 residents. Rainwater runoff in this zone causes approximately 200 combined sewer overflows per year into the Kalveboderne Estuary, which discharges into the harbor.
COMSOL NEWS 21
puddle will eventually dry up, most of the water moving through this system will also evaporate (Figure 3). The urban green screen structure functions as a kind of vertical puddle that holds water above the ground, where it can be dispersed through evaporative action.
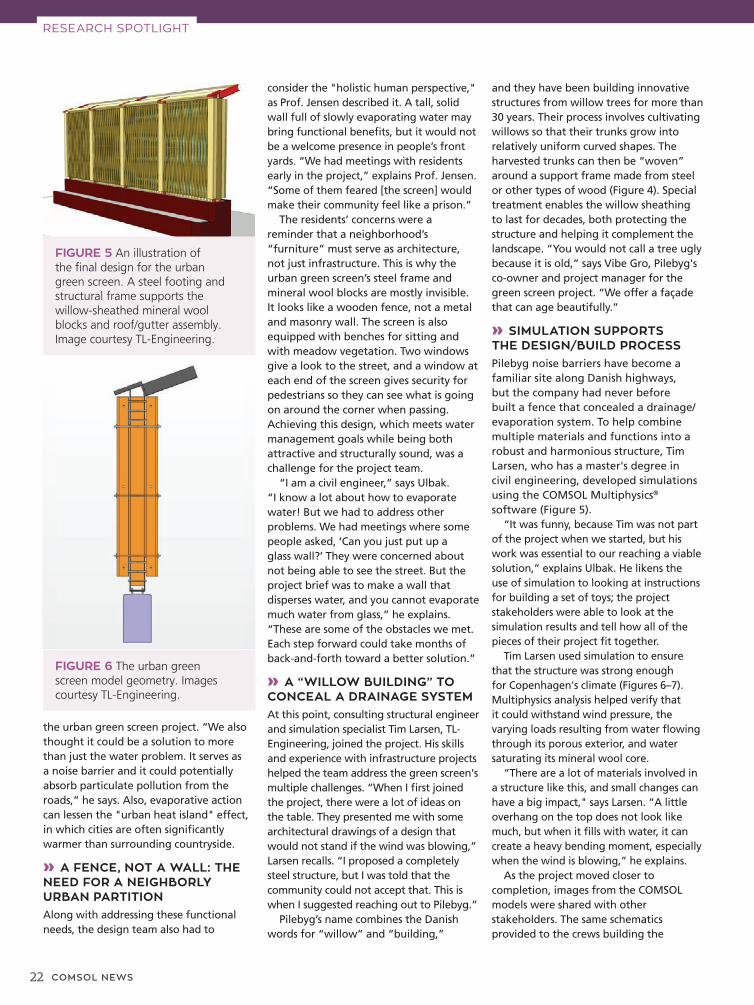
After gravity pushes rainwater to the top of the structure, it flows along an open perforated gutter. Some water will evaporate from the gutter, and some will flow down into the body of the screen, where it is absorbed by blocks of fibrous “mineral wool.” This rock-based material is often used as heat-retaining insulation in Nordic countries. In the urban green screen, it functions as a sponge, receiving water from the roof and then gradually releasing it into the air. If the mineral wool blocks become fully saturated by heavy rains, some water will be released from the bottom of the structure. This excess water
is captured in a soil-filled chamber, where it helps irrigate vines and other decorative plants. The plants' scheme was developed to ensure lush green vegetation that supports biodiversity (insects, birds).
“The structure is designed to disperse as much water as possible, while taking up as little space as possible,” explains Kristoffer Ulbak, a civil engineer focused on water management, who helped guide
people share precious living space with buildings, cars, and infrastructure.
» “A HOLISTIC HUMAN PERSPECTIVE OF CITY LIFE”It may be surprising that Prof. Jensen’s PhD training was not in architecture or urban planning. “My background is in soil science and water chemistry, and the interaction between soil, water, plants, and micro-organisms,” she says. “But urban areas have become my research field, so I work with planners and landscape architects. My career is built around a holistic human perspective of city life.”
In Copenhagen (Figure 1), this perspective must encompass frequent rainfall in a densely developed environment. Most urban rainwater falls on rooftops, streets, and other impermeable “hardscape” surfaces, rather than seeping into the soil. This water is typically collected by storm drains, which means that heavy rains can overwhelm sewage treatment systems and sometimes flood city streets with a mix of rain and wastewater. To better manage these risks, Prof. Jensen and her colleagues work to develop sustainable urban drainage systems (SUDS).
“It is estimated that at least 50% of all rainwater runoff in Copenhagen originates from rooftops. Most of that water drains into city sewers, but it does not have to be that way,” explains Prof. Jensen. “It should be possible for us to mimic nature’s own processes and let more water seep into the ground or evaporate.”
» CARRYING RAINWATER FROM ONE ROOF TO ANOTHERAs part of a government-sponsored initiative, a multidisciplinary team began developing a SUDS program for a dense Copenhagen neighborhood in 2013 for a five-year period. They proposed a solution that collects rainwater from rooftop gutters and downspouts, but from there, the similarities to conventional urban drainage systems end. Rather than flowing down into the sewer, the system uses gravity to push rainwater up to the top of a freestanding wall structure (Figure 2). In other words, water gets removed from a building’s roof, only to be deposited on top of a different roof. Why?
The purpose of this counterintuitive process is evaporation. Just as water in a
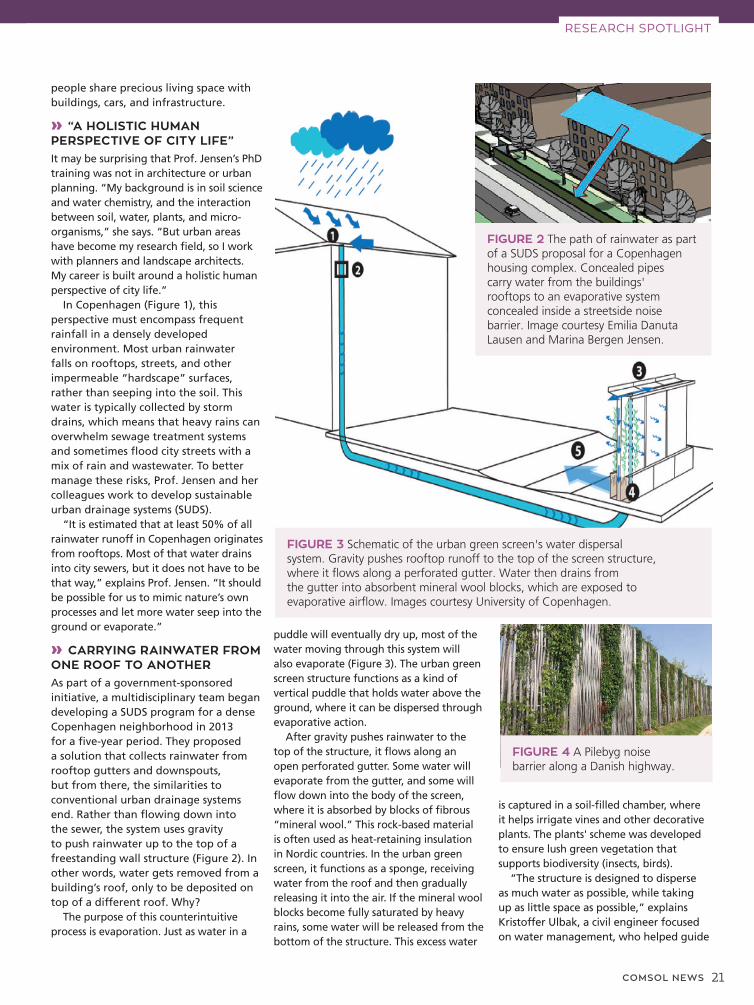
FIGURE 2 The path of rainwater as part of a SUDS proposal for a Copenhagen housing complex. Concealed pipes carry water from the buildings' rooftops to an evaporative system concealed inside a streetside noise barrier. Image courtesy Emilia Danuta Lausen and Marina Bergen Jensen.
FIGURE 3 Schematic of the urban green screen's water dispersal system. Gravity pushes rooftop runoff to the top of the screen structure, where it flows along a perforated gutter. Water then drains from the gutter into absorbent mineral wool blocks, which are exposed to evaporative airflow. Images courtesy University of Copenhagen.
RESEARCH SPOTLIGHT
FIGURE 4 A Pilebyg noise barrier along a Danish highway.
22 COMSOL NEWS
the urban green screen project. “We also thought it could be a solution to more than just the water problem. It serves as a noise barrier and it could potentially absorb particulate pollution from the roads,” he says. Also, evaporative action can lessen the "urban heat island" effect, in which cities are often significantly warmer than surrounding countryside.
» A FENCE, NOT A WALL: THE NEED FOR A NEIGHBORLY URBAN PARTITIONAlong with addressing these functional needs, the design team also had to
consider the "holistic human perspective," as Prof. Jensen described it. A tall, solid wall full of slowly evaporating water may bring functional benefits, but it would not be a welcome presence in people’s front yards. “We had meetings with residents early in the project,” explains Prof. Jensen. “Some of them feared [the screen] would make their community feel like a prison.”
The residents’ concerns were a reminder that a neighborhood’s “furniture” must serve as architecture, not just infrastructure. This is why the urban green screen’s steel frame and mineral wool blocks are mostly invisible. It looks like a wooden fence, not a metal and masonry wall. The screen is also equipped with benches for sitting and with meadow vegetation. Two windows give a look to the street, and a window at each end of the screen gives security for pedestrians so they can see what is going on around the corner when passing. Achieving this design, which meets water management goals while being both attractive and structurally sound, was a challenge for the project team.
“I am a civil engineer,” says Ulbak. “I know a lot about how to evaporate water! But we had to address other problems. We had meetings where some people asked, ‘Can you just put up a glass wall?’ They were concerned about not being able to see the street. But the project brief was to make a wall that disperses water, and you cannot evaporate much water from glass,” he explains. “These are some of the obstacles we met. Each step forward could take months of back-and-forth toward a better solution.”
» A “WILLOW BUILDING” TO CONCEAL A DRAINAGE SYSTEMAt this point, consulting structural engineer and simulation specialist Tim Larsen, TL-Engineering, joined the project. His skills and experience with infrastructure projects helped the team address the green screen's multiple challenges. “When I first joined the project, there were a lot of ideas on the table. They presented me with some architectural drawings of a design that would not stand if the wind was blowing,” Larsen recalls. “I proposed a completely steel structure, but I was told that the community could not accept that. This is when I suggested reaching out to Pilebyg.”
Pilebyg’s name combines the Danish words for “willow” and “building,”
and they have been building innovative structures from willow trees for more than 30 years. Their process involves cultivating willows so that their trunks grow into relatively uniform curved shapes. The harvested trunks can then be “woven” around a support frame made from steel or other types of wood (Figure 4). Special treatment enables the willow sheathing to last for decades, both protecting the structure and helping it complement the landscape. “You would not call a tree ugly because it is old,” says Vibe Gro, Pilebyg's co-owner and project manager for the green screen project. “We offer a façade that can age beautifully.”
» SIMULATION SUPPORTS THE DESIGN/BUILD PROCESSPilebyg noise barriers have become a familiar site along Danish highways, but the company had never before built a fence that concealed a drainage/evaporation system. To help combine multiple materials and functions into a robust and harmonious structure, Tim Larsen, who has a master's degree in civil engineering, developed simulations using the COMSOL Multiphysics® software (Figure 5).
“It was funny, because Tim was not part of the project when we started, but his work was essential to our reaching a viable solution,” explains Ulbak. He likens the use of simulation to looking at instructions for building a set of toys; the project stakeholders were able to look at the simulation results and tell how all of the pieces of their project fit together.
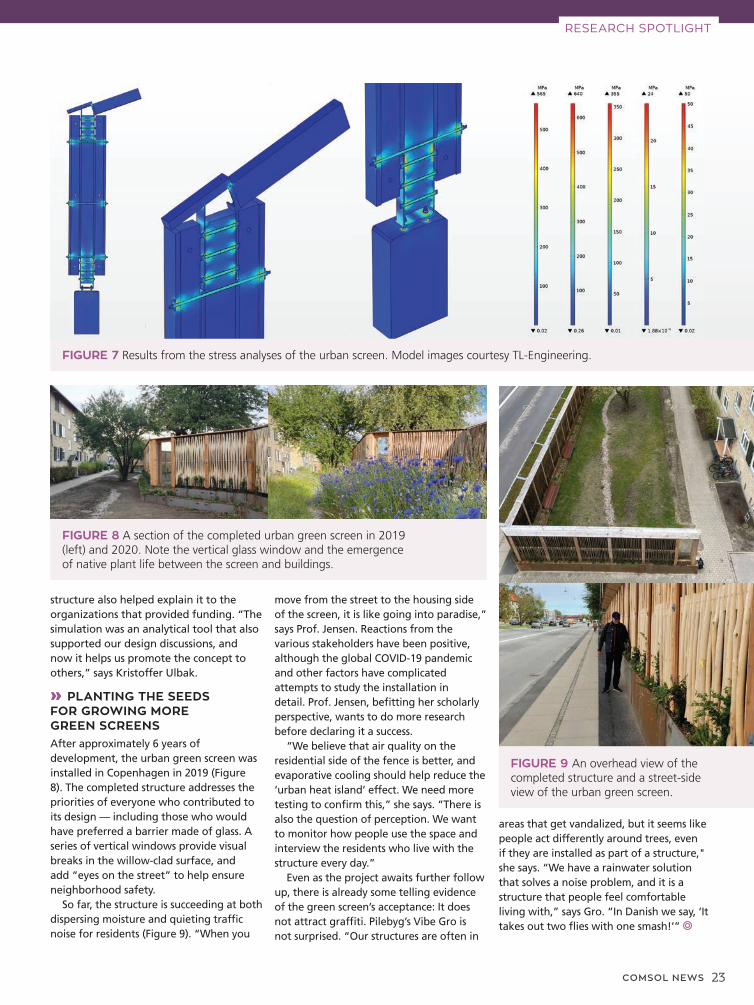
Tim Larsen used simulation to ensure that the structure was strong enough for Copenhagen's climate (Figures 6–7). Multiphysics analysis helped verify that it could withstand wind pressure, the varying loads resulting from water flowing through its porous exterior, and water saturating its mineral wool core.
“There are a lot of materials involved in a structure like this, and small changes can have a big impact," says Larsen. “A little overhang on the top does not look like much, but when it fills with water, it can create a heavy bending moment, especially when the wind is blowing,” he explains.
As the project moved closer to completion, images from the COMSOL models were shared with other stakeholders. The same schematics provided to the crews building the
FIGURE 5 An illustration of the final design for the urban green screen. A steel footing and structural frame supports the willow-sheathed mineral wool blocks and roof/gutter assembly. Image courtesy TL-Engineering.
FIGURE 6 The urban green screen model geometry. Images courtesy TL-Engineering.
RESEARCH SPOTLIGHT
COMSOL NEWS 23
structure also helped explain it to the organizations that provided funding. “The simulation was an analytical tool that also supported our design discussions, and now it helps us promote the concept to others,” says Kristoffer Ulbak.
» PLANTING THE SEEDS FOR GROWING MORE GREEN SCREENSAfter approximately 6 years of development, the urban green screen was installed in Copenhagen in 2019 (Figure 8). The completed structure addresses the priorities of everyone who contributed to its design — including those who would have preferred a barrier made of glass. A series of vertical windows provide visual breaks in the willow-clad surface, and add “eyes on the street” to help ensure neighborhood safety.
So far, the structure is succeeding at both dispersing moisture and quieting traffic noise for residents (Figure 9). “When you
move from the street to the housing side of the screen, it is like going into paradise,” says Prof. Jensen. Reactions from the various stakeholders have been positive, although the global COVID-19 pandemic and other factors have complicated attempts to study the installation in detail. Prof. Jensen, befitting her scholarly perspective, wants to do more research before declaring it a success.
“We believe that air quality on the residential side of the fence is better, and evaporative cooling should help reduce the ‘urban heat island’ effect. We need more testing to confirm this,” she says. “There is also the question of perception. We want to monitor how people use the space and interview the residents who live with the structure every day.”
Even as the project awaits further follow up, there is already some telling evidence of the green screen’s acceptance: It does not attract graffiti. Pilebyg’s Vibe Gro is not surprised. “Our structures are often in
areas that get vandalized, but it seems like people act differently around trees, even if they are installed as part of a structure," she says. “We have a rainwater solution that solves a noise problem, and it is a structure that people feel comfortable living with,” says Gro. “In Danish we say, ‘It takes out two flies with one smash!’”
FIGURE 7 Results from the stress analyses of the urban screen. Model images courtesy TL-Engineering.
RESEARCH SPOTLIGHT
FIGURE 8 A section of the completed urban green screen in 2019 (left) and 2020. Note the vertical glass window and the emergence of native plant life between the screen and buildings.
FIGURE 9 An overhead view of the completed structure and a street-side view of the urban green screen.
24 COMSOL NEWS
SIMULATION-BASED PRODUCT DEVELOPMENT
Recent advancements for pacemaker technology now include improved electronics and smaller batteries, making the development of leadless cardiac pacemakers (LCPs) possible. An LCP is a self-contained (capsule-like) generator and electrode system that eliminates the need for pocket or transvenous leads that often cause malfunctions. The current LCPs on the market pace at a single location of the heart, but for patients who require more than single-chamber stimulation, a multinode LCP system (Figure 1) can be used. Multinode LCP systems require synchronization between all of the implanted devices to function properly. However, the standard communication techniques used may be unsuitable due to constraints in terms of power consumption and size.
To help make the system and communication more efficient, researchers at MicroPort CRM are using simulation to investigate these design challenges using galvanic intrabody communication (IBC). IBC provides a power-optimized solution to facilitate communication between devices, which in turn helps to synchronize multinode LCP systems.
» INTRABODY COMMUNICATION TRANSCEIVERS FOR LCP APPLICATIONSIntrabody communication (IBC) is a near-field communication method that uses an electrode pair to send an impulse through body tissue to a second electrode pair that receives the signal. This method works with ultralow power, and no additional antennas are needed because the electrodes used for pacing also provide the electric field for the communication.
Mirko Maldari, an electronic engineer at MicroPort CRM, and his team proposed a new methodology to further characterize these types of communication channels. "With IBC, because electrodes are used to communicate [instead of coils and antennas], we can optimize both power consumption and size," said Maldari. In their research, an in vivo study was performed using a system that consisted of two capsules that were implanted in the right atrium and right ventricle of a heart (shown in Figure 1). Further analyses involved the COMSOL Multiphysics®
software to measure the attenuation of the channel and estimate how much power is dissipated in the tissue.
» ANALYZING IBC PATHLOSS WITH SIMULATIONThe team at MicroPort collaborated with Synopsys Inc., an electronic design automation company, using the Synopsys Simpleware™ software to develop a model of a human torso that would be importable into the COMSOL Multiphysics® software (Figure 3). The model is based on a validated human phantom from IT'IS Foundation Zurich; more specifically, the "Duke" model, which represents a 34-year-old male.
The geometrical model was created to include organs, muscles, bones, soft tissue, and cartilage. After importing into COMSOL Multiphysics, an approximated version of the heart chambers was built to distinguish heart muscle from blood. Maldari said: "It was important for my application for these features to be included because they have different electrical properties." The team then designed two identical LCP capsules to estimate the attenuation levels of the intracardiac channel.
The capsules were studied at two different orientations, both at a channel distance of 9 cm. Simulations were performed with a quasistatic approach to
MicroPort CRM, France
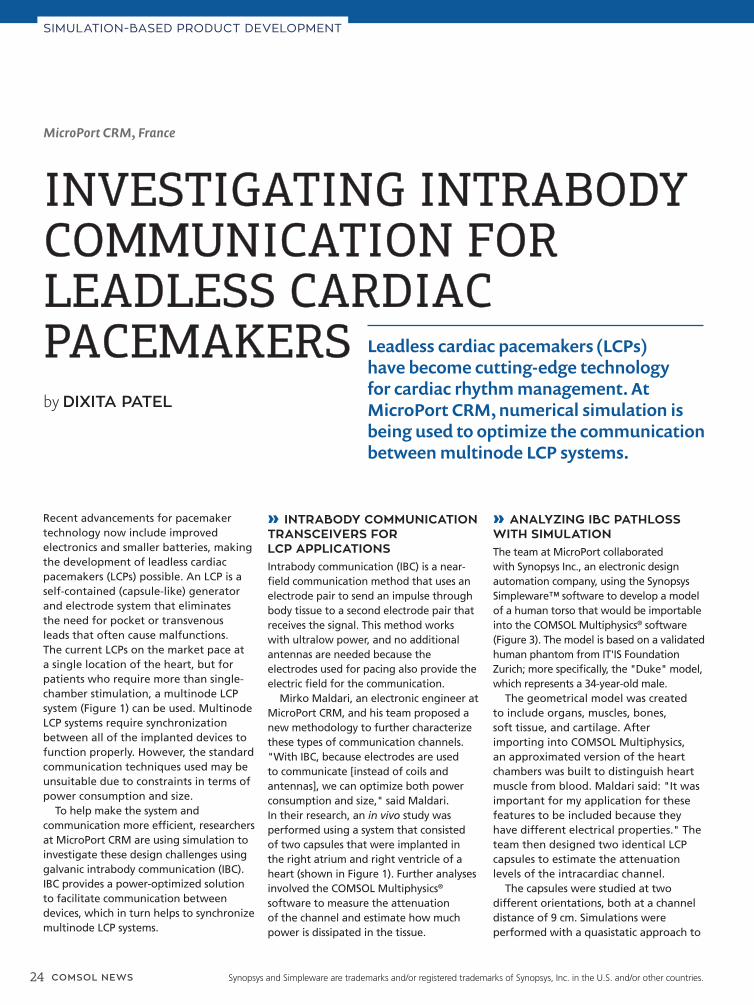
INVESTIGATING INTRABODY INVESTIGATING INTRABODY COMMUNICATION FOR COMMUNICATION FOR LEADLESS CARDIAC LEADLESS CARDIAC PACEMAKERS PACEMAKERS by DIXITA PATEL
Leadless cardiac pacemakers (LCPs) have become cutting-edge technology for cardiac rhythm management. At MicroPort CRM, numerical simulation is being used to optimize the communication between multinode LCP systems.
Synopsys and Simpleware are trademarks and/or registered trademarks of Synopsys, Inc. in the U.S. and/or other countries.
COMSOL NEWS 25
For MicroPort, it was important to estimate the attenuation levels before preparing the prototype. "As researchers and scientists, we try to reduce the amount of animal trials, and simulation has allowed that," said Maldari. "It is a powerful tool to estimate the behavior of the signals within biological tissues before investigating them experimentally." The use of simulation allowed the team to define accurate models for galvanic IBC communication and optimize transceivers for LCP systems.
» FUTURE PLANS FOR IBCMicroPort's future plans involve further studies, where the effect of certain input parameters — such as the electrode size
and dipole lengths — on a more complete set of electric field parameters will be investigated. This would help them point out the attenuation difference between diastolic and systolic periods. As of now, the researchers are working on the design of an ultralow power receiver for LCP synchronization purposes. The new receiver could potentially mark groundbreaking innovation for dual-chamber pacemakers.
SIMULATION-BASED PRODUCT DEVELOPMENT
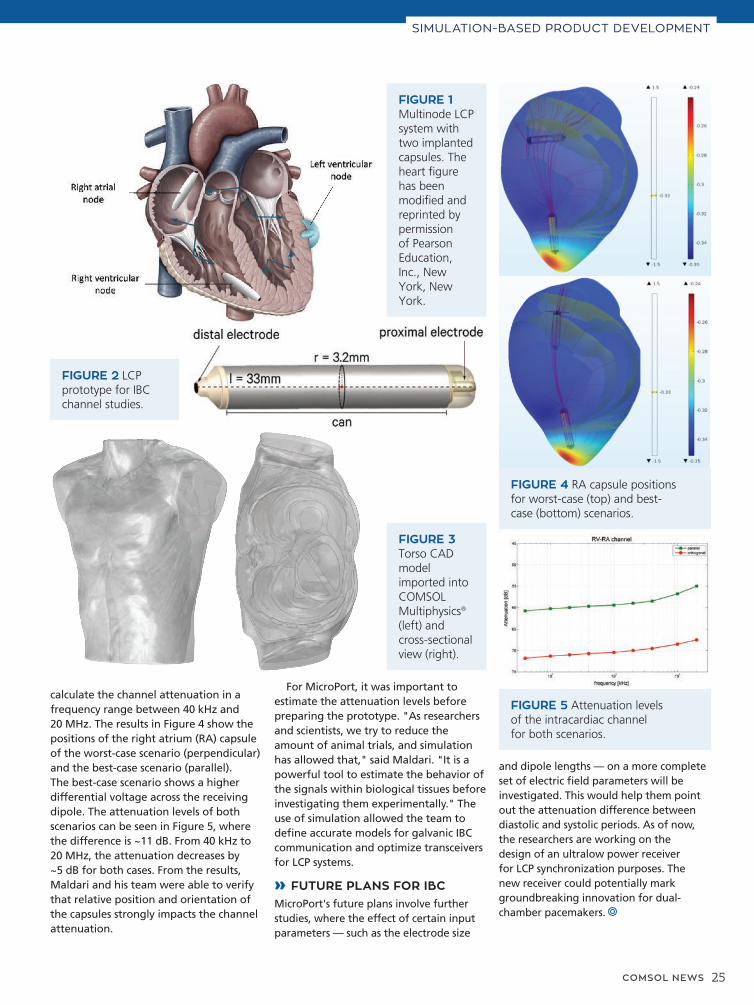
calculate the channel attenuation in a frequency range between 40 kHz and 20 MHz. The results in Figure 4 show the positions of the right atrium (RA) capsule of the worst-case scenario (perpendicular) and the best-case scenario (parallel). The best-case scenario shows a higher differential voltage across the receiving dipole. The attenuation levels of both scenarios can be seen in Figure 5, where the difference is ~11 dB. From 40 kHz to 20 MHz, the attenuation decreases by ~5 dB for both cases. From the results, Maldari and his team were able to verify that relative position and orientation of the capsules strongly impacts the channel attenuation.
FIGURE 2 LCP prototype for IBC channel studies.
FIGURE 1 Multinode LCP system with two implanted capsules. The heart figure has been modified and reprinted by permission of Pearson Education, Inc., New York, New York.
FIGURE 3 Torso CAD model imported into COMSOL Multiphysics® (left) and cross-sectional view (right).
FIGURE 4 RA capsule positions for worst-case (top) and best-case (bottom) scenarios.
FIGURE 5 Attenuation levels of the intracardiac channel for both scenarios.
26 COMSOL NEWS
DESIGN OPTIMIZATION
Physixfactor, Netherlands
PRODUCING POWER, PRODUCING POWER, PROTECTING FISH WITH A PROTECTING FISH WITH A DARRIEUS WATER TURBINEDARRIEUS WATER TURBINE
by ALAN PETRILLO
The Netherlands employs coastal flood control structures that could also be used to harness tidal power. Strict national and European regulations drive new turbine designs that are inherently safe for fish passage. To develop such a rotor design for client Water2Energy, Physixfactor used simulation to adapt a Darrieus wind turbine for water use. Compared to conventional hydropower turbines, experiments show that the Water2Energy vertical-axis design reduces fish mortality rates from 20% to less than 1%.
“Here in the Netherlands, we are pretty close to the sea,” says Helger van Halewijn, who then smiles at his understatement. The North Sea (Noordzee) and the Dutch are inseparable. From this intimate and turbulent relationship, the people of the Netherlands have learned to be resilient, and also flexible. Rather than fighting with the water, it has long been wiser to negotiate a wary truce. The famous Dutch landscape of dykes, canals, and polders does not stop the sea, so much as it redirects water flow into something manageable — and useful.
This resourcefulness lives on in modern Dutch infrastructure projects and in the people who make them possible. “We not only want to use our dykes for flood protection. We can also use them to address the need for energy and to protect fish and the environment,” says Van Halewijn, the director of engineering design consultancy Physixfactor. To achieve these goals, Dutch company Water2Energy turned to Van Halewijn to support the modeling of their vertical-axis water turbine (VAWT) for use in flood-control structures. Using multiphysics simulation, he optimized the Water2Energy VAWT to produce more electric power while minimizing potential harm to sea life.
The technology of this tidal power project may be modern, as is its emphasis on environmental protection, but its roots run deep into the vulnerable (but carefully guarded) Dutch soil.
» ZEELAND AND THE DELTA WORKS: PROTECTING A PRECARIOUS PLACEIf any region of the Netherlands can be considered closest to
(and most affected by) the sea, it may be the section with “sea” in its name: Zeeland. The westernmost and least populated Dutch province is also a river delta, where the Scheldt, Meuse, and Rhine all flow into the North Sea. More than one third of Zeeland’s total area is water. Its Latin motto of luctor et emergo, or “I struggle and emerge,” is illustrated on Zeeland’s coat of arms by a lion rising out of the waves.
Even by Dutch standards, Zeeland is especially vulnerable to North Sea storms, and the 1953 storm known today as Watersnoodramp permanently reshaped the region. A combination of winds, tides, and storm surge caused the sea level to rise more than 4 meters above average, breaching dykes and
inundating 165,000 hectares of land. More than 1800 people were killed and tens of thousands were forced to flee the area. The Netherlands responded by building a sophisticated system of dams and barriers throughout the delta region.
In the Dutch tradition, these Deltawerken, or Delta Works, did not completely wall off the sea from the land. The need for protection against periodic storms had to be balanced against the region’s everyday needs, including fishery and river access to the major ports of Rotterdam and Antwerp, Belgium. Therefore, the Delta Works combined some fixed barriers with other semiopen structures, closing only when there is a threatening storm surge.
COMSOL NEWS 27
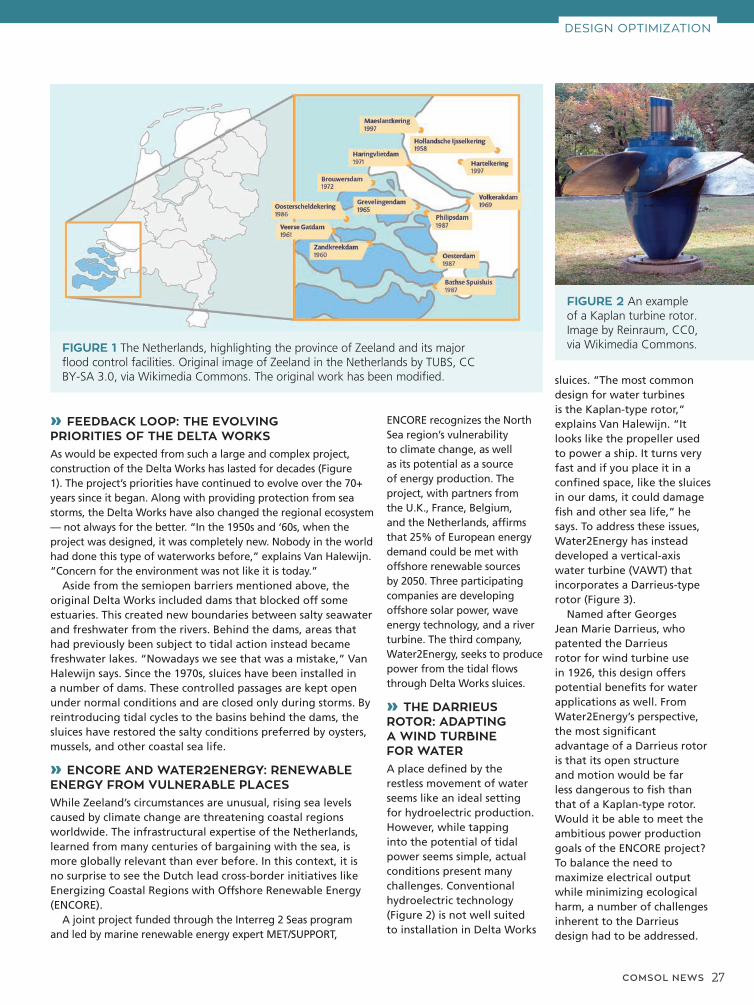
» FEEDBACK LOOP: THE EVOLVING PRIORITIES OF THE DELTA WORKSAs would be expected from such a large and complex project, construction of the Delta Works has lasted for decades (Figure 1). The project’s priorities have continued to evolve over the 70+ years since it began. Along with providing protection from sea storms, the Delta Works have also changed the regional ecosystem — not always for the better. “In the 1950s and ‘60s, when the project was designed, it was completely new. Nobody in the world had done this type of waterworks before,” explains Van Halewijn. “Concern for the environment was not like it is today.”
Aside from the semiopen barriers mentioned above, the original Delta Works included dams that blocked off some estuaries. This created new boundaries between salty seawater and freshwater from the rivers. Behind the dams, areas that had previously been subject to tidal action instead became freshwater lakes. “Nowadays we see that was a mistake,” Van Halewijn says. Since the 1970s, sluices have been installed in a number of dams. These controlled passages are kept open under normal conditions and are closed only during storms. By reintroducing tidal cycles to the basins behind the dams, the sluices have restored the salty conditions preferred by oysters, mussels, and other coastal sea life.
» ENCORE AND WATER2ENERGY: RENEWABLE ENERGY FROM VULNERABLE PLACESWhile Zeeland’s circumstances are unusual, rising sea levels caused by climate change are threatening coastal regions worldwide. The infrastructural expertise of the Netherlands, learned from many centuries of bargaining with the sea, is more globally relevant than ever before. In this context, it is no surprise to see the Dutch lead cross-border initiatives like Energizing Coastal Regions with Offshore Renewable Energy (ENCORE).
A joint project funded through the Interreg 2 Seas program and led by marine renewable energy expert MET/SUPPORT,
ENCORE recognizes the North Sea region’s vulnerability to climate change, as well as its potential as a source of energy production. The project, with partners from the U.K., France, Belgium, and the Netherlands, affirms that 25% of European energy demand could be met with offshore renewable sources by 2050. Three participating companies are developing offshore solar power, wave energy technology, and a river turbine. The third company, Water2Energy, seeks to produce power from the tidal flows through Delta Works sluices.
» THE DARRIEUS ROTOR: ADAPTING A WIND TURBINE FOR WATERA place defined by the restless movement of water seems like an ideal setting for hydroelectric production. However, while tapping into the potential of tidal power seems simple, actual conditions present many challenges. Conventional hydroelectric technology (Figure 2) is not well suited to installation in Delta Works
sluices. “The most common design for water turbines is the Kaplan-type rotor,” explains Van Halewijn. “It looks like the propeller used to power a ship. It turns very fast and if you place it in a confined space, like the sluices in our dams, it could damage fish and other sea life,” he says. To address these issues, Water2Energy has instead developed a vertical-axis water turbine (VAWT) that incorporates a Darrieus-type rotor (Figure 3).
Named after Georges Jean Marie Darrieus, who patented the Darrieus rotor for wind turbine use in 1926, this design offers potential benefits for water applications as well. From Water2Energy’s perspective, the most significant advantage of a Darrieus rotor is that its open structure and motion would be far less dangerous to fish than that of a Kaplan-type rotor. Would it be able to meet the ambitious power production goals of the ENCORE project? To balance the need to maximize electrical output while minimizing ecological harm, a number of challenges inherent to the Darrieus design had to be addressed.
FIGURE 2 An example of a Kaplan turbine rotor. Image by Reinraum, CC0, via Wikimedia Commons.
DESIGN OPTIMIZATION
FIGURE 1 The Netherlands, highlighting the province of Zeeland and its major flood control facilities. Original image of Zeeland in the Netherlands by TUBS, CC BY-SA 3.0, via Wikimedia Commons. The original work has been modified.
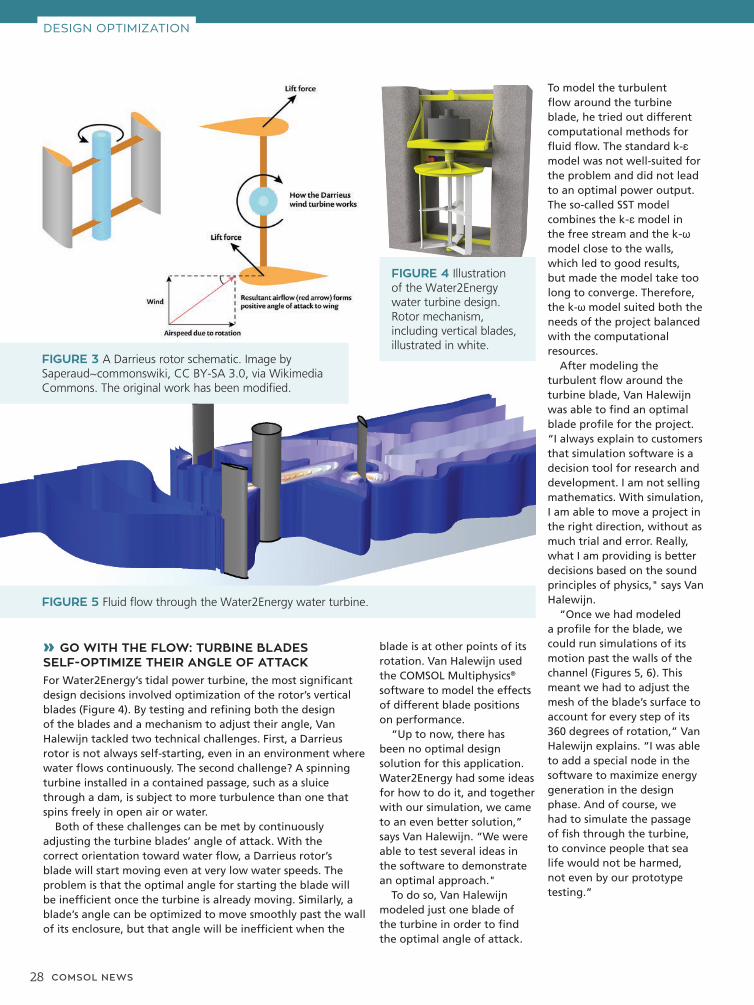
28 COMSOL NEWS
» GO WITH THE FLOW: TURBINE BLADES SELF-OPTIMIZE THEIR ANGLE OF ATTACKFor Water2Energy’s tidal power turbine, the most significant design decisions involved optimization of the rotor’s vertical blades (Figure 4). By testing and refining both the design of the blades and a mechanism to adjust their angle, Van Halewijn tackled two technical challenges. First, a Darrieus rotor is not always self-starting, even in an environment where water flows continuously. The second challenge? A spinning turbine installed in a contained passage, such as a sluice through a dam, is subject to more turbulence than one that spins freely in open air or water.
Both of these challenges can be met by continuously adjusting the turbine blades’ angle of attack. With the correct orientation toward water flow, a Darrieus rotor’s blade will start moving even at very low water speeds. The problem is that the optimal angle for starting the blade will be inefficient once the turbine is already moving. Similarly, a blade’s angle can be optimized to move smoothly past the wall of its enclosure, but that angle will be inefficient when the
blade is at other points of its rotation. Van Halewijn used the COMSOL Multiphysics® software to model the effects of different blade positions on performance.
“Up to now, there has been no optimal design solution for this application. Water2Energy had some ideas for how to do it, and together with our simulation, we came to an even better solution,” says Van Halewijn. “We were able to test several ideas in the software to demonstrate an optimal approach."
To do so, Van Halewijn modeled just one blade of the turbine in order to find the optimal angle of attack.
To model the turbulent flow around the turbine blade, he tried out different computational methods for fluid flow. The standard k-ε model was not well-suited for the problem and did not lead to an optimal power output. The so-called SST model combines the k-ε model in the free stream and the k-ω model close to the walls, which led to good results, but made the model take too long to converge. Therefore, the k-ω model suited both the needs of the project balanced with the computational resources.
After modeling the turbulent flow around the turbine blade, Van Halewijn was able to find an optimal blade profile for the project. “I always explain to customers that simulation software is a decision tool for research and development. I am not selling mathematics. With simulation, I am able to move a project in the right direction, without as much trial and error. Really, what I am providing is better decisions based on the sound principles of physics," says Van Halewijn.
“Once we had modeled a profile for the blade, we could run simulations of its motion past the walls of the channel (Figures 5, 6). This meant we had to adjust the mesh of the blade’s surface to account for every step of its 360 degrees of rotation,” Van Halewijn explains. “I was able to add a special node in the software to maximize energy generation in the design phase. And of course, we had to simulate the passage of fish through the turbine, to convince people that sea life would not be harmed, not even by our prototype testing.”
FIGURE 3 A Darrieus rotor schematic. Image by Saperaud~commonswiki, CC BY-SA 3.0, via Wikimedia Commons. The original work has been modified.
FIGURE 4 Illustration of the Water2Energy water turbine design. Rotor mechanism, including vertical blades, illustrated in white.
FIGURE 5 Fluid flow through the Water2Energy water turbine.
DESIGN OPTIMIZATION
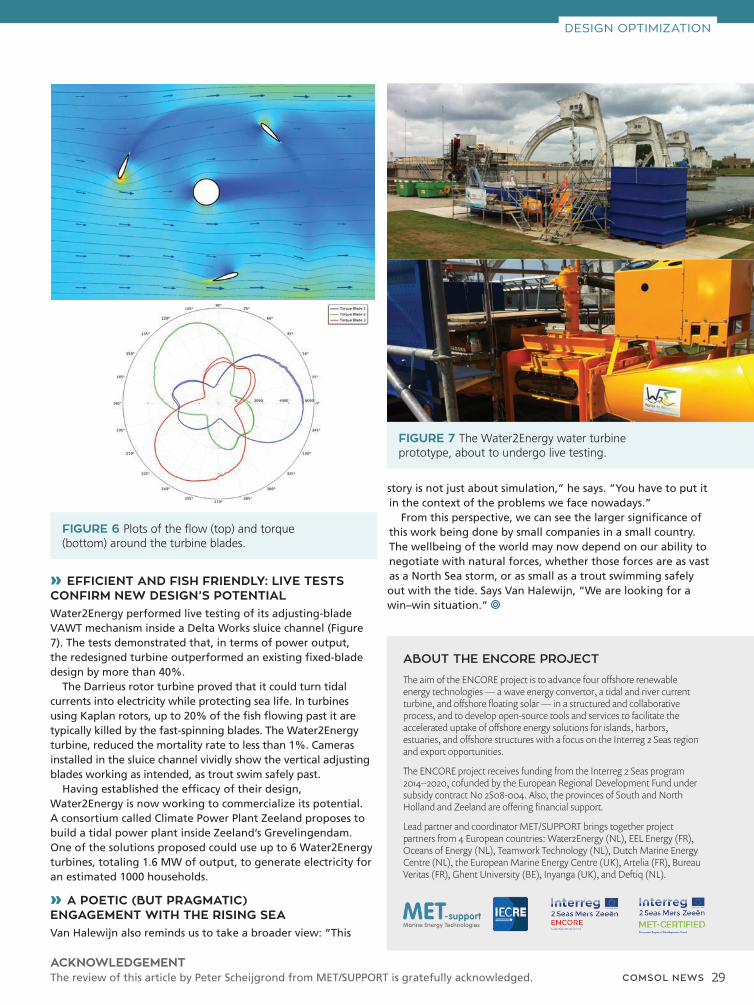
COMSOL NEWS 29
» EFFICIENT AND FISH FRIENDLY: LIVE TESTS CONFIRM NEW DESIGN’S POTENTIALWater2Energy performed live testing of its adjusting-blade VAWT mechanism inside a Delta Works sluice channel (Figure 7). The tests demonstrated that, in terms of power output, the redesigned turbine outperformed an existing fixed-blade design by more than 40%.
The Darrieus rotor turbine proved that it could turn tidal currents into electricity while protecting sea life. In turbines using Kaplan rotors, up to 20% of the fish flowing past it are typically killed by the fast-spinning blades. The Water2Energy turbine, reduced the mortality rate to less than 1%. Cameras installed in the sluice channel vividly show the vertical adjusting blades working as intended, as trout swim safely past.
Having established the efficacy of their design, Water2Energy is now working to commercialize its potential. A consortium called Climate Power Plant Zeeland proposes to build a tidal power plant inside Zeeland’s Grevelingendam. One of the solutions proposed could use up to 6 Water2Energy turbines, totaling 1.6 MW of output, to generate electricity for an estimated 1000 households.
» A POETIC (BUT PRAGMATIC) ENGAGEMENT WITH THE RISING SEAVan Halewijn also reminds us to take a broader view: “This
The aim of the ENCORE project is to advance four offshore renewable energy technologies — a wave energy convertor, a tidal and river current turbine, and offshore floating solar — in a structured and collaborative process, and to develop open-source tools and services to facilitate the accelerated uptake of offshore energy solutions for islands, harbors, estuaries, and offshore structures with a focus on the Interreg 2 Seas region and export opportunities.
The ENCORE project receives funding from the Interreg 2 Seas program 2014–2020, cofunded by the European Regional Development Fund under subsidy contract No 2S08-004. Also, the provinces of South and North Holland and Zeeland are offering financial support.
Lead partner and coordinator MET/SUPPORT brings together project partners from 4 European countries: Water2Energy (NL), EEL Energy (FR), Oceans of Energy (NL), Teamwork Technology (NL), Dutch Marine Energy Centre (NL), the European Marine Energy Centre (UK), Artelia (FR), Bureau Veritas (FR), Ghent University (BE), Inyanga (UK), and Deftiq (NL).
ABOUT THE ENCORE PROJECT
story is not just about simulation,” he says. “You have to put it in the context of the problems we face nowadays.”
From this perspective, we can see the larger significance of this work being done by small companies in a small country. The wellbeing of the world may now depend on our ability to negotiate with natural forces, whether those forces are as vast as a North Sea storm, or as small as a trout swimming safely out with the tide. Says Van Halewijn, “We are looking for a win–win situation.”
FIGURE 6 Plots of the flow (top) and torque (bottom) around the turbine blades.
FIGURE 7 The Water2Energy water turbine prototype, about to undergo live testing.
ACKNOWLEDGEMENT The review of this article by Peter Scheijgrond from MET/SUPPORT is gratefully acknowledged.
DESIGN OPTIMIZATION
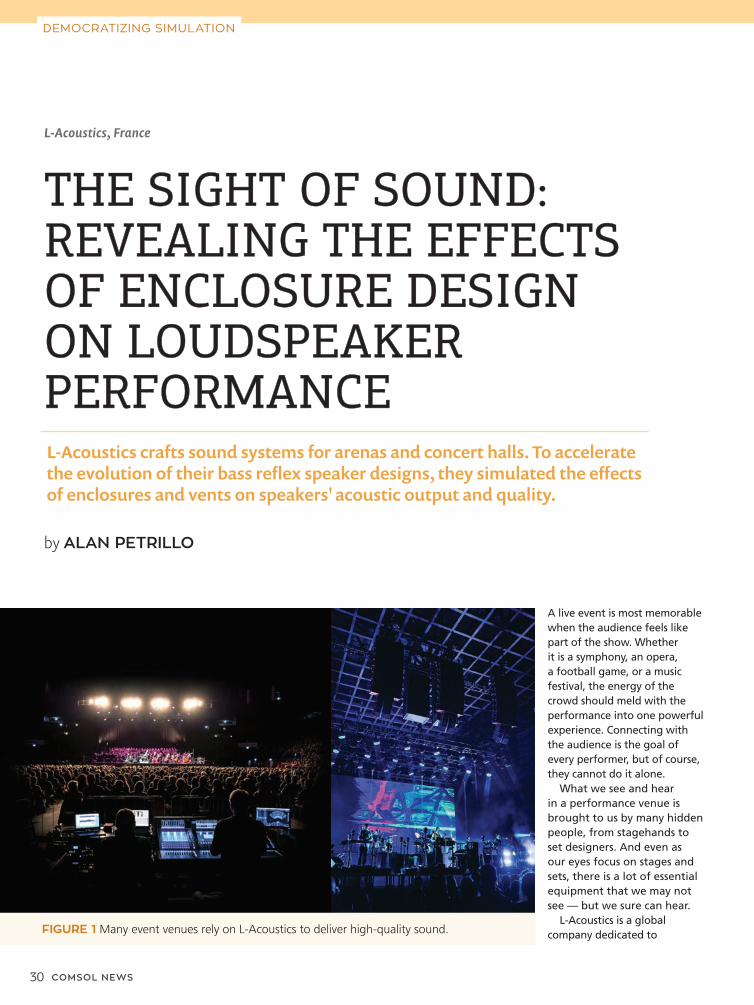
30 COMSOL NEWS
L-Acoustics, France
THE SIGHT OF SOUND: THE SIGHT OF SOUND: REVEALING THE EFFECTS REVEALING THE EFFECTS OF ENCLOSURE DESIGN OF ENCLOSURE DESIGN ON LOUDSPEAKER ON LOUDSPEAKER PERFORMANCEPERFORMANCE
by ALAN PETRILLO
L-Acoustics crafts sound systems for arenas and concert halls. To accelerate the evolution of their bass reflex speaker designs, they simulated the effects of enclosures and vents on speakers' acoustic output and quality.
A live event is most memorable when the audience feels like part of the show. Whether it is a symphony, an opera, a football game, or a music festival, the energy of the crowd should meld with the performance into one powerful experience. Connecting with the audience is the goal of every performer, but of course, they cannot do it alone.
What we see and hear in a performance venue is brought to us by many hidden people, from stagehands to set designers. And even as our eyes focus on stages and sets, there is a lot of essential equipment that we may not see — but we sure can hear.
L-Acoustics is a global company dedicated to
DEMOCRATIZING SIMULATION
FIGURE 1 Many event venues rely on L-Acoustics to deliver high-quality sound.
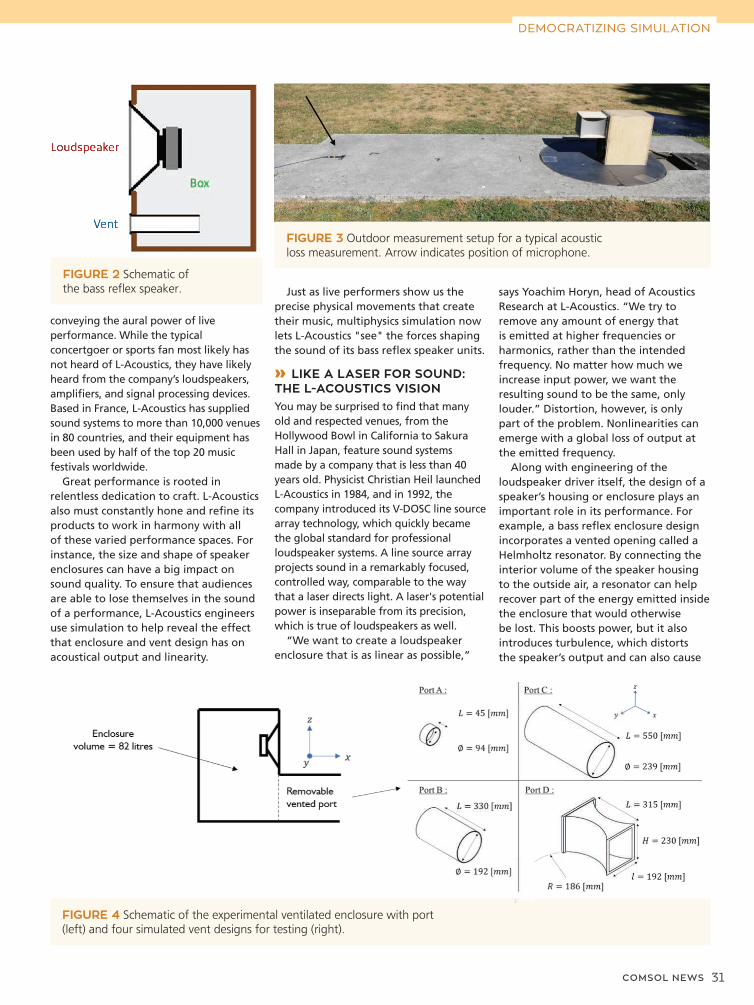
COMSOL NEWS 31
conveying the aural power of live performance. While the typical concertgoer or sports fan most likely has not heard of L-Acoustics, they have likely heard from the company’s loudspeakers, amplifiers, and signal processing devices. Based in France, L-Acoustics has supplied sound systems to more than 10,000 venues in 80 countries, and their equipment has been used by half of the top 20 music festivals worldwide.
Great performance is rooted in relentless dedication to craft. L-Acoustics also must constantly hone and refine its products to work in harmony with all of these varied performance spaces. For instance, the size and shape of speaker enclosures can have a big impact on sound quality. To ensure that audiences are able to lose themselves in the sound of a performance, L-Acoustics engineers use simulation to help reveal the effect that enclosure and vent design has on acoustical output and linearity.
Just as live performers show us the precise physical movements that create their music, multiphysics simulation now lets L-Acoustics "see" the forces shaping the sound of its bass reflex speaker units.
» LIKE A LASER FOR SOUND: THE L-ACOUSTICS VISIONYou may be surprised to find that many old and respected venues, from the Hollywood Bowl in California to Sakura Hall in Japan, feature sound systems made by a company that is less than 40 years old. Physicist Christian Heil launched L-Acoustics in 1984, and in 1992, the company introduced its V-DOSC line source array technology, which quickly became the global standard for professional loudspeaker systems. A line source array projects sound in a remarkably focused, controlled way, comparable to the way that a laser directs light. A laser's potential power is inseparable from its precision, which is true of loudspeakers as well.
“We want to create a loudspeaker enclosure that is as linear as possible,”
FIGURE 2 Schematic of the bass reflex speaker. says Yoachim Horyn, head of Acoustics
Research at L-Acoustics. “We try to remove any amount of energy that is emitted at higher frequencies or harmonics, rather than the intended frequency. No matter how much we increase input power, we want the resulting sound to be the same, only louder.” Distortion, however, is only part of the problem. Nonlinearities can emerge with a global loss of output at the emitted frequency.
Along with engineering of the loudspeaker driver itself, the design of a speaker’s housing or enclosure plays an important role in its performance. For example, a bass reflex enclosure design incorporates a vented opening called a Helmholtz resonator. By connecting the interior volume of the speaker housing to the outside air, a resonator can help recover part of the energy emitted inside the enclosure that would otherwise be lost. This boosts power, but it also introduces turbulence, which distorts the speaker’s output and can also cause
DEMOCRATIZING SIMULATION
FIGURE 3 Outdoor measurement setup for a typical acoustic loss measurement. Arrow indicates position of microphone.
FIGURE 4 Schematic of the experimental ventilated enclosure with port (left) and four simulated vent designs for testing (right).
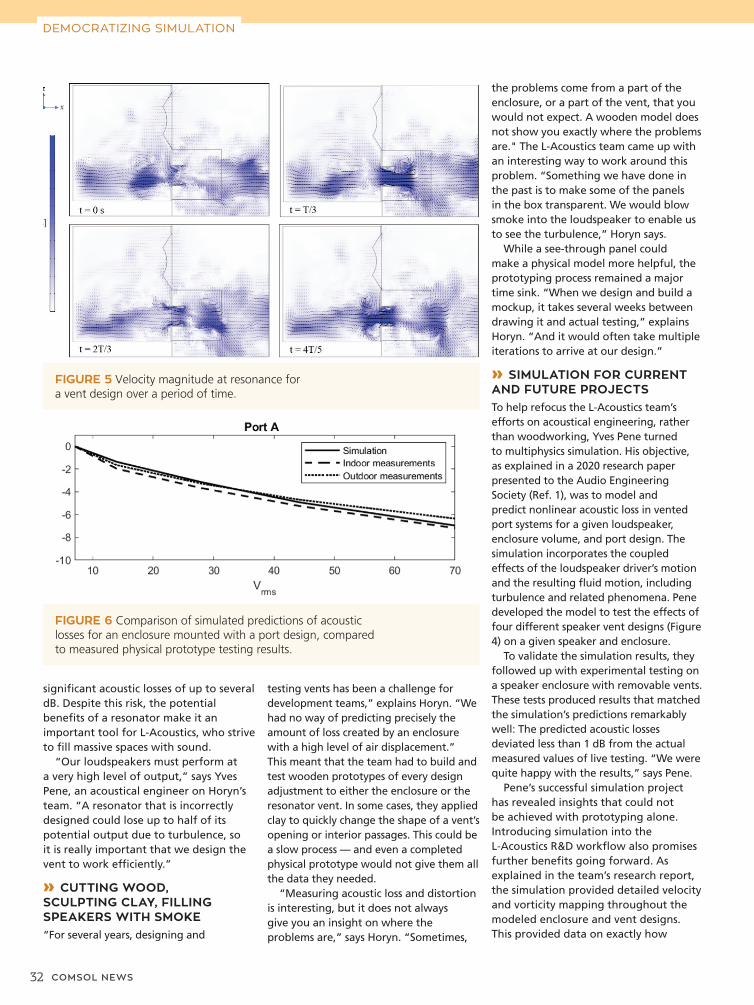
32 COMSOL NEWS
significant acoustic losses of up to several dB. Despite this risk, the potential benefits of a resonator make it an important tool for L-Acoustics, who strive to fill massive spaces with sound.
“Our loudspeakers must perform at a very high level of output,” says Yves Pene, an acoustical engineer on Horyn’s team. “A resonator that is incorrectly designed could lose up to half of its potential output due to turbulence, so it is really important that we design the vent to work efficiently.”
» CUTTING WOOD, SCULPTING CLAY, FILLING SPEAKERS WITH SMOKE“For several years, designing and
testing vents has been a challenge for development teams,” explains Horyn. “We had no way of predicting precisely the amount of loss created by an enclosure with a high level of air displacement.” This meant that the team had to build and test wooden prototypes of every design adjustment to either the enclosure or the resonator vent. In some cases, they applied clay to quickly change the shape of a vent’s opening or interior passages. This could be a slow process — and even a completed physical prototype would not give them all the data they needed.
“Measuring acoustic loss and distortion is interesting, but it does not always give you an insight on where the problems are,” says Horyn. “Sometimes,
the problems come from a part of the enclosure, or a part of the vent, that you would not expect. A wooden model does not show you exactly where the problems are." The L-Acoustics team came up with an interesting way to work around this problem. “Something we have done in the past is to make some of the panels in the box transparent. We would blow smoke into the loudspeaker to enable us to see the turbulence,” Horyn says.
While a see-through panel could make a physical model more helpful, the prototyping process remained a major time sink. “When we design and build a mockup, it takes several weeks between drawing it and actual testing,” explains Horyn. “And it would often take multiple iterations to arrive at our design.”
» SIMULATION FOR CURRENT AND FUTURE PROJECTSTo help refocus the L-Acoustics team’s efforts on acoustical engineering, rather than woodworking, Yves Pene turned to multiphysics simulation. His objective, as explained in a 2020 research paper presented to the Audio Engineering Society (Ref. 1), was to model and predict nonlinear acoustic loss in vented port systems for a given loudspeaker, enclosure volume, and port design. The simulation incorporates the coupled effects of the loudspeaker driver’s motion and the resulting fluid motion, including turbulence and related phenomena. Pene developed the model to test the effects of four different speaker vent designs (Figure 4) on a given speaker and enclosure.
To validate the simulation results, they followed up with experimental testing on a speaker enclosure with removable vents. These tests produced results that matched the simulation’s predictions remarkably well: The predicted acoustic losses deviated less than 1 dB from the actual measured values of live testing. “We were quite happy with the results,” says Pene.
Pene’s successful simulation project has revealed insights that could not be achieved with prototyping alone. Introducing simulation into the L-Acoustics R&D workflow also promises further benefits going forward. As explained in the team’s research report, the simulation provided detailed velocity and vorticity mapping throughout the modeled enclosure and vent designs. This provided data on exactly how
FIGURE 5 Velocity magnitude at resonance for a vent design over a period of time.
FIGURE 6 Comparison of simulated predictions of acoustic losses for an enclosure mounted with a port design, compared to measured physical prototype testing results.
DEMOCRATIZING SIMULATION
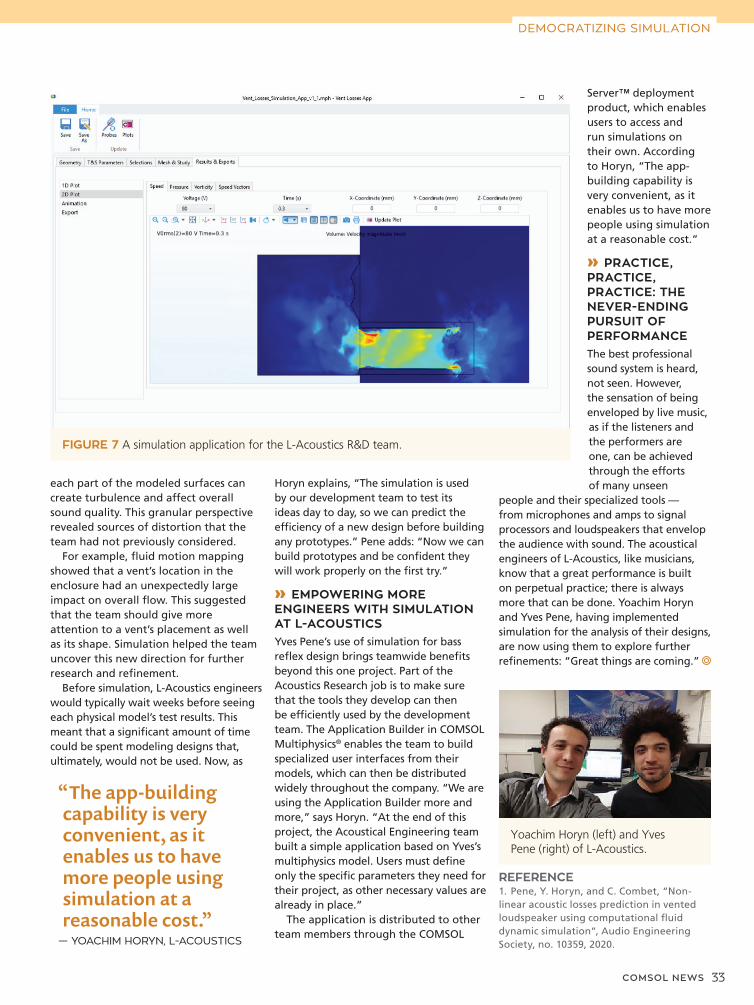
COMSOL NEWS 33
each part of the modeled surfaces can create turbulence and affect overall sound quality. This granular perspective revealed sources of distortion that the team had not previously considered.
For example, fluid motion mapping showed that a vent’s location in the enclosure had an unexpectedly large impact on overall flow. This suggested that the team should give more attention to a vent’s placement as well as its shape. Simulation helped the team uncover this new direction for further research and refinement.
Before simulation, L-Acoustics engineers would typically wait weeks before seeing each physical model’s test results. This meant that a significant amount of time could be spent modeling designs that, ultimately, would not be used. Now, as
Horyn explains, “The simulation is used by our development team to test its ideas day to day, so we can predict the efficiency of a new design before building any prototypes.” Pene adds: “Now we can build prototypes and be confident they will work properly on the first try.”
» EMPOWERING MORE ENGINEERS WITH SIMULATION AT L-ACOUSTICSYves Pene’s use of simulation for bass reflex design brings teamwide benefits beyond this one project. Part of the Acoustics Research job is to make sure that the tools they develop can then be efficiently used by the development team. The Application Builder in COMSOL Multiphysics® enables the team to build specialized user interfaces from their models, which can then be distributed widely throughout the company. “We are using the Application Builder more and more,” says Horyn. “At the end of this project, the Acoustical Engineering team built a simple application based on Yves’s multiphysics model. Users must define only the specific parameters they need for their project, as other necessary values are already in place.”
The application is distributed to other team members through the COMSOL
Server™ deployment product, which enables users to access and run simulations on their own. According to Horyn, “The app-building capability is very convenient, as it enables us to have more people using simulation at a reasonable cost.”
» PRACTICE, PRACTICE, PRACTICE: THE NEVER-ENDING PURSUIT OF PERFORMANCEThe best professional sound system is heard, not seen. However, the sensation of being enveloped by live music, as if the listeners and the performers are one, can be achieved through the efforts of many unseen
people and their specialized tools — from microphones and amps to signal processors and loudspeakers that envelop the audience with sound. The acoustical engineers of L-Acoustics, like musicians, know that a great performance is built on perpetual practice; there is always more that can be done. Yoachim Horyn and Yves Pene, having implemented simulation for the analysis of their designs, are now using them to explore further refinements: “Great things are coming.”
FIGURE 7 A simulation application for the L-Acoustics R&D team.
Yoachim Horyn (left) and Yves Pene (right) of L-Acoustics.
“The app-building capability is very convenient, as it enables us to have more people using simulation at a reasonable cost.”
— YOACHIM HORYN, L-ACOUSTICS
DEMOCRATIZING SIMULATION
REFERENCE1. Pene, Y. Horyn, and C. Combet, “Non-linear acoustic losses prediction in vented loudspeaker using computational fluid dynamic simulation”, Audio Engineering Society, no. 10359, 2020.
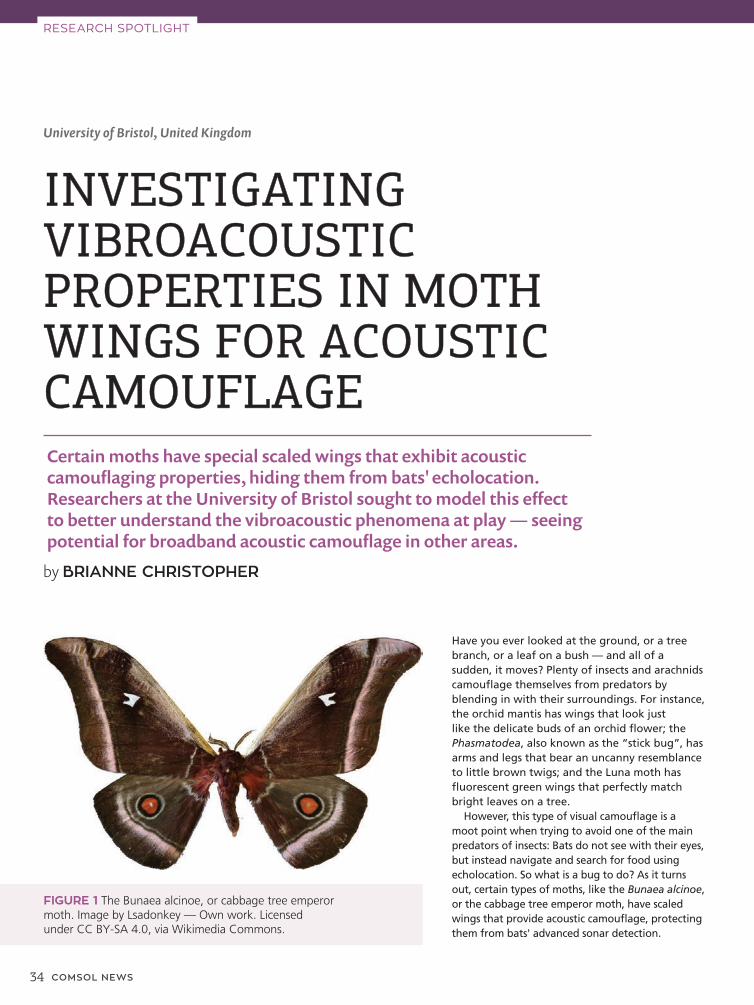
34 COMSOL NEWS
University of Bristol, United Kingdom
INVESTIGATING INVESTIGATING VIBROACOUSTIC VIBROACOUSTIC PROPERTIES IN MOTH PROPERTIES IN MOTH WINGS FOR ACOUSTIC WINGS FOR ACOUSTIC CAMOUFLAGECAMOUFLAGE
by BRIANNE CHRISTOPHER
RESEARCH SPOTLIGHT
Certain moths have special scaled wings that exhibit acoustic camouflaging properties, hiding them from bats' echolocation. Researchers at the University of Bristol sought to model this effect to better understand the vibroacoustic phenomena at play — seeing potential for broadband acoustic camouflage in other areas.
Have you ever looked at the ground, or a tree branch, or a leaf on a bush — and all of a sudden, it moves? Plenty of insects and arachnids camouflage themselves from predators by blending in with their surroundings. For instance, the orchid mantis has wings that look just like the delicate buds of an orchid flower; the Phasmatodea, also known as the “stick bug”, has arms and legs that bear an uncanny resemblance to little brown twigs; and the Luna moth has fluorescent green wings that perfectly match bright leaves on a tree.
However, this type of visual camouflage is a moot point when trying to avoid one of the main predators of insects: Bats do not see with their eyes, but instead navigate and search for food using echolocation. So what is a bug to do? As it turns out, certain types of moths, like the Bunaea alcinoe, or the cabbage tree emperor moth, have scaled wings that provide acoustic camouflage, protecting them from bats' advanced sonar detection.
FIGURE 1 The Bunaea alcinoe, or cabbage tree emperor moth. Image by Lsadonkey — Own work. Licensed under CC BY-SA 4.0, via Wikimedia Commons.
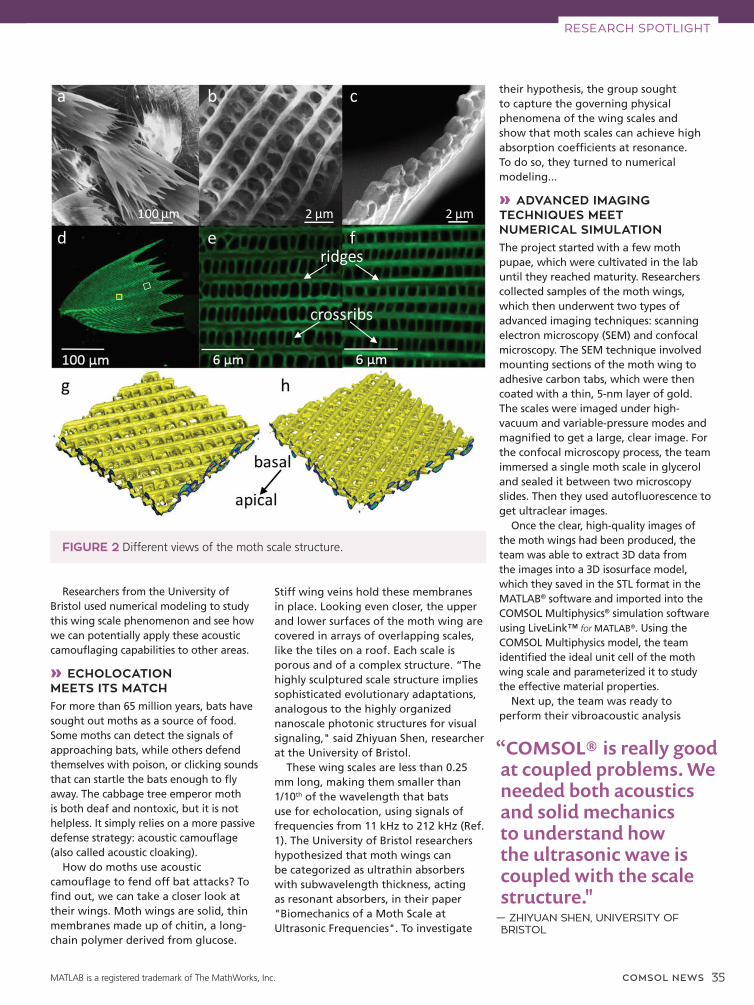
COMSOL NEWS 35
Stiff wing veins hold these membranes in place. Looking even closer, the upper and lower surfaces of the moth wing are covered in arrays of overlapping scales, like the tiles on a roof. Each scale is porous and of a complex structure. “The highly sculptured scale structure implies sophisticated evolutionary adaptations, analogous to the highly organized nanoscale photonic structures for visual signaling," said Zhiyuan Shen, researcher at the University of Bristol.
These wing scales are less than 0.25 mm long, making them smaller than 1/10th of the wavelength that bats use for echolocation, using signals of frequencies from 11 kHz to 212 kHz (Ref. 1). The University of Bristol researchers hypothesized that moth wings can be categorized as ultrathin absorbers with subwavelength thickness, acting as resonant absorbers, in their paper "Biomechanics of a Moth Scale at Ultrasonic Frequencies". To investigate
their hypothesis, the group sought to capture the governing physical phenomena of the wing scales and show that moth scales can achieve high absorption coefficients at resonance. To do so, they turned to numerical modeling...
» ADVANCED IMAGING TECHNIQUES MEET NUMERICAL SIMULATIONThe project started with a few moth pupae, which were cultivated in the lab until they reached maturity. Researchers collected samples of the moth wings, which then underwent two types of advanced imaging techniques: scanning electron microscopy (SEM) and confocal microscopy. The SEM technique involved mounting sections of the moth wing to adhesive carbon tabs, which were then coated with a thin, 5-nm layer of gold. The scales were imaged under high-vacuum and variable-pressure modes and magnified to get a large, clear image. For the confocal microscopy process, the team immersed a single moth scale in glycerol and sealed it between two microscopy slides. Then they used autofluorescence to get ultraclear images.
Once the clear, high-quality images of the moth wings had been produced, the team was able to extract 3D data from the images into a 3D isosurface model, which they saved in the STL format in the MATLAB® software and imported into the COMSOL Multiphysics® simulation software using LiveLink™ for MATLAB®. Using the COMSOL Multiphysics model, the team identified the ideal unit cell of the moth wing scale and parameterized it to study the effective material properties.
Next up, the team was ready to perform their vibroacoustic analysis
Researchers from the University of Bristol used numerical modeling to study this wing scale phenomenon and see how we can potentially apply these acoustic camouflaging capabilities to other areas.
» ECHOLOCATION MEETS ITS MATCHFor more than 65 million years, bats have sought out moths as a source of food. Some moths can detect the signals of approaching bats, while others defend themselves with poison, or clicking sounds that can startle the bats enough to fly away. The cabbage tree emperor moth is both deaf and nontoxic, but it is not helpless. It simply relies on a more passive defense strategy: acoustic camouflage (also called acoustic cloaking).
How do moths use acoustic camouflage to fend off bat attacks? To find out, we can take a closer look at their wings. Moth wings are solid, thin membranes made up of chitin, a long-chain polymer derived from glucose.
FIGURE 2 Different views of the moth scale structure.
RESEARCH SPOTLIGHT
“COMSOL® is really good at coupled problems. We needed both acoustics and solid mechanics to understand how the ultrasonic wave is coupled with the scale structure."
— ZHIYUAN SHEN, UNIVERSITY OF BRISTOL
MATLAB is a registered trademark of The MathWorks, Inc.
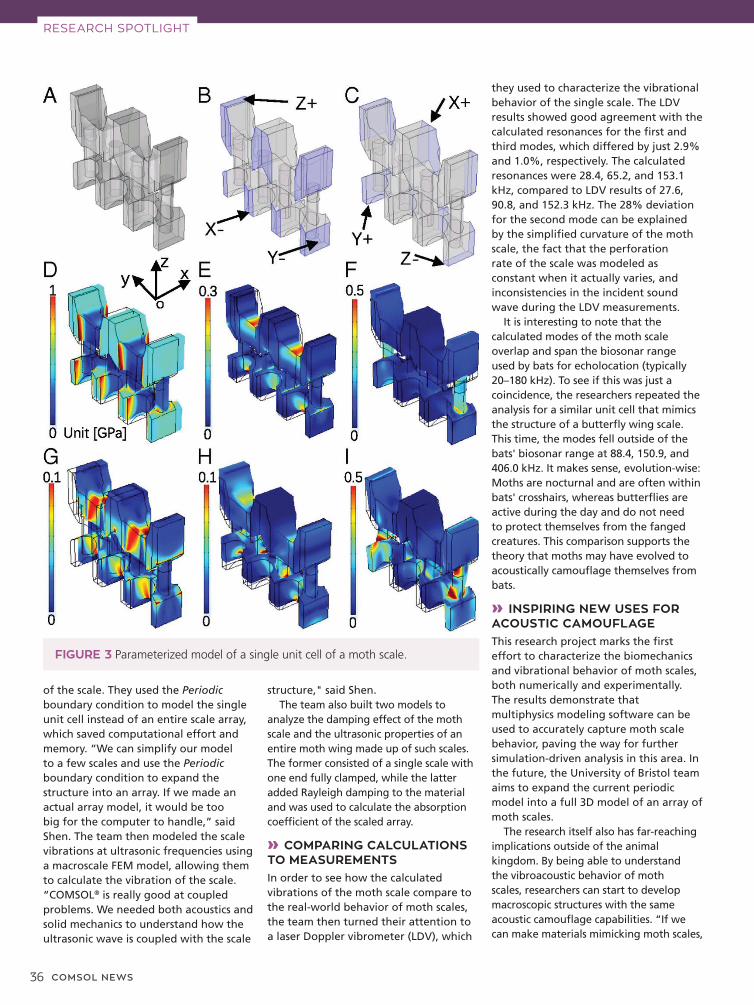
36 COMSOL NEWS
structure," said Shen.The team also built two models to
analyze the damping effect of the moth scale and the ultrasonic properties of an entire moth wing made up of such scales. The former consisted of a single scale with one end fully clamped, while the latter added Rayleigh damping to the material and was used to calculate the absorption coefficient of the scaled array.
» COMPARING CALCULATIONS TO MEASUREMENTSIn order to see how the calculated vibrations of the moth scale compare to the real-world behavior of moth scales, the team then turned their attention to a laser Doppler vibrometer (LDV), which
they used to characterize the vibrational behavior of the single scale. The LDV results showed good agreement with the calculated resonances for the first and third modes, which differed by just 2.9% and 1.0%, respectively. The calculated resonances were 28.4, 65.2, and 153.1 kHz, compared to LDV results of 27.6, 90.8, and 152.3 kHz. The 28% deviation for the second mode can be explained by the simplified curvature of the moth scale, the fact that the perforation rate of the scale was modeled as constant when it actually varies, and inconsistencies in the incident sound wave during the LDV measurements.
It is interesting to note that the calculated modes of the moth scale overlap and span the biosonar range used by bats for echolocation (typically 20–180 kHz). To see if this was just a coincidence, the researchers repeated the analysis for a similar unit cell that mimics the structure of a butterfly wing scale. This time, the modes fell outside of the bats' biosonar range at 88.4, 150.9, and 406.0 kHz. It makes sense, evolution-wise: Moths are nocturnal and are often within bats' crosshairs, whereas butterflies are active during the day and do not need to protect themselves from the fanged creatures. This comparison supports the theory that moths may have evolved to acoustically camouflage themselves from bats.
» INSPIRING NEW USES FOR ACOUSTIC CAMOUFLAGEThis research project marks the first effort to characterize the biomechanics and vibrational behavior of moth scales, both numerically and experimentally. The results demonstrate that multiphysics modeling software can be used to accurately capture moth scale behavior, paving the way for further simulation-driven analysis in this area. In the future, the University of Bristol team aims to expand the current periodic model into a full 3D model of an array of moth scales.
The research itself also has far-reaching implications outside of the animal kingdom. By being able to understand the vibroacoustic behavior of moth scales, researchers can start to develop macroscopic structures with the same acoustic camouflage capabilities. “If we can make materials mimicking moth scales,
of the scale. They used the Periodic boundary condition to model the single unit cell instead of an entire scale array, which saved computational effort and memory. “We can simplify our model to a few scales and use the Periodic boundary condition to expand the structure into an array. If we made an actual array model, it would be too big for the computer to handle,” said Shen. The team then modeled the scale vibrations at ultrasonic frequencies using a macroscale FEM model, allowing them to calculate the vibration of the scale. “COMSOL® is really good at coupled problems. We needed both acoustics and solid mechanics to understand how the ultrasonic wave is coupled with the scale
FIGURE 3 Parameterized model of a single unit cell of a moth scale.
RESEARCH SPOTLIGHT
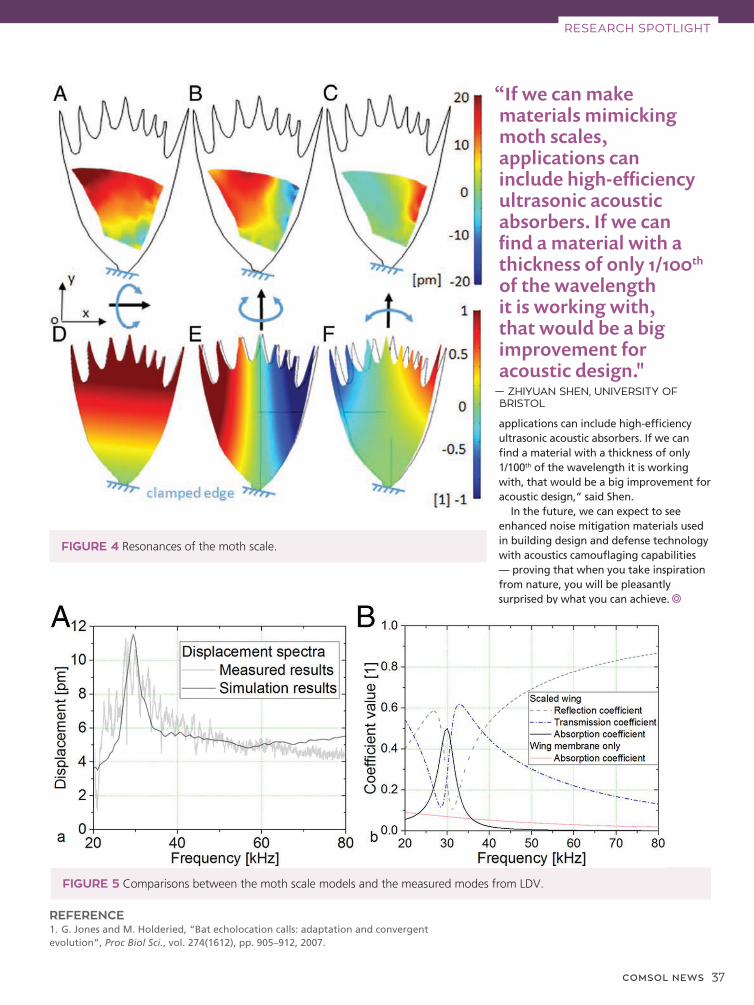
COMSOL NEWS 37
FIGURE 4 Resonances of the moth scale.
FIGURE 5 Comparisons between the moth scale models and the measured modes from LDV.
applications can include high-efficiency ultrasonic acoustic absorbers. If we can find a material with a thickness of only 1/100th of the wavelength it is working with, that would be a big improvement for acoustic design,” said Shen.
In the future, we can expect to see enhanced noise mitigation materials used in building design and defense technology with acoustics camouflaging capabilities — proving that when you take inspiration from nature, you will be pleasantly surprised by what you can achieve.
REFERENCE 1. G. Jones and M. Holderied, “Bat echolocation calls: adaptation and convergent evolution”, Proc Biol Sci., vol. 274(1612), pp. 905–912, 2007.
“If we can make materials mimicking moth scales, applications can include high-efficiency ultrasonic acoustic absorbers. If we can find a material with a thickness of only 1/100th of the wavelength it is working with, that would be a big improvement for acoustic design."
— ZHIYUAN SHEN, UNIVERSITY OF BRISTOL
RESEARCH SPOTLIGHT
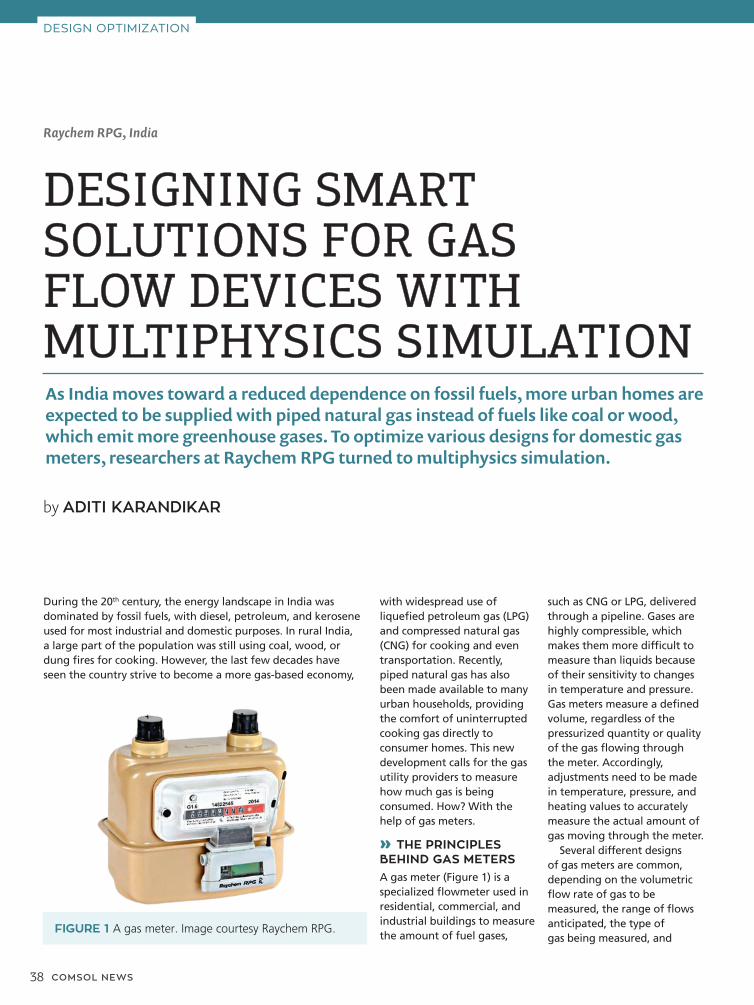
38 COMSOL NEWS
DESIGN OPTIMIZATION
Raychem RPG, India
DESIGNING SMART DESIGNING SMART SOLUTIONS FOR GAS SOLUTIONS FOR GAS FLOW DEVICES WITH FLOW DEVICES WITH MULTIPHYSICS SIMULATIONMULTIPHYSICS SIMULATION
by ADITI KARANDIKAR
As India moves toward a reduced dependence on fossil fuels, more urban homes are expected to be supplied with piped natural gas instead of fuels like coal or wood, which emit more greenhouse gases. To optimize various designs for domestic gas meters, researchers at Raychem RPG turned to multiphysics simulation.
During the 20th century, the energy landscape in India was dominated by fossil fuels, with diesel, petroleum, and kerosene used for most industrial and domestic purposes. In rural India, a large part of the population was still using coal, wood, or dung fires for cooking. However, the last few decades have seen the country strive to become a more gas-based economy,
with widespread use of liquefied petroleum gas (LPG) and compressed natural gas (CNG) for cooking and even transportation. Recently, piped natural gas has also been made available to many urban households, providing the comfort of uninterrupted cooking gas directly to consumer homes. This new development calls for the gas utility providers to measure how much gas is being consumed. How? With the help of gas meters.
» THE PRINCIPLES BEHIND GAS METERSA gas meter (Figure 1) is a specialized flowmeter used in residential, commercial, and industrial buildings to measure the amount of fuel gases,
such as CNG or LPG, delivered through a pipeline. Gases are highly compressible, which makes them more difficult to measure than liquids because of their sensitivity to changes in temperature and pressure. Gas meters measure a defined volume, regardless of the pressurized quantity or quality of the gas flowing through the meter. Accordingly, adjustments need to be made in temperature, pressure, and heating values to accurately measure the actual amount of gas moving through the meter.
Several different designs of gas meters are common, depending on the volumetric flow rate of gas to be measured, the range of flows anticipated, the type of gas being measured, and
FIGURE 1 A gas meter. Image courtesy Raychem RPG.
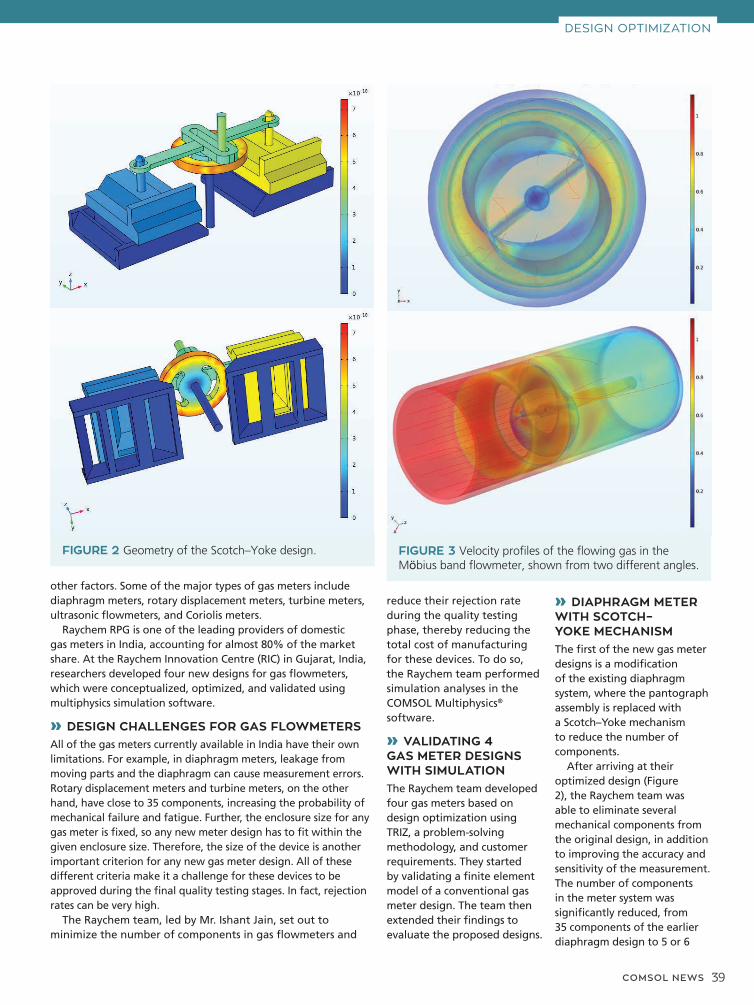
COMSOL NEWS 39
other factors. Some of the major types of gas meters include diaphragm meters, rotary displacement meters, turbine meters, ultrasonic flowmeters, and Coriolis meters.
Raychem RPG is one of the leading providers of domestic gas meters in India, accounting for almost 80% of the market share. At the Raychem Innovation Centre (RIC) in Gujarat, India, researchers developed four new designs for gas flowmeters, which were conceptualized, optimized, and validated using multiphysics simulation software.
» DESIGN CHALLENGES FOR GAS FLOWMETERSAll of the gas meters currently available in India have their own limitations. For example, in diaphragm meters, leakage from moving parts and the diaphragm can cause measurement errors. Rotary displacement meters and turbine meters, on the other hand, have close to 35 components, increasing the probability of mechanical failure and fatigue. Further, the enclosure size for any gas meter is fixed, so any new meter design has to fit within the given enclosure size. Therefore, the size of the device is another important criterion for any new gas meter design. All of these different criteria make it a challenge for these devices to be approved during the final quality testing stages. In fact, rejection rates can be very high.
The Raychem team, led by Mr. Ishant Jain, set out to minimize the number of components in gas flowmeters and
reduce their rejection rate during the quality testing phase, thereby reducing the total cost of manufacturing for these devices. To do so, the Raychem team performed simulation analyses in the COMSOL Multiphysics® software.
» VALIDATING 4 GAS METER DESIGNS WITH SIMULATIONThe Raychem team developed four gas meters based on design optimization using TRIZ, a problem-solving methodology, and customer requirements. They started by validating a finite element model of a conventional gas meter design. The team then extended their findings to evaluate the proposed designs.
» DIAPHRAGM METER WITH SCOTCH–YOKE MECHANISMThe first of the new gas meter designs is a modification of the existing diaphragm system, where the pantograph assembly is replaced with a Scotch–Yoke mechanism to reduce the number of components.
After arriving at their optimized design (Figure 2), the Raychem team was able to eliminate several mechanical components from the original design, in addition to improving the accuracy and sensitivity of the measurement. The number of components in the meter system was significantly reduced, from 35 components of the earlier diaphragm design to 5 or 6
DESIGN OPTIMIZATION
FIGURE 2 Geometry of the Scotch–Yoke design. FIGURE 3 Velocity profiles of the flowing gas in the Möbius band flowmeter, shown from two different angles.
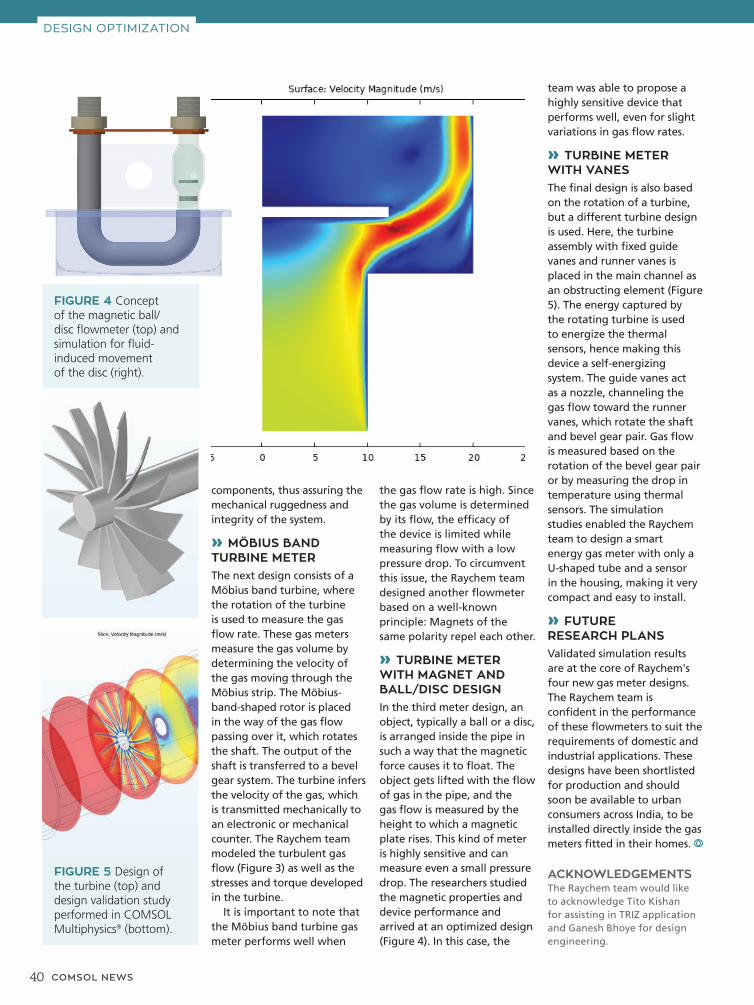
40 COMSOL NEWS
team was able to propose a highly sensitive device that performs well, even for slight variations in gas flow rates.
» TURBINE METER WITH VANESThe final design is also based on the rotation of a turbine, but a different turbine design is used. Here, the turbine assembly with fixed guide vanes and runner vanes is placed in the main channel as an obstructing element (Figure 5). The energy captured by the rotating turbine is used to energize the thermal sensors, hence making this device a self-energizing system. The guide vanes act as a nozzle, channeling the gas flow toward the runner vanes, which rotate the shaft and bevel gear pair. Gas flow is measured based on the rotation of the bevel gear pair or by measuring the drop in temperature using thermal sensors. The simulation studies enabled the Raychem team to design a smart energy gas meter with only a U-shaped tube and a sensor in the housing, making it very compact and easy to install.
» FUTURE RESEARCH PLANSValidated simulation results are at the core of Raychem's four new gas meter designs. The Raychem team is confident in the performance of these flowmeters to suit the requirements of domestic and industrial applications. These designs have been shortlisted for production and should soon be available to urban consumers across India, to be installed directly inside the gas meters fitted in their homes.
components, thus assuring the mechanical ruggedness and integrity of the system.
» MÖBIUS BAND TURBINE METERThe next design consists of a Möbius band turbine, where the rotation of the turbine is used to measure the gas flow rate. These gas meters measure the gas volume by determining the velocity of the gas moving through the Möbius strip. The Möbius-band-shaped rotor is placed in the way of the gas flow passing over it, which rotates the shaft. The output of the shaft is transferred to a bevel gear system. The turbine infers the velocity of the gas, which is transmitted mechanically to an electronic or mechanical counter. The Raychem team modeled the turbulent gas flow (Figure 3) as well as the stresses and torque developed in the turbine.
It is important to note that the Möbius band turbine gas meter performs well when
FIGURE 4 Concept of the magnetic ball/disc flowmeter (top) and simulation for fluid-induced movement of the disc (right).
FIGURE 5 Design of the turbine (top) and design validation study performed in COMSOL Multiphysics® (bottom).
the gas flow rate is high. Since the gas volume is determined by its flow, the efficacy of the device is limited while measuring flow with a low pressure drop. To circumvent this issue, the Raychem team designed another flowmeter based on a well-known principle: Magnets of the same polarity repel each other.
» TURBINE METER WITH MAGNET AND BALL/DISC DESIGNIn the third meter design, an object, typically a ball or a disc, is arranged inside the pipe in such a way that the magnetic force causes it to float. The object gets lifted with the flow of gas in the pipe, and the gas flow is measured by the height to which a magnetic plate rises. This kind of meter is highly sensitive and can measure even a small pressure drop. The researchers studied the magnetic properties and device performance and arrived at an optimized design (Figure 4). In this case, the
ACKNOWLEDGEMENTSThe Raychem team would like to acknowledge Tito Kishan for assisting in TRIZ application and Ganesh Bhoye for design engineering.
DESIGN OPTIMIZATION
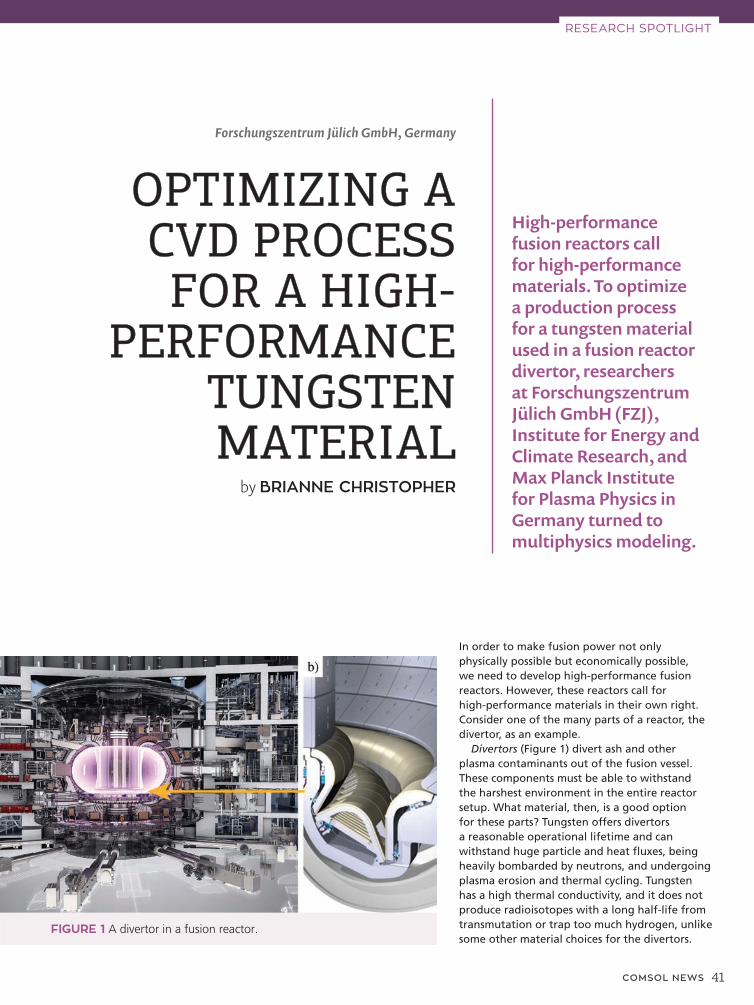
COMSOL NEWS 41
RESEARCH SPOTLIGHT
Forschungszentrum Jülich GmbH, Germany
OPTIMIZING A OPTIMIZING A CVD PROCESS CVD PROCESS FOR A HIGH-FOR A HIGH-
PERFORMANCE PERFORMANCE TUNGSTEN TUNGSTEN MATERIALMATERIAL
by BRIANNE CHRISTOPHER
High-performance fusion reactors call for high-performance materials. To optimize a production process for a tungsten material used in a fusion reactor divertor, researchers at Forschungszentrum Jülich GmbH (FZJ), Institute for Energy and Climate Research, and Max Planck Institute for Plasma Physics in Germany turned to multiphysics modeling.
In order to make fusion power not only physically possible but economically possible, we need to develop high-performance fusion reactors. However, these reactors call for high-performance materials in their own right. Consider one of the many parts of a reactor, the divertor, as an example.
Divertors (Figure 1) divert ash and other plasma contaminants out of the fusion vessel. These components must be able to withstand the harshest environment in the entire reactor setup. What material, then, is a good option for these parts? Tungsten offers divertors a reasonable operational lifetime and can withstand huge particle and heat fluxes, being heavily bombarded by neutrons, and undergoing plasma erosion and thermal cycling. Tungsten has a high thermal conductivity, and it does not produce radioisotopes with a long half-life from transmutation or trap too much hydrogen, unlike some other material choices for the divertors.
FIGURE 1 A divertor in a fusion reactor.
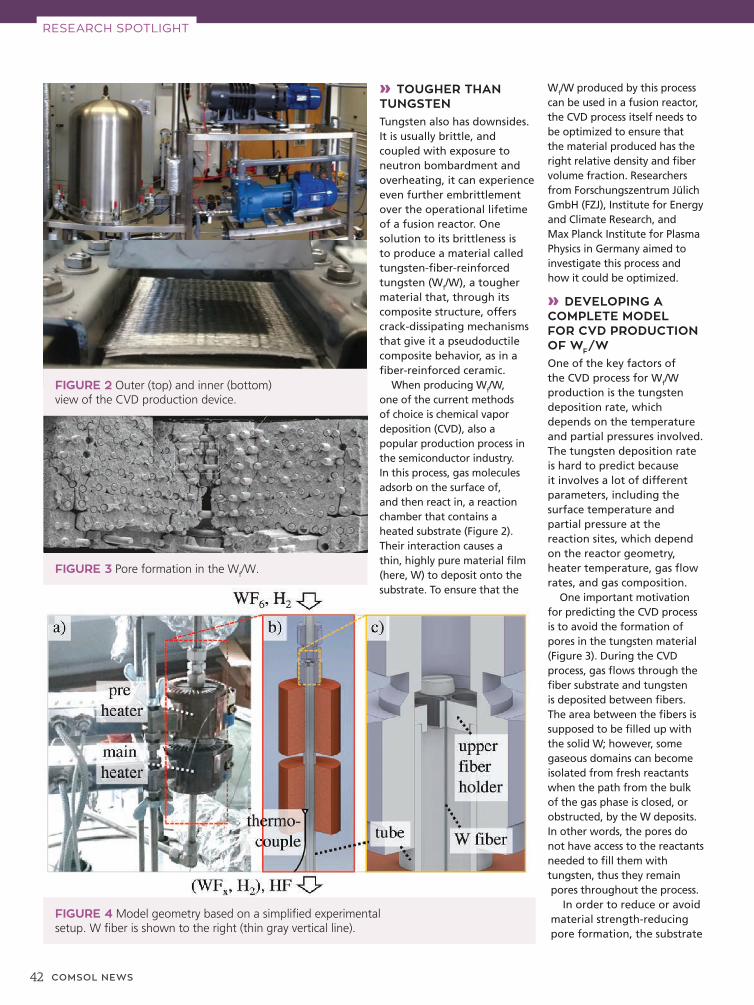
42 COMSOL NEWS
RESEARCH SPOTLIGHT
Wf/W produced by this process can be used in a fusion reactor, the CVD process itself needs to be optimized to ensure that the material produced has the right relative density and fiber volume fraction. Researchers from Forschungszentrum Jülich GmbH (FZJ), Institute for Energy and Climate Research, and Max Planck Institute for Plasma Physics in Germany aimed to investigate this process and how it could be optimized.
» DEVELOPING A COMPLETE MODEL FOR CVD PRODUCTION OF WF/WOne of the key factors of the CVD process for Wf/W production is the tungsten deposition rate, which depends on the temperature and partial pressures involved. The tungsten deposition rate is hard to predict because it involves a lot of different parameters, including the surface temperature and partial pressure at the reaction sites, which depend on the reactor geometry, heater temperature, gas flow rates, and gas composition.
One important motivation for predicting the CVD process is to avoid the formation of pores in the tungsten material (Figure 3). During the CVD process, gas flows through the fiber substrate and tungsten is deposited between fibers. The area between the fibers is supposed to be filled up with the solid W; however, some gaseous domains can become isolated from fresh reactants when the path from the bulk of the gas phase is closed, or obstructed, by the W deposits. In other words, the pores do not have access to the reactants needed to fill them with tungsten, thus they remain pores throughout the process.
In order to reduce or avoid material strength-reducing pore formation, the substrate
FIGURE 3 Pore formation in the Wf/W.
FIGURE 2 Outer (top) and inner (bottom) view of the CVD production device.
FIGURE 4 Model geometry based on a simplified experimental setup. W fiber is shown to the right (thin gray vertical line).
» TOUGHER THAN TUNGSTENTungsten also has downsides. It is usually brittle, and coupled with exposure to neutron bombardment and overheating, it can experience even further embrittlement over the operational lifetime of a fusion reactor. One solution to its brittleness is to produce a material called tungsten-fiber-reinforced tungsten (Wf/W), a tougher material that, through its composite structure, offers crack-dissipating mechanisms that give it a pseudoductile composite behavior, as in a fiber-reinforced ceramic.
When producing Wf/W, one of the current methods of choice is chemical vapor deposition (CVD), also a popular production process in the semiconductor industry. In this process, gas molecules adsorb on the surface of, and then react in, a reaction chamber that contains a heated substrate (Figure 2). Their interaction causes a thin, highly pure material film (here, W) to deposit onto the substrate. To ensure that the
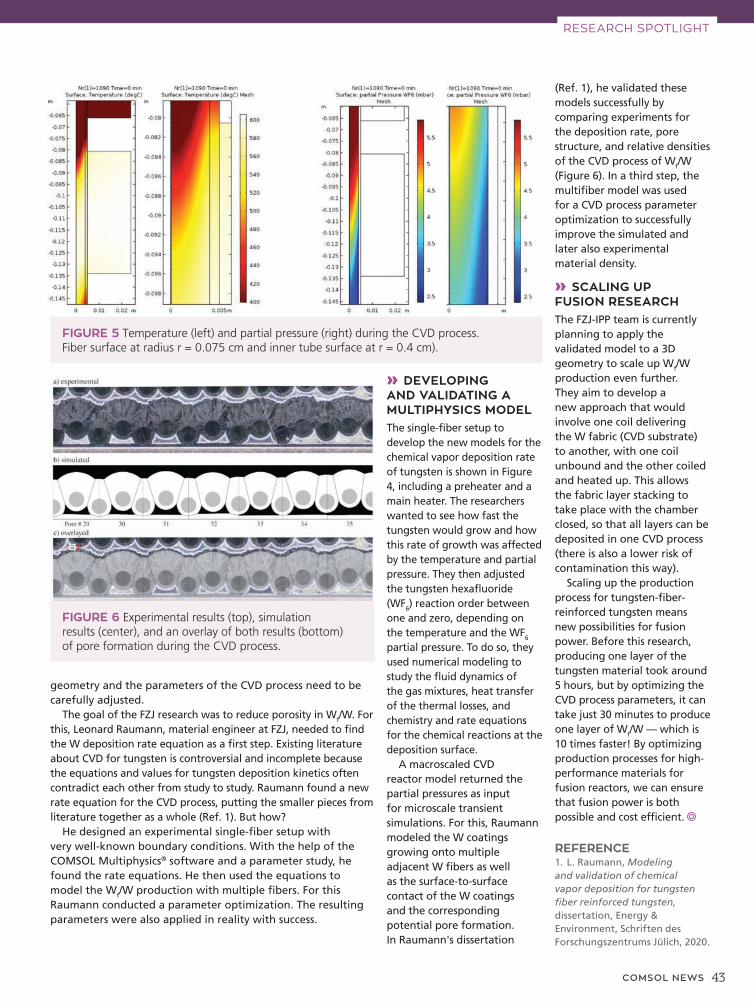
COMSOL NEWS 43
geometry and the parameters of the CVD process need to be carefully adjusted.
The goal of the FZJ research was to reduce porosity in Wf/W. For this, Leonard Raumann, material engineer at FZJ, needed to find the W deposition rate equation as a first step. Existing literature about CVD for tungsten is controversial and incomplete because the equations and values for tungsten deposition kinetics often contradict each other from study to study. Raumann found a new rate equation for the CVD process, putting the smaller pieces from literature together as a whole (Ref. 1). But how?
He designed an experimental single-fiber setup with very well-known boundary conditions. With the help of the COMSOL Multiphysics® software and a parameter study, he found the rate equations. He then used the equations to model the Wf/W production with multiple fibers. For this Raumann conducted a parameter optimization. The resulting parameters were also applied in reality with success.
REFERENCE1. L. Raumann, Modeling and validation of chemical vapor deposition for tungsten fiber reinforced tungsten, dissertation, Energy & Environment, Schriften des Forschungszentrums Jülich, 2020.
» DEVELOPING AND VALIDATING A MULTIPHYSICS MODELThe single-fiber setup to develop the new models for the chemical vapor deposition rate of tungsten is shown in Figure 4, including a preheater and a main heater. The researchers wanted to see how fast the tungsten would grow and how this rate of growth was affected by the temperature and partial pressure. They then adjusted the tungsten hexafluoride (WF6) reaction order between one and zero, depending on the temperature and the WF6 partial pressure. To do so, they used numerical modeling to study the fluid dynamics of the gas mixtures, heat transfer of the thermal losses, and chemistry and rate equations for the chemical reactions at the deposition surface.
A macroscaled CVD reactor model returned the partial pressures as input for microscale transient simulations. For this, Raumann modeled the W coatings growing onto multiple adjacent W fibers as well as the surface-to-surface contact of the W coatings and the corresponding potential pore formation. In Raumann's dissertation
FIGURE 5 Temperature (left) and partial pressure (right) during the CVD process. Fiber surface at radius r = 0.075 cm and inner tube surface at r = 0.4 cm).
FIGURE 6 Experimental results (top), simulation results (center), and an overlay of both results (bottom) of pore formation during the CVD process.
(Ref. 1), he validated these models successfully by comparing experiments for the deposition rate, pore structure, and relative densities of the CVD process of Wf/W (Figure 6). In a third step, the multifiber model was used for a CVD process parameter optimization to successfully improve the simulated and later also experimental material density.
» SCALING UP FUSION RESEARCHThe FZJ-IPP team is currently planning to apply the validated model to a 3D geometry to scale up Wf/W production even further. They aim to develop a new approach that would involve one coil delivering the W fabric (CVD substrate) to another, with one coil unbound and the other coiled and heated up. This allows the fabric layer stacking to take place with the chamber closed, so that all layers can be deposited in one CVD process (there is also a lower risk of contamination this way).
Scaling up the production process for tungsten-fiber-reinforced tungsten means new possibilities for fusion power. Before this research, producing one layer of the tungsten material took around 5 hours, but by optimizing the CVD process parameters, it can take just 30 minutes to produce one layer of Wf/W — which is 10 times faster! By optimizing production processes for high-performance materials for fusion reactors, we can ensure that fusion power is both possible and cost efficient.
RESEARCH SPOTLIGHT
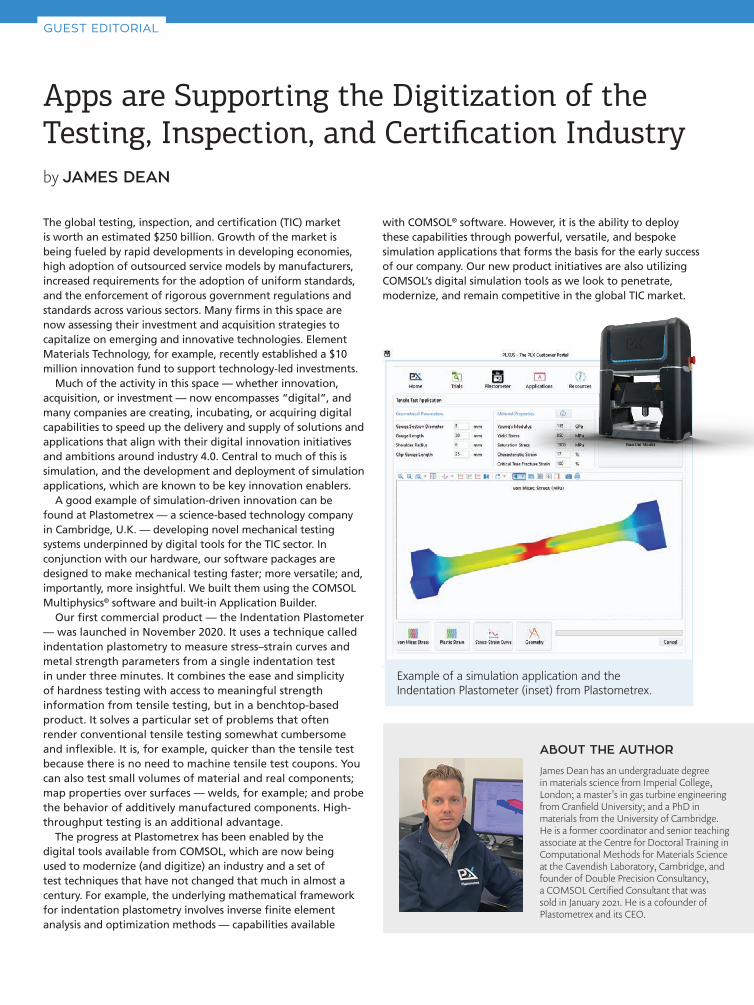
with COMSOL® software. However, it is the ability to deploy these capabilities through powerful, versatile, and bespoke simulation applications that forms the basis for the early success of our company. Our new product initiatives are also utilizing COMSOL’s digital simulation tools as we look to penetrate, modernize, and remain competitive in the global TIC market.
The global testing, inspection, and certification (TIC) market is worth an estimated $250 billion. Growth of the market is being fueled by rapid developments in developing economies, high adoption of outsourced service models by manufacturers, increased requirements for the adoption of uniform standards, and the enforcement of rigorous government regulations and standards across various sectors. Many firms in this space are now assessing their investment and acquisition strategies to capitalize on emerging and innovative technologies. Element Materials Technology, for example, recently established a $10 million innovation fund to support technology-led investments.
Much of the activity in this space — whether innovation, acquisition, or investment — now encompasses “digital”, and many companies are creating, incubating, or acquiring digital capabilities to speed up the delivery and supply of solutions and applications that align with their digital innovation initiatives and ambitions around industry 4.0. Central to much of this is simulation, and the development and deployment of simulation applications, which are known to be key innovation enablers.
A good example of simulation-driven innovation can be found at Plastometrex — a science-based technology company in Cambridge, U.K. — developing novel mechanical testing systems underpinned by digital tools for the TIC sector. In conjunction with our hardware, our software packages are designed to make mechanical testing faster; more versatile; and, importantly, more insightful. We built them using the COMSOL Multiphysics® software and built-in Application Builder.
Our first commercial product — the Indentation Plastometer — was launched in November 2020. It uses a technique called indentation plastometry to measure stress–strain curves and metal strength parameters from a single indentation test in under three minutes. It combines the ease and simplicity of hardness testing with access to meaningful strength information from tensile testing, but in a benchtop-based product. It solves a particular set of problems that often render conventional tensile testing somewhat cumbersome and inflexible. It is, for example, quicker than the tensile test because there is no need to machine tensile test coupons. You can also test small volumes of material and real components; map properties over surfaces — welds, for example; and probe the behavior of additively manufactured components. High-throughput testing is an additional advantage.
The progress at Plastometrex has been enabled by the digital tools available from COMSOL, which are now being used to modernize (and digitize) an industry and a set of test techniques that have not changed that much in almost a century. For example, the underlying mathematical framework for indentation plastometry involves inverse finite element analysis and optimization methods — capabilities available
James Dean has an undergraduate degree in materials science from Imperial College, London; a master's in gas turbine engineering from Cranfield University; and a PhD in materials from the University of Cambridge. He is a former coordinator and senior teaching associate at the Centre for Doctoral Training in Computational Methods for Materials Science at the Cavendish Laboratory, Cambridge, and founder of Double Precision Consultancy, a COMSOL Certified Consultant that was sold in January 2021. He is a cofounder of Plastometrex and its CEO.
Apps are Supporting the Digitization of the Testing, Inspection, and Certification Industryby JAMES DEAN
ABOUT THE AUTHOR
GUEST EDITORIAL
Example of a simulation application and the Indentation Plastometer (inset) from Plastometrex.