Embed Size (px)
Citation preview
Charles Forsberg Department of Nuclear Science and Engineering (NSE)
Massachusetts Institute of Technology 77 Massachusetts Ave; Bld. 42-207a; Cambridge, MA 02139
Tel: (617) 324-4010; Email: [email protected]
January 2015
Concentrated Solar Power
on Demand
CSPonD
Liquid Salts as Direct Receiver and Storage Media

Solar thermal power
system
Direct conversion of
light from heliostats
to heat by absorption
in liquid salt bath
Liquid salt provides
heat storage
24 hour power
production
Cold Salt
from HX
Hot Salt to
HX
Lid Heat
Extraction
Non-Imaging
Refractor Lid
CSPonD Summary
Light from Heliostats
Absorbed As Travel
Through Molten Salt
2

• The Electricity Market: Defining Requirements
• CSPonD
– Description
– Experimental Program
– Status
• Backup Information
Outline
3

The Electricity Market
Starting Point for Design Goals
4

Dem
and (
10
4 M
W(e
))
Time (hours since beginning of year)
Electricity Demand Varies With Time
No Combination of Nuclear and Renewables
Matches Electricity Demand
New England (Boston Area) Electricity Demand
5

In a Free Market
Electricity Prices Vary
2012 California Electricity Prices
Low and
Negative Prices
High- Price
Electricity
6

California Daily Spring Electricity Demand and Production with
Different Levels of Annual Photovoltaic Electricity Generation
-5,000
0
5,000
10,000
15,000
20,000
25,000
30,000
35,000
PV Penetration and Hour
Gen
erat
ion
(M
W)
PV
Gas
TurbinePumped
StorageHydro
Combined
CycleImports
Coal
Nuclear
Wind
Geo
Exports
Base 2% 6% 10%
(no PV)
Adding Solar and Wind Changes
Electricity Prices & Price Structure
Unstable Electrical Grid Excess Electricity with
Price Collapse
7

Notes on California Solar Production
Far left figure shows mix of electricity generating units supplying power on a spring day in
California. The figures to the right shows the impact on grid of adding PV capacity
assuming it is dispatched first—low operating cost.
Percent PV for each case is the average yearly fraction of the electricity provided by PV.
The % of power from PV is much higher in late June in the middle of the day and is zero at
night. Initially PV helps the grid because PV input roughly matches peak load. Problems
first show up on spring days as shown herein when significant PV and low electricity load.
With 6% PV, wild swings in power supply during spring with major problems for the grid. By
10% PV on low-electricity-demand days PV provides most of the power in the middle of
many spring days.
In a free market PV or producers with zero production costs will accept any price above
zero. As PV grows, revenue to PV begins to collapse in the middle of the day. Collapsing
revenue limits PV new build. Same happens if lots of wind is built. Large-scale PV or wind
also damages base-load electricity market while increasing market for peak power when
no sun or wind. In the U.S. that variable demand is getting filled with gas turbines with
increases in greenhouse gas emissions.
The revenue problem with renewables is similar to selling tomatoes in August when all the
home-grown tomatoes turn red and the price collapses to near zero
The other part of the story is the need for backup power when low wind or solar. For
example, in Texas only 8% of the wind capacity can be assigned as dispatchable. That
implies in Texas for every 1000 MW of wind, need 920 MW of backup capacity for when
the wind does not blow—almost a full backup of wind. In the Midwest grid, only 13.3% of
the wind capacity can be assigned as dispatchable. Consequently, with today’s
technologies large scale renewables implies large-scale fossil fuel usage
8
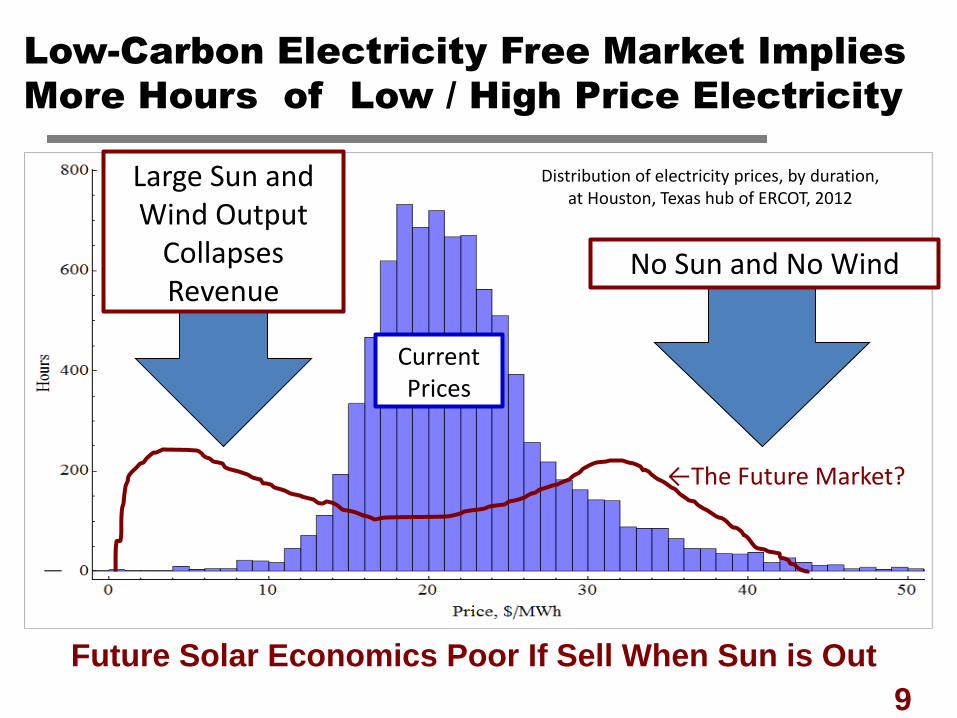
Future Solar Economics Poor If Sell When Sun is Out
Large Sun and Wind Output
Collapses Revenue
No Sun and No Wind
Distribution of electricity prices, by duration, at Houston, Texas hub of ERCOT, 2012
Low-Carbon Electricity Free Market Implies
More Hours of Low / High Price Electricity
Current Prices
←The Future Market?
9
MIT Concentrated Solar Power
on Demand (CSPonD)
Description Power Plus Storage
Joint Program Between MIT Mechanical and Nuclear Science and Engineering Departments
Alex Slocum leads the CSPonD Project. C. Forsberg leads the Fluoride-salt-cooled High-temperature Reactor (FHR) project—see
appendix. Both projects both based on properties of high temperature salts with many common challenges.
A. Slocum, J. Buongiorno, C. W. Forsberg, T. McKrell, A. Mitsos, J. Nave, D. Codd, A. Ghobeity, C. J. Noone, S. Passerini, F. Rojas,
“Concentrated Solar Power on Demand,” Journal Solar Energy, 85, 1519-1529, 2011
10

Existing Solar Power Technology
• Mirrors reflect sunlight to
boiler
• Boiler tubes on top of tall
tower absorb light
• Heat water and convert to
steam
• Steam turbine produces
electricity
PS-10, 11 MWe peak, image courtesy of N. Hanumara
11

The Challenge is Cost
• Low efficiency system – In theory high efficiency
– In practice • Lower steam temperatures to avoid
boiler-tube thermal fatigue from
variable light
• High heat loses from exposed
boiler tubes
• Marginal economics – Need efficient light-to-electricity
system
– Peak power not match peak
demand with peak electricity prices
PS-10, Spain, 11MWe peak, image courtesy of N. Hanumara
12

CSPonD Description Figure Next Page
Mirrors shine sunlight to receiver
Receiver is a high-temperature liquid salt bath inside insulated
structure with open window for focused light
Light volumetrically absorbed through several meters of liquid salt
Structure minimizes heat losses by receiver
Enables salt temperatures to 900°C
Small window minimizes heat losses but very high power
density of sunlight through open window
Power density would destroy conventional boiler-tube collector
Light absorbed volumetrically in several meters in salt
Requires high-temperature (semi-transparent) salt
13

(Not to scale)
Two Component System
Light Reflected From Hillside
Heliostats to CSPonD System Light Collected By Absorption in
Liquid Salt Inside Insulated
Building With Open Window
Cold Salt
from HX
Hot Salt
to HX
Lid Heat
Extraction Non-Imaging
Refractor Lid
Flat Land Options Exist
14
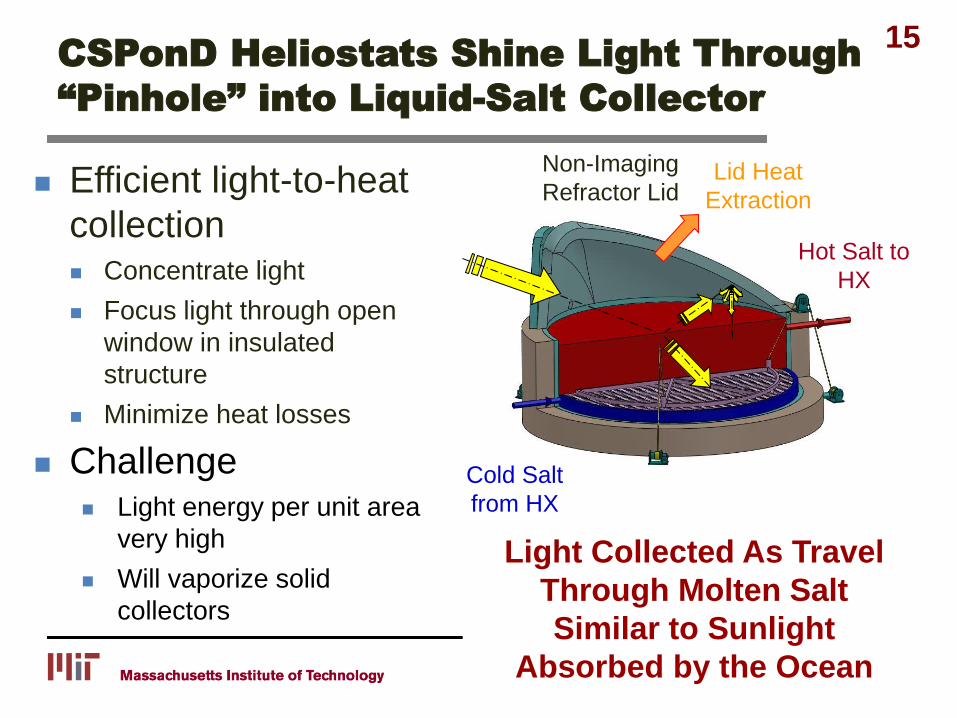
Efficient light-to-heat
collection Concentrate light
Focus light through open
window in insulated
structure
Minimize heat losses
Challenge Light energy per unit area
very high
Will vaporize solid
collectors
Cold Salt
from HX
Hot Salt to
HX
Lid Heat
Extraction
Non-Imaging
Refractor Lid
CSPonD Heliostats Shine Light Through
“Pinhole” into Liquid-Salt Collector
Light Collected As Travel
Through Molten Salt
Similar to Sunlight
Absorbed by the Ocean
15

16
Light Focused On “Transparent” Salt
Molten Chloride Salt Metallic Heat
Treatment Bath (1100°C)
Light volumetrically absorbed through several meters of salt Molten salt experience Metal heat treating
baths (right bottom) Molten salt nuclear
reactor
Advantages No light-flux limit No thermal fatigue High efficiency Energy storage
Like Ocean Absorption of Sunlight
16

Two Classes Of Molten Salts
Appearance of molten
NaCl-KCl salt at 850C
Near-term: Nitrates
Used in some concentrated
thermal solar systems
Off the shelf
Temperature limit of ~550°C
(Decompose salt)
Long-term: Chlorides and
Carbonates
Thermodynamically stable
Peak temperatures > 1000°C
17

18/29
Ideal CSPonD Receiver Performance: Overall Capture Efficiency
0.0
0.1
0.2
0.3
0.4
0.5
0.6
0.7
0.8
0.9
1.0
0 500 1000 1500 2000 2500 3000 3500
Peak Concentration (kW/m^2, 'suns')
fracti
on
of
incid
en
t en
erg
y a
t ap
ert
ure
Chloride Salt: 950C
lid temp 660C
Aperture to Illuminated
Pond Area ratio
NREL Solar II:
salt 565C
NREL Solar I:
steam 500C
Nitrate Salt: 550C
lid temp 240C
Peak &
average
values
NREL (2003)
Compares favorably with
measured values for CSP Power Tower
Systems System output (MWe): 4
Nominal pond size
diameter (m): 25.0
depth (m): 5.0
Avg beam down angle (deg): 21.4
Nitrate Salt, Lid peak temp (C): 550/240
Chloride, Lid peak temp (C): 950/660
System Design Enables Efficient
Light Collection and High Temperatures
18

Salt Selection
Salts Used in Commercial Metal Heat Treating Operations
Initial candidates (Other options to be examined):
• Binary nitrate mixture, KNO3-NaNO3, (eutectic 40-60
wt%, melting point 222C)
– Commercial in closed solar systems
– Family of options with variable compositions
• Ternary carbonate salt, Li2CO3-Na2CO3-K2CO3 “cartecsal”
(eutectic 32-33-35 wt%, melting point 397C)
– Used for heat treating metals
– No experience in power cycles
• Binary chloride salt, NaCl-KCl (eutectic 50-50 wt%,
melting point 657C)—long term option
19

NaCl-KCl
at 800°C
Li2CO3-Na2CO3-K2CO3 at
800°C
KNO3-NaNO2-NaNO3
at 350°C
Density kg/m3
1520 1902 1850
Viscosity mPa∙s
1.2 4.3 2.360
Thermal
conductivity W/m-K
0.45 0.822 0.61
Specific heat J/kg-K
1090 1560 1560
Power Cycle
Temp. °C ~800 ~700 ~500
Properties At Operating Conditions
20

CSPonD Integral
Heat Storage
Salt tank has insulated
separator plate
Plate functions
Separates hot and cold salt
Bottom light absorber creating
mixing currents in hot salt
Storage role
If excess heat input, plate sinks
to provide cold salt to heat to
become hot salt and storage
If power demand high, plate
raised with cold salt return from
power cycle stored under plate
Nighttime
Divider plate (moves up)
Divider plate (moves down)
Daytime
21

Alternative CSPonD Heat Storage
Heat In/Out
Cold Salt Out/In
Separate collector and heat storage tank
Liquid storage with solid fill (Several options)
May reduce required salt inventory
Centralized storage from several receivers with
common power plant—lower power-cycle costs
No definitive studies
New hot salt storage options (Backup materials)
22

Multiple Power Cycle Options
Salt Temperature: 500°C, 700°C, and 700+°C
• Steam (500 to 700°C)
– Off-the-shelf technology
– Expensive
• Air Brayton (700°C and up)
– Existing technology
– Small or limited cooling water requirements
– Requires 700°C salt temperatures
• Supercritical carbon dioxide (600 to 700°C)
– High efficiency
– Very compact and potentially low-capital cost
– Advanced technology: Not fully developed
23

• CSPonD has cooling systems in lid
– Prevent overheating and equipment damage
– Cooler temperatures than salt to provide condensing surface
for salt vapors
• Lowers salt losses at very high temperature operations
• Creates “liquid” mirror reflective surface to minimize heat loses
• High temperature heat—not as hot as salt so options for
use
– Integrate into power cycle
– Use for other uses such as water desalination
Options for Power and Heat 24

CSPonD
Experimental Program
25

(l) Variable optical path length transmission apparatus
(r) Appearance of molten NaCl-KCl salt at 850C
Solar Irradiance Attenuation of NaCl-
KCl (50-50wt%) salt at 850C
Experimental Range
Salt Optical Characterization
Experimental Molten Salt Measurements
Stefano Passerini, Dr. Tom McKrell, Prof. Jacopo Buongiorno, MIT
26

300 400 500 600 700 800 900 1000
wavelength (nm)
Sp
ectr
al In
ten
sit
y (
arb
itra
ry u
nit
s)
MIT CSP Simulator
Terrestrial solar
spectrum
Commercial Xenon
Solar Simulator
0
10
20
30
40
50
60
70
80
0 2 4 6 8 10
X = radial offset from aperture center (cm)
Calc
ula
ted
Op
tic
al
Po
we
r (k
W/m
2)
x
ε n = 0.06
α solar = 0.14
ε n = 0.05
α solar = 0.11
ε n = α solar = 0.11
60-Sun Solar Simulator
MIT CSP Solar Simulator 10.5 kWe
27

0
0.1
0.2
0.3
0.4
0.5
0.6
0.7
0.8
0.9
1
200 220 240 260 280 300 320 340 360
Temperature (°C)
He
igh
t (x
/L)
0 h salt
0 h tank
2.8 h salt
2.8 h tank
8.3 h salt
8.3 h tank
Increasing time
Volumetric Light Absorption
Experiments
Temperature distribution of NaNO3-
KNO3 (60-40wt%) heated optically
Increasing time
t = 0 2.8 h
8.3 h
28

Virtual Two-Tank System Testing
Ceramic (high temp) insulation
Fiberglass insulation
Salt tank @ 300C with nitrate salt
Inside Solar Simulator
29

CSPonD Status
Joint Program Between MIT and
Masdar Institute, Abu Dhabi, UAE
30
Joint Program Initiated 2014
Design and deploy a pilot CSPonD experimental system
in Abu Dhabi
Field proof of principle using Masdar solar test facilities
within 3 years
Includes new Chinese partners
31

CSPonD Project
Masdar Test Facility CSPonD Test Module
To Be Installed Under Tower

CSPonD Conclusions
• Analysis and experiments indicate better economics than
existing concentrated solar thermal systems – Higher efficiency
– Electricity when needed
• Significant uncertainties – Pilot plant to address many uncertainties
– Large incentives for higher-temperature salt than nitrate but
limited experimental data
• Experimental program between MIT and Masdar Institute
to deploy small pilot plant at test facility in Abu Dhabi
• Recent discoveries indicate route to major improvements
33

Questions 34

END
35

Biography: Charles Forsberg
Dr. Charles Forsberg is the principle investigator and director of the
Fluoride-salt-cooled High-Temperature Reactor Project. He is a co-
inventor and principle investigator for the Concentrated Solar Energy
on Demand (CSPonD) system. Before joining MIT, he was a
Corporate Fellow at Oak Ridge National Laboratory. He is a Fellow of
the American Nuclear Society, a Fellow of the American Association
for the Advancement of Science, and recipient of the 2005 Robert E.
Wilson Award from the American Institute of Chemical Engineers for
outstanding chemical engineering contributions to nuclear energy,
including his work in hydrogen production and nuclear-renewable
energy futures. He received the American Nuclear Society special
award for innovative nuclear reactor design on salt-cooled reactors
and the 2014 Seaborg Award from the ANS. Dr. Forsberg earned his
bachelor's degree in chemical engineering from the University of
Minnesota and his doctorate in Nuclear Engineering from MIT. He
has been awarded 11 patents and has published over 200 papers.
36
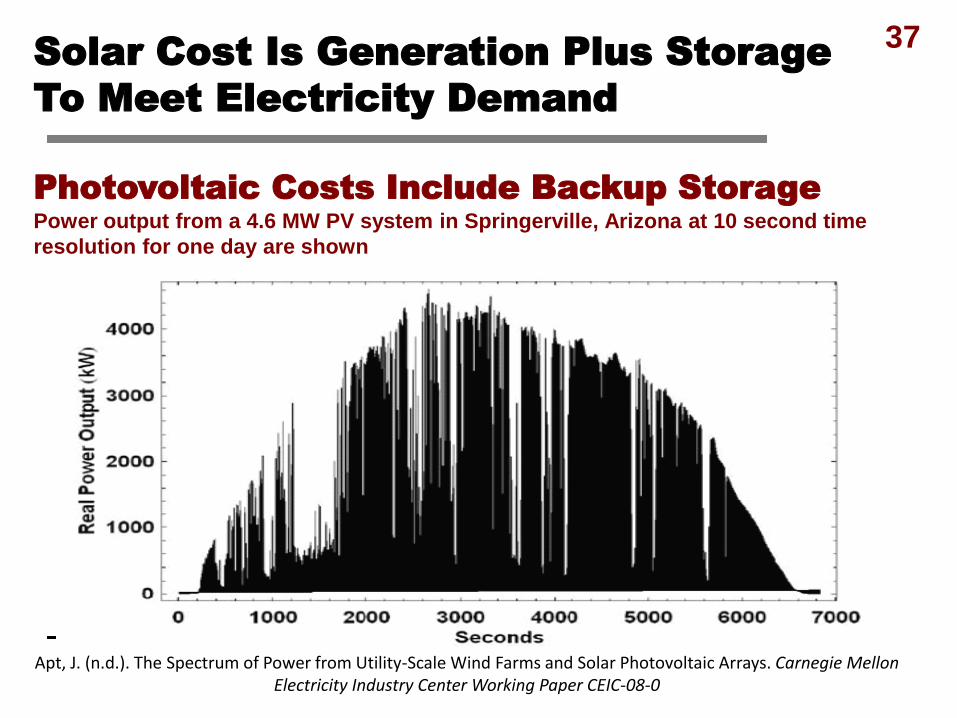
Solar Cost Is Generation Plus Storage
To Meet Electricity Demand
Photovoltaic Costs Include Backup Storage
Power output from a 4.6 MW PV system in Springerville, Arizona at 10 second time
resolution for one day are shown
Apt, J. (n.d.). The Spectrum of Power from Utility-Scale Wind Farms and Solar Photovoltaic Arrays. Carnegie Mellon Electricity Industry Center Working Paper CEIC-08-0
37
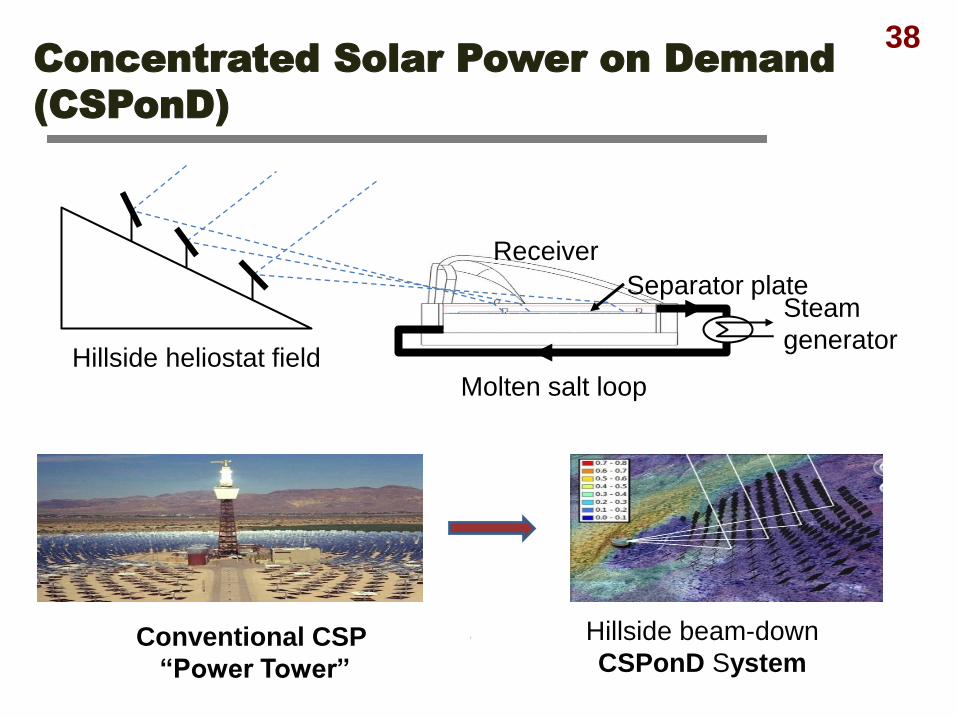
Hillside heliostat field
Receiver
Steam
generator
Molten salt loop
Separator plate
Hillside beam-down
CSPonD System Conventional CSP
“Power Tower”
Concentrated Solar Power on Demand
(CSPonD)
38

High-Temperature Salt Power
Programs at MIT
39 39
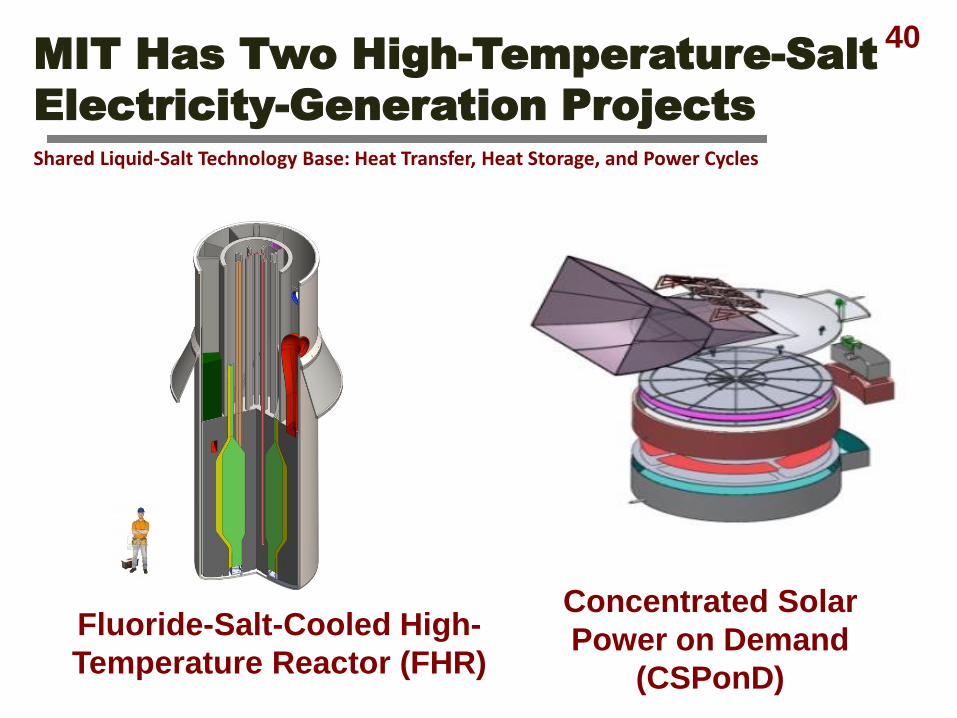
MIT Has Two High-Temperature-Salt
Electricity-Generation Projects
Shared Liquid-Salt Technology Base: Heat Transfer, Heat Storage, and Power Cycles
Fluoride-Salt-Cooled High-
Temperature Reactor (FHR)
Concentrated Solar
Power on Demand
(CSPonD)
40

Constant High-Temperature Heat
(600 to 700 C)
Reactor (FHR) Gas-Turbine (NACC)
Combustible Fuels for Peak Electricity
The Base-Load FHR Produces Variable
Electricity to Match Market Needs
41
FIRES for Peak Electricity
Stored Heat
Electricity Prices Horizontal Axis
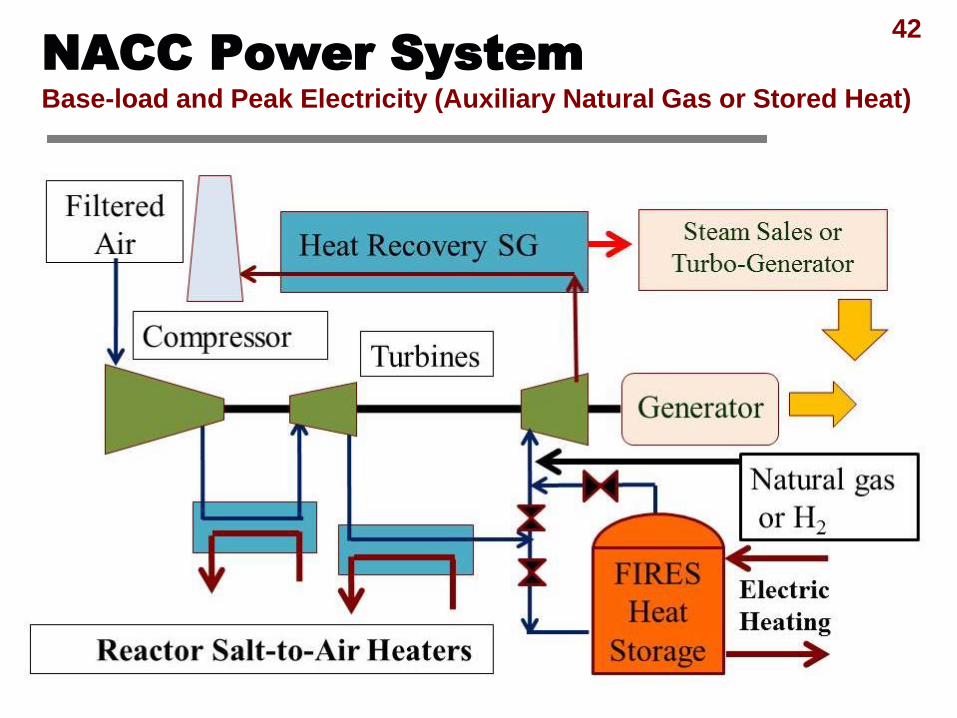
NACC Power System
Base-load and Peak Electricity (Auxiliary Natural Gas or Stored Heat)
42

Notes on NACC (Long-term CSPond Option)
With base-load operation, air is compressed, heated using heat from the FHR, sent
through a turbine to produce electricity, is reheated using heat from the FHR to the same
temperature (670C), sent through a second turbine to produce electricity and exhausted
at low pressure to a heat recovery steam generator (HRSG)
In the HRSG the warm air is used to produce steam to produce added electricity or steam
for industrial sale.
The base-load operations are very similar to a natural-gas fired combined cycle plant.
The efficiency is ~42%. The cooling water requirements are about 40% of a
conventional light water reactor. That is partly because of the higher efficiency and
partly because some of the heat rejection is via warm air—similar to stand alone
combined cycle natural gas plants.
For peak power, after second reheat using nuclear heat, natural gas is injected into the
hot air stream to raise compressed air temperatures. This increases electricity production
from the second turbine and the HRSG.
The system may also contain a Firebrick Resistance-Heated Energy Storage (FIRES)
System. The firebrick is heated with electricity when the price of electricity is below that
of natural gas. At times of high prices, compressed air after the second reheat is sent
through FIRES to increase its temperature. This results in higher power output from the
second turbine and the HRSG
Peak heat to electricity efficiency is above 66% because it’s a topping cycle above the
lower-temperature 700C nuclear heat
43

FHR and CSPonD Share Liquid-Salt
Heat-Transfer / Power-Cycle Technologies
Materials, Pumps, Power Cycles, Valves, Etc.
Nuclear Solar
• New reactor concept – Forsberg, Peterson, and Pickard
• FHR (Joint MIT, Berkeley,
Wisconsin program)
• High-temperature heat
transfer loop between high-
temperature reactors and
power systems
• China to build first FHR (10
MWt) by 2020
• Drive to more efficient
systems
• CSPonD
– Near-term nitrate salts to
550°C
– Next generation chloride or
carbonate salts to 700°C
– Nuclear systems only looking
at 700°C systems
44