Embed Size (px)
Citation preview

Concentration-Driven Growth of Model Protocell MembranesItay Budin,† Anik Debnath, and Jack W. Szostak*
Howard Hughes Medical Institute, Department of Molecular Biology and Center for Computational and Integrative Biology,Massachusetts General Hospital, 185 Cambridge Street, Boston, Massachusetts 02114, United States
*S Supporting Information
ABSTRACT: The first protocell membranes may haveassembled from fatty acids and related single-chain lipids availablein the prebiotic environment. Prior to the evolution of complexcellular machinery, spontaneous protocell membrane growth anddivision had to result from the intrinsic physicochemicalproperties of these molecules, in the context of specificenvironmental conditions. Depending on the nature of thechemical and physical environment, fatty acids can partitionbetween several different phases, including soluble monomers, micelles, and lamellar vesicles. Here we address the concentrationdependence of fatty acid aggregation, which is dominated by entropic considerations. We quantitatively distinguish between fattyacid phases using a combination of physical and spectroscopic techniques, including the use of the fluorescent fatty acid analogueLaurdan, whose emission spectrum is sensitive to structural differences between micellar and lamellar aggregates. We find that themonomer−aggregate transition largely follows a characteristic pseudophase model of molecular aggregation but that thecomposition of the aggregate phase is also concentration dependent. At low amphiphile concentrations above the criticalaggregate concentration, vesicles coexist with a significant proportion of micelles, while more concentrated solutions favor thelamellar vesicle phase. We subsequently show that the micelle−vesicle equilibrium can be used to drive the growth of pre-existingvesicles upon an increase in amphiphile concentration either through solvent evaporation or following the addition of excesslipids. We propose a simple model for a primitive environmentally driven cell cycle, in which protocell membrane growth resultsfrom evaporative concentration, followed by shear force or photochemically induced division.
■ INTRODUCTION
Early cell membranes are thought to have been composed offatty acids and related single-chain amphiphiles, in contrast tothe phospholipid-based membranes of all modern cells. Initialsupport for this hypothesis arose from the facile prebioticsynthesis of these molecules and the ability of fatty acids tospontaneously assemble into bilayer vesicles.1,2 Fatty acids andother oxygenated alkanes can be synthesized via Fischer−Tropsch-type chemistry,3,4 and membrane-forming samples ofthese molecules have been discovered in abiotic environmentssuch as meteorites.5,6 More recently, the functional propertiesof fatty acid membranes have been studied7−10 and areconsistent with the necessity for early cell membranes, priorto the evolution of transport machinery, to be permeable topolar nutrients. In addition, fatty acid vesicles have a strikingability to undergo intervesicle competition through exchange ofmonomers.11,12 These dynamic processes depend upon therapid exchange of single-chain amphiphiles between mem-branes and the surrounding solution. The importance of theseexchange processes motivated us to investigate the structuralcomposition of fatty acid vesicle solutions.Fatty acid membranes are only stable within a narrow pH
range, from neutral to moderately alkaline (pH ∼ 7−9,depending on chain length), near the apparent pKa of the fattyacid within the bilayer. This condition allows approximatelyequal proportions of protonated and ionized carboxylates tocoexist, forming a bilayer-stabilizing hydrogen bonding net-
work.13,14 Under more alkaline conditions, fatty acids are fullyionized and aggregate into small soap micelles, as a result of thecharge repulsion of the anionic head groups. Under acidicconditions, fatty acids become fully protonated, lose theiramphiphilicity, and condense into oil droplets. This pHdependence of fatty acid phase behavior has been extensivelycharacterized by NMR, X-ray diffraction, and electron spinresonance (ESR).13,15,16 Subsequent work has utilized the pHdependence of fatty acid aggregation to drive the de novoassembly of vesicles from micelles7,17 or the growth of pre-existing vesicles by introducing alkaline micelles into bufferedsuspensions of vesicles.7,18
Supra-molecular self-assembly is intrinsically concentrationdependent because of the entropic cost of aggregation.Detergent solutions, for example, feature a critical micelleconcentration (cmc), below which only monomers are foundand above which aggregation occurs. Such self-assemblyprocesses can be described as pseudophase equilibria, withcritical concentrations being analogous to solubilities. Criticalaggregation concentrations (cac) have been observed for fattyacid vesicles,2,19 suggesting that monomers coexist with vesiclesabove the cac. In addition, asymmetries in ESR data haveprovided evidence for micelle−vesicle coexistence in two fattyacid systems.15,16 Because of their large size (n > 105),
Received: October 24, 2012Published: November 30, 2012
Article
pubs.acs.org/JACS
© 2012 American Chemical Society 20812 dx.doi.org/10.1021/ja310382d | J. Am. Chem. Soc. 2012, 134, 20812−20819
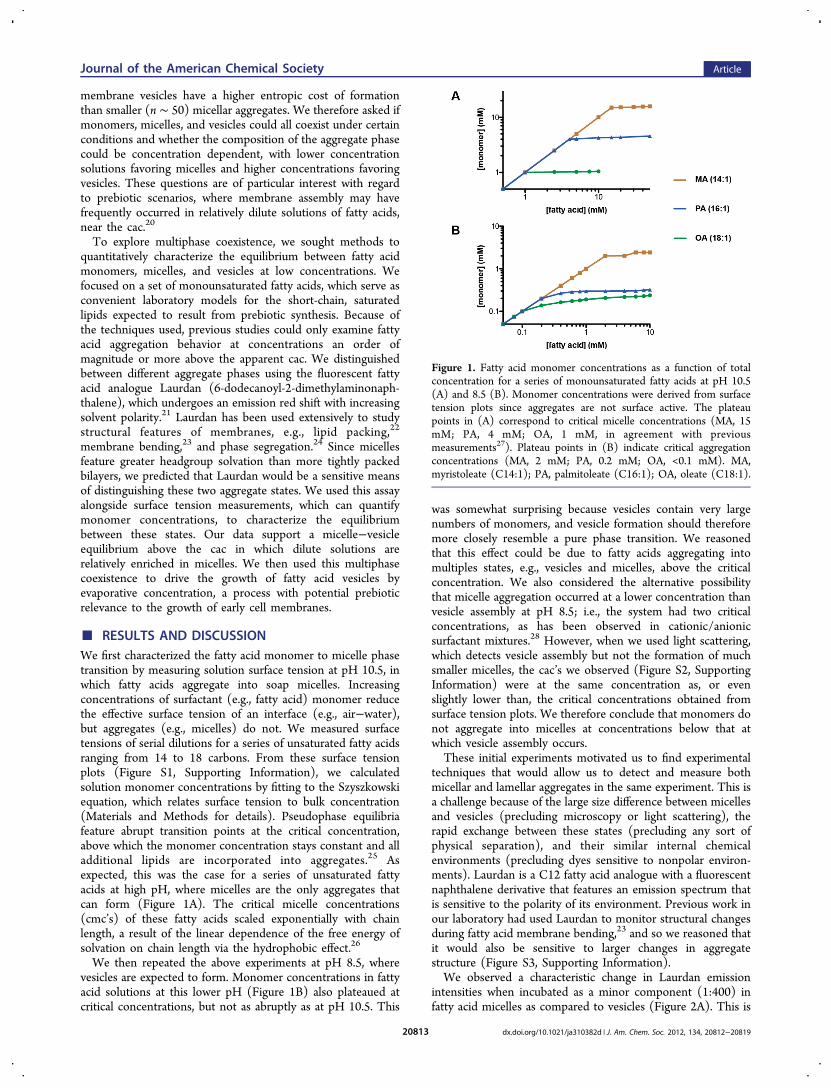
membrane vesicles have a higher entropic cost of formationthan smaller (n ∼ 50) micellar aggregates. We therefore asked ifmonomers, micelles, and vesicles could all coexist under certainconditions and whether the composition of the aggregate phasecould be concentration dependent, with lower concentrationsolutions favoring micelles and higher concentrations favoringvesicles. These questions are of particular interest with regardto prebiotic scenarios, where membrane assembly may havefrequently occurred in relatively dilute solutions of fatty acids,near the cac.20
To explore multiphase coexistence, we sought methods toquantitatively characterize the equilibrium between fatty acidmonomers, micelles, and vesicles at low concentrations. Wefocused on a set of monounsaturated fatty acids, which serve asconvenient laboratory models for the short-chain, saturatedlipids expected to result from prebiotic synthesis. Because ofthe techniques used, previous studies could only examine fattyacid aggregation behavior at concentrations an order ofmagnitude or more above the apparent cac. We distinguishedbetween different aggregate phases using the fluorescent fattyacid analogue Laurdan (6-dodecanoyl-2-dimethylaminonaph-thalene), which undergoes an emission red shift with increasingsolvent polarity.21 Laurdan has been used extensively to studystructural features of membranes, e.g., lipid packing,22
membrane bending,23 and phase segregation.24 Since micellesfeature greater headgroup solvation than more tightly packedbilayers, we predicted that Laurdan would be a sensitive meansof distinguishing these two aggregate states. We used this assayalongside surface tension measurements, which can quantifymonomer concentrations, to characterize the equilibriumbetween these states. Our data support a micelle−vesicleequilibrium above the cac in which dilute solutions arerelatively enriched in micelles. We then used this multiphasecoexistence to drive the growth of fatty acid vesicles byevaporative concentration, a process with potential prebioticrelevance to the growth of early cell membranes.
■ RESULTS AND DISCUSSIONWe first characterized the fatty acid monomer to micelle phasetransition by measuring solution surface tension at pH 10.5, inwhich fatty acids aggregate into soap micelles. Increasingconcentrations of surfactant (e.g., fatty acid) monomer reducethe effective surface tension of an interface (e.g., air−water),but aggregates (e.g., micelles) do not. We measured surfacetensions of serial dilutions for a series of unsaturated fatty acidsranging from 14 to 18 carbons. From these surface tensionplots (Figure S1, Supporting Information), we calculatedsolution monomer concentrations by fitting to the Szyszkowskiequation, which relates surface tension to bulk concentration(Materials and Methods for details). Pseudophase equilibriafeature abrupt transition points at the critical concentration,above which the monomer concentration stays constant and alladditional lipids are incorporated into aggregates.25 Asexpected, this was the case for a series of unsaturated fattyacids at high pH, where micelles are the only aggregates thatcan form (Figure 1A). The critical micelle concentrations(cmc’s) of these fatty acids scaled exponentially with chainlength, a result of the linear dependence of the free energy ofsolvation on chain length via the hydrophobic effect.26
We then repeated the above experiments at pH 8.5, wherevesicles are expected to form. Monomer concentrations in fattyacid solutions at this lower pH (Figure 1B) also plateaued atcritical concentrations, but not as abruptly as at pH 10.5. This
was somewhat surprising because vesicles contain very largenumbers of monomers, and vesicle formation should thereforemore closely resemble a pure phase transition. We reasonedthat this effect could be due to fatty acids aggregating intomultiples states, e.g., vesicles and micelles, above the criticalconcentration. We also considered the alternative possibilitythat micelle aggregation occurred at a lower concentration thanvesicle assembly at pH 8.5; i.e., the system had two criticalconcentrations, as has been observed in cationic/anionicsurfactant mixtures.28 However, when we used light scattering,which detects vesicle assembly but not the formation of muchsmaller micelles, the cac’s we observed (Figure S2, SupportingInformation) were at the same concentration as, or evenslightly lower than, the critical concentrations obtained fromsurface tension plots. We therefore conclude that monomers donot aggregate into micelles at concentrations below that atwhich vesicle assembly occurs.These initial experiments motivated us to find experimental
techniques that would allow us to detect and measure bothmicellar and lamellar aggregates in the same experiment. This isa challenge because of the large size difference between micellesand vesicles (precluding microscopy or light scattering), therapid exchange between these states (precluding any sort ofphysical separation), and their similar internal chemicalenvironments (precluding dyes sensitive to nonpolar environ-ments). Laurdan is a C12 fatty acid analogue with a fluorescentnaphthalene derivative that features an emission spectrum thatis sensitive to the polarity of its environment. Previous work inour laboratory had used Laurdan to monitor structural changesduring fatty acid membrane bending,23 and so we reasoned thatit would also be sensitive to larger changes in aggregatestructure (Figure S3, Supporting Information).We observed a characteristic change in Laurdan emission
intensities when incubated as a minor component (1:400) infatty acid micelles as compared to vesicles (Figure 2A). This is
Figure 1. Fatty acid monomer concentrations as a function of totalconcentration for a series of monounsaturated fatty acids at pH 10.5(A) and 8.5 (B). Monomer concentrations were derived from surfacetension plots since aggregates are not surface active. The plateaupoints in (A) correspond to critical micelle concentrations (MA, 15mM; PA, 4 mM; OA, 1 mM, in agreement with previousmeasurements27). Plateau points in (B) indicate critical aggregationconcentrations (MA, 2 mM; PA, 0.2 mM; OA, <0.1 mM). MA,myristoleate (C14:1); PA, palmitoleate (C16:1); OA, oleate (C18:1).
Journal of the American Chemical Society Article
dx.doi.org/10.1021/ja310382d | J. Am. Chem. Soc. 2012, 134, 20812−2081920813

explained by the high curvature of the micelle surface, whichresults in increased water penetration compared to bilayers. Wequantified this spectral shift using a unitless GeneralizedPolarization24 (GP) parameter
=−+
I II I
GP 500 430
500 430
where I430 and I500 are the emission intensities (excitation 364nm) at 430 and 500 nm, respectively. We note that ourexpression for GP is inverted in sign from that generally used(for phospholipid membranes) due to the altered spectra ofLaurdan in fatty acid aggregates. In this form, larger GP valuesindicate a more solvated state of the dye, e.g., as expected frommicellar vs lamellar packing.In oleate solutions, GP increased monotonically with pH
until it plateaued above pH 10 (Figure 2B). This was consistentwith a pH-dependent change from a lamellar to micellar phase,with intermediate values (e.g., at pH 9) reflecting coexistingvesicles and micelles.19 These pH-dependent changes in GPwere not observed in the presence of detergent (Triton X100),which disrupts all fatty acid aggregates. Changes in Laurdan GPthus were not caused by the pH change per se but rather by thestructure of the resulting fatty acid aggregate. GP was alsonotably insensitive to vesicle radius and thus mean curvature, inextruded samples (Figure S4, Supporting Information). Thiswas consistent with our previous results on bending relaxationin fatty acid vesicles.23
We then asked if the Laurdan GP is dependent on theconcentration of the fatty acid solution. At concentrationsbelow the aggregation concentrations, Laurdan emissionintensity and GP were low, likely reflecting the insolubility ofthe dye in the absence of hydrophobic aggregates (Figure S5,Supporting Information). For solutions at pH 10.5, GPremained constant with regard to concentration above thecmc for all three fatty acids tested (Figure 3A). Therefore, themicelle aggregate is structurally consistent over this concen-
tration range, though it is likely heterogeneous in nature. Incontrast, solutions at pH 8.5 showed a dramatic dependence ofGP on concentration (Figure 3B). Concentrations just abovethe cac had a GP close to that for micelles, which decreased asthe concentration increased, eventually plateauing at highconcentrations. We interpreted this data to indicate aconcentration dependence of the fatty acid aggregation state,with micelles favored in low concentration solutions. We alsoobserved this effect in oleate solutions at pH 9.2, with GPplateauing to an intermediate value reflecting a roughly equalmixture of micelles and vesicles (Figure 3C).Assuming that Laurdan partitions representatively between
micelles and vesicles, its emission in a solution can be modeledas a weighted average between its characteristic micelle andvesicle emissions (Materials and Methods). Using thisapproach, we approximated the micelle to vesicle partitioncoefficient as a function of concentration in the systems tested(Figure 4). These are relative partition coefficients with respectto the reference vesicle solutions at 30 or 50 mM and are thusexpressed as “apparent Xm/Xv”, where Xm and Xv are the micelleand vesicle fractions, respectively.We tested the concentration dependence of the micelle to
vesicle ratio independently by measuring the turbidity of vesiclesolutions that had been extruded to 50 nm to eliminatespurious effects due to variation in vesicle size. Phospholipid(dimyristoleoyl phosphocholine) solutions, which only form
Figure 2. Aggregate dependence of Laurdan emission. (A) Emissionspectrum for 25 μM Laurdan (excitation 364 nm) in 10 mM oleate atpH 8.5 (vesicles) or pH 10.5 (micelles). Asterisks indicate peakswhose emission intensities are used to calculate GP. (B) Dependenceof Laurdan GP on pH in 10 mM oleate with (open squares) orwithout (closed circles) 1% v/v Triton X100, which disrupts fatty acidaggregates. Error bars indicate SD (n = 3).
Figure 3. Concentration dependence of Laurdan GP in fatty acidsolutions at varying pH. (A) GP as a function of concentration formonounsaturated fatty acids at pH 10.5. GP is constant forconcentrations above the cmc. (B) GP as a function of concentrationfor monounsaturated fatty acids at pH 8.5. GP drops monotonicallyonce above the cac, reflecting a change in the aggregate composition.(C) GP as a function of concentration in oleate at pH 9.2. Dotted linesrepresenting equivalent curves for pH 10.5 (from A) and 8.5 (from B)are provided for reference. Error bars indicate SD (n = 3).
Journal of the American Chemical Society Article
dx.doi.org/10.1021/ja310382d | J. Am. Chem. Soc. 2012, 134, 20812−2081920814
vesicles, exhibited a linear increase in turbidity withconcentration, corresponding to the expected linear increasein vesicle concentration (Figure 5A, black). In contrast, the
absorbance of myristoleate solutions increased nonlinearlyabove the cac, with more dilute solutions depleted in vesicles(Figure 5A, green). From these absorbance values, wecalculated apparent micelle to vesicle partition coefficients,assuming that all fatty acids not in vesicles were in the form ofmicelles (Materials and Methods). These values correspondedwell with the partition coefficients derived from Laurdanmeasurements (Figure 5B).Our characterization of fatty acid phase behavior demon-
strates that fatty acid incorporation into vesicles vs micellesincreases with both increasing concentration and decreasing
pH. The addition of alkaline micelles to buffered vesicles haslong been used as a model system for vesicle growth.20 Wetherefore hypothesized that the concentration dependence ofthe micelle−vesicle equilibrium could provide an alternativemechanism for the growth of pre-existing fatty acid vesicles. Inthis scenario, a rise in amphiphile concentration would causethe incorporation of excess micellar fatty acids into vesicles, anddilution would drive vesicle shrinkage (as material leaves thelamellar phase and reforms micelles). We tested this possibilityby monitoring changes in the membrane area of 100 nmvesicles using a Forster resonance energy transfer (FRET)growth assay.7,18 This assay quantitatively relates changes inFRET to changes in dye concentrations and thereforemembrane surface area (Materials and Methods). Upondilution from 10 to 5 mM, we observed rapid shrinkage of100 nm myristoleate vesicles (Figure 6). Dilution was
performed with buffer containing 2 mM myristoleate, at thecac, so shrinkage was not due to general aggregate dissolution.This shrinkage was subsequently reversed by the addition ofpreformed 20 mM myristoleate vesicles, to raise the totalmyristoleate concentration back to 10 mM. We were thus ableto demonstrate a full cycle of growth and shrinkage bymodulating the fatty acid concentration in the solution.The rapid growth of large, multilamellar vesicles following
the addition of excess micelles results in the transformation ofinitially spherical vesicles into extended filamentousvesicles.10,12 This pathway provides a straightforward routefor protocell division due to the intrinsic fragility of filamentousvesicles, which break up into daughter vesicles in response tomild shear forces10 or photochemically induced pearling.29 Wetherefore asked whether concentration-driven vesicle growth isrobust enough to drive the same filamentous shape transition.To test this possibility, we prepared large (∼4 um) myristoleatevesicles by large pore extrusion and dialysis at a concentrationof 5 mM. The initially spherical vesicles were brought to aconcentration of 15 mM via the addition of preformedmyristoleate vesicles and within 30 min had grown into long,thin filamentous vesicles (Figure 7). The shape transitionoccurs because volume growth is osmotically limited by solute(buffer) permeation, geometrically necessitating high surfacearea morphologies. Vesicles were labeled with a solublefluorescent dye, which stayed encapsulated during the entireexperiment.
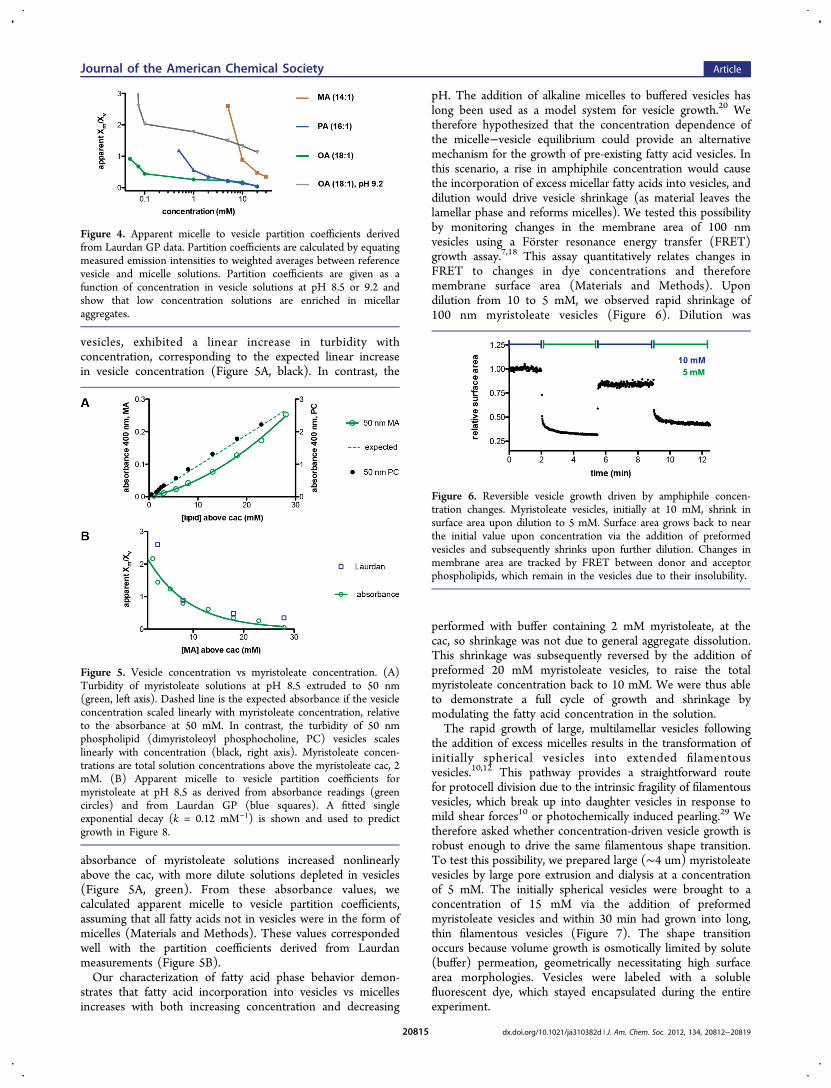
Figure 4. Apparent micelle to vesicle partition coefficients derivedfrom Laurdan GP data. Partition coefficients are calculated by equatingmeasured emission intensities to weighted averages between referencevesicle and micelle solutions. Partition coefficients are given as afunction of concentration in vesicle solutions at pH 8.5 or 9.2 andshow that low concentration solutions are enriched in micellaraggregates.
Figure 5. Vesicle concentration vs myristoleate concentration. (A)Turbidity of myristoleate solutions at pH 8.5 extruded to 50 nm(green, left axis). Dashed line is the expected absorbance if the vesicleconcentration scaled linearly with myristoleate concentration, relativeto the absorbance at 50 mM. In contrast, the turbidity of 50 nmphospholipid (dimyristoleoyl phosphocholine, PC) vesicles scaleslinearly with concentration (black, right axis). Myristoleate concen-trations are total solution concentrations above the myristoleate cac, 2mM. (B) Apparent micelle to vesicle partition coefficients formyristoleate at pH 8.5 as derived from absorbance readings (greencircles) and from Laurdan GP (blue squares). A fitted singleexponential decay (k = 0.12 mM−1) is shown and used to predictgrowth in Figure 8.
Figure 6. Reversible vesicle growth driven by amphiphile concen-tration changes. Myristoleate vesicles, initially at 10 mM, shrink insurface area upon dilution to 5 mM. Surface area grows back to nearthe initial value upon concentration via the addition of preformedvesicles and subsequently shrinks upon further dilution. Changes inmembrane area are tracked by FRET between donor and acceptorphospholipids, which remain in the vesicles due to their insolubility.
Journal of the American Chemical Society Article
dx.doi.org/10.1021/ja310382d | J. Am. Chem. Soc. 2012, 134, 20812−2081920815

The simplest prebiotic mechanism for increasing lipidconcentration would be through solution evaporation. Wetherefore asked whether gentle evaporation would drive thegrowth of fatty acid vesicles as a result of the transfer of materialfrom coexisting micelles into the preformed vesicles as the fattyacid concentration increased (Figure 8). Solutions of 100 nm
myristoleate vesicles, initially at a concentration of 5 mM, wereallowed to evaporate at 35 °C with gentle agitation. Membranearea was monitored by FRET at discrete time points andapproximately doubled over 24 h as the lipid concentration roseto ∼10 mM. This growth was similar in magnitude to thatpredicted (dashed line) from the previously measured apparentmicelle−vesicle partition coefficients (Figure 5B; Materials and
Methods) and thus was consistent with our model forconcentration-driven growth. Growth was not observed forphospholipid vesicles, which do not feature a measurablecoexisting solution phase of micelles or monomers and thuswere not predicted to change in membrane area uponconcentration.
■ CONCLUSIONS
We have used a combination of physical and spectroscopicassays to characterize the phase behavior of fatty acid solutionsto better understand models for prebiotic membrane assemblyand function. In the course of these experiments, we foundLaurdan to be a particularly useful fluorescent probe due to itsability to differentiate between fatty acid micelles and vesicles.This assay was complementary to standard approaches formeasuring fatty acid monomer concentration (via surfacetension) and vesicle concentration (via light scattering). At agiven temperature and pressure, there are two determinants offatty acid phase behavior in our system: pH, which controlsheadgroup ionization, and concentration, which entropicallyregulates aggregate size. Laurdan GP increases monotonicallyfrom pH 8.5 to pH 10, which reflects the previously identifiedtransition from vesicle to micelle aggregates as the fatty acidsbecome fully ionized and thus favor a high curvature geometry.More surprisingly, we also found that GP at pH 8.5 decreaseswith concentration above the cac. We interpret this to reflect aconcentration-dependent change in the micelle−vesicle equili-brium, with lower concentrations favoring the smaller micellaraggregates and higher concentrations favoring the much largervesicle aggregates. This behavior is independent of theconcentration-dependent transition from monomers to aggre-gates (vesicles or micelles), which largely follows a pseudophaseequilibrium that is characteristic of surfactant aggregation. Ourmodel for fatty acid aggregation is shown in Figure 9.
Figure 7. Growth of large vesicles by increase in amphiphileconcentration. Multilamellar (∼4 μm) myristoleate vesicles, initiallymostly spherical (top), grow into long, filamentous vesicles uponaddition of concentrated preformed vesicles (bottom). Filamentousgrowth occurs because of the osmotically limited increase in vesiclevolume and is similar to growth seen upon addition of alkalinemicelles. Top image taken immediately after mixing, bottom taken 20min later. Scale bar, 30 μm.
Figure 8. Solution evaporation drives the growth of fatty acid vesicles.Myristoleate (MA) vesicles, initially at 5 mM lipid concentration, wereconcentrated by gentle evaporation (Materials and Methods) andchanges in surface area monitored by FRET at time points of 3, 10,and 24 h. Data are shown for two independent experiments (solidcircles, squares) and are in agreement with that predicted frommeasured apparent micelle−vesicle partition coefficients (dashed line).An identical experiment with dimyristoleoyl phosphocholine (PC)vesicles did not show growth (points labeled x).
Figure 9. Model for fatty acid phase behavior. Solutions feature apseudophase separation from monomers to aggregates, characterizedby a cac (dashed line) that is dependent on pH. In addition, vesiclesolutions feature a concentration-dependent vesicle−micelle equili-brium, with higher concentrations favoring the larger vesicleaggregates. In contrast, alkaline solutions exhibit a single sharppseudophase transition at the cmc. Both pH and concentration-drivenphase transitions can drive fatty acid vesicle growth.
Journal of the American Chemical Society Article
dx.doi.org/10.1021/ja310382d | J. Am. Chem. Soc. 2012, 134, 20812−2081920816

The predominance of micelles at lower concentrations can berationalized entropically since micelles are much smaller thanvesicles. The greater magnitude of this effect with shorter chainlength lipids (e.g., myristoleate vs oleate) supports thishypothesis: micelle aggregation number has a strong depend-ence on chain length, so shorter chain length lipids assembleinto smaller micelles.30 We therefore expect this phenomenonto be broadly applicable to shorter, saturated single-chain lipids,which are the primary product of abiotic lipid synthesis.3,4
While the high working concentrations of such speciesprecluded the quantitative fluorescence-based analysis intro-duced here, previous ESR experiments have shown similarmicelle−vesicle coexistence in a decanoic acid (C10) system.15
On the basis of the results described above, we present apotential scenario in which environmental fluctuations coulddrive repeated cycles of protocell growth and division. Webegin by considering a small warm pond, containing dilute fattyacids and perhaps other single-chain amphiphiles, along withother organic compounds. We assume that fatty acids werepresent at a concentration sufficient to lead to the assembly ofmicelles and vesicles. Evaporation, driven by solar or geo-thermal heat and wind, would lead to progressive concentrationof the dissolved solutes and thus to vesicle growth as material inmicelles redistributed into the pre-existing vesicles. If theincrease in surface area caused by membrane growth occurredfaster than the increase in vesicle volume, as could happen inthe presence of slowly permeating solutes such as nucleotides,amino acids, and peptides, growth would result in the formationof fragile filamentous vesicles. Our laboratory has previouslydemonstrated that such vesicles fragment easily in response togentle shear forces, resulting in division into daughter vesicles.10
Alternatively, photochemically induced membrane tension candrive vesicle division through a pearling instability, similarlyresulting in daughter vesicles.29 After a cycle of growth anddivision, an influx of fresh water, for example, as a result ofrainfall, would dilute the pond water, restoring initialconcentrations. Rapid mixing of fresh water with concentratedpond water would probably result in dissolution of manyvesicles, while slower mixing would cause vesicle shrinkage;both processes would increase the fraction of fatty acids presentas micelles. Vesicle division following growth into filamentousmorphologies could also retard shrinkage, as membrane losswould be favored from undivided vesicles, which arecharacterized by excess membrane area. Surviving vesicleswould then be poised for another cycle of growth, driven byevaporation, and division, induced either by wave-induced shearforces or photochemically.Although this model is quite speculative, it has the advantage
that cycles of growth and division would be driven entirely byenvironmental fluctuations and could continue indefinitely inthe absence of any additional input of fatty acids. If such a cyclecould be coupled to the replication of encapsulated nucleicacids, the stage would be set for the emergence of Darwinianevolution through the competitive advantage conferred byfunctional nucleic acids (e.g., ribozymes). The subsequentevolution of catalytic mechanisms to drive membrane growth,such as the assembly of double-chain lipids,12 would haveeventually freed early cells from depending on environmentalfluctuations to drive their cell cycle.
■ MATERIALS AND METHODSLipid Solutions. Fatty acids were obtained from Nu-chek and
phospholipids from Avanti Polar Lipids. Laurdan, NBD-PE (N-(7-
nitrobenz-2-oxa-1,3-diazol-4-yl)-1,2-dihexadecanoyl-sn-glycero-3-phos-phoethanolamine), and Rhodamine-DHPE (Rhodamine B 1,2-dihexadecanoyl-sn-glycero-3-phosphoethanolamine) were obtainedfrom Invitrogen. All other reagents were from Sigma-Aldrich. Fattyacid vesicles were prepared by mixing the fatty acids (as neat oil) in 0.2M bicine buffer titrated with NaOH to pH 8.5, unless otherwise noted.This was followed by vigorous vortexing and tumbling overnight.Micelle solutions were prepared by dissolving the fatty acid in waterand titrating with sodium hydroxide to pH 10.5, unless otherwisenoted. Phospholipid vesicles were prepared by thin-film rehydration ofchloroform solutions. Laurdan was incorporated into the solutions as aconcentrated stock in ethanol either before or after addition of buffer.FRET dyes were incorporated into fatty acid solutions by addition inchloroform to the neat oil, followed by rotary evaporation. Large,multilamellar vesicles used for imaging were prepared with 2 mM 8-hydroxypyrene-1,3,6-trisulfonic acid (HPTS), a water-soluble dye, inthe buffer and were isolated via extrusion through a 5 μm filterfollowed by dialysis against a 3 μm filter, as previously described.31 Allother vesicle solutions were extruded 11 times through 100 nm filterswith an Avanti mini extruder. 50 nm vesicles were prepared with anadditional 11 passes through a 50 nm filter.
Surface Tension Measurements. Surface tensions were meas-ured by the Nouy ring method on a Fisher Scientific SurfaceTensiometer 21. Samples (5 mL) were prepared by serially diluting aconcentrated (100 mM) vesicle/micelle stock and then allowed toequilibrate for at least 24 h before measuring. All measurements weretaken at 21 °C. Monomer concentrations were calculated from surfacetension plots using the Langmuir−Szyszkowski equation
σ σ− = Γ +⎜ ⎟⎛⎝
⎞⎠RT
cK
log 10 max
where σ is the measured surface tension; σ0 is the surface tension withno surfactant (72.8 dyn/cm); K is the equilibrium constant for surfaceadsorption; Γmax is the maximum surface excess; and c is the monomerconcentration. Therefore
σ σ=
−−Γ
⎛⎝⎜
⎞⎠⎟c K
e 1RT0
max
We obtained Γmax from the maximum slope of the surface tension vslog([fatty acid]) plot according to the Gibbs isotherm
σΓ = − ∂∂RT c
1log
Lastly, K was obtained by solving for c in the linear region below thecmc/cac.
Light Scattering Measurements. Light scattering intensities ofoleate and palmitoleate solutions were measured on a PDDLS/Batchsystem (Precision Detectors, Bellingham, MA). Absorbance readingsof myristoleic acid solutions were taken on an Amersham Ultraspec3100 UV/vis spectrophotometer. All measurements were taken at 21°C.
Laurdan Measurements. Steady state fluorescence readings wereperformed on a Varian Cary Eclipse fluorimeter. General polarizationvalues were calculated from emission intensities at 500 and 430 nmupon excitation at 364 nm. All measurements were taken at 21 °C.
Partition Coefficients. Micelle to vesicle partition coefficientswere derived from measured Laurdan intensities by equating observedGP to a weighted average of micelle and vesicle GPs. Characteristicvesicle (I500
v , I430v ) and micelle (I500
m , I430m ) Laurdan intensities for each
fatty acid were measured at pH 8.5 and 10.5, respectively, and aconcentration of either 30 mM (oleate, palmitoleate) or 50 mM(myristoleate). The micelle/vesicle partition was calculated by solvingfor Xm (micelle aggregation fraction) and Xv (vesicle aggregationfraction) in the following
=− + −+ + +
X I I X I IX I I X I I
GP( ) ( )( ) ( )
m 500m
430m
v 500v
430v
m 500m
430m
v 500v
430v
+ =X X 1m v
Journal of the American Chemical Society Article
dx.doi.org/10.1021/ja310382d | J. Am. Chem. Soc. 2012, 134, 20812−2081920817

where GP is the measured Laurdan polarization for the given sample.We note that this approach carries several assumptions: (1) the onlyexisting aggregates are micelles or vesicles, with Laurdan equallydistributed between them on a molar basis and with minimalcontribution from the monomer phase; (2) Laurdan emission ratiosat high concentrations (30 or 50 mM) at pH 8.5 or pH 10.5approximate that in a pure vesicle or pure micelle solution,respectively. The latter assumption is limited by the excess lightscattering of more concentrated vesicle solutions and the differingpKa's of the fatty acids, which likely result in a micelle:vesicle ratio of>0 at pH 8.5 and the reference concentrations used. Partitioncoefficients are therefore expressed as “apparent Xm/Xv”, which arerelative to the solution standard used.Micelle/vesicle partition coefficients were also derived from
absorbance at 400 nm (Abs400c ). The vesicle fraction was calculated
as proportional to the normalized absorbance for the concentrationabove the cac (2 mM for myristoleate). The micelle fraction wasassumed to be the difference between this and the normalized vesicleabsorbance at 50 mM (Abs400
v ), assuming Xv ∼ 1 at 50 mM. Therefore
= *−
= * −−
= −− −
⎛⎝⎜
⎞⎠⎟
⎛⎝⎜
⎞⎠⎟
X kc
X kc
XX c c
Abscac
AbsAbs
cac
AbsAbs
cac/
Abscac
c
c
c c
v400
m 400v 400
m
v400v 400 400
where k is the inverse of the absorption per unit concentration of 50nm myristoleate vesicles and c is the solution concentration. Thisderivation involves the same assumptions used as for the Laurdanpartition coefficients and is therefore comparable.Vesicle Growth. Growth and shrinkage of 100 nm myristoleate
vesicles was monitored as previously described.12,18 Briefly, 10 mMmyristoleate vesicles were prepared with equal fractions of Rhod-amine-DHPE and NBD-DHPE at a concentration of 0.2 mol %relative to total lipids. During experiments, FRET was recorded on aCary Eclipse fluorimeter (excitation 430 nm) by quantifying FRETefficiency, Fε
= −ε∞
FE
E1 D
D,
where ED is the emission of the donor (530 nm) and ED,∞ theemission of the donor at infinite dilution, which was measured viaaddition of 1% Triton X100 at the end of the experiment. All valueswere adjusted for changes in volume. FRET efficiency was equated tosurface area using a standard curve of 10 mM myrisoleate with varyingconcentrations of FRET dyes. Growth of large vesicles was observedon a Nikon TE2000-S inverted microscope using a 60X extra longworking distance objective. All measurements were taken at 21 °C.Solution Evaporation. Vesicle solutions (5 mM in 400 μL of 0.1
M Na+ bicine) were agitated via a stir bar in opaque 5 mL vials at 35°C. Agitation was used to keep solutions homogeneous and preventfilms from forming on the side of the vials. This method led to anevaporation rate of approximately 10 μL/h. Identical experiments werealso performed without evaporation (using capped vials) to confirmthat there was no measurable bleaching and/or dye degradation intime scales up to 40 h. Predicted relative surface area (SA) as afunction of final concentration (c) was derived from the quadraticcurve fit of the apparent Xm/Xv as a function of concentration in Figure5B using the following
= − +⎡⎣⎢⎢⎛⎝⎜
⎞⎠⎟
⎛⎝⎜
⎞⎠⎟
⎤⎦⎥⎥c
XX
XX
SA( ) 1c
m
v 5mM
m
v
where ((Xm)/(Xv)5mM) is the micelle−vesicle partition at 5 mM (initialconcentration) and ((Xm)/(Xv)c) is the micelle−vesicle partition at thefinal concentration.
■ ASSOCIATED CONTENT*S Supporting InformationSupplemental figures and schemes. This material is availablefree of charge via the Internet at http://pubs.acs.org.
■ AUTHOR INFORMATIONCorresponding [email protected] Address†Miller Institute for Basic Research in Science, University ofCalifornia, Berkeley, 2536 Channing Way, Berkeley, CA 94720,USA.NotesThe authors declare no competing financial interest.
■ ACKNOWLEDGMENTSJ.W.S. is an investigator of the Howard Hughes MedicalInstitute. This research was supported in part by grant EXB02-0031-0018 from the NASA Exobiology Program to J.W.S. I.B.was supported by a fellowship from Harvard University. A.D.was supported by a fellowship from the Harvard Origins of LifeInitiative. The authors thank Noam Prywes, Raphael Bruckner,Christian Hentrich, Craig Blain, and Anders Bjorkbom forhelpful discussions and comments on the manuscript.
■ REFERENCES(1) Gebicki, J. M.; Hicks, M. Nature 1973, 243, 232−234.(2) Hargreaves, W. R.; Deamer, D. W. Biochemistry 1978, 17, 3759−3768.(3) Rushdi, A. I.; Simoneit, B. R. Origins Life Evol. Biospheres 2001,31, 103−118.(4) Simoneit, B. R. T. Adv. Space Res. 2004, 33, 88−94.(5) Yuen, G. U.; Kvenvolden, K. A. Nature 1973, 246, 301−303.(6) Deamer, D. W. Nature 1985, 317, 792−794.(7) Hanczyc, M. M.; Fujikawa, S. M.; Szostak, J. W. Science 2003,302, 618−622.(8) Mansy, S. S.; Schrum, J. P.; Krishnamurthy, M.; Tobe, S.; Treco,D. A.; Szostak, J. W. Nature 2008, 454, 122−125.(9) Mansy, S. S.; Szostak, J. W. Proc. Natl. Acad. Sci. U.S.A. 2008, 105,13351−13355.(10) Zhu, T. F.; Szostak, J. W. J. Am. Chem. Soc. 2009, 131, 5705−5713.(11) Chen, I. A.; Roberts, R. W.; Szostak, J. W. Science 2004, 305,1474−1476.(12) Budin, I.; Szostak, J. W. Proc. Natl. Acad. Sci. U.S.A. 2011, 108,5249−5254.(13) Cistola, D. P.; Hamilton, J. A.; Jackson, D.; Small, D. M.Biochemistry 1988, 27, 1881−1888.(14) Haines, T. H. Proc. Natl. Acad. Sci. U.S.A. 1983, 80, 160−164.(15) Dejanovic, B.; Mirosavljevic, K.; Noethig-Laslo, V.; Pecar, S.;Sentjurc, M.; Walde, P. Chem. Phys. Lipids 2008, 156, 17−25.(16) Fukuda, H.; Goto, A.; Yoshioka, H.; Goto, R.; Morigaki, K.;Walde, P. Langmuir 2001, 17, 4223−4231.(17) Blochliger, E.; Blocher, M.; Walde, P.; Luisi, P. L. J. Phys. Chem.B 1998, 102, 10383−10390.(18) Chen, I. A.; Szostak, J. W. Biophys. J. 2004, 87, 988−998.(19) Budin, I.; Bruckner, R. J.; Szostak, J. W. J. Am. Chem. Soc. 2009,131, 9628−9629.(20) Budin, I.; Szostak, J. W. Annu. Rev. Biophys. 2010, 39, 245−263.(21) Parasassi, T.; Krasnowska, E. K.; Bagatolli, L.; Gratton, E. J.Fluoresc. 1998, 8, 365−373.(22) Harris, F. M.; Best, K. B.; Bell, J. D. Biochim. Biophys. Acta,Biomembr. 2002, 1565, 123−128.(23) Bruckner, R. J.; Mansy, S. S.; Ricardo, A.; Mahadevan, L.;Szostak, J. W. Biophys. J. 2009, 97, 3113−3122.
Journal of the American Chemical Society Article
dx.doi.org/10.1021/ja310382d | J. Am. Chem. Soc. 2012, 134, 20812−2081920818

(24) Parasassi, T.; De Stasio, G.; Ravagnan, G.; Rusch, R. M.;Gratton, E. Biophys. J. 1991, 60, 179−189.(25) Clint, J. H. Surfactan Aggregation; Blackie: Glasgow and London,1992.(26) Tanford, C. The Hydrophobic Effect: Formation of Micelles andBiological Membranes, 2nd ed; Wiley: New York, 1980.(27) Mahieu, N.; Canet, D.; Cases, J. M.; Boubel, J. C. J. Phys. Chem.1991, 95, 1844−1846.(28) Huang, J. B.; Zhao, G. X. Colloid Polym. Sci. 1995, 273, 156−164.(29) Zhu, T. F.; Adamala, K.; Zhang, N.; Szostak, J. W. Proc. Natl.Acad. Sci. U.S.A. 2012, 109, 9828−9232.(30) Israelachvili, J. N.; Mitchell, D. J.; Ninham, B. W. J. Chem. Soc.,Faraday Trans. 2: Mol. Chem. Phys. 1976, 72, 1525−1568.(31) Zhu, T. F.; Szostak, J. W. PLoS One 2009, 4, e5009.
Journal of the American Chemical Society Article
dx.doi.org/10.1021/ja310382d | J. Am. Chem. Soc. 2012, 134, 20812−2081920819