Embed Size (px)
Citation preview
Concentration, Market Power, and Cost Efficiency in the Corn Seed Industry
Jorge Fernandez-Cornejo
David Spielman
2002 Annual Meeting of the American Agricultural Economics Association Long Beach, CA, July 28-31, 2002
April, 2002
Abstract. The paper presents a model developed to examine the effects of industry concentration
on market power and cost efficiency in the seed industry. In addition, the paper presents
preliminary measures of the relative strengths of these effects for the case of the U.S. corn seed
industry over the past 3 decades. The model uses conjectural elasticities and is estimated using
data collected from USDA sources. The empirical results allow us to distinguish between the
market power and cost effects of concentration, and to ascertain the tradeoff between the cost
efficiency and market power resulting from higher concentration in the corn seed industry.
Economic Research Service, USDA, 1800 M Street, NW, Room 4052, Washington DC, 20036, phone 202-694-5537, [email protected]. Do not cite, reproduce, or distribute without permission of the authors. The views expressed are those of the authors and do not necessarily correspond to the views or policies of the U.S. Department of Agriculture.
1
Concentration, Market Power, and Cost Efficiency in the Corn Seed Industry*
The total market value of purchased seed in the U.S. has grown significantly over the past
decades. This growth is particularly rapid in the seed markets for major field crops – corn,
soybeans, wheat and cotton – where total U.S. market value increased from about $3.30 billion in
1982 to $4.70 billion by 1997. This market growth is the result of increases in the use of purchasd
seed, a trend which itself arises from seed productivity increases that are attributable to scientific
improvements in plant breeding over the past decades.
Since its inception, the corn seed market has been characterized by a combination of small
firms – 105 of the original 190 companies operating in the 1930s were still in existence in the
1990s – and larger market leaders such as Hi-Bred Corn Company (which later became Pioneer),
Funk Brothers Seed Company, Dekalb Agricultural Association, and Pfister Hybrid Corn (Morris,
1998, p. 198). The size and success of the corn seed market is reflected by the fact that nearly all
acreage planted in 1997 used purchased seed.
Until the 1970s, the corn seed market was relatively unconcentrated and was characterized
by small firms controlling approximately 30 percent of the industry, and by larger market leaders
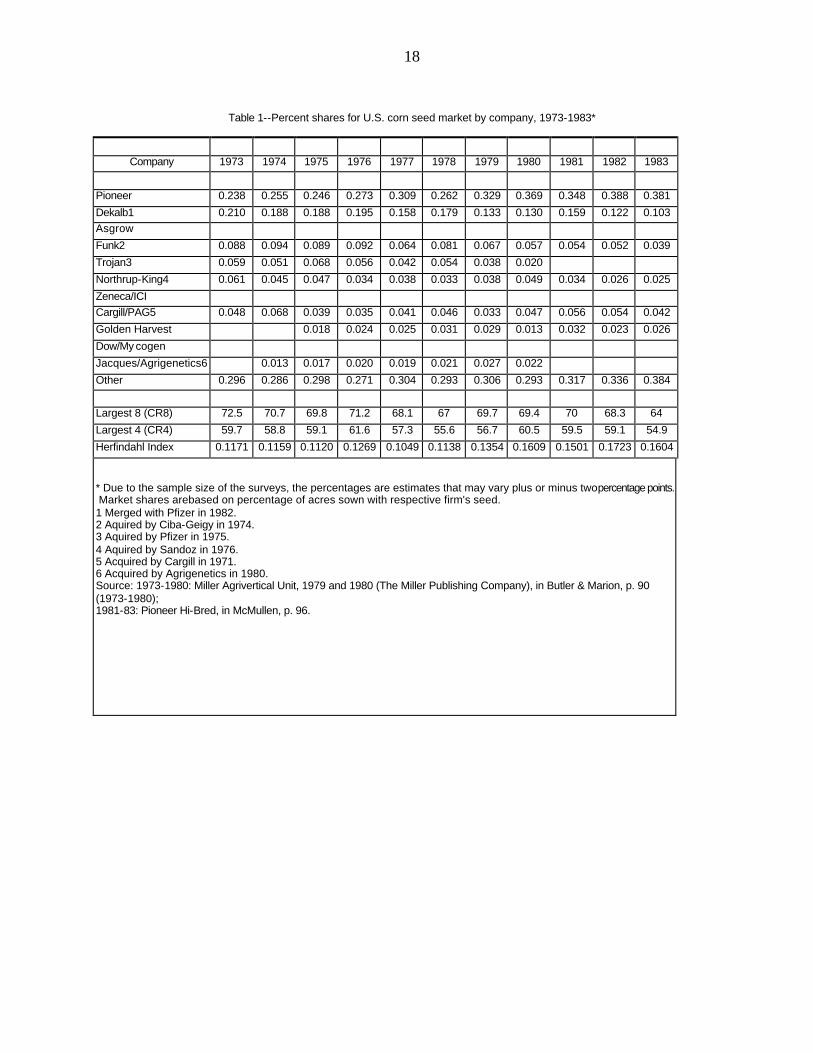
controlling 70 percent. Industry studies conducted between 1973 and 1983 estimate the CR4 ratio
in the U.S. corn seed industry at approximately 60 percent (table 1).
[TABLE 1 HERE]
By the early 1980s, Pioneer had expanded to control 38 percent of the market while most
other large firms, including its largest competitor, Dekalb, experienced sharp declines in their
respective market shares. The decline of other large firms, and the concurrent expansion of
* Do not reproduce, quote, cite or distribute without the permission of the authors. The views expressed are those of the authors and do not necessarily correspond to the views or policies of the U.S. Department of Agriculture.
2
market share held by smaller firms, is reflected in a decrease in the share of the four largest firms
(concentration ratio 4--CR4) between 1973 and 1983 from 60 to 55 percent. In recent years,
market concentration in corn seed has grown with the strategic entry of multinational firms. By
1997, the CR4 had risen to 69 percent as Pioneer (now part of DuPont) continued to hold some 40
percent of the market, followed by Monsanto with 15 percent and Novartis/Syngenta with nine
percent (table 2). Smaller firms still control over 20 percent of the market.1
[TABLE 2 HERE]
The increase in industry concentration raises concerns about its potential impact on market
power. However, as shown in Williamson’s early paper, there may be a tradeoff between the
increased market power and the economies resulting from the increased concentration (arising
from the merger or other combination). For the case of the seed industry, if the impact on market
power predominates, concentration may be raising industry profits and margins and farmers may
be paying higher-than-competitive prices for the seed input. On the other hand, if the efficiency
(or cost reducing) effects outweigh the market power effects, concentration may be beneficial to
society as a whole.
The objective of this paper is to develop a model to examine the effects of industry
concentration on market power and costs (including research and development) in the U.S. corn
seed industry, and to measure the relative strengths of these effects over the past 3 decades.
1 By comparison, the seed industry is more concentrated than the pesticides industry, which provides another key agricultural input. Considering corn and cotton, where both seed and pesticide inputs are primarily purchased from the private sector, the CR4 ratio is higher in seed production than in pesticide production. From 1972 to 1989, the estimated CR4 ratio for the pesticide market averaged 45 percent [Ollinger and Fernandez-Cornejo, 1995], compared with 60 percent for the cottonseed market and 58 percent in the corn seed market, both of which have increased in recent periods.

3
Seed R&D, Production, Marketing and Distribution
The seed industry can be viewed in terms of three separate functions: Research and development
(R&D) in plant breeding, seed production/conditioning, and marketing/distribution.
R&D in plant breeding forms the basis of the modern seed industry. Through the
application of science, plant breeders develop seeds embodying quality improvements such as
high yields, resistance to disease and pests, or traits specific to regional agroclimatic conditions.
In addition to the high R&D costs associated with a successful plant breeding program, plant
breeders face both the risk of imitation by competing seed firms and the risk of seed reproduction
by farmers themselves. As a solution to this appropriability problem and its social consequences,
the U.S. has in place intellectual property rights (IPR) that provide incentives to the private sector
by offering patents and protection certificates granting exclusive rights over production and
distribution of new plant varieties.
While R&D costs vary among the different seed markets, it is generally believed that R&D
costs contribute to an important portion of the cost of seed, particularly for hybrids or transgenic
seeds. In recent decades, private sector R&D costs have been rising with the application of new
technologies, and much of the increase in seed prices has been associated with this trend (Krull et
al., 1998, pp. 133-134). Given the size of their R&D investments, plant breeders often play a
central role in managing the entire production, distribution and marketing phases, resulting in
extensive vertical integration of the seed industry (Butler and Marion, 1985, pp. 18-19).
Integrated seed firms typically contract out the production and multiplication processes to
farmers, farmers’ associations, and private firms. Breeders provide contract growers the
foundation seed to produce either more foundation seed for continued R&D purposes, or
4
registered seed for large-scale production purposes.2 Registered seed is contracted out in a similar
manner to produce certified seed, which after being conditioned and distributed is sold to farmers
as certified seed.3
The production of both registered and certified seed through contract growers is a closely
managed process. Seed firms maintain close supervision over the process to ensure that the
desirable plant characteristics are carried through to subsequent generations, and to prevent open
pollination, disease or pest infestation, or other types of problems which could affect product
quality. Contract growers are carefully selected by seed firms: a contract grower is typically a
farmer with demonstrated management capacity and the ability to meet the seed firm’s precise
standards for cultivating seed plots. Seed firms disperse seed growing contracts throughout the
U.S. to minimize disease and weather risks, and may intentionally overproduce to ensure adequate
supply and excess inventories (Leibenluft, 1981, p. 109).
Contract growers are also provided with technical assistance or supervision from the seed
firm, requiring them to maintain a flexible outlook on their crop management practices.
Everything from seedbed preparation and planting densities to the timing of input application are
closely controlled (Agrawal et al., 1998, pp. 106-107). A contract typically requires that the seed
firm pay the contract grower a margin above the commodity market prices for the seed to ensure
that optimal growing conditions are maintained to produce a good quality product (Agrawal, 1998,
p. 115). For example, a contract payment formula may stipulate that the grower payment is based
on an adjusted yield times the expected price of the commodity (such as a futures price). The
2 Foundation seed is high quality, genetically pure, parent seed stock that is produced from the original seed developed by plant breeders, and is produced in quantities adequate for use in seed multiplication. Registered seed is seed grown from foundation seed to increase the scale of commercial multiplication and production (though in some states and for some crops, this category is not used). 3 Certified seed is seed that is sold commercially to farmers and conforms to certain standards of genetic purity and quality established by state agencies (Agrawal, 1998, pp. 104-105, Butler and Marion, 1985, p. 16).
5
adjusted yield is equal to a typical yield plus the difference between the contract grower’s yield
and the typical (regional average) yield times a coefficient to transform seed yield to commodity
yield (Chu et a., 1996; Preckel et al., 1997). The grower receives an additional bonus (10 percent
has been reported) to make the contract desirable.
Once harvested, certified seed is conditioned for sale to farmers, a process that typically
includes drying, cleaning, sorting of the seed, treating it with insecticides and fungicides, and
packaging it for distribution and sale (Krull et al., 1998, p. 133; Seed World, p. 41). Seed is also
subject to inspection under various State programs to ensure that the final product meets certain
quality standards. This may include tests for purity, germination, presence of noxious weed seeds,
and moisture content.
The last stage is marketing and distribution. Large seed firms play a direct role in
marketing and distributing their end product to regional, national and international markets. Many
firms also license or outsource marketing and distribution to private firms and individuals to
improve access to local markets. (Butler and Marion, 1985, p. 16). Advertising and promotion are
necessary to distinguish a seed firm’s product from other firm’s products on the market, to educate
dealers on the best crop management practices to ensure seed productivity, and to induce farmers
to adopt the firm’s particular seed.
Distribution costs include costs of transportation and communication between production
facilities, wholesalers, retailers and farmers, as well as storage costs (including financial costs) if
seed is held as inventory between seasons (Krull et al., 1998, pp. 133-134; Agrawal, 1998, p. 120).
Local distribution is typically run by independent agents such as farmer-dealers, farmers’
associations, company salespeople, and private wholesalers and retailers (Leibenluft, 1981, p.

6
109).4
The Theoretical Framework
Prior Work
There is a growing body of literature on models designed to estimate the degree of non-
competitive behavior in a given industry. Appelbaum (1979) provides an early econometric model
capable of testing and parameterizing the degree of monopoly power in an individual industry.
Models developed by Iwata (1974), Gollop and Roberts (1979) and Appelbaum (1982) are capable
of estimating the degree of oligopoly power within an industry. Oligopoly models assume that
firm behavior is interdependent within a given industry, and provide estimates of the degree of
price-taking behavior and the conjectural variations in firm production choices. In the conjectural
variation approach, firms are hypothesized to simultaneously and independently choose their
output levels given their beliefs about their rivals’ reactions to their output choices. Estimates of
conjectural variation, expressed as an elasticity (the firm’s conjectural variation multiplied by its
market share), determine the rate of change in industry output given a change in the rate of a
firm’s output. These approaches follow the general lines of the so-called “New Empirical
Industrial Organization” (NEIO).
Recent studies extend NEIO approaches to simultaneous estimations of price-taking
behavior in output as well as factor markets, i.e., where the firm or firms exhibit market power
both as consumers of inputs and producers of outputs. Just and Chern (1980) provide a model that
examines oligopsony power in tomato processing and Schroeter (1988) develops a model to
4 In general, the number of firms involved in the seed industry increases as we move through the production process: plant breeding is a concentrated stage of the industry, while the distribution of certified seed is carried out by hundreds of companies operating in different volumes and markets (Butler and Marion, 1985, pp. 16-17).
7
examine the degree of monopolistic and monopsonistic power in the beef packing industry.
Sexton (1990), Azzam and Pagoulatos (1990), Schroeter and Azzam (1991), and Wann and
Sexton (1992) extend this work and test the degree of oligopoly and oligopsony power and
estimate conjectural elasticities in the beef-packing industry and other food industries. The
conjectural variation approach has been extended further to distinguish between the market power
and cost-efficiency effects of industry concentration (Azzam and Schroeter, 1995; Azzam, 1997).
The Model
Our model follows the general lines of the so-called “New Empirical Industrial Organization”
(NEIO) which became the cornerstone of industry conduct analysis through the use of conjectural
elasticities (Wann and Sexton, 1992). The main limitation of this type of analysis is the absence
of firm-level panel data, forcing researchers to consider the problem at the industry level.
Analysis at this level requires extensive collection of time-series data including firm market
shares, R&D investment, output quantities, and input and output prices.
We assume that the seed firm buys its inputs, including the material input --seed purchased
from contract growers-- in a competitive market, and sells the seed to corn growers in a
noncompetitive market. Thus, we can assume fixed proportions between the material input and
the seed output while the other inputs are used in variable proportions. Consider the ith seed firm
maximization problem and set up its restricted profit function:
ði = Xqi
Max {[P(Q) – W]qi – Ci(qi,LL ,Z)} (1)
where P denotes the output price of seed, qi is the output quantity of firm i (i = 1,2, ..., n) such that
total industry output is Q = Óqi, W is the price of the material input, i.e., the price paid by seed
firms to contract seed growers; Ci is the restricted cost function for the ith seed firm (including
8
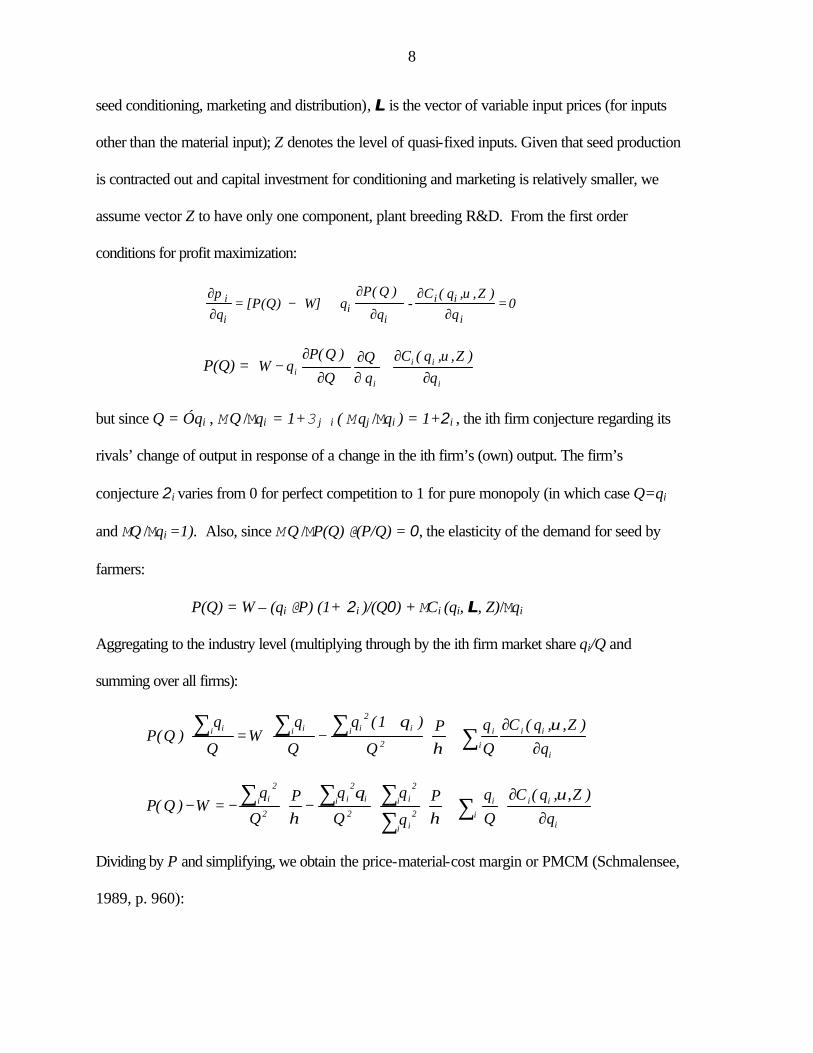
seed conditioning, marketing and distribution), LL is the vector of variable input prices (for inputs
other than the material input); Z denotes the level of quasi-fixed inputs. Given that seed production
is contracted out and capital investment for conditioning and marketing is relatively smaller, we
assume vector Z to have only one component, plant breeding R&D. From the first order
conditions for profit maximization:
0q
)Z,,q(C
q
)Q(P q W][P(Q)
q i
ii
ii
i
i =∂
∂∂
∂+−=
∂∂ υπ
-
P(Q) = i
ii
ii q
)Z,,q(CqQ
Q
)Q(PqW
∂∂
+∂∂
∂
∂−
υ
but since Q = Óqi , M Q /Mqi = 1+3j�i ( M qj /Mqi ) = 1+2i , the ith firm conjecture regarding its
rivals’ change of output in response of a change in the ith firm’s (own) output. The firm’s
conjecture 2i varies from 0 for perfect competition to 1 for pure monopoly (in which case Q=qi
and MQ /Mqi =1). Also, since M Q /MP(Q) @ (P/Q) = 0, the elasticity of the demand for seed by
farmers:
P(Q) = W – (qi @ P) (1+ 2i )/(Q0) + MCi (qi, LL , Z)/Mqi
Aggregating to the industry level (multiplying through by the ith firm market share qi/Q and
summing over all firms):
∑∑∑∑∂
∂+⋅
+−⋅=⋅
ii
iii2
ii
2ii ii i
q
)Z,,q(C
Q
qPQ
)1(q
Q
qW
Q
q)Q(P
υη
θ
∑∑∑∑∑
∂∂
⋅+⋅⋅ −⋅ −=−i
i
iii
i
2i
i
2i
2
ii
2i
2i
2i
q
)Z,,q(C
Q
qP
q
q
Q
qPQ
qW)Q(P
υη
θ
η
Dividing by P and simplifying, we obtain the price-material-cost margin or PMCM (Schmalensee,
1989, p. 960):

9
∑ ∂∂⋅+ +−=−=
ii
iii
q)Z,,q(C
)P1
()1(H
PWP
PMCMυ
ηΘ (2)
where Óq2i / Q2 = Ó (qi /Q)2 = H is the Herfindahl-Hirschmann Index (HHI) (the sum of squared
market shares of each firm in the industry) and 1 = Óq2i 2i/Óq2
i is a weighted average of the n
firms conjectural variations (Cowling and Waterson, 1976; Azzam, 1997).5
Following Azzam (1997), we can interpret the right hand side of equation (2) as the sum of
two components. The first term measures the market power effect, the second term is the marginal
cost effect (weighed average of the firms’ marginal costs). Unlike Azzam, however, this second
component has two parts, a processing cost effect and a R&D cost effect, as it is shown below.
Using the Generalized Leontief restricted cost function in the empirical model (Diewert,
1974):
Ci(qi, L, Z) = qi@3k 3l $kj (Lk Ll)1/2 + qi@3k $kz (Lk Z )1/2 + qi @ $zz (Z Z )1/2 + qi2 3k $k Lk + qi
2 $z Z (3)
where the sums are over all the variable inputs (k, l) included in the cost function. The marginal
cost is:
MCi (qi,L, Z)/Mqi = 3k 3l $kl (Lk Ll )1/2 +3k $kz (Lk Z )1/2 +$zz (Z Z )1/2 + 2 qi 3k $kLk + 2 qi $z Z
Substituting the expression for marginal cost into (2) we obtain the final expression of the
price-material-cost margin or PMCM = (P–W)/P:6
+
∑∑ ∑∑ +++++−=k
)l P
k(k
kHQ2)PZ(ZZ
k P
2/1)Zk(kZP
2/1)lk(kl
)1(HPMCMυ
ββυ
βυυ
βη
ΘHQ$z(Z/P) (4)
Thus, the PMCM is a function of a measure of industry concentration, seed demand elasticity,
5 The Herfindahl-Hirschmann Index is the appropriate index to measure market concentration particularly when explaining prices where firms behave according to a Cournot model of noncooperative oligopoly in which firms chose output to maximize profits. 6 Note that since B= P-W-C (where C includes all costs other than the material input cost W) then P-W= B+C and the margin becomes: PMCM = (B+C)/P.
10
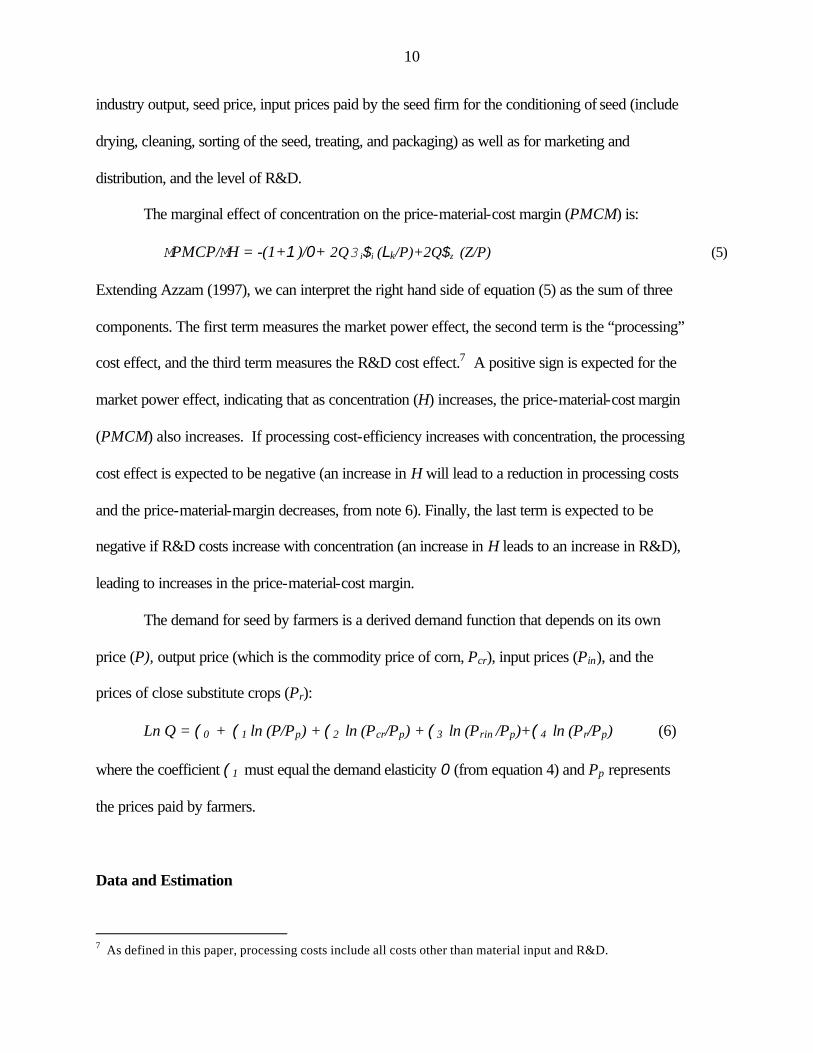
industry output, seed price, input prices paid by the seed firm for the conditioning of seed (include
drying, cleaning, sorting of the seed, treating, and packaging) as well as for marketing and
distribution, and the level of R&D.
The marginal effect of concentration on the price-material-cost margin (PMCM) is:
MPMCP/MH = -(1+1)/0+ 2Q3i$i (Lk/P)+2Q$z (Z/P) (5)
Extending Azzam (1997), we can interpret the right hand side of equation (5) as the sum of three
components. The first term measures the market power effect, the second term is the “processing”
cost effect, and the third term measures the R&D cost effect.7 A positive sign is expected for the
market power effect, indicating that as concentration (H) increases, the price-material-cost margin
(PMCM) also increases. If processing cost-efficiency increases with concentration, the processing
cost effect is expected to be negative (an increase in H will lead to a reduction in processing costs
and the price-material-margin decreases, from note 6). Finally, the last term is expected to be
negative if R&D costs increase with concentration (an increase in H leads to an increase in R&D),
leading to increases in the price-material-cost margin.
The demand for seed by farmers is a derived demand function that depends on its own
price (P), output price (which is the commodity price of corn, Pcr), input prices (Pin), and the
prices of close substitute crops (Pr):
Ln Q = (0 + (1 ln (P/Pp) + (2 ln (Pcr/Pp) + (3 ln (Prin /Pp)+(4 ln (Pr/Pp) (6)
where the coefficient (1 must equal the demand elasticity 0 (from equation 4) and Pp represents
the prices paid by farmers.
Data and Estimation
7 As defined in this paper, processing costs include all costs other than material input and R&D.
11
Analysis at the industry level requires extensive collection of time-series data including firm
market shares, levels of R&D, output quantities, and input and output prices. Most data for this
research were collected from USDA and other government sources for the period covering 1970 to
1998.
We begin with the data required to estimate the price-material-cost margin or PMCM
equation. The output price of corn seed – the price paid by farmers to seed firms or their agents (P)
– is taken from USDA’s Agricultural Statistics for various years between 1970 and 1998. The
material-input price of corn seed – the price paid by seed firms to contract seed growers for the
seed (W) – is estimated based on a markup relative to the commodity price of corn given in
USDA’s Agricultural Statistics for various years between 1970 and 1998. This markup is the
premium which seed companies would pay to contract growers for quality seed grown under
controlled conditions and is based on a formula that accounts for corn yield differences (between
producers of commodity coron and the contract grower whose main purpose is to grow seed
contract), prevailing commodity prices of corn and a bonus to incentive contract growers of seed
(formula (Leibenluft, 1981, p. 109; Chu et al., 1996).
Industry concentration, a key determinant of seed industry margins, is measured using the
Herfindahl-Hirschmann Index. The HHI is calculated from market shares obtained from data from
various sources (see tables 1 and 2). The evolution of the U.S. corn seed industry concentration
over the past 30 years, measured by the HHI as well as by the CR4, is also shown in tables 1 and
2.
The vector of variable, non-material input prices (LL ) includes the prices of labor, energy,
transportation, and advertising and other services. Labor is used in the seed conditioning process.
The labor price index is calculated from average hourly wages (seasonally adjusted) for the
12
agricultural sector, taken from the USDA’s Agricultural Statistics (various years). Energy is used
mainly in the seed conditioning process (for drying, cleaning, sorting, packaging, etc.). Energy
prices are proxied by electricity sold by utility companies to industrial customers per kilowatt-
hour, taken from the DOE’s Energy Information Agency (2001). Transportation is used to move
the seed between the production facilities, wholesalers, and retailers. The price of transportation
services is proxied by the price of diesel per gallon, taken from USDA’s Agricultural Statistics for
various years. The price index for advertising and other services (such as marketing and
distribution) is calculated from the seasonally adjusted wages for total private industry
(Department of Labor’s Bureau of Labor Statistics, 2001). We allow for substitution possibilities
between labor and energy.
R&D as a determinant of seed industry margins enters the specification as a quasi-fixed
input (as a level Z). R&D is measured in terms of the cumulative number of PVP’s certificates for
new corn varieties issued to private firms by the USDA’s Plant Variety Protection Office
beginning in 1970 (USDA, AMS, PVPO, 2001).
Data for the demand-for-seed equation include the quantity of corn seed (Q) produced and
sold to farmers by the seed industry, obtained from the USDA’s Published Estimates Data Base
(USDA, NASS, 2001). Corn output prices and quantities are obtained from USDA’s Agricultural
Statistics (various years). The index of prices paid by farmers (otherwise known as the Parity
Index or Index of Prices paid by Farmers for Commodities and Services, Interest, Taxes, and
Wage Rates) as well as the index of prices received by farmers are both taken from USDA’s
Agricultural Statistics for various years. All prices in the seed demand equation are normalized
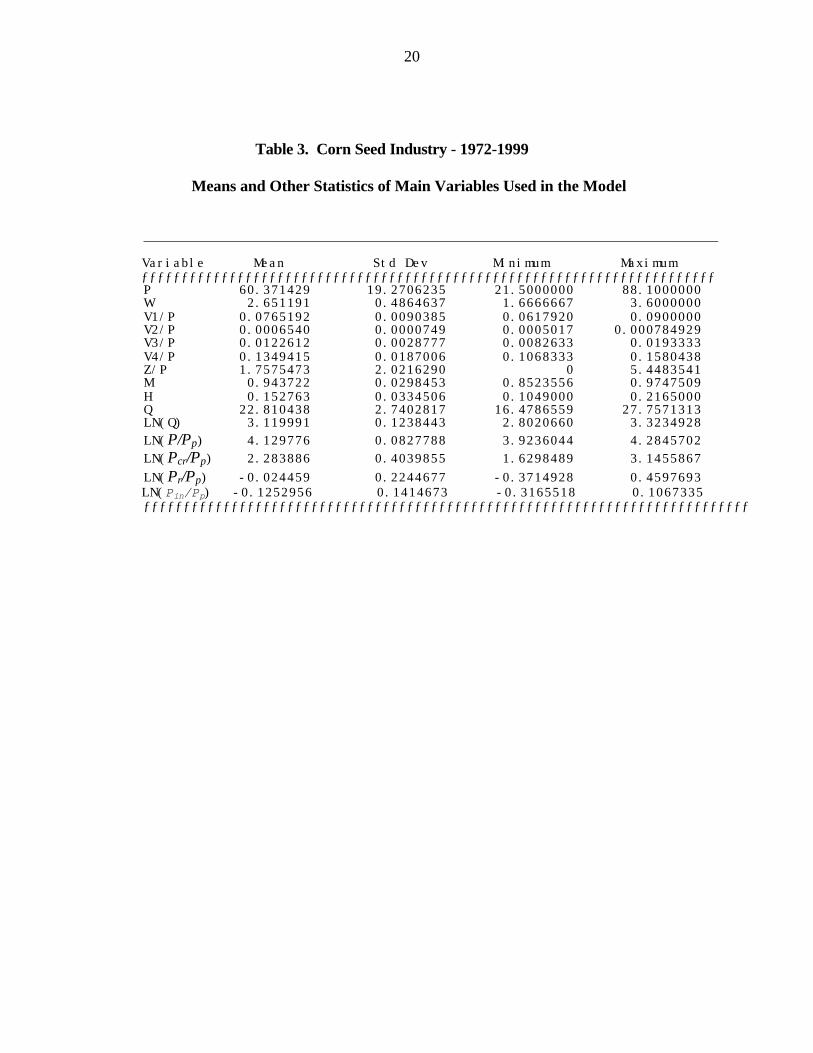
using as the numeraire the index of prices paid by farmers. Table 3 provides the means and other
basic statistics of the main variables used in the model.
Since concentration has been shown to be endogenous (Azzam, 1997), the price-cost seed
13
margin equation (4) and the seed demand equation (6) are estimated together using nonlinear
three-stage least squares (N3SLS), which has been shown to be a consistent estimator.
Results
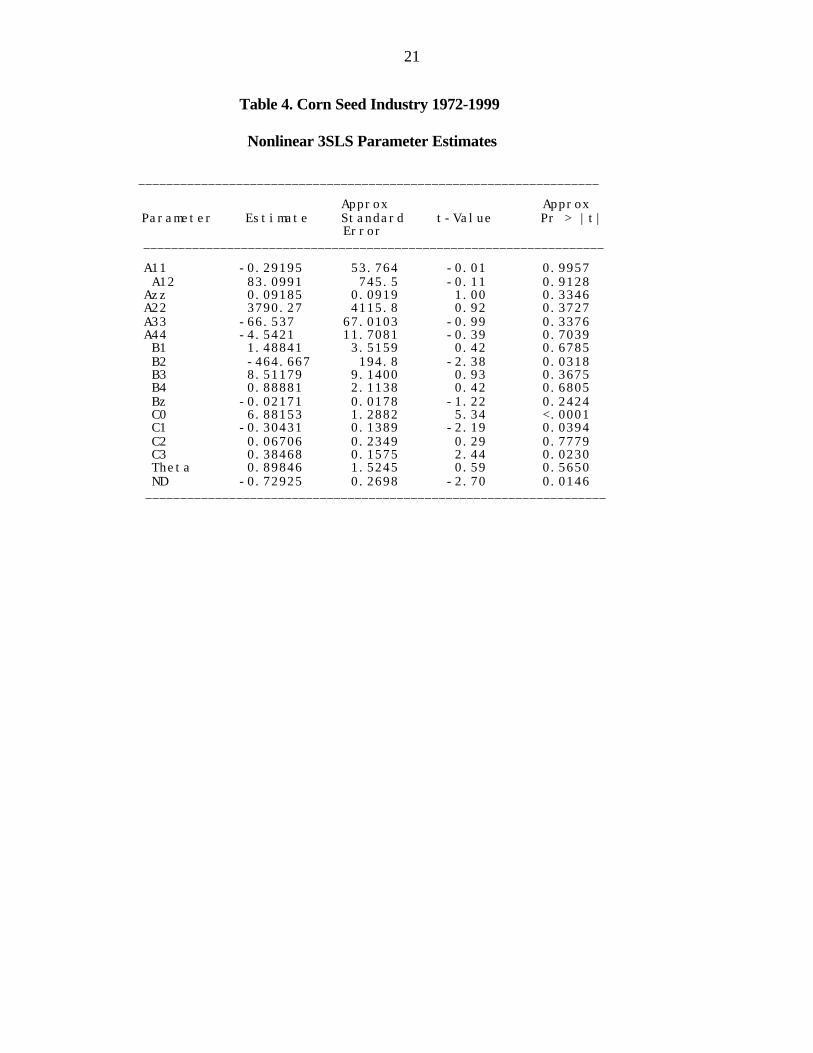
The results of the three-stage least squares parameter estimates for the price-margin and demand
equations are presented in table 4. The empirical regression estimates also allow us to ascertain
the relative importance of market power and cost efficiency effects of industry concentration and
thus determine if the overall economic benefits have outweighed the costs for this industry during
the period of analysis.
From equation (5) the market power effect (MPE) at the means of the data is:
MPE = -(1+1)/0 = -(1+0.899)/(-0.729) = + 2.60
However, the parameter 1 is statistically insignificant. Thus, while MPE has the expected
sign (concentration is associated with increasing margins), it is also insignificant.8 This result
suggests that concentration (H) had a negligible effect on market power for the corn seed industry
for the period analyzed.
The processing cost effect (PCE) at the mean, also from equation (5) is given by:
PCE = 2Q3i$i ( vi/P) = 2(22.81)(0.30)
PCE = - 13.86
This result agrees with our expectation and suggests that as concentration (H) increases
processing costs decrease, as efficiency improves. The decrease in costs leads to lower price-
material-cost margins, since PMCM = (B+C)/P, as shown in note 6.
The R&D cost effect at the mean (also from equation 5) is:
RCE = +2Q$z (Z/P)
RCE = +2(22.81)(-0.022)(1.758)
14
RCE = -1.76
This would mean that as concentration (H) increases, R&D costs for plant breeding decrease,
leading to lower price-material-cost margins. However, the parameter $z is statistically
insignificant.
Replacing the terms that are not significant with zeros, the total effect is TE = 0–13.86+0 =
-13.86. This means that because of the cost reduction effect, the overall effect of concentration
appears to be economically beneficial for the corn seed industry over the period analyzed. More
explicitly, if concentration H were to increase by 0.01, the price-material-input-cost margin
(PMCM) would decrease by 0.139. That is, if H increases from the means (0.15) to 0.16, the
margin would decrease from the means (0.95) to 0.81. Thus, the total margin-decreasing effect of
concentration in the corn seed industry is the result of the processing-cost-reducing effect
prevailing over the market-power enhancing effect of concentration.
Conclusions
This paper develops a model to examine the effects of industry concentration on market power,
processing costs, and R&D costs in the U.S. cotton seed industry. In addition, the paper presents
preliminary measures of the relative strengths of these effects over the past 30 years. Preliminary
results show that, in the U.S. corn seed industry, a strong processing-cost-reducing effect
overpowers the market-power enhancing effect of concentration. These preliminary results are
valid only for corn and are limited by the quality of the data, which in some cases is not very
satisfactory. More definitive results will be obtained as more data are available and the model is
refined accordingly.
8 The standard error of MPE was also calculated following Greene (1993, 1997).

15
References
Agrawal, P.K., B.D. Agrawal, P. Venkat Rao and Jai Singh. 1998. “Seed Multiplication, Conditioning and Storage.” In Morris, Michael L., Ed. Maize Seed Industries in Developing Countries. Boulder, CO: CIMMYT, pp. 103-124. Appelbaum, E. 1979. “Testing Price Taking Behavior.” Journal of Econometrics (9): 283-94. Appelbaum, E. 1982. “The Estimation of the Degree of Oligopoly Power.” Journal of Econometrics (19): 287-99. Azzam, A. 1997. “Measuring Market Power and Cost-Efficiency Effects of Industrial Concentration.” Journal of Industrial Economics 45(4): 377-86. Azzam, A. and E. Pagoulatos. 1990. “Testing Oligopolistic and Oligopsonistic Behavior: An Application to the U.S. Meat Packing Industry.” Journal of Agricultural Economics (41): 362-70. Azzam, A. and J.R. Schroeter. 1995. “The Tradeoff Between Oligopsony Power and Cost Efficiency in Horizontal Consolidation: An Example from Beef Packing.” American Journal of Agricultural Economics (77): 825-36. Butler, L.J., and B.W. Marion. 1985. The Impacts of Patent Protection on the U.S. Seed Industry and Public Plant Breeding. North Central Region Research Publication 304, North Central Project 117, Monograph 16. Madison, WI: Research Division, College of Agricultural and Life Sciences, University of Wisconsin, September. Chen, Z. and R. Lent. 1992. “Supply Analysis in an Oligopsony Model.” American Journal of Agricultural Economics (74): 973-79. Chu, M., S.M. Swinton, S.S. Batie, and C. Dobbins. 1996. Agricultural Production Contracts to Reduce Nitrate Leaching: A Whole Farm Analysis. Dept. of Agricultural Economics, Michigan State University, East Lansing, MI. Staff Paper No. 96-78. July.
Cowling, K.G. and M. Waterson. 1976. “Price-Cost Margins and Market Structure.” Economica 43:267-274.
Diewert, W.E. 1974. "Applications of Duality Theory." Frontiers of Quantitative Economics, Vol.II.
Ed. M.D. Intriligator and D.A. Kendrick. Amsterdam: North-Holland Pub. Co. Gollop, F.M. and M.J. Roberts, 1979. “Firm Interdependence in Oligopolistic Markets.” Journal of Econometrics (10): 313-31. Greene, W.H. Econometric Analysis. Third Edition. Upper Saddle River, NJ: Prentice-Hall, 1997.
Hayenga, M.L. “Structural change in the biotech seed and chemical industrial complex”. AgBioForum, 1(2) (1998): 43-55. Accessed at URL: http://www.agbioforum.missouri.edu,
16
September 22, 1999. Iwata, G. 1974. “Measurement of Conjectural Variations in Oligopoly. Econometrica (42):947-66 Just, R.E., and W.J. Martin. 1980. “Tomatoes, Technology, and Oligopsony.” Bell Journal of Economics. (11)(Autumn): 584-602. Kalaitzandonakes, N. (1997). “Mycogen: Building a Seed Company for the Twenty-first Century.” Review of Agricultural Economics. 19(2):156-66. Kalaitzandonakes, N. and M.L Hayenga (1999). “Structural Change in the Biotechnology and Seed Industrial Complex: Theory and Evidence.” Paper presented at the Transitions in AgBiotech: Economics of Strategy and Policy Conference, Washington DC, June 24-25, 1999. Krull, D.F., J.M. Prescott and C.W. Crum. 1998. “Seed Marketing and Distribution.” In Morris, Michael L., Ed. Maize Seed Industries in Developing Countries. Boulder, CO: CIMMYT, , pp. 125-141. Leibenluft, Robert F. 1981. Competition in Farm Inputs: An Examination of Four Industries. Washington, DC: Federal Trade Commission, Office of Policy Planning, February. Ollinger, Michael and Jorge Fernandez-Cornejo . “Regulation, Innovation, and Market Structure in the U.S. Pesticide Industry.” AER-719. Economic Research Service, U.S. Department of Agriculture, 1995. Preckel, Paul V., Timothy G. Baker, and Jessica Eide. 1997. “Seed Corn Tournament and Excess Nitrogen Applications.” Unpublished manuscript, Purdue Univesity, Feb. 12. Ross, D. 2000. “Antitrust Enforcement and Agriculture.” Address presented by the Special Council for Agriculture, Antitrust Division, U.S. Dept. of Justice, at the Agriculture Outlook Forum 2000. Washington, DC. Feb. 24. Schmalensee, R. and R.D. Willig. 1989. Handbook of Industrial Organization vol. II. In K.J. Arrow and M.D. Intriligator, Handbooks in Economics. Amersterdam: Elsevier. Schroeter, J.R. 1988. “Estimating the Degree of Market Power in the Beef Packing Industry.” Review of Economics and Statistics (70): 158-62. Schroeter, J.R. and A. Azzam. 1991. “Marketing Margins, Market Power, and Price Uncertainty.” American Journal of Agricultural Economics (73): 990-99. Sexton, R.J. 1990. “Imperfect Competition in Agricultural Markets and the Role of Cooperatives: a Spatial Analysis.” American Journal of Agricultural Economics (72): 609-720.
United States Department of Agriculture, Agricultural Marketing Service, Plant Variety Protection Office. 2001. Private Communication with Ann Marie Thro.

17
United States Department of Agriculture, Economic Research Service. 1998. AREI Updates 1998, No. 8, December 1998. United States Department of Agriculture, National Agricultural Statistics Service. Agricultural Statistics, various years. GPO: Washington, 1975-2000. United States Department of Agriculture, National Agricultural Statistics Service. 2001. Published Estimates Data Base. URL: www.nass.usda.gov:81/ipedb/, accessed May 25. United States Department of Energy, Energy Information Agency. 2001. “Electricity.” Accessed at URL: www.eia.doe.gov/fuelelectric.html, May 21. United States Department of Labor, Bureau of Labor Statistics. 2001. Bureau of Labor Statistics Data: Series ID : EES00500049, Seasonally Adjusted, Industry: Total Private Industry, Average Hourly Earnings, 1982 Dollars; Accessed at: URL: www.bls.gov, May 18. Wann, J.J. and R. J. Sexton. 1992. “Imperfect Competition in Multiproduct Food Industries with Application to Pear Processing.” American Journal of Agricultural Economics (74): 980-90. Williamson, O.E. 1968. “Economies as an Antitrust Defense: The Welfare Tradeoff. American Economic Review. (58):18-36.
18
Table 1--Percent shares for U.S. corn seed market by company, 1973-1983*
Company 1973 1974 1975 1976 1977 1978 1979 1980 1981 1982 1983
Pioneer 0.238 0.255 0.246 0.273 0.309 0.262 0.329 0.369 0.348 0.388 0.381 Dekalb1 0.210 0.188 0.188 0.195 0.158 0.179 0.133 0.130 0.159 0.122 0.103 Asgrow Funk2 0.088 0.094 0.089 0.092 0.064 0.081 0.067 0.057 0.054 0.052 0.039 Trojan3 0.059 0.051 0.068 0.056 0.042 0.054 0.038 0.020 Northrup-King4 0.061 0.045 0.047 0.034 0.038 0.033 0.038 0.049 0.034 0.026 0.025 Zeneca/ICI Cargill/PAG5 0.048 0.068 0.039 0.035 0.041 0.046 0.033 0.047 0.056 0.054 0.042 Golden Harvest 0.018 0.024 0.025 0.031 0.029 0.013 0.032 0.023 0.026 Dow/My cogen Jacques/Agrigenetics6 0.013 0.017 0.020 0.019 0.021 0.027 0.022 Other 0.296 0.286 0.298 0.271 0.304 0.293 0.306 0.293 0.317 0.336 0.384
Largest 8 (CR8) 72.5 70.7 69.8 71.2 68.1 67 69.7 69.4 70 68.3 64 Largest 4 (CR4) 59.7 58.8 59.1 61.6 57.3 55.6 56.7 60.5 59.5 59.1 54.9 Herfindahl Index 0.1171 0.1159 0.1120 0.1269 0.1049 0.1138 0.1354 0.1609 0.1501 0.1723 0.1604 * Due to the sample size of the surveys, the percentages are estimates that may vary plus or minus two percentage points. Market shares arebased on percentage of acres sown with respective firm's seed. 1 Merged with Pfizer in 1982. 2 Aquired by Ciba-Geigy in 1974. 3 Aquired by Pfizer in 1975. 4 Aquired by Sandoz in 1976. 5 Acquired by Cargill in 1971. 6 Acquired by Agrigenetics in 1980. Source: 1973-1980: Miller Agrivertical Unit, 1979 and 1980 (The Miller Publishing Company), in Butler & Marion, p. 90 (1973-1980); 1981-83: Pioneer Hi-Bred, in McMullen, p. 96.

19
Table 2--Market shares for U.S. corn seed market, 1988-1998
Company 1988 1989 1990 1991 1992 1993 1994 1995 1996 1997 1998
(%)
Dupont / Pioneer Hi-Bred 34.5 32.0 33.4 35.8 39.6 42.7 44.9 45.0 41.0 42.0 39.0
Monsanto1 14.0 15.0
DeKalb 9.0 8.5 9.0 8.0 8.2 8.2 8.6 9.8 10.1 10.0 11.0
Asgrow 2.0 4.0 4.0
Novartis2 9.0 9.0
Northrup King / Sandoz3 4.0 4.0 3.5 4.4 4.6 4.3 4.2 4.1 5.0
Dow Agro / Mycogen4 4.3 4.0 4.0
AgrEvo / Cargill5 3.0 3.0 3.0 3.5 3.7 3.8 3.9 4.0 3.3 4.0 4.0
Ciba 3.1
ICI / Zeneca / Advanta6 2.9 3.0 3.0
Golden Harvest 2.0 2.0 2.0 2.9 3.0 3.0 3.0 3.3 2.3 4.0 3.0
Others 39.7 42.7 41.7 36.7 33.1 31.3 28.6 28.4 25.6 20.0 23.0**
Largest 8* (CR8) 52.5 49.5 50.9 54.6 59.1 62.0 64.6 66.2 72.0 80.0 77.0
Largest 4 (CR4) 50.5 44.5 45.9 48.2 52.4 55.2 57.7 58.9 57.1 69.0 67.0
Herfindahl 0.1300 0.1125 0.1222 0.1386 0.1679 0.1932 0.2132 0.2165 0.1864 0.2098 0.1877 * In 1997 and 1998, market shares of only seven companies were available. ** Market share amount adjusted from reported figure in Kalaitzandonakes and Hayenga to make the market add up to one. 1. Monsanto acquired Dekalb in 1997 and Asgrow in 1998. 2. Result of the merger between Ciba and Sandoz in 1996. 3. Northrup-King is Sandoz’s American seed subsidiary. 4. Mycogen was bought by Dow Agrosciences in 1998. 5. AgrEvo acquired Cargill’s domestic seed business in 1998. 6. ICI split in 1993 and Zeneca, the pharmaceutical spinoff, was left in control of the company’s seed operations. Later in 1996, Zeneca became a part of the Advanta Seed Group. Source: 1988-1995: Merrill Lynch Estimates; 1996: Kalaitzandonakes (1997); 1997: Hayenga (1998); 1998: Kalaitzandonakes and Hayenga (1999)
20
Table 3. Corn Seed Industry - 1972-1999
Means and Other Statistics of Main Variables Used in the Model
________________________________________________________________________
Variable Mean Std Dev Minimum Maximum ƒƒƒƒƒƒƒƒƒƒƒƒƒƒƒƒƒƒƒƒƒƒƒƒƒƒƒƒƒƒƒƒƒƒƒƒƒƒƒƒƒƒƒƒƒƒƒƒƒƒƒƒƒƒƒƒƒƒƒƒƒƒƒƒƒƒƒƒƒƒƒƒ
P 60.371429 19.2706235 21.5000000 88.1000000 W 2.651191 0.4864637 1.6666667 3.6000000
V1/P 0.0765192 0.0090385 0.0617920 0.0900000 V2/P 0.0006540 0.0000749 0.0005017 0.000784929 V3/P 0.0122612 0.0028777 0.0082633 0.0193333 V4/P 0.1349415 0.0187006 0.1068333 0.1580438 Z/P 1.7575473 2.0216290 0 5.4483541
M 0.943722 0.0298453 0.8523556 0.9747509 H 0.152763 0.0334506 0.1049000 0.2165000 Q 22.810438 2.7402817 16.4786559 27.7571313 LN(Q) 3.119991 0.1238443 2.8020660 3.3234928
LN(P/Pp) 4.129776 0.0827788 3.9236044 4.2845702
LN(Pcr/Pp) 2.283886 0.4039855 1.6298489 3.1455867
LN(Pr/Pp) -0.024459 0.2244677 -0.3714928 0.4597693 LN(Pin/Pp) -0.1252956 0.1414673 -0.3165518 0.1067335
ƒƒƒƒƒƒƒƒƒƒƒƒƒƒƒƒƒƒƒƒƒƒƒƒƒƒƒƒƒƒƒƒƒƒƒƒƒƒƒƒƒƒƒƒƒƒƒƒƒƒƒƒƒƒƒƒƒƒƒƒƒƒƒƒƒƒƒƒƒƒƒƒƒƒƒƒ
21
Table 4. Corn Seed Industry 1972-1999
Nonlinear 3SLS Parameter Estimates
__________________________________________________________________
Approx Approx Parameter Estimate Standard t-Value Pr > |t|
Error __________________________________________________________________
A11 -0.29195 53.764 -0.01 0.9957 A12 83.0991 745.5 -0.11 0.9128 Azz 0.09185 0.0919 1.00 0.3346 A22 3790.27 4115.8 0.92 0.3727 A33 -66.537 67.0103 -0.99 0.3376 A44 -4.5421 11.7081 -0.39 0.7039 B1 1.48841 3.5159 0.42 0.6785 B2 -464.667 194.8 -2.38 0.0318 B3 8.51179 9.1400 0.93 0.3675 B4 0.88881 2.1138 0.42 0.6805 Bz -0.02171 0.0178 -1.22 0.2424 C0 6.88153 1.2882 5.34 <.0001 C1 -0.30431 0.1389 -2.19 0.0394 C2 0.06706 0.2349 0.29 0.7779 C3 0.38468 0.1575 2.44 0.0230 Theta 0.89846 1.5245 0.59 0.5650 ND -0.72925 0.2698 -2.70 0.0146 __________________________________________________________________