Embed Size (px)
Citation preview
CONCEPT BAG: A NEW METHOD FOR
COMPUTING SIMILARITY
by
Richard L. Bradshaw
A dissertation submitted to the faculty of The University of Utah
in partial fulfillment of the requirements for the degree of
Doctor of Philosophy
Department of Biomedical Informatics
The University of Utah
May 2016

Copyright © Richard L. Bradshaw 2016
All Rights Reserved
T h e U n i v e r s i t y o f U t a h G r a d u a t e S c h o o l
STATEMENT OF DISSERTATION APPROVAL
The dissertation of Richard L. Bradshaw
has been approved by the following supervisory committee members:
Julio Cesar Facelli , Chair 10/22/2015
Date Approved
Ramkiran Gouripeddi , Member 10/26/2015
Date Approved
Charlene Raye Weir , Member 10/22/2015
Date Approved
Karen Eilbeck , Member 10/22/2015
Date Approved
Roberto A. Rocha , Member 01/05/2016
Date Approved
and by Wendy W. Chapman , Chair of
the Department of Biomedical Informatics
and by David B. Kieda, Dean of The Graduate School.
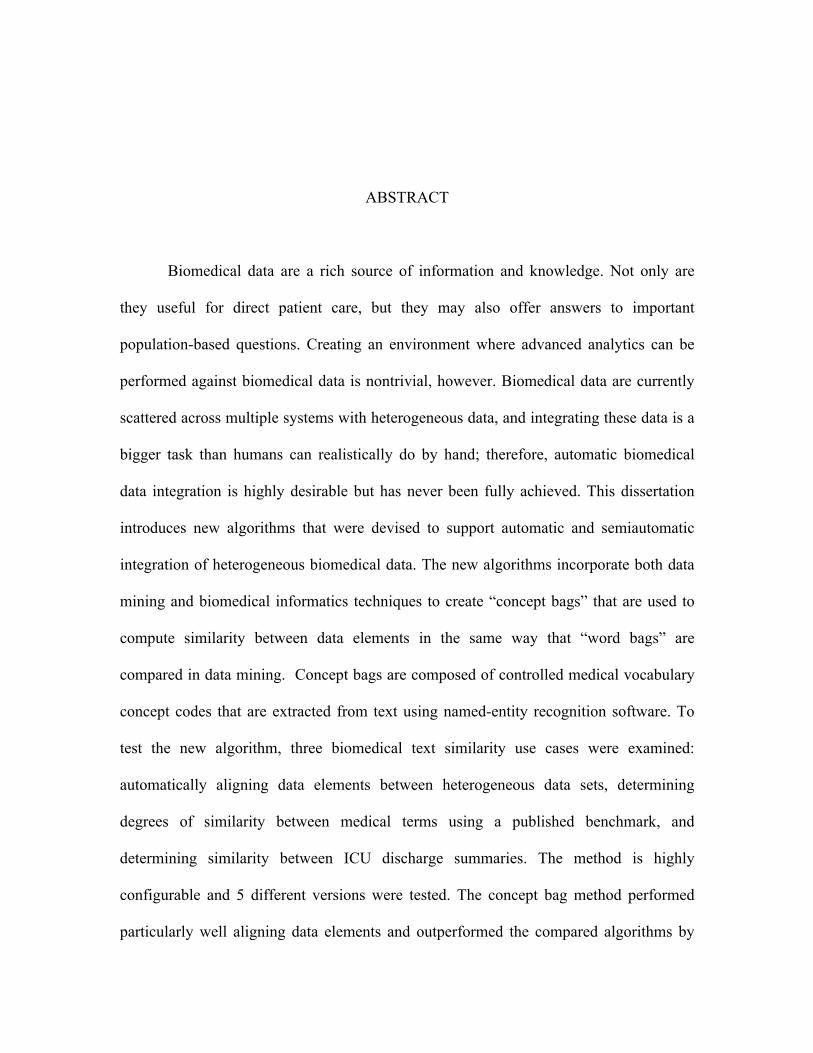
ABSTRACT
Biomedical data are a rich source of information and knowledge. Not only are
they useful for direct patient care, but they may also offer answers to important
population-based questions. Creating an environment where advanced analytics can be
performed against biomedical data is nontrivial, however. Biomedical data are currently
scattered across multiple systems with heterogeneous data, and integrating these data is a
bigger task than humans can realistically do by hand; therefore, automatic biomedical
data integration is highly desirable but has never been fully achieved. This dissertation
introduces new algorithms that were devised to support automatic and semiautomatic
integration of heterogeneous biomedical data. The new algorithms incorporate both data
mining and biomedical informatics techniques to create “concept bags” that are used to
compute similarity between data elements in the same way that “word bags” are
compared in data mining. Concept bags are composed of controlled medical vocabulary
concept codes that are extracted from text using named-entity recognition software. To
test the new algorithm, three biomedical text similarity use cases were examined:
automatically aligning data elements between heterogeneous data sets, determining
degrees of similarity between medical terms using a published benchmark, and
determining similarity between ICU discharge summaries. The method is highly
configurable and 5 different versions were tested. The concept bag method performed
particularly well aligning data elements and outperformed the compared algorithms by
iv
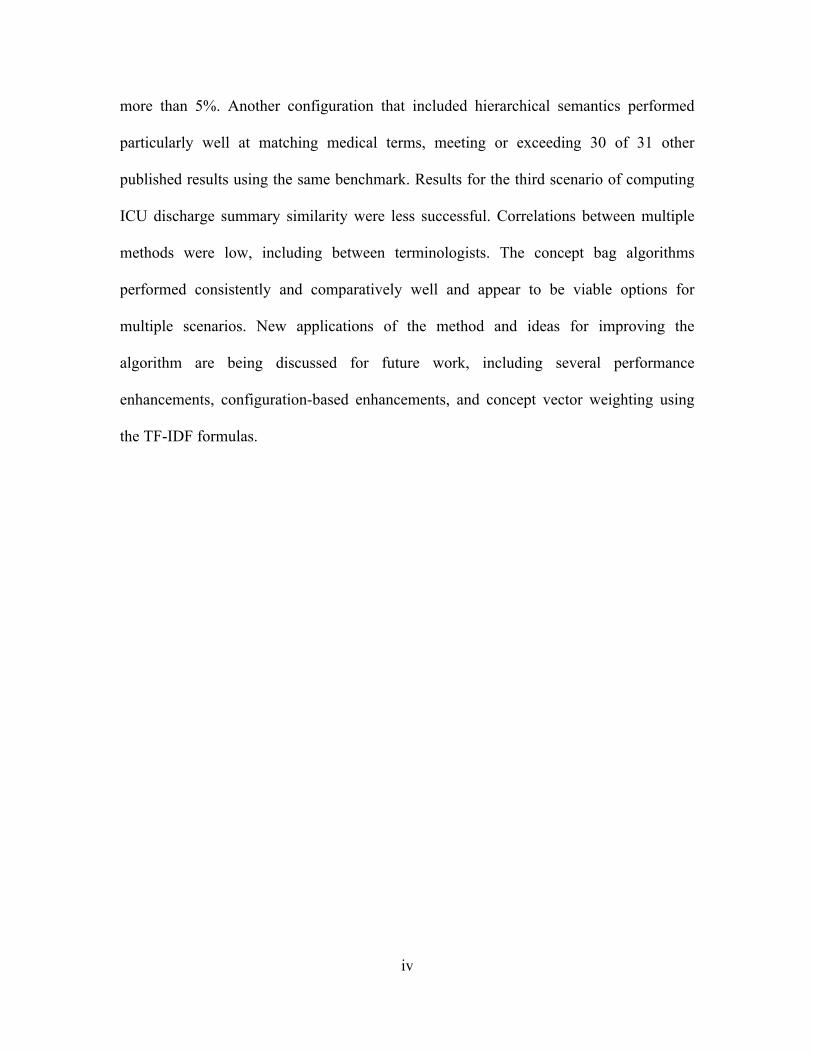
more than 5%. Another configuration that included hierarchical semantics performed
particularly well at matching medical terms, meeting or exceeding 30 of 31 other
published results using the same benchmark. Results for the third scenario of computing
ICU discharge summary similarity were less successful. Correlations between multiple
methods were low, including between terminologists. The concept bag algorithms
performed consistently and comparatively well and appear to be viable options for
multiple scenarios. New applications of the method and ideas for improving the
algorithm are being discussed for future work, including several performance
enhancements, configuration-based enhancements, and concept vector weighting using
the TF-IDF formulas.

Simplicity is the ultimate sophistication.
Leonardo da Vinci, 1452 to 1512 AD

TABLE OF CONTENTS
ABSTRACT ....................................................................................................................... iii
LIST OF TABLES ............................................................................................................. ix
LIST OF FIGURES .............................................................................................................x
LIST OF EQUATIONS ..................................................................................................... xi
ACKNOWLEDGEMENTS .............................................................................................. xii
Chapters 1 INTRODUCTION ............................................................................................................1
1.1 Importance of Data Reuse in Biomedical Informatics .................................1 1.2 Issues with Biomedical Data Reuse .............................................................2
1.2.1 Privacy .............................................................................................2 1.2.2 Unknown Data Quality ....................................................................4 1.2.3 Heterogeneity ...................................................................................5 1.2.4 Lossy Data Conversions ................................................................11
1.3 Biomedical Data Integration Software .......................................................12 1.3.1 i2b2 ................................................................................................12 1.3.2 OpenFurther ...................................................................................15 1.3.3 Issues with Biomedical Data Integration Software ........................18
1.4 Preventing or Resolving Heterogeneous Biomedical Data ........................19 1.4.1 Required Data Models ...................................................................20 1.4.2 Suggested Data Models ..................................................................22 1.4.3 Manual Alignment .........................................................................22 1.4.4 Semi-automatic Alignment ............................................................23 1.4.5 Automatic Alignment .....................................................................23
1.5 Advancing Methods for Computing Semantic Similarity .........................25 1.5.1 Current Automatic Alignment Approaches ...................................25 1.5.2 Contribution of the Dissertation .....................................................26 1.5.3 Dissertation Aims ...........................................................................27
1.6 Introduction Summary ...............................................................................28
2 COMPUTING SEMANTIC SIMILARITY ..................................................................30
vii
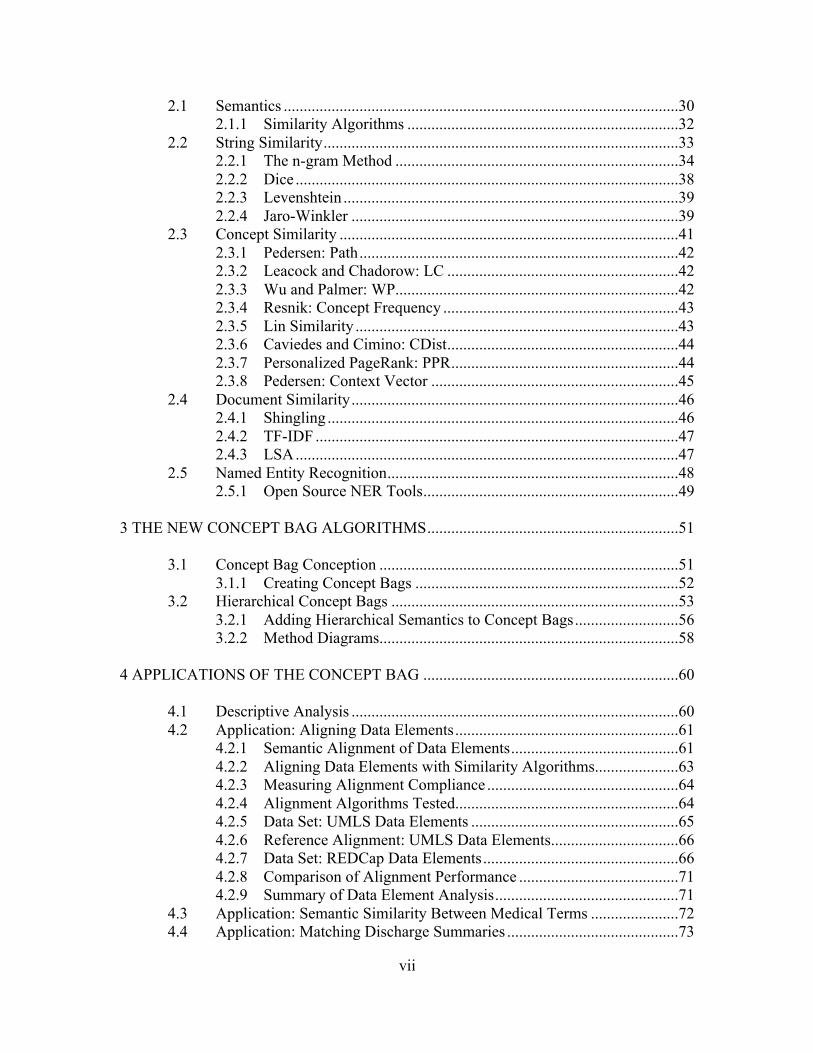
2.1 Semantics ...................................................................................................30 2.1.1 Similarity Algorithms ....................................................................32
2.2 String Similarity .........................................................................................33 2.2.1 The n-gram Method .......................................................................34 2.2.2 Dice ................................................................................................38 2.2.3 Levenshtein ....................................................................................39 2.2.4 Jaro-Winkler ..................................................................................39
2.3 Concept Similarity .....................................................................................41 2.3.1 Pedersen: Path ................................................................................42 2.3.2 Leacock and Chadorow: LC ..........................................................42 2.3.3 Wu and Palmer: WP .......................................................................42 2.3.4 Resnik: Concept Frequency ...........................................................43 2.3.5 Lin Similarity .................................................................................43 2.3.6 Caviedes and Cimino: CDist ..........................................................44 2.3.7 Personalized PageRank: PPR .........................................................44 2.3.8 Pedersen: Context Vector ..............................................................45
2.4 Document Similarity ..................................................................................46 2.4.1 Shingling ........................................................................................46 2.4.2 TF-IDF ...........................................................................................47 2.4.3 LSA ................................................................................................47
2.5 Named Entity Recognition .........................................................................48 2.5.1 Open Source NER Tools ................................................................49
3 THE NEW CONCEPT BAG ALGORITHMS ...............................................................51
3.1 Concept Bag Conception ...........................................................................51
3.1.1 Creating Concept Bags ..................................................................52 3.2 Hierarchical Concept Bags ........................................................................53
3.2.1 Adding Hierarchical Semantics to Concept Bags ..........................56 3.2.2 Method Diagrams ...........................................................................58
4 APPLICATIONS OF THE CONCEPT BAG ................................................................60
4.1 Descriptive Analysis ..................................................................................60 4.2 Application: Aligning Data Elements ........................................................61
4.2.1 Semantic Alignment of Data Elements ..........................................61 4.2.2 Aligning Data Elements with Similarity Algorithms .....................63 4.2.3 Measuring Alignment Compliance ................................................64 4.2.4 Alignment Algorithms Tested ........................................................64 4.2.5 Data Set: UMLS Data Elements ....................................................65 4.2.6 Reference Alignment: UMLS Data Elements ................................66 4.2.7 Data Set: REDCap Data Elements .................................................66 4.2.8 Comparison of Alignment Performance ........................................71 4.2.9 Summary of Data Element Analysis ..............................................71
4.3 Application: Semantic Similarity Between Medical Terms ......................72 4.4 Application: Matching Discharge Summaries ...........................................73
viii
4.4.1 Discharge Summary Benchmark ...................................................74 4.4.2 Discharge Summary Similarity Comparator Algorithms ..............75 4.4.3 Algorithm Correlation Analysis .....................................................75
5 RESULTS .......................................................................................................................77
5.1 Descriptive Statistics for Studied Data Sets ...............................................77 5.2 Data Element (DE) Alignment Compliance ..............................................79
5.2.1 UMLS and REDCap Data Elements ..............................................79 5.2.2 Error Analysis ................................................................................85
5.3 Medical Term Similarity ............................................................................89 5.3.1 Correlation with Physicians and Terminologists ...........................89
5.4 ICU Discharge Summary Similarity ..........................................................93
6 GENERAL DISCUSSION, FUTURE DIRECTIONS, AND CONCLUSIONS ...........95 6.1 General Discussion ....................................................................................95
6.1.1 Advancing Methods for Computing Similarity .............................95 6.1.2 Expanding Concept Bags with Hierarchical Concepts ..................95 6.1.3 Comparison with Compositional Semantics ..................................96 6.1.4 ICU Discharge Similarity ..............................................................97 6.1.5 Concept Bag Is Highly Configurable and Generalizable ...............98 6.1.6 Scalability and Performance ..........................................................99 6.1.7 Suggested Use ................................................................................99
6.2 Future Directions .....................................................................................100 6.2.1 MetaMap Settings ........................................................................100 6.2.2 Aligning Data Sets and Projects ..................................................100 6.2.3 Comparing Diagnosis and Procedure Codes ................................101 6.2.4 Reducing Comparisons ................................................................101 6.2.5 Adding Philological Relationships ..............................................103
6.3 Conclusions ..............................................................................................103
REFERENCES ................................................................................................................105
LIST OF TABLES
4.1. Seventeen common data elements …………………………………………… 67
5.1 Descriptive statistics for the studied data sets……………………...………… 78
5.2 UMLS DE alignment statistics for each algorithm ………………...………… 80
5.3 REDCap DE alignment statistics for each algorithm………………………… 80
5.4 Three example errors for CB, HCB, and Dice ……………………................. 86
5.5 Correlation of the similarity scores ……………….............……......………… 90
5.6 ICU discharge summary similarity measurement correlations……………...... 94
LIST OF FIGURES
1.1 Example of syntactic heterogeneity............……………………...…………….. 10
1.2 Strategies for preventing or resolving data heterogeneity…………..………….. 20
1.3 Taxonomy of automatic schema-matching schema-only approaches……..….... 26
2.1 Example character and word-based n-grams…………………………...……… 35
2.2 Compare two word-based trigrams ………………….............………………… 35
2.3 Example unigrams, bigrams, and trigrams.…………….……........…………… 37
2.4 Levenshtein string distance algorithm ……………...……….........…………… 40
2.5 Jaro-Winkler algorithms ………………………………..............................…… 40
3.1 Venn diagram illustrating Concept Bag code sets ………………..........……… 54
3.2 Examples of the CB and HCB with hierarchical concept codes...……………… 57
3.3 Concept Bag method comparison diagrams…..…………….......................…… 58
3.4 Demonstrating two different similarity implementations………………………. 59
4.1 Concept Bag and Hierarchical Concept Bag implementations…………………. 65
4.2 Third and fourth implementations of the Concept Bag..….……..…................... 73
4.3 The application used to perform ICU Discharge comparisons..……………..… 76
5.1 ROC curve of the UMLS DE alignment algorithm performance…..…......…… 81
5.2 ROC curve of the REDCap DE alignment algorithm performance.................… 82
LIST OF EQUATIONS
2.1 Jaccard Similarity .................................................................................................36
2.2 Dice Similarity .....................................................................................................38
2.3 Path Similarity .....................................................................................................42
2.4 Leacock and Chadorow Similarity .......................................................................42
2.5 Wu and Palmer Similarity ....................................................................................42
2.6 Information Content .............................................................................................43
2.7 Resnik Similarity .................................................................................................43
2.8 Lin Similarity .......................................................................................................44
4.1 Alignment Errors .................................................................................................71
4.2 Percent Savings ....................................................................................................71
6.1 Comparison Cutoff ............................................................................................102
ACKNOWLEDGEMENTS
The first and most important acknowledgement is for the two most important
women in my life, my wife Alejandra Bradshaw, and my mother, Barbara Gordon. This
would have never been possible without their love and continued support.
Secondly, I want to thank and acknowledge all of my committee members for
their help and support over the past several years. This has been an unforgettable
experience and I am grateful for your time, time that you have taken out of your very
busy schedules to see this through with me.
There were several course corrections over the 6 years. I had 4 committee chairs
over the 6-year process for various reasons: Peter Haug, M.D., Joyce Mitchell Ph.D.,
Charlene Weir, Ph.D., and Julio C. Facelli Ph.D. A special thanks to each of you,
especially Dr. Facelli for helping me finish “the last mile,” the hardest one. Each member
of the committee taught me something important that led to the completion of this work.
Bernie La Salle was also a tremendous help and resource. A significant portion of
the project was based on clinical research data that Bernie provided through his long-
reaching connections and resourcefulness.
This work was also partially supported by the following organizations:
• Public Health Services research grant UL1-RR025764 from the National Center
for Research Resources.
• The support and resources from the Center for High Performance Computing at
xiii
the University of Utah are gratefully acknowledged.
• This investigation was supported by the University of Utah Study Design and
Biostatistics Center, with funding in part from the National Center for Research
Resources and the National Center for Advancing Translational Sciences,
National Institutes of Health, through Grant 5UL1TR001067-02 (formerly
8UL1TR000105 and UL1RR025764).
• M. Saeed, M. Villarroel, A.T. Reisner, G. Clifford, L. Lehman, G.B. Moody, T.
Heldt, T.H. Kyaw, B.E. Moody, R.G. Mark. Multiparameter intelligent
monitoring in intensive care II (MIMIC-II): A public-access ICU database.
Critical Care Medicine 39(5):952-960 (2011 May); doi:
10.1097/CCM.0b013e31820a92c6.

CHAPTER 1
INTRODUCTION
1.1 Importance of Data Reuse in Biomedical Informatics
Biomedical data are a potentially rich source for information and knowledge
discovery. Biomedical data that are collected for patient care and stored in electronic
health records (EHR) are often reused to support clinical research [1-3], translational
research [4], comparative effectiveness research (CER) [5, 6], population health [7],
public health [8], quality improvement [9, 10], and for measuring healthcare practices in
general [11-13]. There are far too many publications to list them all. Both the “bio” and
“medical” aspects of biomedical data are deep and wide in both scope and breadth, with
countless opportunities for study and discovery.
Data reuse is also referred to as “secondary use,” and has been a popular topic in
the literature for decades, but has been especially popular since the National Institute of
Health (NIH) started supporting reuse directly. The NIH granted Clinical and
Translational Science Awards (CTSA) to over 60 academic medical centers across the
U.S. starting in 2006, with the mission to facilitate more efficient translational research.
Multiple awards were granted to research and build innovative solutions that would
enable biomedical data sharing. The CTSA program recognized that innovative solutions
are required to enable both “sharing” and “reusing” biomedical data and dedicated
2
resources via awards to institutions to break down barriers. Multiple policies deliberately
prevent or restrict sharing, and technical barriers prevent the efficient reuse of biomedical
data after sharing has occurred.
More recently, in 2009 the U.S. Government passed legislation that invests
heavily in interoperable EHR technologies supportive of instantaneous biomedical data
sharing and reuse by third parties. The HITECH Act allocated $19.2 billion for healthcare
delivery organizations that implement certified EHR technology that meets “Meaningful
Use” criteria [14]. Healthcare organizations across the U.S. now have an opportunity to
adopt interoperable EHR solutions at a much lower cost due to these incentives. Just to be
clear, interoperable EHRs facilitate instantaneous data sharing and reuse, and this is
exactly what this legislation was intended to achieve.
All of the discoveries that have been made reusing biomedical data as well as the
substantial U.S. government efforts to support sharing underscore how valuable
biomedical data are. Biomedical data are at the heart of multibillion-dollar healthcare and
biomedical research industries such as clinical research, pharmaceutical research,
translational research, and public health. The considerable efforts to improve the sharing
and reuse of biomedical data are also indicative of the surrounding complex issues and
challenges.
1.2 Issues with Biomedical Data Reuse
1.2.1 Privacy
The initial barriers for reusing human biomedical data (more so than other
species) are typically privacy issues. Clinicians or healthcare staff with proper “need to
3
know [to provide or support patient care]” are the only people who have access to EHR
data due to privacy laws such as HIPAA, the U.S. Government’s official health
information privacy regulations [15].
Access and reuse of fully identifiable data for the purpose of research typically
requires human subject research training, a significant affiliation with the data provider,
and an IRB approval from that provider. IRBs are routinely granted in one’s local
institution, but having a significant affiliation with a remote provider to obtain an IRB
may be a barrier. There is an exception. IRB may not be necessary when biomedical data
are deidentified [16, 17]. In this case researchers may need to provide verification of
human subject research training before deidentified data are released, but this is much
more straightforward than completing and passing an IRB review. Automated methods
are being developed to streamline the approval processes but have not been adopted at
this point in time.
Working with deidentified data has a new list of challenges. While they are easier
to access, the deidentification process strips out variables that would normally be used to
link data sets. This implies that a deidentified breast cancer data set cannot be linked to
diagnostic data from an EHR to identify comorbidities, for example. There are tradeoffs
between time to data access and what information or knowledge the data are capable of
providing.
Privacy also plays a crucial role when data sharing agreements need to be
established between potential competitors. Business privacy between large healthcare
organizations that compete for patient business or for research dollars may prevent
sharing. Sharing business data with a competitor is risky; it could be used to identify
4
business opportunities and/or to disadvantage the competition. Biomedical data have the
potential to contain business-related information, and organizations are interested in
protecting it.
Biomedical data privacy laws protect patients from improper use of their personal
information, but also make it difficult to reuse valuable data for valid research. Methods
are being developed to overcome these barriers such as automated approval processes
[18] and data deidentification. Deidentification has become mainstream but the
automated approval processes have not. Easy access to some data is better than no access
and no data.
1.2.2 Unknown Data Quality
When biomedical data are reused for research, unknown data quality may
invalidate important study findings. Comparative effectiveness research (CER) studies,
for example, attempt to associate clinical practice variations with clinical outcomes, and
in these studies, multisite study findings are more likely to be generalizable than single-
site findings. Site-level findings have different prediction variables, disease incidence,
and outcomes, and these differences may represent true variation in outcomes and
practice patterns, or they may represent artificial variation due to data collection method
variability across sites. A quality framework created to distinguish between true and false
variation found that when true variation was present, CER studies could deliver important
information regarding treatment safety and effectiveness between sites and populations.
Conversely, the framework found artificial variation between sites could invalidate study
findings altogether [19].
5
Another cause of unknown data quality originates from undocumented,
inadequately documented, or otherwise misunderstood metadata and data [20]. When
explicit dictionaries or access to data providers who can define and describe the details of
how and when data were collected do not exist, improper assumptions may lead to
improper interpretations of results [21]. Variables may be misunderstood and utilized
inappropriately. Systems may turn on and off for periods of time. New buildings with
new services may be added to an organization that then start feeding new data spikes into
the collective data, and so on. Imagine a new breast cancer facility is erected, breast
cancer treatment begins, and suddenly the number of breast cancer cases appears to
skyrocket in the patient data warehouse. When cases like this go undetected, new spikes
may be viewed as problematic increases when they are not. Numerous anomalies like
these can occur from lack of documentation and/or understanding of the data, especially
when there are a large number of heterogeneous data providers and sophisticated data
integration processes are involved.
1.2.3 Heterogeneity
Biomedical data are modeled and represented using various formats, syntaxes,
and values to represent clinical statements or facts. While several significant clinical data
modeling efforts have been designed to reduce heterogeneity and to improve clinical data
consistency and interoperability [22-25], the market remains slow to adopt and
implement such models. Healthcare and research communities are decentralized and
continue to produce heterogeneous data sets. When the goal is to reuse multiple
heterogeneous data sets, they typically require aggregation and/or integration involving
6
several forms of heterogeneity resolution [26, 27]. Resolution of heterogeneity is
essentially the resolution of the differences between data sets. The next sections review
the data set differences that cause data heterogeneity.
1.2.3.1 Structural differences
Structural heterogeneity occurs when data model constructs, constraints, and data
are modeled differently [27]. Data may require “vertical integration” (integrating
semantically similar data) or “horizontal integration” (integrating data from different
domains) with information distributed and expressed differently across data structures.
Hierarchical relationships between data in relational models are structurally different than
they are when represented using XML, for example. Structural differences may also
result from diverse data types and conceptual granularities. A “Clinician type,” for
example, may be modeled with one data element with a value such as “critical care
nurse,” or it may be modeled with two, one for “specialty” and another for “role,” with
values such as “critical care” and “nurse,” respectively. When one data set implements
the single-element strategy and another data set implements the two-data-element
strategy, we have both a structural difference (one versus two data elements) and
conceptual difference (one versus two concepts). Both the single-element and double-
element versions represent semantically identical information but are managed differently
according to how data are structured. Additionally, there may be dependency conflicts
(different cardinalities) or key conflicts (unresolved identifiers) that occur due to
structural differences.
7
1.2.3.2 Naming differences
In reference to the semiotic triangle [28], naming differences occur when different
symbols (words in this case) are used to represent the same referents (concepts). Different
words that have the same conceptual meaning may be in the form of synonyms or
abbreviations and may manifest in the metadata or in the data—“Doctor” versus
“physician” or “MRN” versus “Patient ID,” for example. These kinds of naming
differences are typically managed by “terminologists” using a “terminology” and/or an
“ontology” that are used to model “concepts,” “terms” (linguistic labels), “codes” (a
unique identifier that designates a single concept), and lexical or semantic “relationships”
[29, 30].
1.2.3.3 Semantic differences
Semantic differences occur between data sets when the meanings of metadata or
data are similar but are not equivalent [27]. For example, a data set with data element
“Blood culture growth” with possible values 0, 1+, 2+, 3+, and 4+, and another data set
with the same data element and possible values of “no growth,” “moderate growth,” or
“significant growth” are possible to align semantically by mapping to the least granular
set (the categorical values) as follows:
0 = no growth
1+, 2+ = moderate growth
3+, 4+ = significant growth
Imagine another data set is added that stores the answer as “no growth” or “growth.”
Then the semantic mappings are as follows:
8
0 = no growth
1+, 2+, 3+, 4+, moderate growth, significant growth = growth.
In both cases the integrated form of the data loses meaning. The only values that can be
queried across the integrated set are “growth” or “no growth.”
The previous two examples are both resolvable using semantic mappings, but not
all semantic differences are logically resolvable. Consider another example similar to the
previous, where data element A’s value set is “light or no growth,” “moderate or
significant growth,” and data element B’s value set contains “no growth,” “light or
moderate growth,” and “significant growth.” There is simply not a mapping solution
between these value sets that guarantees an accurate result [27]. Querying for “no
growth” for example, is not an option because data element B’s value set does not
support this level of granularity. Querying for A’s “light or no growth” is not an option
since data element B’s value set does not have a logistically equivalent value. None of the
values between these two sets can be logically mapped.
Semantic differences that occur at the conceptual level may be by design to suit
clinical contexts or it may occur from a difference of modeling style or opinion [29]. One
clinical specialist may require a different level of detail that is not necessary helpful for
other specialists— “myocardial infarction” may be sufficient for a general practitioner,
but a cardiologist benefits from the more detailed “left ventricular infarction,” for
example. Similarly, semantic differences may be due to precoordination versus
postcoordination disparities. Is there one concept for “right” and another for “lung” or a
single concept for “right lung?” Or how many concepts are there in “nonsmall cell lung
carcinoma stage III of the right upper lobe?” Should there be one concept for laterality,
9
one for body site, one for the problem, and one for the stage? Or is there one
precoordinated concept that means, “nonsmall cell carcinoma stage III,” and a single
concept for “right upper lobe?” There are valid reasons for the different options [31, 32].
One might be more suitable for analysis while another might require less data entry.
1.2.3.4 Content differences
The most extreme content difference occurs when one attempts to perform a
horizontal integration and there is no semantic overlap [33]; there is nothing in common
to link or share. A set of patient demographics will not intersect with a set of DNA
sequences that have no common patient identifiers that can be used to link them together.
Each data set is essentially an orphan in this case. In less extreme cases content
differences occur when a portion of data is not represented in a data set [27]. Facts may
be implied or not straightforward to interpret. A “Diabetes patient cohort” data set may
not contain computable facts that indicate that subjects have diabetes directly in the name
of an object, attribute, or in the data; data are implied but are not explicit. The existence
of the subject in the data set implies they have met the diabetes criteria.
Empty or NULL data values without explicit specifications are ambiguous. An
empty value may indicate “normal,” “not evaluated,” or “unavailable.” Not knowing
what the implied meaning is may lead to erroneous assumptions.
Content differences may occur due to different assumptions about what should be
derived from existing data and what should be stored in the database. Data integration
interventions may be required to derive “age” from “birth date” or “birth year” from the
“current age” because of different assumptions about what is stored in what is derived.
10
The other common example is storing only a “ZIP code” and not the “state” or the “city”
since the ZIP Code can be used to derive states and cities.
1.2.3.5 Syntactic differences
Syntactic differences are related to structural heterogeneity, in that syntax relates
to the data structure but involves additional nuances. Syntactic heterogeneity occurs when
data sets are not expressed using the same syntax or technical language [27], implying
interpretation and translation must occur when interoperability or data integration is
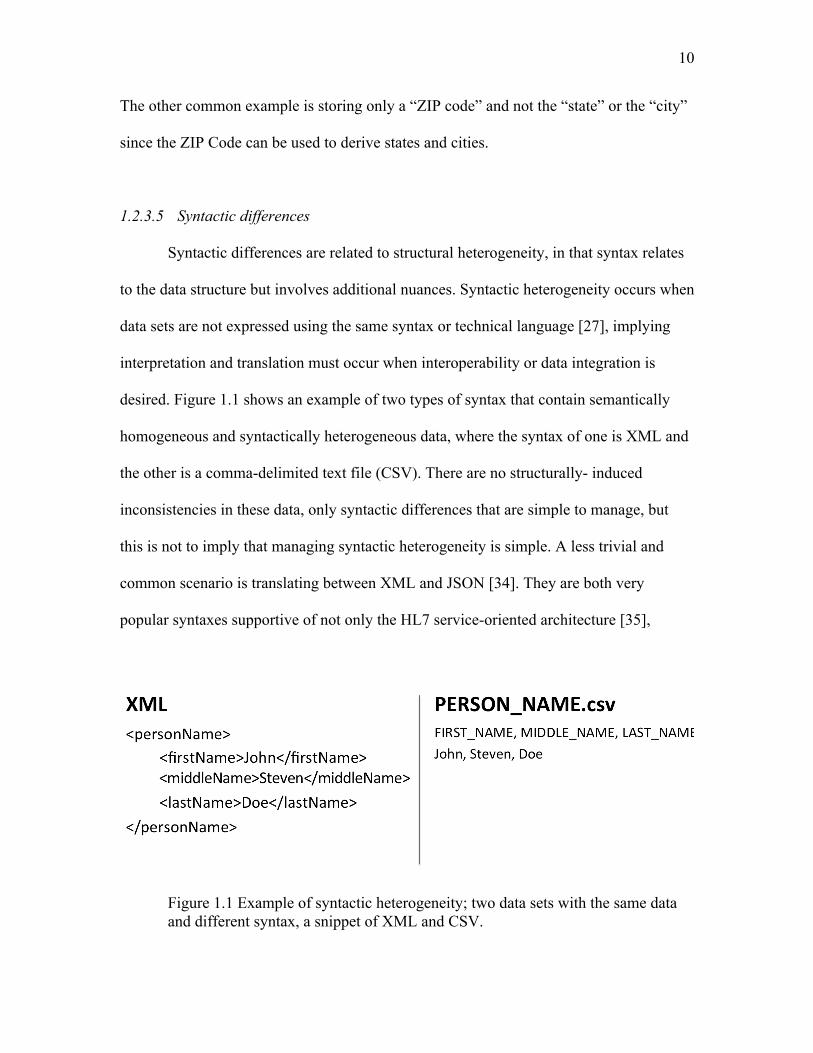
desired. Figure 1.1 shows an example of two types of syntax that contain semantically
homogeneous and syntactically heterogeneous data, where the syntax of one is XML and
the other is a comma-delimited text file (CSV). There are no structurally- induced
inconsistencies in these data, only syntactic differences that are simple to manage, but
this is not to imply that managing syntactic heterogeneity is simple. A less trivial and
common scenario is translating between XML and JSON [34]. They are both very
popular syntaxes supportive of not only the HL7 service-oriented architecture [35],
Figure 1.1 Example of syntactic heterogeneity; two data sets with the same data and different syntax, a snippet of XML and CSV.
11
but service-oriented architecture and web-based technologies in general. Syntax-related
issues that occur when translating between XML and JSON [36] include the following:
• XML namespaces do not exist in JSON.
• XML supports repeating elements, JSON does not.
• Base data types are different, as are class/data type definitions.
• Element arrays are handled differently.
• XML supports mixed data types with tags embedded in natural language, JSON
does not.
• Special characters are handled differently.
There are more, but these are the primary issues. Many of the issues in this specific case
are recoverable by adopting agreed upon translation patterns [36], but syntactic
heterogeneity can be associated with complex translation issues. There are many software
tools that can assist with syntactic translation issues.
1.2.4 Lossy Data Conversions
“Lossy” data conversions are discussed in the context of data compression for
various kinds of media, such as images or videos, where the original format is
compressed and only the most important data are kept while the less significant data are
“lost.” The same concept applies to biomedical data. When biomedical data are
interpreted and translated, sometimes only the most important data are kept to comply
with a specific data model or coding scheme while other unsupported data are lost in
translation. The previous examples describing semantic difference mappings in section
1.2.3.3 illustrate how the loss of data also potentially implies the loss of semantics. To
12
avoid misinterpretation, losses must be accounted for and presented to data analysts. This
is another significant research topic: representing and communicating “data provenance”
[37, 38]. Understanding the origin and pedigree of data is critical to maintain high-quality
analysis and reproducibility of integrated biomedical data.
Losing semantics of data due to heterogeneity is a reality that occurs when
biomedical data sets are integrated. All the forms of heterogeneity are common and often
occur together. Tools that have been specifically designed for integrating heterogeneous
biomedical data sets are discussed next.
1.3 Biomedical Data Integration Software
Biomedical data are typically integrated using one of two basic architectures, 1)
the centralized data warehouse architecture where all data are copied and resolved into a
common data model and database [39, 40], or 2) the federated database architecture
where data are left in their original databases and are queried across networks using a
federated query engine [41-44] to analyze data. Two software products that integrate
biomedical data are described: one that uses a centralized data warehouse and one that
uses federated data architecture.
1.3.1 i2b2
The Informatics for Integrating Biology and the Bedside (i2b2) software suite is
based on the centralized data warehouse architecture and was designed to give
researchers direct access to existing biomedical data sets [45] that have been previously
merged and integrated into an i2b2 data warehouse. The i2b2 software supports diverse
13
forms of biomedical data, including natural language clinical texts and genomic data
documents via the i2b2 “cells” and “hive” [45, 46]. The software is open source and
freely available but requires a highly skilled staff to set up and maintain.
The i2b2 software should be installed and configured by information technology
(IT) experts capable of setting up secure database servers, web servers, and application
servers. Setting up, preparing, and loading biomedical data requires both data architecture
experience and clinical terminology experience. The terminologist must learn the i2b2
ontology model and infrastructure, and then must design and load the i2b2 ontology to
match the local site’s metadata and data. This requires in-depth knowledge and expertise
of modeling clinical events and facts, such as “serum creatinine is a laboratory
measurement used to evaluate kidney function with normal healthy values between 0.6 to
1.3 milligrams per deciliter (mL/dL).” This knowledge is required to perform semantic
integration [47] and involves recognizing the semantic differences and similarities
between observations such as “BUN,” “serum creatinine” and “creatinine clearance,” in
terms of how they are represented in each data source and how they relate to each other
in medicine. The terminologist semantically harmonizes the data by mapping each
semantic alignment using the i2b2 ontology. The terminologist’s semantic alignments
must be coordinated with the organization of the “observation fact” database that is
typically populated by the data architect. This requires in-depth knowledge of i2b2’s data
model and data extract, transform, and loading (ETL) procedures. ETL processes are
responsible for maintaining privacy, data quality, patient record linking [47], managing
structural differences, syntactic differences, and for maintaining integrity between the
semantic alignments contained in the i2b2 ontology. The integration process requires
14
careful and tedious cooperation between the data architect and terminologist.
The time required for i2b2 setup depends entirely on how much work is required
to resolve data integration issues. When patient identity has been well maintained and
data heterogeneity is low, this process may be straightforward. When thousands of data
elements need to be semantically aligned, months of tedious semantic integration work
may be required. It is important to recognize that the time to perform and complete the
ETL process is not a shortcoming of i2b2; the amount of work required is largely a
platform-independent consequence of integrating biomedical data. Once completed,
however, the work left to configure the i2b2 software is straightforward. New users must
have user accounts created and require a light amount of training, but training is pre-
recorded and available online for free
(https://www.youtube.com/results?search_query=i2b2).
A federated version of i2b2 is also available. Sites that have i2b2 can add the
SHRINE extension [48] and participate in research networks. Participation in a SHRINE
network allows researchers access to query for cohort counts across the network of
participants. When researchers find subjects who meet specific cohort criteria at another
site, they must then work out the details of sharing the biomedical data based on the site’s
policies. SHRINE does not support automated sharing.
Participation in a SHRINE requires additional setup and configuration. The
physical network must be set up securely and connected to the i2b2 SHRINE extension
and network, and local data must be semantically aligned to the SHRINE ontology.
Mapping to the SHRINE ontology requires additional work by the terminologist at each
site, and again, the amount of time depends completely on how similar the local site’s
15
ontology is with the SHRINE ontology. By design, a considerable portion of the SHRINE
ontology is based on the use of common coding systems, such as ICD-9 billing codes,
that many sites already support to ease the burden of complicated semantic mappings.
The i2b2 software has a proven track record of delivering translational features.
Forty-nine CTSA sites, 34 additional academic medical institutions, and 20 international
organizations use i2b2 [49]. In terms of publications, “i2b2” was contained in the
PubMed title attribute property of 44 publications, and an additional 158 times searching
all other attributes. Most importantly, researchers have been successful using i2b2 to
make important clinical discoveries [50-52].
1.3.2 OpenFurther
OpenFurther [41] is an example of the federated database architecture and was
originally designed as a statewide informatics platform housed in the Center for Clinical
and Translational Science at the University of Utah [53]. The objective of OpenFurther is
to deliver innovative and practical software tools and services that can directly support
data and knowledge access, integration, and discovery more efficiently than has
previously been possible. The software is open source and is available [54-56] for use by
other organizations.
In the past, obtaining simple counts from a collection of distributed biomedical
databases owned and managed by a list of institutions would have involved months of
processes requiring individual sponsors from each institution, IRB approvals,
communications with multiple IT staff members from each organization, project data
integration and data management for each data set, and so on. OpenFurther however,
16
allows researchers to construct queries [57] and find specific cohorts without requiring all
of these time-consuming processes. The OpenFurther data integration process replaces
the manual processes by performing the following technical steps:
1. When the researcher logs into OpenFurther, data access is determined by
the user’s roles and privileges.
2. The researcher builds and submits a query to data they have access to.
3. The query is sent to the query translator that constructs a platform-
specific data query for each of the state’s databases.
4. The query distributor distributes each platform-specific query to its
respective data service.
5. The query is executed and returns a data set result.
6. Each result from each database is then translated into a common data
model and stored in an intermediate database.
7. When all results have been received and translated, they are intersected or
aggregated to compute the final results.
8. The final result set is reported to the researcher.
Step 1 occurs once for each query session. Steps 2-7 are performed each time a query
request is received. Steps 3, 4, 6, 7 and 8 are unique to the federated query process and
are required to support on-the-fly data integration for each query request. By comparison,
data warehouse systems execute step 1 for each query session, steps 2 and 5 when a
query is performed, and step 6 needs to be run once prior for the whole data set (the ETL
process to load all the data must be performed before the data may be queried). Five of
the 8 steps are unique to the federated data architecture.
17
The benefits of a federated architecture may be attractive, but the cost of setup is
also high in terms of time and the required expertise. OpenFurther setup requires skilled
IT professionals, including software engineers, data architects, and biomedical
terminology experts. A custom semantic framework was designed for OpenFurther that
utilizes an open source terminology system and tools supporting the terminologist’s work
of performing semantic alignments [58] and integration [47]. The framework additionally
includes a metadata management system that was designed to augment the terminology
system’s capabilities to support more sophisticated semantic alignments, data element
(DE) alignments that involve multiple DEs, values, and conditional logic [59]. The data
architect and terminologist perform semantic alignments by loading and aligning
metadata for each data source. Alignments have properties that indicate the nature and
specific conditional logic. This work is very similar to the work that is performed using
off-the-shelf ETL tools, but ETL tools are designed to support large batch processes
rather than very specialized query-specific transformations. Additionally, the added work
of the federated approach specified in step 2 (query translation) requires on-the-fly
interpretation and translation of query logic for each data source, a significant challenge.
A detailed explanation of the data architecture-specific details are contained in [42],
software implementation details are described in [43], and an overview of the semantic
frameworks that the query translation framework utilizes is described in [58, 59]. While
there are similarities with data warehousing, the federated approach adds more
complexity.
OpenFurther has a track record of supporting translational research efforts in Utah
and a large CER study conducted at six pediatric hospitals across the U.S. [5, 6]. The
18
pediatric data integration project produced three journal papers with clinically significant
findings that are in the process of publication. OpenFurther produced 10 informatics-
based journal papers, 25 conference posters, and 7 professional presentations that have
been presented at informatics conferences.
1.3.3 Issues with Biomedical Data Integration Software
Many of the issues of integrating biomedical data are primarily the same between
the two described technical architectures. The semantic alignment work is primarily the
same. One who understands clinical concepts must resolve the naming and semantic
differences between the heterogeneous data sources into computable semantic
alignments. The data architecture work is also primarily the same. Structural and
syntactic differences must be reconciled and addressed and the semantic alignments must
be incorporated into the data integration operations to support data aggregation and
analysis.
OpenFurther and i2b2 are representative of current state-of-the-art biomedical
data integration tools. With both tools, the integration of heterogeneous biomedical data
sets is a prerequisite. Of the issues that have been identified, most biomedical data
integration experts agree that semantic integration (resolution of naming and semantic
differences) of heterogeneous data is the most challenging aspect of integration [27, 60,
61], requiring costly terminologists and/or highly trained knowledge engineers to perform
the work [62-64]. Specific costs have not been formally reported, but salaries for
“Clinical Terminologist” jobs currently range from $120,000 to $130,000/year online
(www.glassdoor.com), and consulting rates are approximately double that. Complexity,
19
time, and costs of semantic integration underscore the need for continued research on
automated, or at the very least semiautomatic semantic integration to help reduce these
burdens.
1.4 Preventing or Resolving Heterogeneous Biomedical Data
The most desirable strategy for resolving heterogeneous biomedical data is to
prevent it from happening in the first place. There has always been a tricky balance
between “allowing” clinicians to express themselves using free-text versus “forcing”
them to encode all observations such that data are computable [65]. Whether data are
free-text or coded, heterogeneous data integration is nearly always required when
combining data from biomedical data sets, and the chosen strategy should be specific to
the goal of integration. The goal may be well defined where the questions and data needs
are known, or the goal may involve data mining where the goal is to discover knowledge,
find correlations, determine reliability, or discover anomalies [66]. When the goal is the
former and the needed data is well defined, the strategy is to collect exactly what is
needed. When the goal is the former, the strategy is to collect as much data as possible to
expand the opportunity for discovery. In both cases the goal of integration is to
disambiguate and resolve heterogeneity between data sets such that they can be analyzed
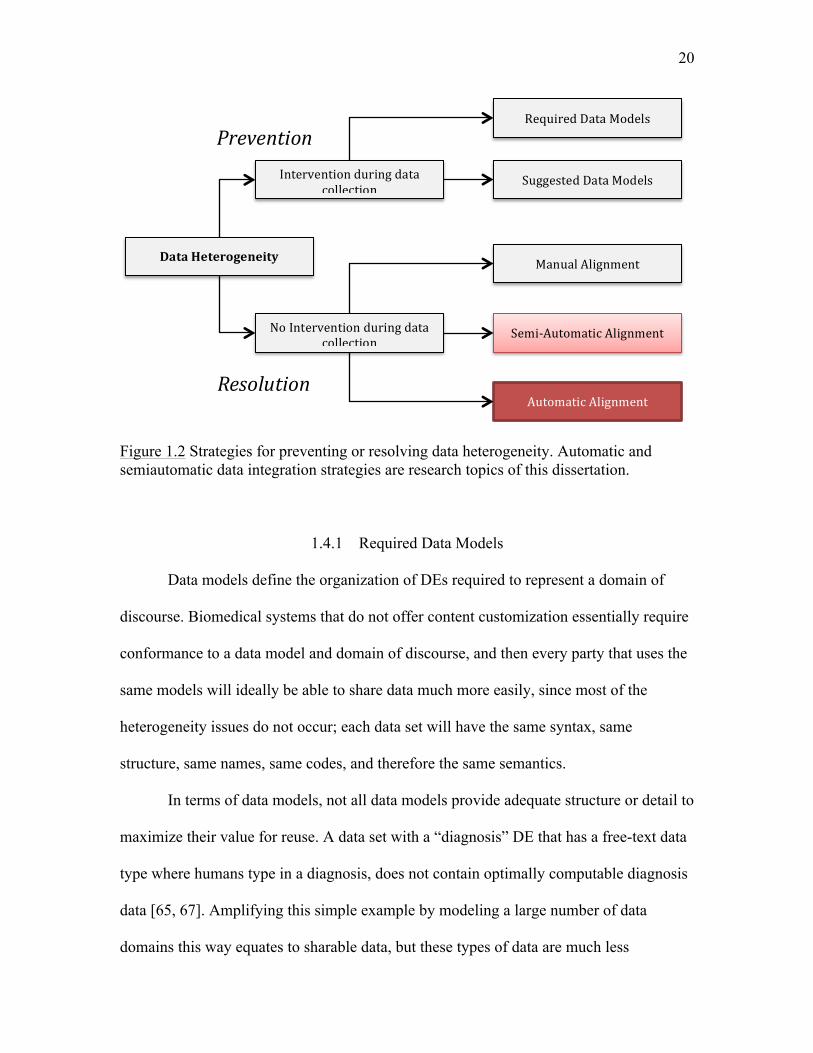
harmoniously together. This goal can be reached in multiple ways. See Figure 1.2 for a
graphical representation that summarizes approaches used to prevent or resolve data
heterogeneity.
20
Figure 1.2 Strategies for preventing or resolving data heterogeneity. Automatic and semiautomatic data integration strategies are research topics of this dissertation.
1.4.1 Required Data Models
Data models define the organization of DEs required to represent a domain of
discourse. Biomedical systems that do not offer content customization essentially require
conformance to a data model and domain of discourse, and then every party that uses the
same models will ideally be able to share data much more easily, since most of the
heterogeneity issues do not occur; each data set will have the same syntax, same
structure, same names, same codes, and therefore the same semantics.
In terms of data models, not all data models provide adequate structure or detail to
maximize their value for reuse. A data set with a “diagnosis” DE that has a free-text data
type where humans type in a diagnosis, does not contain optimally computable diagnosis
data [65, 67]. Amplifying this simple example by modeling a large number of data
domains this way equates to sharable data, but these types of data are much less
DataHeterogeneity
NoInterventionduringdatacollection
Interventionduringdatacollection
ManualAlignment
Semi-AutomaticAlignment
AutomaticAlignment
RequiredDataModels
SuggestedDataModels
Prevention
Resolution
21
computable and are unsuitable for highly accurate analysis.
Within the biomedical domain, Detailed Clinical Models (DCM) are the basis for
clinical data consistency, interoperability, and highly accurate analysis. They are
rigorously defined such that they retain computable meaning [68]. Sharable, computable
meaning is the basis of shared computable logic [69] for applications such as clinical
decision support, clinical trial eligibility criterion, or for computational analysis in
general. DCMs make computations possible by providing formal specifications of the
logical structure of clinical data, including their terminological specifications for value
sets and forms of coded values.
“Required Data Models” is one of the U.S. government’s primary intentions of
the HITECH act. The government has incentivized healthcare organizations to support
consistent data models such that computable data can be shared between organizations,
applications, and systems [14, 35, 70-72]. The potential benefit of embracing and
supporting DCMs is significant and there are several ongoing efforts that continue to
develop and support DCM-based technologies [73, 74] (http://www.openehr.org), but
wide dissemination and utilization of DCMs [22] has never been achieved, despite
significant efforts to do so [75]. Utilization of DCMs requires very highly specialized
skills that are expensive and hard to find. This, paired with the fact that standards-based
approaches often do not cover specialized clinical workflows and practices [76, 77],
makes adoption an expensive and time-consuming option; adoption does not guarantee
adequate coverage in all domains.
22
1.4.2 Suggested Data Models
The “Suggested Data Models” strategy is popular with vendor-based EHR
systems such as Cerner (Cerner.com) and Epic (www.epic.com) because it has the
potential benefits of the “Required Data Models” and also supports flexibility.
Implementers can select from the vendor’s data dictionary or they can create new
dictionary entries when necessary. This is particularly attractive for organizations with
diverse data requirements, but leaves the interoperability issues that DCMs address
unresolved since these vendors are not yet supporting DCMs at this point in time. Custom
site-specific data will not inherently interoperate between different organizations; the
degree of interoperability depends on the degree of customization.
1.4.3 Manual Alignment
Manual alignment implies that experts manually perform the work of
heterogeneous data integration, as described for i2b2 in section 1.3.1 and OpenFurther in
section 1.3.2. These processes were manual, involving human professionals (versus
computer algorithms) who evaluate individual DEs one by one, remembering,
classifying, and comparing DEs with other DEs they have encountered. Based on their
decisions they must align and move data into their proper slots.
Trained professionals develop data integration skills that may involve any number
of technologies or they may utilize off-the-shelf ETL tools, but tools that automatically or
semiautomatically resolve the naming and semantic differences are not typically
packaged with ETL tools. In the cases of OpenFurther and i2b2, both are designed to
support heterogeneous data integration, but neither provides automatic nor semiautomatic
23
data alignment tools.
1.4.4 Semi-automatic Alignment
Semiautomatic alignment occurs when data integration experts use software that
identifies and suggests DE alignments. The experts then review the suggested alignments
and make alignment decisions. This is highly beneficial since human experts manage
complexity more accurately, especially when they have alignment visualization tools.
Semiautomatic systems are designed to reduce the amount of time it takes an expert to
perform integration tasks, and also improve alignment accuracy over manual approaches.
Most “real” algorithm-aided alignment systems are semiautomatic since high alignment
accuracy is usually a top requirement and is difficult to achieve with purely automatic
methods [78, 79]. The challenges of the “automatic” portion of semiautomatic alignment
are outlined in the next section.
1.4.5 Automatic Alignment
Automatic alignment algorithms attempt to align heterogeneous data without
human intervention [78-80] and are particularly complex and challenging. The
documented reasons are directly related to the data reuse issues described in section 1.2,
and especially the data heterogeneity issues previously discussed in section 1.2.3 [27, 61,
78, 79, 81]. The primary topics are as follows:
• Data sets are developed independently for different purposes, resulting in
different data structures with overlapping concepts.
• The same elements of a dataset schema may be named differently.
24
• Semantics are not consistently modeled; they are defined inconsistently using
both data model metadata and instance data; ambiguity in semantics and language
can be very difficult or even impossible to resolve.
• Metadata and data contain different levels of conceptual granularity.
• Data sets may not contain overlapping concepts.
• Alignment requires both technical expertise and domain-level expertise.
• Metadata is not typically modeled to support computable semantics.
• Lack of documentation and/or domain knowledge makes it difficult to interpret
metadata and data [47].
Generally, computing semantic alignments between biomedical data sets relies on
metadata, data structures, or language-based strings that are typically not consistent or
precise.
Requirements, budgets, and specific technologies dictate the rigor with which
biomedical data sets are created and maintained. Data viewed to be of importance for
longer periods of time naturally require more documentation and organization. EHR
retention requirements are typically based on state laws, but generally require retention
for at least 10 years. Data sets created for a single purpose and immediate need may lack
the same amount of organization, documentation, or features, such as rich metadata, that
assist with data integration. Even for EHR data with the strictest requirements, semantic
models have not been widely adopted and significant efforts have been deprecated in
some cases due to overly complex and/or misunderstood semantic models [75].
Investing heavily in an implementation-specific data model and/or technology at
this point in time is risky. Adopting specific models does not guarantee interoperability
25
until there are others who have adopted the same strategy. This constitutes a lack of
incentive and implies that we are left with the reality that computing data set alignments
will likely continue to rely on imperfect data models and data for the foreseeable future.
Meaningful Use and HITECH will hopefully start to change this direction, but in all
likelihood, it will take decades to penetrate the entire market.
1.5 Advancing Methods for Computing Semantic Similarity
Advancing automated methods to semantically align both today’s and yesterday’s
biomedical data sets is currently an important research topic that has the potential for
significant returns. Large volumes of heterogeneous biomedical data are growing at an
exponential rate that exceeds human abilities to integrate by hand; yet integrating these
data contains information that unlocks important unanswered questions of healthcare,
such as which treatments are the most effective at curing cancer.
1.5.1 Current Automatic Alignment Approaches
Automatic data integration techniques are based on computing “alignments”
between data sets. Data sets are also referred to as “schemas” although there can be subtle
differences, depending on the context of the discussion. “Data set” is very generic and
does not necessarily imply a specific structure, but in the context of popular spreadsheet
software, a data set is a table with columns and rows. “Schema” has a stronger
implication of an underlying structure beyond a single table. This distinction is important
when deciding on an alignment approach. Approaches vary based on the data and data
structure that need to be integrated, the purpose of the integration, and the tools that are
26
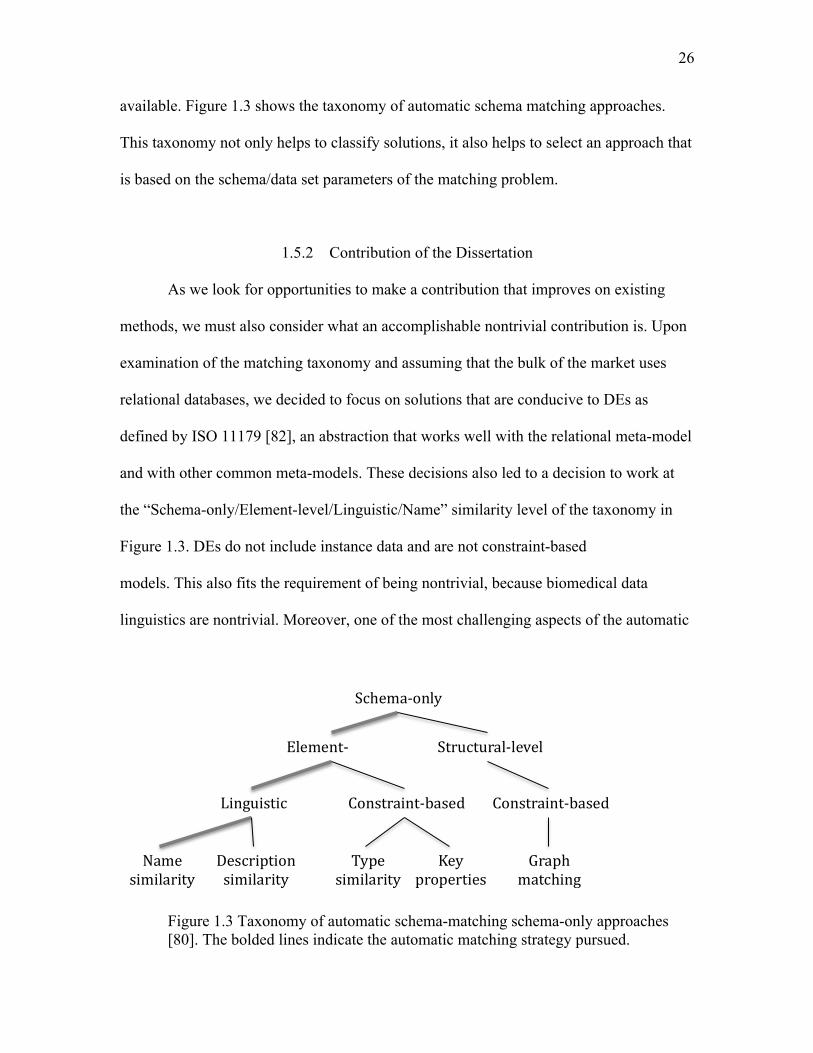
available. Figure 1.3 shows the taxonomy of automatic schema matching approaches.
This taxonomy not only helps to classify solutions, it also helps to select an approach that
is based on the schema/data set parameters of the matching problem.
1.5.2 Contribution of the Dissertation
As we look for opportunities to make a contribution that improves on existing
methods, we must also consider what an accomplishable nontrivial contribution is. Upon
examination of the matching taxonomy and assuming that the bulk of the market uses
relational databases, we decided to focus on solutions that are conducive to DEs as
defined by ISO 11179 [82], an abstraction that works well with the relational meta-model
and with other common meta-models. These decisions also led to a decision to work at
the “Schema-only/Element-level/Linguistic/Name” similarity level of the taxonomy in
Figure 1.3. DEs do not include instance data and are not constraint-based
models. This also fits the requirement of being nontrivial, because biomedical data
linguistics are nontrivial. Moreover, one of the most challenging aspects of the automatic
Figure 1.3 Taxonomy of automatic schema-matching schema-only approaches [80]. The bolded lines indicate the automatic matching strategy pursued.
Schema-only
Element- Structural-level
Linguistic
Name similarity
Description similarity
Constraint-based
Type similarity
Key properties
Constraint-based
Graph matching
27
alignment process is computationally solving the semantic “impedance mismatch” [78,
79, 81].
The underlying methods that address semantic impedance mismatches between
DEs at the “Schema-only/Element-level/Linguistic/Name” level are algorithms that
compute semantic similarity between language-based entities [83]. This is the primary
topic and contribution of this dissertation, describing and contributing a new semantic
similarity algorithm that computes the semantic similarity between language-based
entities.
1.5.3 Dissertation Aims
The aims of this dissertation are as follows:
Aim 1: Introduce a new method for measuring semantic similarity that offers
significant advances in biomedical data integration research.
Aim 2: Operationalize aim 1 by eliminating and/or reducing the amount of work
required to semantically align heterogeneous biomedical data sets.
Aim 3: Expand, generalize, and measure the new algorithm’s ability to compute
a. semantic similarity between medical terms,
b. semantic similarity between clinical notes.
Aims one and two are based on the introduction and explanation of the need for
continued research on semiautomatic and automatic data integration research. The two
use cases introduced in aim three were added to test the algorithm’s boundaries.
Measuring degrees of semantic similarity between medical terms tests the algorithm’s
similarity measurement range more specifically than data set alignment (details in section

28
4.3). Measuring similarity between clinical notes tests the algorithm on much larger and
sophisticated clinical texts (details in Section 4.4).
Each of the 3 applications, performing data set alignments, calculating medical
term similarity, and calculating clinical note similarity, are tested using the newly
introduced methods as well as with other leading methods that are suitable for each
application. This allows us to evaluate how well the new algorithm performs in a variety
of scenarios. We also recognize the importance of scalability. To be highly relevant in the
biomedical domain, data processing methods need to be highly scalable. Large data set
alignment applications require significant computational resources and performance will
therefore be addressed and discussed in the study.
1.6 Introduction Summary
In this chapter we have described how important and valuable biomedical data
are. We described the primary challenges of reusing and integrating heterogeneous
biomedical data. We described two architectural approaches and state-of-the-art tools for
integrating and managing heterogeneous data sets. We described and illustrated
approaches for integrating heterogeneous data and recognized the need for continued
research. And finally, we described the aims of the dissertation and the applications of a
new method that will be formally described within.
The rest of the dissertation is organized as follows: Chapter 2 defines semantic
measures and describes existing best-of-breed semantic similarity algorithms for each of
the 3 applications. Chapter 3 introduces the new algorithms for computing semantic
similarity. Chapter 4 is the methods chapter, with a methods section-style description for

29
each application. Chapter 5 contains the results and discussion of application-specific
results. And customarily following the results, Chapter 6 contains a general discussion of
the concept bag and for all the applications as a whole, followed by the future directions
and conclusions of the study.
CHAPTER 2
COMPUTING SEMANTIC SIMILARITY
This chapter reviews the literature on semantic matching algorithms to give
context to the research reported here, with emphasis in describing state-of-the-art
algorithms used for computing the semantic similarity between biomedical text strings
(short texts), controlled vocabulary concepts, text documents (longer texts), and methods
that support each of these cases. All methods considered were either unsupervised or
semisupervised to support the aim of eliminating or reducing human labor. Supervised
methods were considered out-of-scope.
2.1 Semantics
The following definitions are part literal and part interpreted to fit the context of
this dissertation. The intention is to disambiguate concepts with varying meanings in the
literature. The definitions that help define semantics are as follows:
• Concept – an embodiment of a particular meaning [29]; unit of thought [30].
• Term – linguistic labels used to designate a concept [30].
• Code – a unique identifier used to designate a concept [30].
• Philological relationships – ontological relations between concepts [30].
31
• Taxonomy – a classification scheme dealing with the description,
identification, naming, and organization of biomedical concepts [84].
• Ontology – comprised of concepts, philological relationships, and functions
used to describe a domain of knowledge at the semantic level [30, 85]. A
taxonomy can be represented in an ontology, but an ontology has the
capability to express more sophisticated relationships between entities in a
taxonomy.
• Semantic knowledge base – computable semantic networks modeled in
controlled vocabularies, taxonomies, ontologies, and/or graphs.
• Semantic relatedness – concepts that are related by semantic interactions
without regard for the specific type of semantic link. Example: the concepts
for the terms “surgeon” and “scalpel” are related because they are frequently
used together, but their meanings are not similar. The measure indicates
closeness (versus far) where a high value means close and low value is not
close [86].
• Concept similarity - within a semantic knowledge base concepts that are close
together in the graph are considered similar [86]. Concepts for “delusion” and
“schizophrenia” are close in the SNOMED CT is-a hierarchy, but are not as
close as the concepts for the terms “heart” and “myocardium.” The concepts
for “renal failure” and “kidney failure” are closer together even still; they are
synonyms of the same concept and therefore considered semantically
equivalent [87]. Methods are discussed more formally in section 2.3.
• Lexical similarity – a measure that indicates lexical unit similarity.
32
• Lexical units - language-based text entities such as words, sentences, or
paragraphs.
• Semantic similarity – a measure implicating a quantity of shared meaning
between two compared entities. For the purposes of this work, the similarity
of meaning is extrapolated from lexical similarity methods and/or concept
similarity methods.
• Semantic distance – a measure indicating how semantically far apart two
words, expressions, or documents are without restriction on the actual
semantic relationship type; this is the opposite of semantic relatedness [86].
Based on these definitions, the primary focus of this work was to computationally
measure semantic similarity between biomedical concept sets. How concept sets are
composed is an essential consideration. In the context of biomedical texts, we explore the
idea of converting lexical units into sets of concept codes using named-entity recognition
software and semantic knowledge bases, and then we measure similarity between these
sets using similarity algorithms.
2.1.1 Similarity Algorithms
Similarity algorithms typically employ some kind of systematic strategy for
comparing candidate matches where the output of the comparison is a quantitative
measurement indicating how similar or dissimilar the match is. Similarity is central to
pattern recognition, categorization, memory retrieval, problem solving, and reasoning,
and is also the basis of a similarity measurement (SM). SM is formally defined as follows
[86]:
33
𝜎! :𝐸! × 𝐸! → ℛ
𝐸! = the set of elements of type 𝑘 ∈ 𝐾
𝐾 = 𝑐ℎ𝑎𝑟𝑎𝑐𝑒𝑟𝑠,𝑤𝑜𝑟𝑑𝑠, 𝑐𝑜𝑛𝑐𝑒𝑝𝑡𝑠, 𝑠𝑒𝑛𝑡𝑒𝑛𝑐𝑒𝑠,𝑝𝑎𝑟𝑎𝑔𝑟𝑎𝑝ℎ𝑠, 𝑡𝑒𝑥𝑡𝑠
ℛ = 0,1 ,ℝ!, 𝑎, 𝑏, 𝑐…
The basic idea is that two entities of the same type can be compared for similarity (word-
to-word, concept code-to-concept code, sentence-to-sentence, etc.) to produce a SM with
a value between 0 and 1.
SMs can be normalized to be “dissimilarity measures” such that 0 is “no
dissimilarity” and 1 is “complete dissimilarity,” but the “normal” assumption is generally
that 0 is “no semantic similarity” and 1 is “perfect” semantic similarity [88]. The reader
can refer to additional mathematical definitions of distance and similarity in [86, 88],
including comments about the Triangle Inequality [89] and whether or not it must be
satisfied to be considered a distance metric. For the purposes of this work, the Triangle
Inequality is not a requirement of a SM, based on the argument that many algorithms that
do not satisfy the Triangle Equality perform well in practice.
2.2 String Similarity
In the technical community a “string” is an ordered sequence of characters. A
word is a string of characters. A sentence is a string of characters. A paragraph is also a
string of characters. There are no specific rules or standard size limitations, but database
restrictions generally support up to several gigabytes for a single string. Character strings
are not specific to language. The information in a DNA sequence can be represented in a
string of characters, for example. String similarity algorithms compare character
34
sequences to measure character pattern similarity. When one is interested in computing
semantic similarity between biomedical language-based character strings, lexical and
concept similarity methods can be used independently or in conjunction [90].
The n-gram method is frequently used to measure string similarity and is
described in detail first, since it is the basis for many of the string similarity algorithms
that follow.
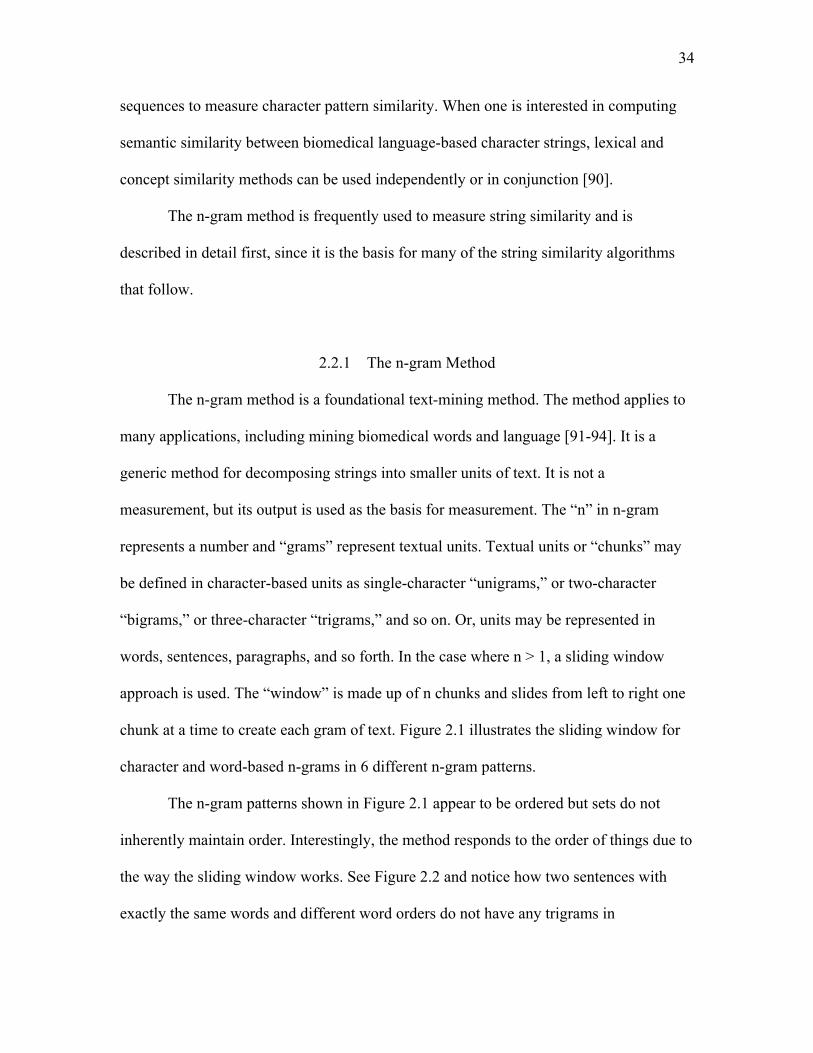
2.2.1 The n-gram Method
The n-gram method is a foundational text-mining method. The method applies to
many applications, including mining biomedical words and language [91-94]. It is a
generic method for decomposing strings into smaller units of text. It is not a
measurement, but its output is used as the basis for measurement. The “n” in n-gram
represents a number and “grams” represent textual units. Textual units or “chunks” may
be defined in character-based units as single-character “unigrams,” or two-character
“bigrams,” or three-character “trigrams,” and so on. Or, units may be represented in
words, sentences, paragraphs, and so forth. In the case where n > 1, a sliding window
approach is used. The “window” is made up of n chunks and slides from left to right one
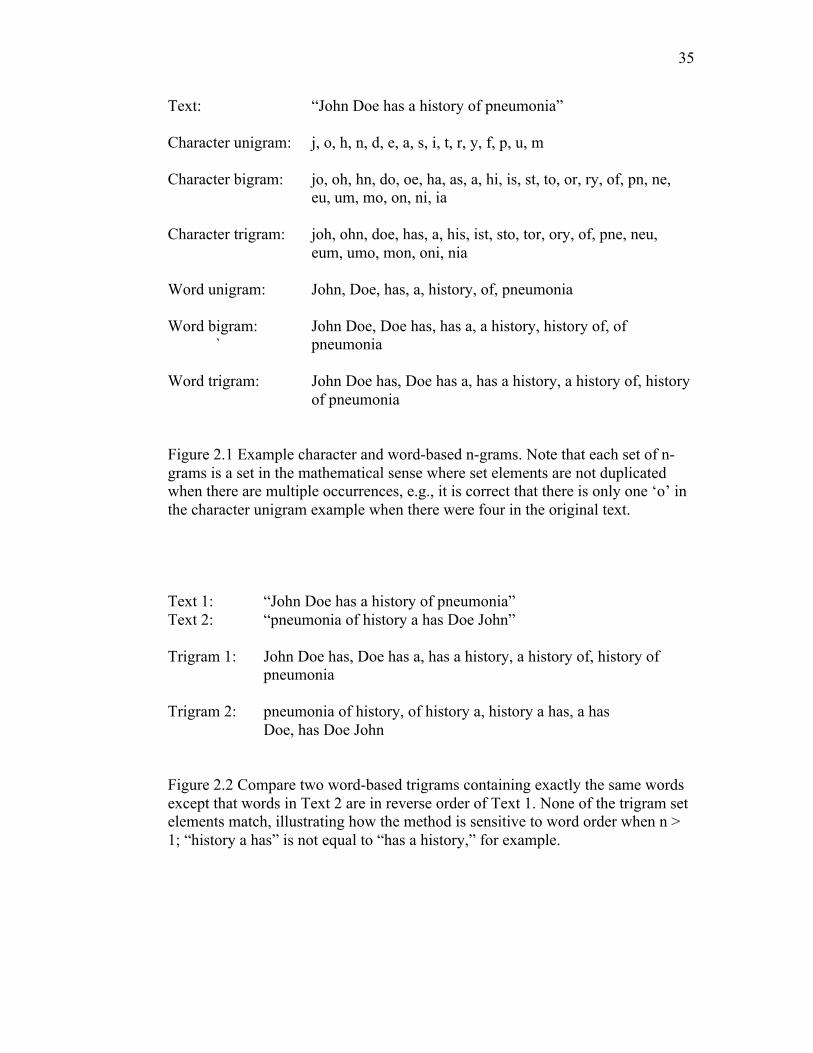
chunk at a time to create each gram of text. Figure 2.1 illustrates the sliding window for
character and word-based n-grams in 6 different n-gram patterns.
The n-gram patterns shown in Figure 2.1 appear to be ordered but sets do not
inherently maintain order. Interestingly, the method responds to the order of things due to
the way the sliding window works. See Figure 2.2 and notice how two sentences with
exactly the same words and different word orders do not have any trigrams in
35
Text: “John Doe has a history of pneumonia” Character unigram: j, o, h, n, d, e, a, s, i, t, r, y, f, p, u, m Character bigram: jo, oh, hn, do, oe, ha, as, a, hi, is, st, to, or, ry, of, pn, ne,
eu, um, mo, on, ni, ia
Character trigram: joh, ohn, doe, has, a, his, ist, sto, tor, ory, of, pne, neu, eum, umo, mon, oni, nia Word unigram: John, Doe, has, a, history, of, pneumonia Word bigram: John Doe, Doe has, has a, a history, history of, of
` pneumonia Word trigram: John Doe has, Doe has a, has a history, a history of, history
of pneumonia
Figure 2.1 Example character and word-based n-grams. Note that each set of n-grams is a set in the mathematical sense where set elements are not duplicated when there are multiple occurrences, e.g., it is correct that there is only one ‘o’ in the character unigram example when there were four in the original text.
Text 1: “John Doe has a history of pneumonia”
Text 2: “pneumonia of history a has Doe John”
Trigram 1: John Doe has, Doe has a, has a history, a history of, history of pneumonia
Trigram 2: pneumonia of history, of history a, history a has, a has Doe, has Doe John
Figure 2.2 Compare two word-based trigrams containing exactly the same words except that words in Text 2 are in reverse order of Text 1. None of the trigram set elements match, illustrating how the method is sensitive to word order when n > 1; “history a has” is not equal to “has a history,” for example.
36
common. If character-based unigrams were selected, transposing words would have no
effect. In the case of unigrams order is completely lost, but in all other cases both
character and word order do impact n-grams, illustrating how they are sensitive to order.
2.2.1.1 Strengths of n-grams
Character-based n-grams are useful for detecting words that are spelled similarly.
This makes it a good strategy for detecting slight misspellings and/or slight word
variations (see Figure 2.3).
As previously mentioned, n-grams are not language-specific. Strings of any type
can be split apart into more granular chunks and analyzed at a more granular level for
subpattern comparison and analysis using a similarity formula such as the Jaccard
Similarity algorithm [95]. The Jaccard Similarity formula is as follows:
Jaccard Similarity (S1,S2) = |S1 ∩ S2| / |S1 ∪ S2| [2.1]
The n-gram method, for example, applies to comparing biological sequence strands [96-
100]. See examples in [101] to observe how n-grams of different configurations can be
used to compare genetic sequences to identify DNA-binding proteins where example
formulas are presented to compute the optimal “n.”
There are many options for analyzing n-grams. Algorithms such as the Jaccard
Similarity algorithm (equation 1) can be applied to compute the ratio of matching
elements, or more sophisticated, vector-based approaches may be used such as the bag-
of-words method [102-107]. Prediction algorithms use n-gram corpora to establish
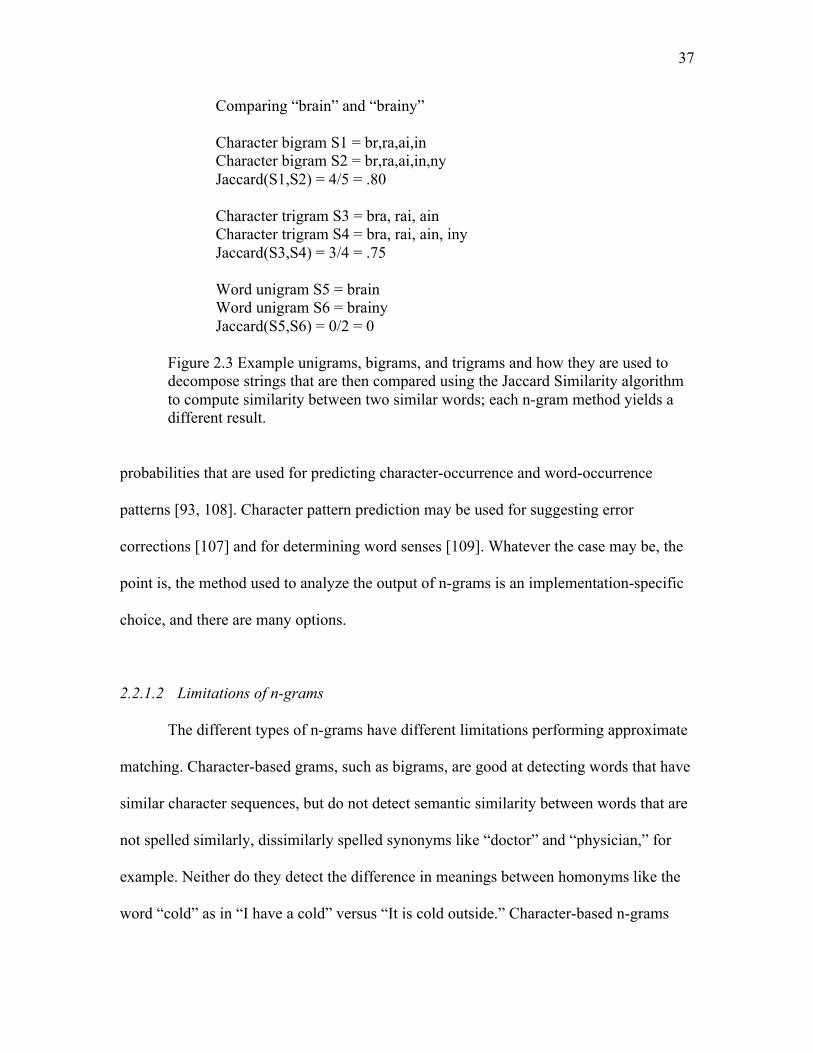
37
Comparing “brain” and “brainy” Character bigram S1 = br,ra,ai,in Character bigram S2 = br,ra,ai,in,ny Jaccard(S1,S2) = 4/5 = .80 Character trigram S3 = bra, rai, ain Character trigram S4 = bra, rai, ain, iny Jaccard(S3,S4) = 3/4 = .75 Word unigram S5 = brain Word unigram S6 = brainy Jaccard(S5,S6) = 0/2 = 0 Figure 2.3 Example unigrams, bigrams, and trigrams and how they are used to decompose strings that are then compared using the Jaccard Similarity algorithm to compute similarity between two similar words; each n-gram method yields a different result.
probabilities that are used for predicting character-occurrence and word-occurrence
patterns [93, 108]. Character pattern prediction may be used for suggesting error
corrections [107] and for determining word senses [109]. Whatever the case may be, the
point is, the method used to analyze the output of n-grams is an implementation-specific
choice, and there are many options.
2.2.1.2 Limitations of n-grams
The different types of n-grams have different limitations performing approximate
matching. Character-based grams, such as bigrams, are good at detecting words that have
similar character sequences, but do not detect semantic similarity between words that are
not spelled similarly, dissimilarly spelled synonyms like “doctor” and “physician,” for
example. Neither do they detect the difference in meanings between homonyms like the
word “cold” as in “I have a cold” versus “It is cold outside.” Character-based n-grams
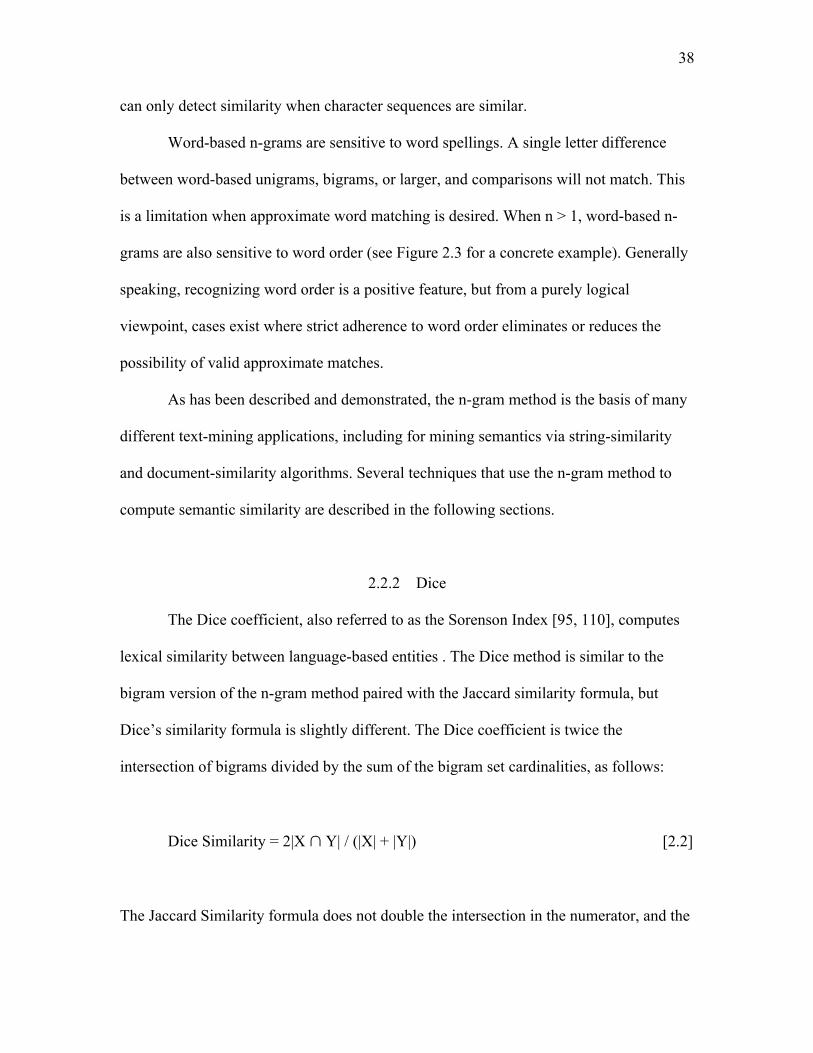
38
can only detect similarity when character sequences are similar.
Word-based n-grams are sensitive to word spellings. A single letter difference
between word-based unigrams, bigrams, or larger, and comparisons will not match. This
is a limitation when approximate word matching is desired. When n > 1, word-based n-
grams are also sensitive to word order (see Figure 2.3 for a concrete example). Generally
speaking, recognizing word order is a positive feature, but from a purely logical
viewpoint, cases exist where strict adherence to word order eliminates or reduces the
possibility of valid approximate matches.
As has been described and demonstrated, the n-gram method is the basis of many
different text-mining applications, including for mining semantics via string-similarity
and document-similarity algorithms. Several techniques that use the n-gram method to
compute semantic similarity are described in the following sections.
2.2.2 Dice
The Dice coefficient, also referred to as the Sorenson Index [95, 110], computes
lexical similarity between language-based entities . The Dice method is similar to the
bigram version of the n-gram method paired with the Jaccard similarity formula, but
Dice’s similarity formula is slightly different. The Dice coefficient is twice the
intersection of bigrams divided by the sum of the bigram set cardinalities, as follows:
Dice Similarity = 2|X ∩ Y| / (|X| + |Y|) [2.2]
The Jaccard Similarity formula does not double the intersection in the numerator, and the
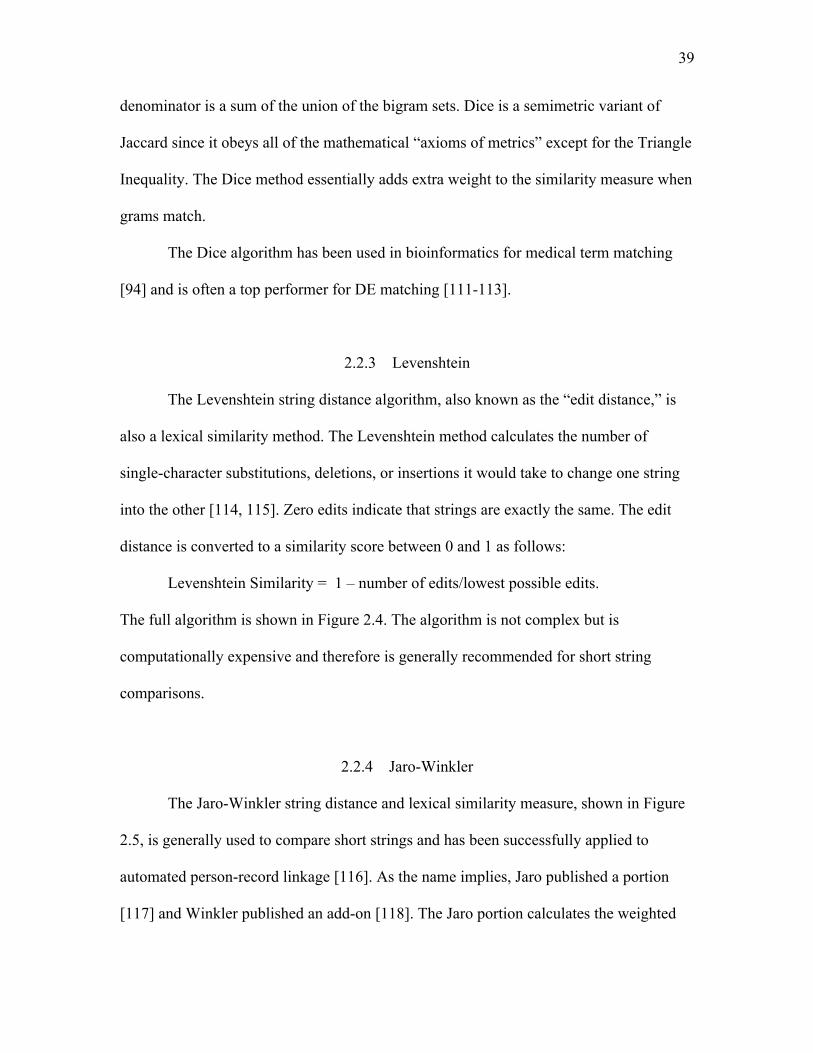
39
denominator is a sum of the union of the bigram sets. Dice is a semimetric variant of
Jaccard since it obeys all of the mathematical “axioms of metrics” except for the Triangle
Inequality. The Dice method essentially adds extra weight to the similarity measure when
grams match.
The Dice algorithm has been used in bioinformatics for medical term matching
[94] and is often a top performer for DE matching [111-113].
2.2.3 Levenshtein
The Levenshtein string distance algorithm, also known as the “edit distance,” is
also a lexical similarity method. The Levenshtein method calculates the number of
single-character substitutions, deletions, or insertions it would take to change one string
into the other [114, 115]. Zero edits indicate that strings are exactly the same. The edit
distance is converted to a similarity score between 0 and 1 as follows:
Levenshtein Similarity = 1 – number of edits/lowest possible edits.
The full algorithm is shown in Figure 2.4. The algorithm is not complex but is
computationally expensive and therefore is generally recommended for short string
comparisons.
2.2.4 Jaro-Winkler
The Jaro-Winkler string distance and lexical similarity measure, shown in Figure
2.5, is generally used to compare short strings and has been successfully applied to
automated person-record linkage [116]. As the name implies, Jaro published a portion
[117] and Winkler published an add-on [118]. The Jaro portion calculates the weighted
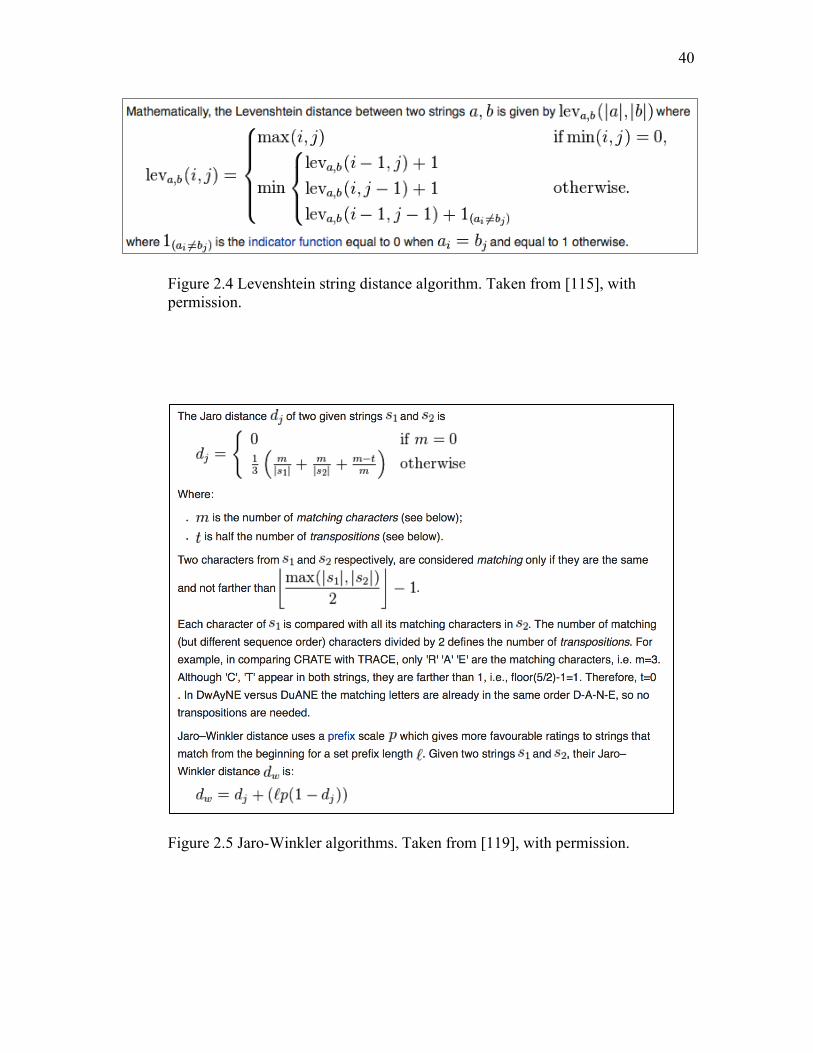
40
Figure 2.4 Levenshtein string distance algorithm. Taken from [115], with permission.
Figure 2.5 Jaro-Winkler algorithms. Taken from [119], with permission.
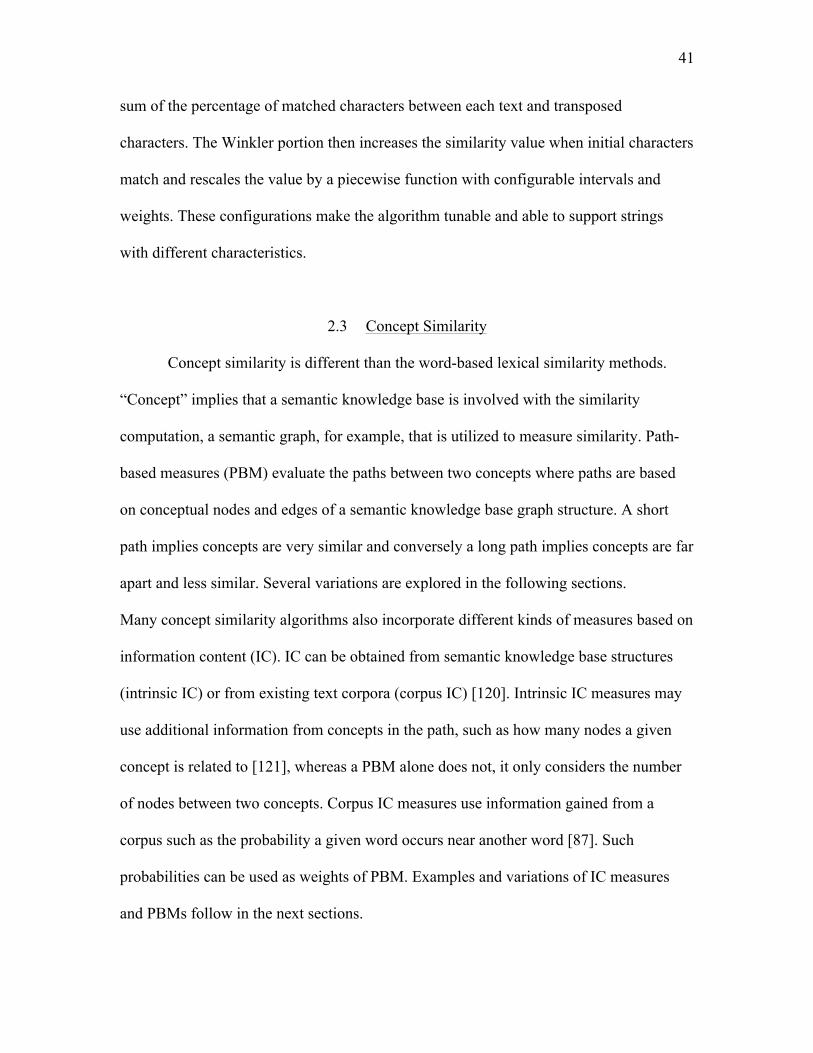
41
sum of the percentage of matched characters between each text and transposed
characters. The Winkler portion then increases the similarity value when initial characters
match and rescales the value by a piecewise function with configurable intervals and
weights. These configurations make the algorithm tunable and able to support strings
with different characteristics.
2.3 Concept Similarity
Concept similarity is different than the word-based lexical similarity methods.
“Concept” implies that a semantic knowledge base is involved with the similarity
computation, a semantic graph, for example, that is utilized to measure similarity. Path-
based measures (PBM) evaluate the paths between two concepts where paths are based
on conceptual nodes and edges of a semantic knowledge base graph structure. A short
path implies concepts are very similar and conversely a long path implies concepts are far
apart and less similar. Several variations are explored in the following sections.
Many concept similarity algorithms also incorporate different kinds of measures based on
information content (IC). IC can be obtained from semantic knowledge base structures
(intrinsic IC) or from existing text corpora (corpus IC) [120]. Intrinsic IC measures may
use additional information from concepts in the path, such as how many nodes a given
concept is related to [121], whereas a PBM alone does not, it only considers the number
of nodes between two concepts. Corpus IC measures use information gained from a
corpus such as the probability a given word occurs near another word [87]. Such
probabilities can be used as weights of PBM. Examples and variations of IC measures
and PBMs follow in the next sections.
42
2.3.1 Pedersen: Path
The most basic PBM is simply called “Path” [87], as it defines similarity between
two concepts, c1 and c2, as the inverse of the shortest path length, p, as follows:
𝑠𝑖𝑚!"#! 𝑐!, 𝑐! = !! [2.3]
This measure gives equal weight to each node transition in the path, no matter where it
exists in the graph, and does not consider IC of the nodes.
2.3.2 Leacock and Chadorow: LC
Leacock and Chadorow (LC) proposed a PBM that asserts deeper concepts in the
semantic knowledge base graph are more specific, contain more IC, and should carry
more semantic weight. To add weight to deeper nodes, the ratio of path length, p, to the
depth, d, of the concept in the graph is computed [122] as follows:
𝑠𝑖𝑚!" 𝑐!, 𝑐! = log 2𝑑 − log(𝑝) [2.4]
2.3.3 Wu and Palmer: WP
Wu and Palmer (WP) [123] is also a PBM that adds to the Path measure by
weighing the depth of the least common subsumer (LCS) rather than the total depth. The
LCS is the lowest level node both concepts have in common. The WP method scales the
LCS by the length of the path between the two concepts as follows:
𝑠𝑖𝑚!" 𝑐!, 𝑐! = !∗!"#$!(!"# !!,!! )!!!!!∗!"#$!(!"# !!,!! )
[2.5]
43
2.3.4 Resnik: Concept Frequency
Resnik proposed another method that incorporated both IC and path-based
information. His method incorporated concept frequency weights obtained from an
existing corpus [124] with structured semantic knowledge. The IC of a concept, c, is as
follows:
𝐼𝐶 𝑐 = −log !"#$%#&'( !!"#$%#&'((!""#)
[2.6]
Corpus concept frequent weight is essentially the concept specificity that becomes the
weight of each semantic concept or node in the graph. This assures a concept with high
IC is very specific, while lower IC values are associated with more general concepts. The
similarity function for IC is as follows:
𝑠𝑖𝑚!"#$%& 𝑐!, 𝑐! = 𝐼𝐶(𝐿𝐶𝑆 𝑐!, 𝑐! ) [2.7]
This equation implies the IC of the shared LCS of the evaluated concepts represents the
similarity of the two concepts. One of the criticisms of this approach is that it does not
consider the depth of the compared children under the LCS [87].
2.3.5 Lin Similarity
Lin goes a step further and adds IC based on individual concepts [88] rather than
for the shared LCS of both concepts, as Resnik proposed to consider the depth of the
concepts under the LCS. Lin’s similarity calculation was as follows:
44
𝑠𝑖𝑚!"# 𝑐!, 𝑐! = !∙!"(!"# !!,!! )!" !! !!"(!!)
[2.8]
For the sake of fitting it into a category, the Lin similarity measure is a PBM combined
with intrinsic IC.
2.3.6 Caviedes and Cimino: CDist
The concept distance (CDist) algorithm is a PBM that uses relationships in the
UMLS to find the shortest path between two concepts in the UMLS [125]. The UMLS
manages multiple semantic knowledge bases in a relationship table (MRREL) where
specific terminology relationships are queried to determine all possible path lengths
between concepts. The shortest path length between two concepts determines the
similarity score. CDist utilizes both the hierarchical structure of UMLS and IC contained
within UMLS to compute path lengths and is therefore considered a PBM and IC-based
method.
2.3.7 Personalized PageRank: PPR
The PageRank algorithm is a published portion of the Google Search engine [126]
and was created by one of Google’s founders, Larry Page. The algorithm estimates the
importance of a website based on the idea that important websites are linked to by other
websites. A probability vector (probability distribution) contains nodes (websites) and
each has a score representing the portion of time a random visitor will stay. The
Personalized PageRank (PPR) algorithm adds probability mass to specific websites to
45
artificially direct traffic. Website advertisers, for example, pay Google to add weight to
their website (node in the graph) so they are ranked very highly in Google searches.
The same principles apply to conceptual graphs represented in biomedical
vocabularies. Graphs are created where vertices are concepts and edges are semantic
relationships. A probability vector is computed for each concept using PPR, where
random jumps are weighted toward the modeled concept. Semantic similarity is
computed using the cosine of the angle between two concept probability vectors [121].
Both intrinsic and corpus IC techniques can be used to create probability vectors.
Intrinsic IC can be calculated using SNOMED CT. Concepts that have more links are
weighted more than those that do not since they have a higher probability of being
“visited.” Corpus IC can also be used to calculate probability vectors based on corpus co-
occurrence probabilities.
2.3.8 Pedersen: Context Vector
The Concept Vector strategy is a corpus IC measure based on the idea that words
that are frequently near each other are also semantically related. To identify words that
are often together, co-occurrence word vectors are created from a corpus of text. Co-
occurrence between two words occurs when a word is within a specified window of
another word. Using a controlled vocabulary and thesaurus, additional terms are
identified and concept mappings are added to word vectors. UMLS concept terms are
then added to the word vectors to create context vectors. The similarity between a pair of
concepts is defined as the cosine of the angle between their context vectors [87].
46
2.4 Document Similarity
Document similarity methods became particularly popular and relevant in the
early 1990s, when the Internet started to grow at a rapid pace and search engines became
big business. The main use case was to match a user’s search to the most relevant
documents, a 2 or 3-word search phrase to a collection of documents, each containing
hundreds or thousands of words. Today the use case is still the same, except that
scalability requirements have changed. Big Data document collections contain Petabytes
or even Exabytes of data, emphasizing the importance of algorithm specificity and
scalability [127]. Searching sophisticated biomedical texts adds to the challenge.
Outside of searching for relevant documents, the operational use cases for
document similarity algorithms are limited. The most common unsupervised methods
that are utilized for document similarity use cases follow in the next sections.
2.4.1 Shingling
The Shingling method is a lexical similarity method that compares documents for
similarity using the n-gram method and Jaccard similarity [128]. “Shingles” are word-
based unigrams, bigrams, or trigrams and are the typical units of comparison. Whole
documents are shredded into n-grams and n-grams are compared as sets to determine
similarity. It is very simple to understand and implement but is not as scalable as vector-
based methods. It is slightly different than the Bag-of-words approach [129]. The
Shingling method is more flexible. The Bag-of-words approach is the same as when
Shingles are unigrams, but Shingles can be configured as bigrams or trigrams, for
example.
47
2.4.2 TF-IDF
TF-IDF, or “term-frequency inverse document frequency,” is based on the Vector
space model [130] and the Bag-of-words model [129] and is based on lexical similarity
methods. Words from a body of text are each assigned a position in a vector. The value of
any given word’s position in the vector is the inverse-document frequency (IDF) value
for that word in the document. Documents that have been converted to vectors are
compared for similarity by assessing the angle between the two document’s vectors using
the cosine similarity function. When the angle between the two vectors is small, the
compared texts are similar. Conversely, the documents are dissimilar according to larger
angles.
TF-IDF is a very popular “Google-like” strategy that scales very highly into the
Big Data realm. It is also the basis for the “Lucene” document indexing software [131].
Document queries are very fast and accurate even with huge volumes of document data.
2.4.3 LSA
Latent Semantic Analysis (LSA) is a technique used to analyze relationships
between documents based on their lexical patterns. LSA is also based on the Vector space
model and Bag-of-words model, but uses dimension-reduction techniques (singular value
decomposition) to create a reduced space. Similarities are computed in the reduced space
where document vectors and term vectors are both in the same vector space, implying
more sophisticated searching capabilities. Not only can document term vectors be
compared (as with TF-IDF), but document vectors can also be compared with other
document vectors, term vectors with other term vectors, and term vectors with document
48
vectors. Additionally, new combined term-document vectors can be “folded in” or added
to the vector space to augment the space [132].
In practical terms, LSA adds the ability to search for “cardiac” and find
documents that have the word “heart” or other related terms instead. This is a result of
LSA’s term-to-term vector composition that would relate “cardiac” and “heart”
(assuming they occurred frequently together in the text). Then, comparing these highly
similar term vectors with document vectors, all documents similar to the term vectors are
retrieved. This example demonstrates a term-term and term-document vector similarity
comparison, and more sophisticated utilization of the vector space is also possible.
Document-document similarity comparisons are utilized for clustering, for example
[133].
2.5 Named Entity Recognition
Named entity recognition (NER) software mines language-based text and
identifies concepts from ontologies that contain additional computable semantic
knowledge; therefore, biomedical text-mining applications use NER software to extract
and enhance biomedical texts. For example, the concept “Oxycodone” mined from a text
document could be part of an ontology that asserts “Oxycodone is-a pain medication” and
“Oxycodone is-a controlled substance.” After making these associations, searches for
“pain medications” and “controlled substances” would return this document. Associating
concepts to texts has a wide variety of useful applications [134-136] for text mining
applications.
49
2.5.1 Open Source NER Tools
2.5.1.1 MetaMap
The NLM has developed MetaMap [137, 138] for NER and offers it for free.
MetaMap is backed by the UMLS [139] and the UMLS’ USAbase default vocabulary set.
The USABase is made up of freely available vocabularies that do not have license
restrictions in the USA. See categories 0, 4, and 9 online in the MetaMap UMLS Source
Vocabulary instructions [140].
2.5.1.2 cTAKES
The clinical Text Analysis and Knowledge Extraction System (cTAKES) is an
open source text-processing tool that utilizes the Unstructured Information Management
Architecture framework and OpenNLP to generate linguistic and semantic annotations.
As the name indicates, cTAKES is tuned for clinical text and the generated annotations
are useful for higher-level semantic processing [141].
2.5.1.3 Sophia
Sophia software has been recently released (in 2014) [142]. It was developed for
Veteran Affairs and the famous VINCI database with over 2.8 billion clinical notes that
would theoretically take years to process using MetaMap or CTakes. Authors claim their
solution is state-of-the-art based on its highly scalable architecture, faster throughput, and
improved precision over MetaMap. The precision of cTAKES is barely higher (+ 0.04 F-
score), but Sophia is 18 times faster.
The described set of similarity measures in this chapter represents a set of primary
50
strategies used to compute semantic similarity between biomedical texts with different
size and length characteristics. Additionally, biomedical semantic knowledge base
utilization techniques and NER tools were briefly described since they play a significant
role in the methods that are described in following chapters, where the new method for
computing concept bag similarity is introduced and methods for testing the algorithms are
described.
CHAPTER 3
THE NEW CONCEPT BAG ALGORITHMS
In a graduate-level data-mining course at the University of Utah, the professor,
Dr. Jeff Philips, challenged the students to do a real data-mining project for the final
project. With recent exposure to a particularly challenging biomedical data integration
project and newly acquired data-mining skills, the new Concept Bag (CB) algorithm was
composed based on the recognition that n-grams and named-entity recognition (NER)
software could be used together to create comparable concept bags rather than word or
character-based bags. This chapter describes the idea, the CB and Hierarchical Concept
Bag (HCB) algorithms, and provides examples.
3.1 Concept Bag Conception
The CB method, like the n-gram, was designed to be multipurposed. The original
use case was to perform automatic data integration between highly heterogeneous
biomedical datasets collected from 5 large academic medical centers across the U.S.A.; in
all, the combined datasets contained 899,649 unique DEs from 20,724 research datasets
(see section 4.2.7.1).
Further inspection and analysis of the large number of DEs and datasets revealed
DEs were in the form of variable-length biomedical expressions where synonyms,
52
abbreviations, and other textual anomalies appeared frequently. Existing matching
solutions all had something to offer, string matching, concept matching, and document
matching, but the problem appeared to require a combination of techniques, techniques
that would disambiguate synonyms and common abbreviations used by medical
professionals.
Disambiguating synonyms and abbreviated terms such as “SBP” and “systolic
BP” to a common concept code is a specialty of biomedical NER tools and was therefore
one of the first recognized components of the solution. The second realization came
shortly thereafter during a pilot study that was conducted to study if NER was a feasible
method for processing metadata. The pilot study revealed that NER essentially produced
a bag of concept codes for each text. What could be done with a bag of concept codes?
Recognizing the parallel with the n-gram method and how it produced bags of things that
could be compared many ways, we recognized CBs could be compared using the same
methods. Further research and analysis of computable similarity methods confirmed its
uniqueness and the study of the new method began.
3.1.1 Creating Concept Bags
To operationalize and test the CB method, MetaMap [137, 138] was the NER tool
utilized for experimentation. MetaMap fulfilled the requirements and supported a rich set
of biomedical vocabularies and ontologies with literally millions of computational
semantic relationships, is free, is supported by the NLM, and is well understood by the
biomedical text mining research community. Using MetaMap as the NER tool, the
stepwise process used to create CBs was as follows:
53
1. Textual elements were organized and saved in a comma-delimited (CSV) file
where each row contained one textual element and a unique identifier (primary
key for the text).
2. Each textual element was processed using MetaMap’s default dictionaries and
parameter settings, with the exception of the output flag that directs MetaMap to
output XML, because XML is conducive for automated concept code extraction
[138].
3. Capture the XML output from step 2 for each row and extract each of the distinct
concept codes (CUIs) from the XML file.
4. Write the distinct concept codes from step 3 to a new row in another CSV file
with the same unique identifier used in step 1.
5. Each row in the file created in step 4 contains the CB for a textual element.
To compare CBs for similarity, the Jaccard Similarity formula (Equation 1 in section
2.2.1.1) was selected for the initial experiments. The Jaccard formula computes a decimal
value between 0 and 1 where 0 represents no similarity, and 1 represents a perfect match.
Values between 0 and 1 represent the ratio of the matching concept codes. Interpretation
of the similarity score is left to the application and its purpose. Figure 3.1 demonstrates
the idea visually with an example.
3.2 Hierarchical Concept Bags
The CB’s NER method resolves strings such as “SBP” and “systolic BP” to the
same concept, recognizing synonymy between the two strings, but the method does not
consider similarity between words such as “abortion” and “miscarriage” where they are
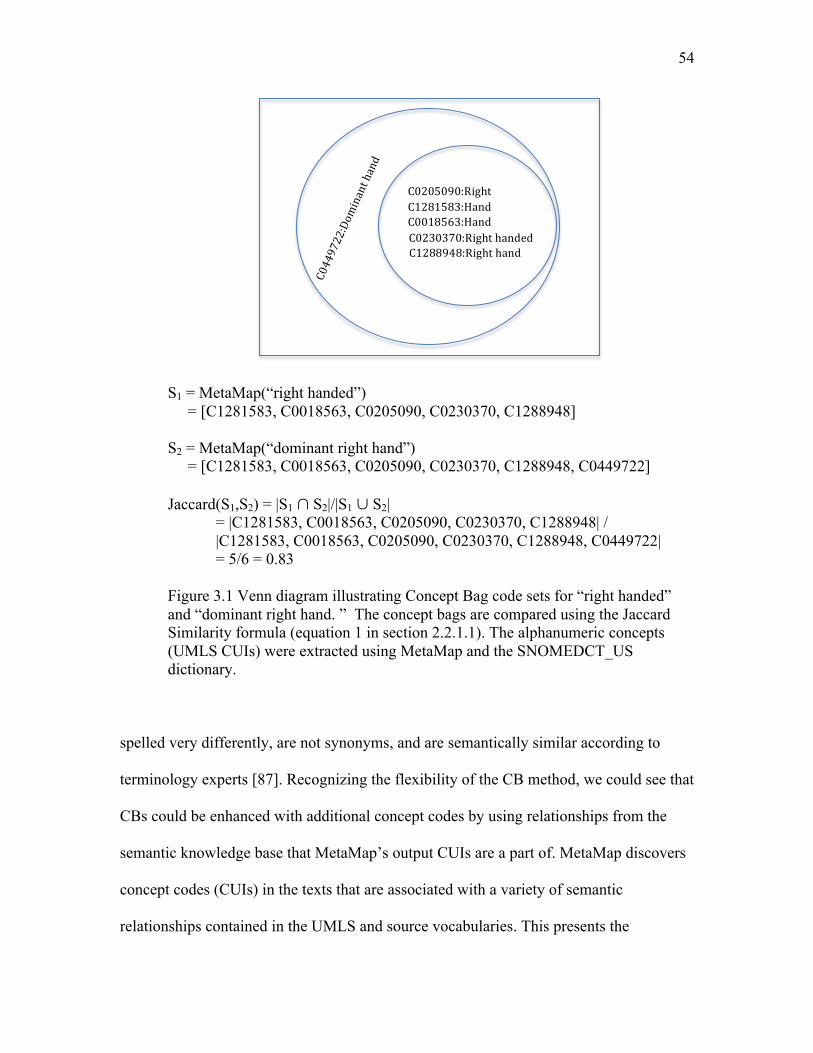
54
S1 = MetaMap(“right handed”) = [C1281583, C0018563, C0205090, C0230370, C1288948] S2 = MetaMap(“dominant right hand”) = [C1281583, C0018563, C0205090, C0230370, C1288948, C0449722] Jaccard(S1,S2) = |S1 ∩ S2|/|S1 ∪ S2|
= |C1281583, C0018563, C0205090, C0230370, C1288948| / |C1281583, C0018563, C0205090, C0230370, C1288948, C0449722|
= 5/6 = 0.83 Figure 3.1 Venn diagram illustrating Concept Bag code sets for “right handed” and “dominant right hand. ” The concept bags are compared using the Jaccard Similarity formula (equation 1 in section 2.2.1.1). The alphanumeric concepts (UMLS CUIs) were extracted using MetaMap and the SNOMEDCT_US dictionary.
spelled very differently, are not synonyms, and are semantically similar according to
terminology experts [87]. Recognizing the flexibility of the CB method, we could see that
CBs could be enhanced with additional concept codes by using relationships from the
semantic knowledge base that MetaMap’s output CUIs are a part of. MetaMap discovers
concept codes (CUIs) in the texts that are associated with a variety of semantic
relationships contained in the UMLS and source vocabularies. This presents the
C0230370:Righthanded C1288948:Righthand
C1281583:Hand
C0449722:Dominanthand
C0018563:Hand
C0205090:Right
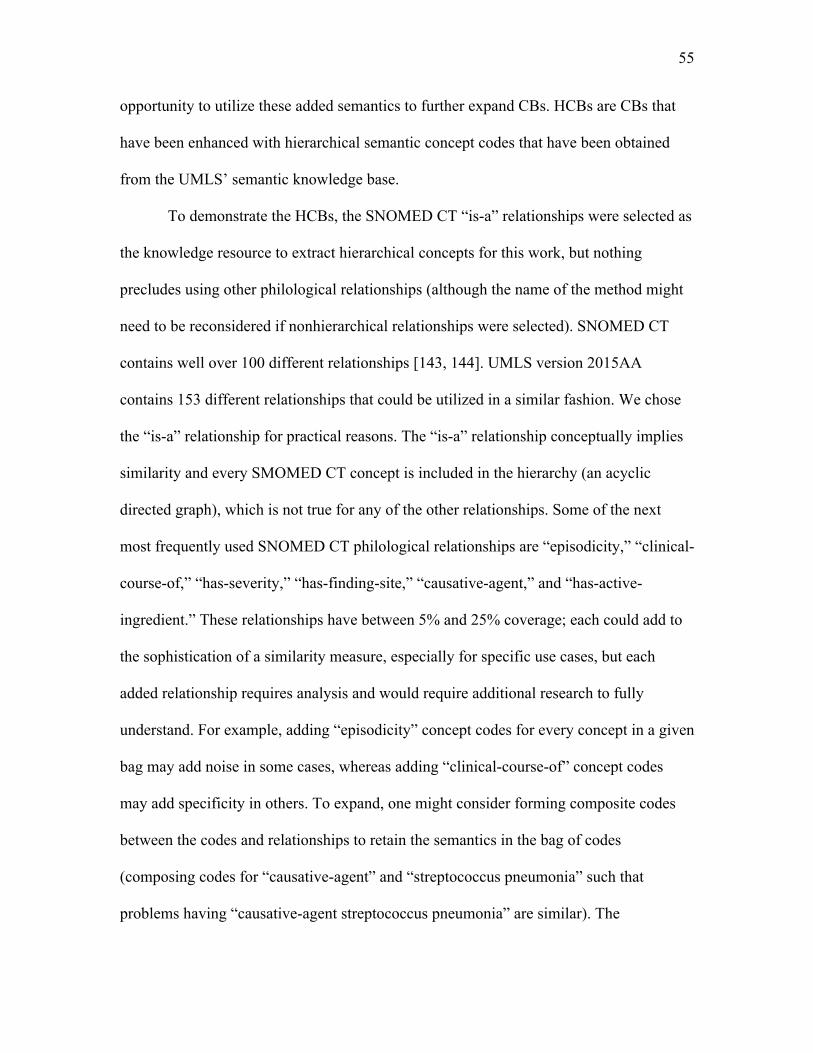
55
opportunity to utilize these added semantics to further expand CBs. HCBs are CBs that
have been enhanced with hierarchical semantic concept codes that have been obtained
from the UMLS’ semantic knowledge base.
To demonstrate the HCBs, the SNOMED CT “is-a” relationships were selected as
the knowledge resource to extract hierarchical concepts for this work, but nothing
precludes using other philological relationships (although the name of the method might
need to be reconsidered if nonhierarchical relationships were selected). SNOMED CT
contains well over 100 different relationships [143, 144]. UMLS version 2015AA
contains 153 different relationships that could be utilized in a similar fashion. We chose
the “is-a” relationship for practical reasons. The “is-a” relationship conceptually implies
similarity and every SMOMED CT concept is included in the hierarchy (an acyclic
directed graph), which is not true for any of the other relationships. Some of the next
most frequently used SNOMED CT philological relationships are “episodicity,” “clinical-
course-of,” “has-severity,” “has-finding-site,” “causative-agent,” and “has-active-
ingredient.” These relationships have between 5% and 25% coverage; each could add to
the sophistication of a similarity measure, especially for specific use cases, but each
added relationship requires analysis and would require additional research to fully
understand. For example, adding “episodicity” concept codes for every concept in a given
bag may add noise in some cases, whereas adding “clinical-course-of” concept codes
may add specificity in others. To expand, one might consider forming composite codes
between the codes and relationships to retain the semantics in the bag of codes
(composing codes for “causative-agent” and “streptococcus pneumonia” such that
problems having “causative-agent streptococcus pneumonia” are similar). The
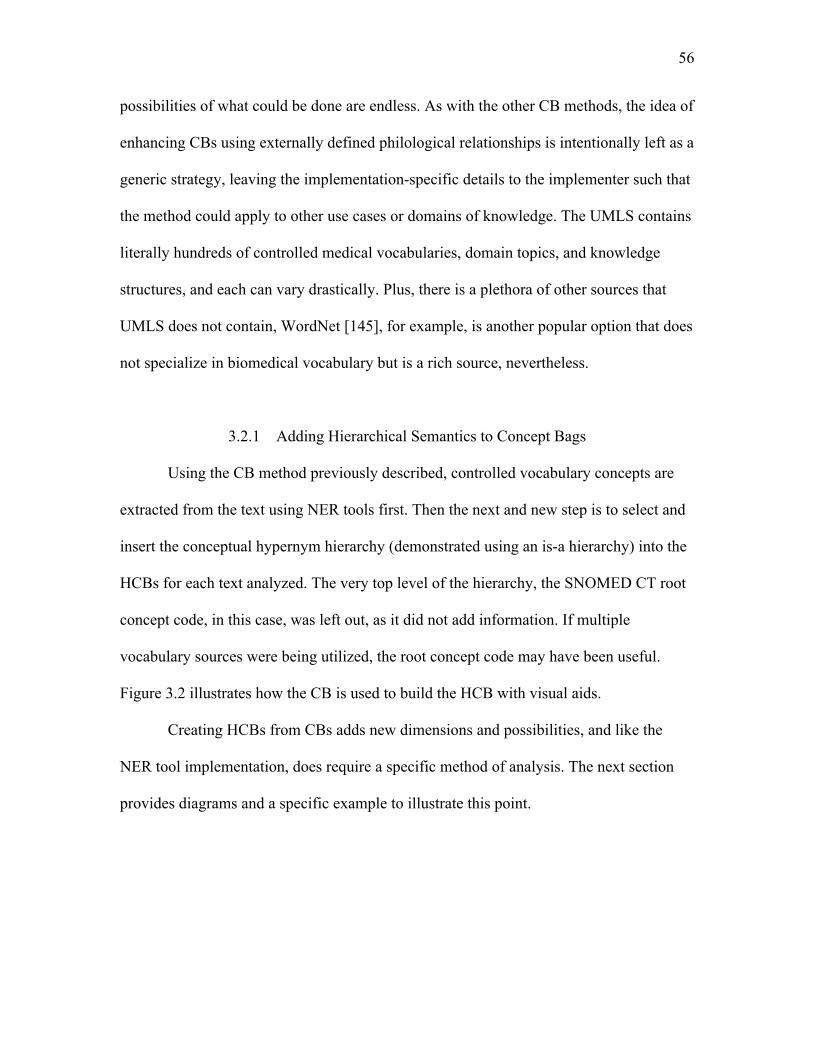
56
possibilities of what could be done are endless. As with the other CB methods, the idea of
enhancing CBs using externally defined philological relationships is intentionally left as a
generic strategy, leaving the implementation-specific details to the implementer such that
the method could apply to other use cases or domains of knowledge. The UMLS contains
literally hundreds of controlled medical vocabularies, domain topics, and knowledge
structures, and each can vary drastically. Plus, there is a plethora of other sources that
UMLS does not contain, WordNet [145], for example, is another popular option that does
not specialize in biomedical vocabulary but is a rich source, nevertheless.
3.2.1 Adding Hierarchical Semantics to Concept Bags
Using the CB method previously described, controlled vocabulary concepts are
extracted from the text using NER tools first. Then the next and new step is to select and
insert the conceptual hypernym hierarchy (demonstrated using an is-a hierarchy) into the
HCBs for each text analyzed. The very top level of the hierarchy, the SNOMED CT root
concept code, in this case, was left out, as it did not add information. If multiple
vocabulary sources were being utilized, the root concept code may have been useful.
Figure 3.2 illustrates how the CB is used to build the HCB with visual aids.
Creating HCBs from CBs adds new dimensions and possibilities, and like the
NER tool implementation, does require a specific method of analysis. The next section
provides diagrams and a specific example to illustrate this point.
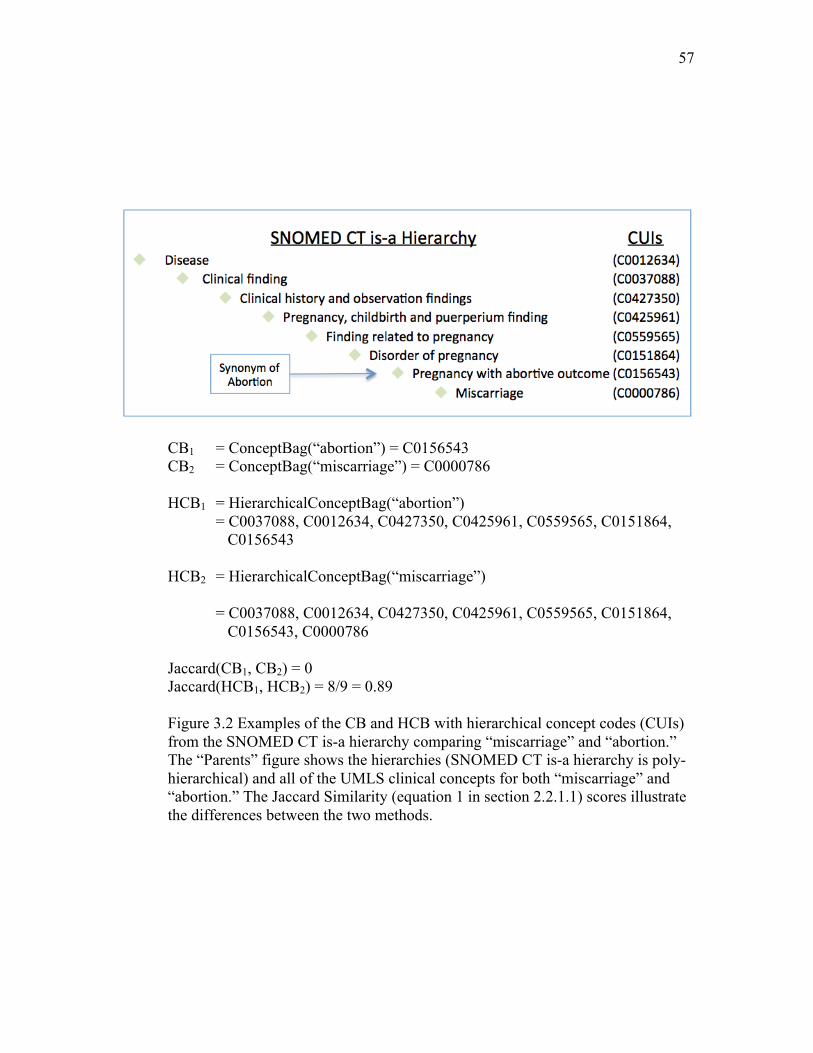
57
CB1 = ConceptBag(“abortion”) = C0156543 CB2 = ConceptBag(“miscarriage”) = C0000786 HCB1 = HierarchicalConceptBag(“abortion”) = C0037088, C0012634, C0427350, C0425961, C0559565, C0151864, C0156543 HCB2 = HierarchicalConceptBag(“miscarriage”) = C0037088, C0012634, C0427350, C0425961, C0559565, C0151864, C0156543, C0000786 Jaccard(CB1, CB2) = 0 Jaccard(HCB1, HCB2) = 8/9 = 0.89
Figure 3.2 Examples of the CB and HCB with hierarchical concept codes (CUIs) from the SNOMED CT is-a hierarchy comparing “miscarriage” and “abortion.” The “Parents” figure shows the hierarchies (SNOMED CT is-a hierarchy is poly-hierarchical) and all of the UMLS clinical concepts for both “miscarriage” and “abortion.” The Jaccard Similarity (equation 1 in section 2.2.1.1) scores illustrate the differences between the two methods.
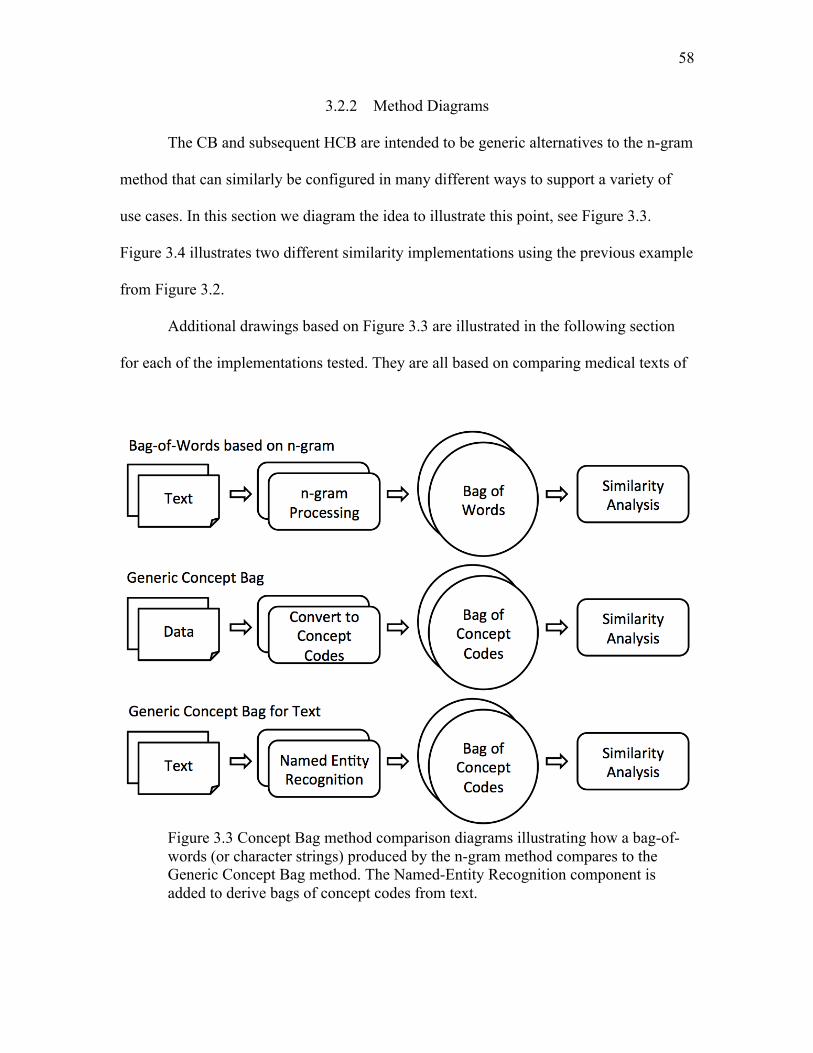
58
3.2.2 Method Diagrams
The CB and subsequent HCB are intended to be generic alternatives to the n-gram
method that can similarly be configured in many different ways to support a variety of
use cases. In this section we diagram the idea to illustrate this point, see Figure 3.3.
Figure 3.4 illustrates two different similarity implementations using the previous example
from Figure 3.2.
Additional drawings based on Figure 3.3 are illustrated in the following section
for each of the implementations tested. They are all based on comparing medical texts of
Figure 3.3 Concept Bag method comparison diagrams illustrating how a bag-of-words (or character strings) produced by the n-gram method compares to the Generic Concept Bag method. The Named-Entity Recognition component is added to derive bags of concept codes from text.
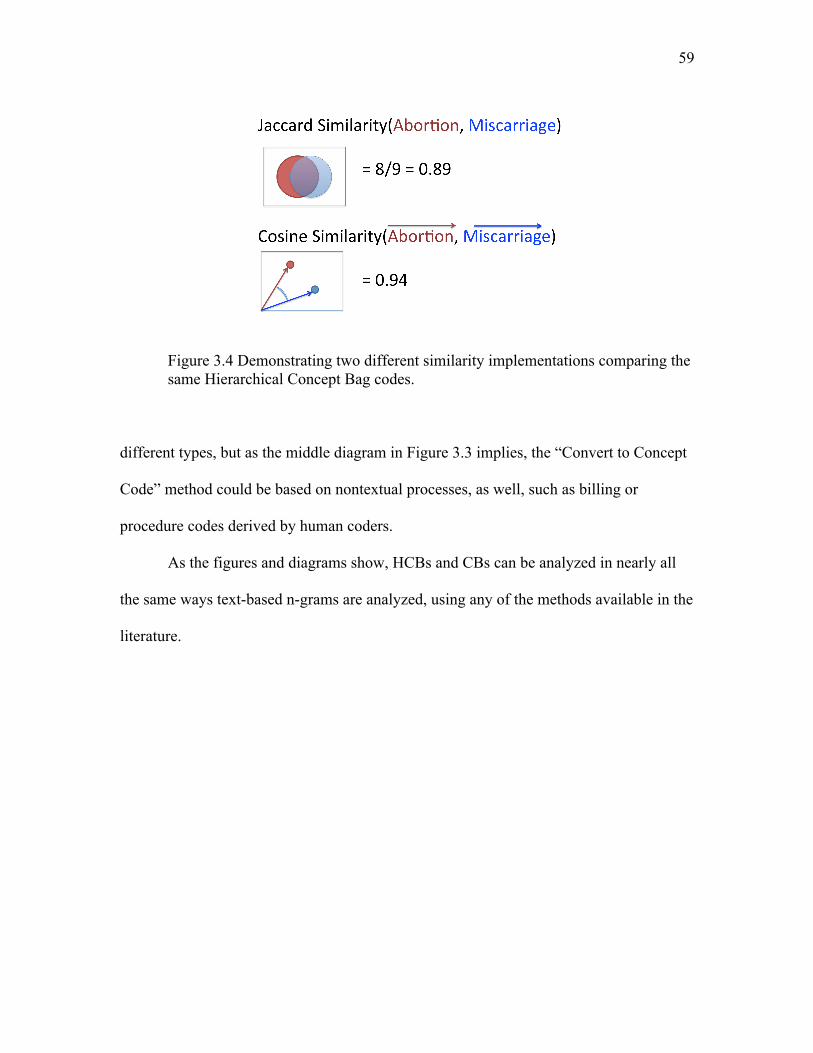
59
Figure 3.4 Demonstrating two different similarity implementations comparing the same Hierarchical Concept Bag codes.
different types, but as the middle diagram in Figure 3.3 implies, the “Convert to Concept
Code” method could be based on nontextual processes, as well, such as billing or
procedure codes derived by human coders.
As the figures and diagrams show, HCBs and CBs can be analyzed in nearly all
the same ways text-based n-grams are analyzed, using any of the methods available in the
literature.
CHAPTER 4
APPLICATIONS OF THE CONCEPT BAG
A new method needs to be tested rigorously in a variety of use cases. The three
use cases chosen here to meet this goal were, 1) the application of aligning heterogeneous
data elements (DE), 2) measuring degrees of similarity between medical terms, and 3)
measuring patient case similarity between intensive care unit (ICU) discharge
instructions. Four data sets were used to test the three use cases as follows:
1. DEs from a controlled vocabulary (see section 4.2.5),
2. DEs from an uncontrolled vocabulary (see section 4.2.7),
3. A medical term pair similarity benchmark (see section 4.3),
4. Deidentified ICU discharge instructions (see section 4.4).
4.1 Descriptive Analysis
A descriptive analysis was performed on each of the four data sets to describe
their characteristics and to facilitate comparisons between data sets. The following textual
features were tabulated and reported:
• Textual element counts - the individual DEs, medical terms, and ICU discharge
summaries,
• Character count means,
61
• Word count means,
• Concepts per element means,
• Concepts per word means.
Each of the data sets was managed in a relational database and structured query language
(SQL) queries were utilized to compute these statistics.
4.2 Application: Aligning Data Elements
4.2.1 Semantic Alignment of Data Elements
Integrating heterogeneous data sets involves semantically aligning DEs between
data sets. The goal was to test the new algorithm on the task of semantically auto-aligning
DEs. Optimally no humans would be required; suboptimally, human intervention would
be required, but less than without assistance with other existing methods. The decision to
focus on the automatic mapping challenge had implications on the chosen matching
strategies. There are literally an unlimited number of possible kinds of data alignments
required to map data sets, and the possibilities are specific to the purpose of the
alignment, the alignment language, and the capabilities of the alignment interpreter. We
chose to focus this portion of the study on the most universally supported and well-
understood alignment, “equals,” or more specifically, “is semantically equivalent,” and
focus on the semantic matching component rather than specific alignment
implementations.
Identifying semantically equivalent matches does not imply that only perfect
similarity scores were acceptable and that there is not an acceptable amount of fuzziness;
it implies that the goal of interpreting fuzziness is to identify semantically equivalent
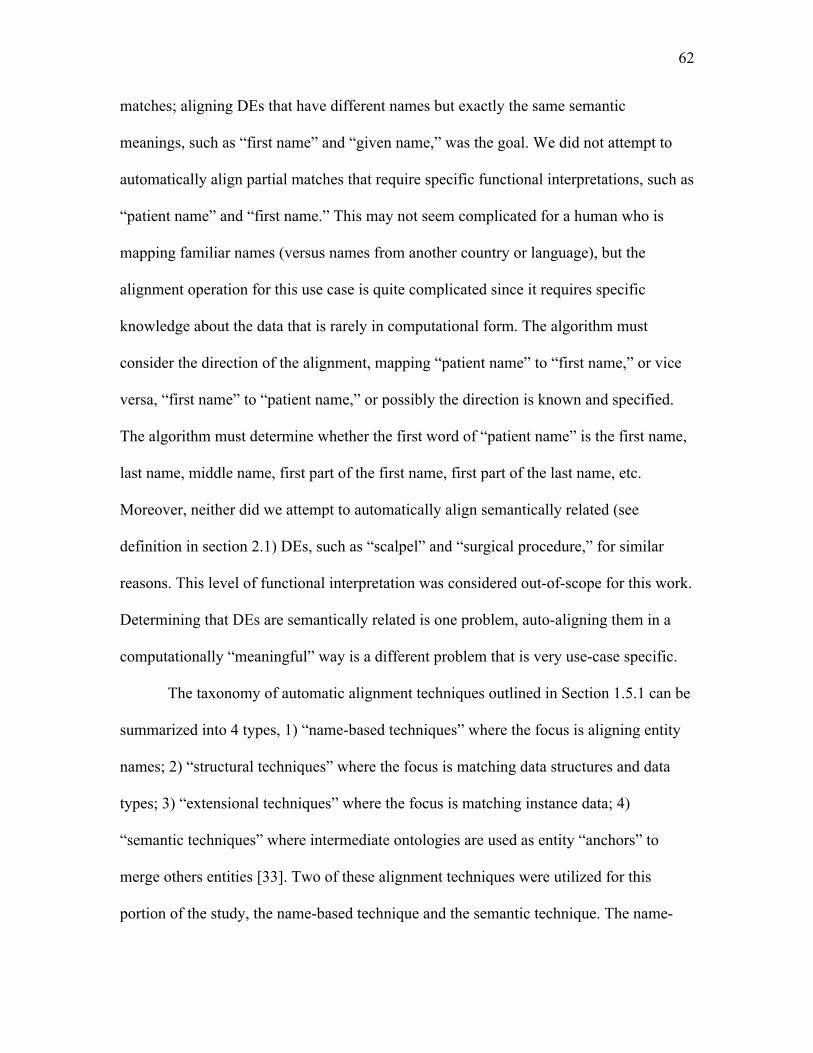
62
matches; aligning DEs that have different names but exactly the same semantic
meanings, such as “first name” and “given name,” was the goal. We did not attempt to
automatically align partial matches that require specific functional interpretations, such as
“patient name” and “first name.” This may not seem complicated for a human who is
mapping familiar names (versus names from another country or language), but the
alignment operation for this use case is quite complicated since it requires specific
knowledge about the data that is rarely in computational form. The algorithm must
consider the direction of the alignment, mapping “patient name” to “first name,” or vice
versa, “first name” to “patient name,” or possibly the direction is known and specified.
The algorithm must determine whether the first word of “patient name” is the first name,
last name, middle name, first part of the first name, first part of the last name, etc.
Moreover, neither did we attempt to automatically align semantically related (see
definition in section 2.1) DEs, such as “scalpel” and “surgical procedure,” for similar
reasons. This level of functional interpretation was considered out-of-scope for this work.
Determining that DEs are semantically related is one problem, auto-aligning them in a
computationally “meaningful” way is a different problem that is very use-case specific.
The taxonomy of automatic alignment techniques outlined in Section 1.5.1 can be
summarized into 4 types, 1) “name-based techniques” where the focus is aligning entity
names; 2) “structural techniques” where the focus is matching data structures and data
types; 3) “extensional techniques” where the focus is matching instance data; 4)
“semantic techniques” where intermediate ontologies are used as entity “anchors” to
merge others entities [33]. Two of these alignment techniques were utilized for this
portion of the study, the name-based technique and the semantic technique. The name-
63
based technique was the primary strategy used for each of the tested algorithms,
including the CB, but the CB also used the semantic technique by utilizing intermediate
ontology concept codes to anchor concepts based on existing semantic relationships. The
other two methods were not used. As is often the case, neither of the DE data sets
(described below) contained rich structural information; therefore, structural techniques
were left for future study. Extensional techniques did not apply either; they were simply
not an option since instance data (containing patient/subject data) were not available.
Additional preparation techniques were used to normalize the DE names before
they were compared. Exact string matches were counted and removed to avoid duplicate
comparisons. Also, strings were duplicated and converted to uppercase to support case-
insensitive comparisons, i.e., duplicate DEs and letter cases did not influence the results.
4.2.2 Aligning Data Elements with Similarity Algorithms
Recalling that similarity algorithms return a real value score between 0 and 1 that
indicates how similar two given DEs are (1 = perfect similarity, 0 = no similarity), to
make the alignment decision, a cutoff score must be selected. Cutoff scores determining
the alignment decisions are algorithm-specific. Each similarity algorithm’s score
distribution can be very different. One algorithm’s score of 0.5 might represent a very
high probability of equivalence, while it might represent a very low probability using a
different algorithm.
Cutoff scores were computed using decision analysis. Using a reference standard,
scores that maximized the specificity and sensitivity of the decision were chosen for each
algorithm. This strategy is called the “Youden” method [146].
64
4.2.3 Measuring Alignment Compliance
The alignment compliance measures how well alignment strategies agree. DE
alignments are essentially decisions, and alignment compliance is a form of decision
analysis. The reference alignment is a gold standard set of alignments typically curated
by experts and is intended to be compared with algorithm-generated alignments. The
decision analysis in this case was performed using standard confusion matrix statistics.
Confusion matrix decision analysis statistics were computed using R statistics
software with the “ROCR” [147] and “Optimal Cutpoints” [146] packages. The ROCR
package specializes in building Receiver Operator Curves (ROC) for viewing classifier
performance. The Optimal Cutpoints package computes optimum cutoff points and
reports confusion matrix statistics. Using these R packages, the following alignment
compliance results were reported: optimal cut-points, sensitivity, specificity, true positive
(TP), false positive (FP), false negative (FN), positive predictive value (PPV), negative
predictive value (NPV), area under the curve (AUC). The F-measure was also computed
using the recall (sensitivity) and precision (PPV) values for each algorithm.
4.2.4 Alignment Algorithms Tested
A total of five unsupervised string similarity algorithms were applied to the task
of aligning DEs, the CB, the HCB, and three well-known unsupervised string similarity
algorithms, Dice [95, 110] (see Section 2.2.1), Levenshtein [114] (see Section 2.2.3), and
Jaro-Winkler [117] (see Section 2.2.4). Each of these latter three algorithms has an
established string-matching track record matching biomedical concepts and DEs [94, 111,
148]. The CB and HCB method implementations are diagramed in Figure 4.1. These
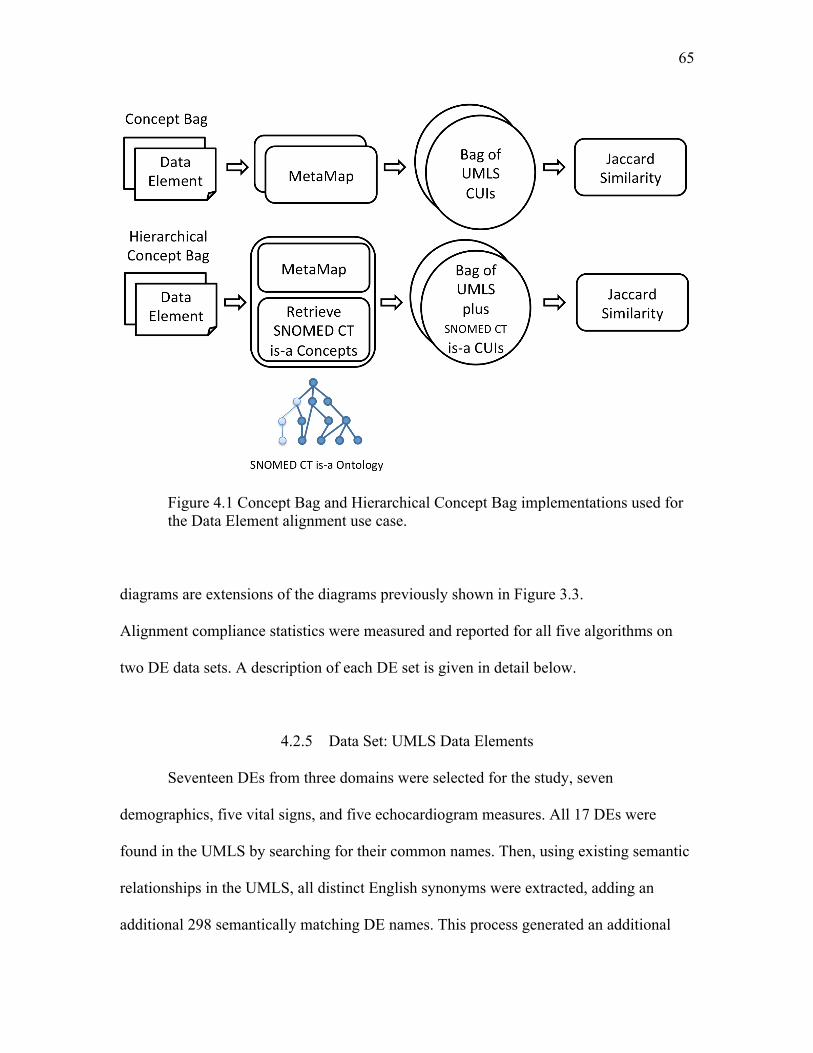
65
Figure 4.1 Concept Bag and Hierarchical Concept Bag implementations used for the Data Element alignment use case.
diagrams are extensions of the diagrams previously shown in Figure 3.3.
Alignment compliance statistics were measured and reported for all five algorithms on
two DE data sets. A description of each DE set is given in detail below.
4.2.5 Data Set: UMLS Data Elements
Seventeen DEs from three domains were selected for the study, seven
demographics, five vital signs, and five echocardiogram measures. All 17 DEs were
found in the UMLS by searching for their common names. Then, using existing semantic
relationships in the UMLS, all distinct English synonyms were extracted, adding an
additional 298 semantically matching DE names. This process generated an additional
66
298 DE names stemming from the original 17 totaling 315 distinct DEs by
name (298+17). The selected DEs and small sample of synonyms and abbreviations were
included in Table 4.1.
4.2.6 Reference Alignment: UMLS Data Elements
Reference alignments were identified using UMLS synonym relationships for all
of the DE names selected and identified in UMLS. UMLS synonym relationships were
curated by the original terminology contributors and by UMLS experts. For example, the
DE name “SBP” and “systolic blood pressure” were synonyms mapped by terminology
experts and were counted as an exact semantic match with an alignment score equal to 1.
DE names that were not synonyms within the UMLS were considered nonmatching and
were assigned alignment scores equal to 0. The reference alignment was a complete list
of all DE pairs with alignment scores of 0 or 1. There were a total of 49,455 pairs
(315*(314)/2) in the reference alignment.
4.2.7 Data Set: REDCap Data Elements
Aim two of the study is to improve upon previous methods that semantically align
heterogeneous biomedical data sets. To obtain a representative set of heterogeneous data
sets we utilized datasets created using REDCap [149]. REDCap, or Research Electronic
Data Capture, is software developed at Vanderbilt for managing research projects and
data capture. It is free and has become very popular, with over 1500 installations
worldwide at this point in time. REDCap uses the “Suggested Data Models” strategy and
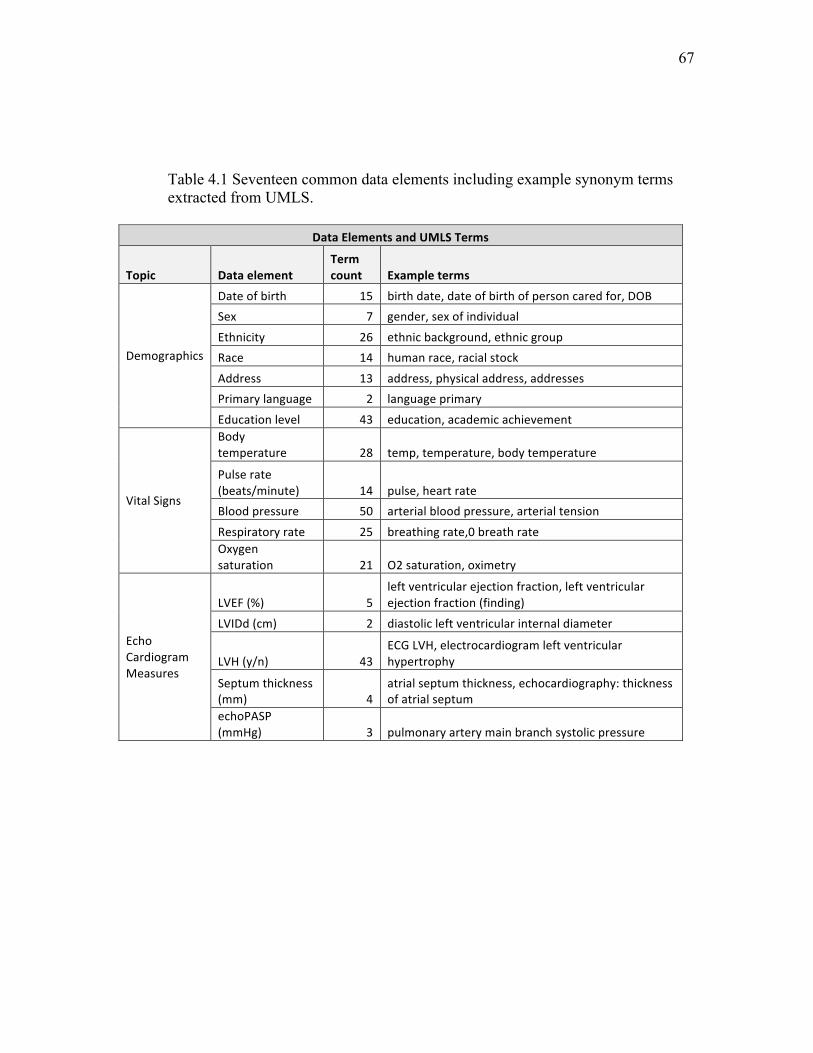
67
Table 4.1 Seventeen common data elements including example synonym terms extracted from UMLS.
DataElementsandUMLSTerms
Topic DataelementTermcount Exampleterms
Demographics
Dateofbirth 15 birthdate,dateofbirthofpersoncaredfor,DOBSex 7 gender,sexofindividual
Ethnicity 26 ethnicbackground,ethnicgroupRace 14 humanrace,racialstock
Address 13 address,physicaladdress,addressesPrimarylanguage 2 languageprimary
Educationlevel 43 education,academicachievement
VitalSigns
Bodytemperature 28 temp,temperature,bodytemperature
Pulserate(beats/minute) 14 pulse,heartrateBloodpressure 50 arterialbloodpressure,arterialtension
Respiratoryrate 25 breathingrate,0breathrateOxygensaturation 21 O2saturation,oximetry
EchoCardiogramMeasures
LVEF(%) 5leftventricularejectionfraction,leftventricularejectionfraction(finding)
LVIDd(cm) 2 diastolicleftventricularinternaldiameter
LVH(y/n) 43ECGLVH,electrocardiogramleftventricularhypertrophy
Septumthickness(mm) 4
atrialseptumthickness,echocardiography:thicknessofatrialseptum
echoPASP(mmHg) 3 pulmonaryarterymainbranchsystolicpressure
68
it was suspected that the data models suggested were rarely used. A pilot study confirmed
this suspicion. The REDCap installation at the University of Utah was analyzed, and less
than 1% of the projects used one or more of the recommended models, none of which had
been operationalized beyond a few records that appeared to be for testing.
Beyond recognizing the potential for heterogeneous data, the other reason we
chose REDCap was for its large and unpredictable domain of discourse. In the pilot study
we also discovered that the U had collected over 313 data sets and 39,129 DEs in 18
months of use. As this work originated as a data-mining exercise, the goal was to collect
as many data sets as possible from more than one site to discover potential relationships
and test the algorithm’s scalability [66]. A highly scalable and accurate DE alignment
algorithm would provide potentially useful enhancements for projects such as dbGap
[150] or other large collections of scientific data (http://www.nature.com/sdata/).
REDCap sites that were engaged in clinical and translational research were
contacted via email and asked to contribute DEs from their sites. No patient or subject-
sensitive data were required or requested, only the defining elements of their data sets,
the DEs. Five collaborating institutions responded to the email request and submitted
899,649 DEs, 1) University of Utah School of Medicine, 2) Einstein College of
Medicine, 3) Duke University, 4) University of Colorado Denver, 5) Children’s National
Medical Center.
REDCap data sets followed a key-value-pair data pattern, where keys were
synonymous with column names and values were synonymous with data cells in a table
row. REDCap’s alphanumeric column keys (somewhat cryptic) were linked to additional
DE metadata, including informal data types and display-formatting information. In
69
particular, the “element label” was an attribute used to label columns and field names on
data-entry forms and reports. For example, “q1_rbc” was the alphanumeric key name for
an element labeled “Red blood cell count.” Element labels contained human readable
language with complete words and expressions and were chosen to represent DE names
from REDCap.
All DE properties were hand-authored for each REDCap project. Specific user
identifiers were not collected for the study, but it is important to recognize this set
represents the number of researchers that it took to author 899,649 DEs; it must have at
least been in the order of a few thousand individuals.
4.2.7.1 Preprocessing REDCap Data Elements
The contributed DEs were loaded into a relational database for the initial analysis.
A total of 899,649 unique DEs were contributed from the five sites. Letter cases were
removed for case insensitive comparisons, but all other textual features were left in their
original form. DEs were then processed using MetaMap and the extracted concepts were
stored and associated to each DE.
4.2.7.2 Aligning Data Elements via the Concept Bag
Concept bags were compared for similarity using the Jaccard Similarity formula.
This process required n(n-1)/2 comparisons, or approximately half a trillion comparisons.
The University of Utah’s Center for High Performance Computing was required to
complete this large number of comparisons. A special parallel matching [151] Java
program was designed to work with the Message Passing Interface (MPI) [152] to
70
compute a virtual matrix of all comparisons. Essentially the MPI was configured to pass
instructions to a job (Java programs), indicating to each a specific portion of the matrix to
compute. While each job computed its specific portion of the matrix, it would write the
similarity scores and matrix coordinates to a file. At the end of the process all files were
aggregated using Linux utilities for analysis. One of the benefits of this strategy is that
more jobs and CPUs can be added to reduce computing time. It is also highly scalable
due to the fact that similarity computations can be dynamically subdivided and executed
in parallel tasks based on the available computing resources.
4.2.7.3 Reference Alignment: REDCap Data Elements
Preliminary exploration of the computed comparison data indicated that match
candidates were infrequent, 3 per 1000 pairs, indicating an unreasonably large random
sample would have been required for human review while maintaining both an accurate
sample distribution and conclusive confidence interval; therefore, a stratified random
sample was assembled with 12 buckets based on the computed Concept Bag Similarity
scores, 10 buckets distributed between 0 and 1 (0 < score <= 0.10, 0.10 < score <= 0.20,
… , 0.90 < score < 1.0), plus one bucket where the scores equaled 0, and another bucket
where scores equaled 1. A set of 1200 DE pairs were then randomly sorted and manually
reviewed for semantic matches by a professional clinical data architect. The alignments
identified by the architect were used as the reference alignment.
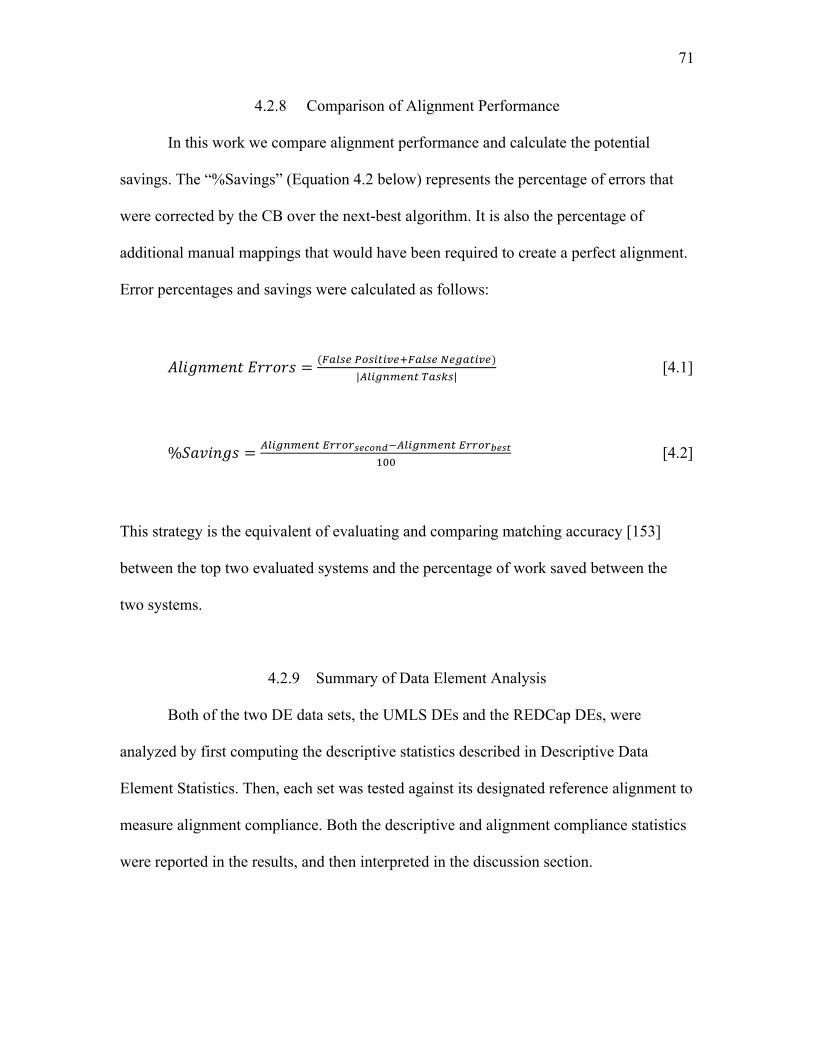
71
4.2.8 Comparison of Alignment Performance
In this work we compare alignment performance and calculate the potential
savings. The “%Savings” (Equation 4.2 below) represents the percentage of errors that
were corrected by the CB over the next-best algorithm. It is also the percentage of
additional manual mappings that would have been required to create a perfect alignment.
Error percentages and savings were calculated as follows:
𝐴𝑙𝑖𝑔𝑛𝑚𝑒𝑛𝑡 𝐸𝑟𝑟𝑜𝑟𝑠 = (!"#$% !"#$%$&'!!"#$% !"#$%&'")|!"#$%&'%( !"#$#|
[4.1]
%𝑆𝑎𝑣𝑖𝑛𝑔𝑠 = !"#$%&'%( !""#"!"#$%&!!"#$%&'%( !""#"!"#$!""
[4.2]
This strategy is the equivalent of evaluating and comparing matching accuracy [153]
between the top two evaluated systems and the percentage of work saved between the
two systems.
4.2.9 Summary of Data Element Analysis
Both of the two DE data sets, the UMLS DEs and the REDCap DEs, were
analyzed by first computing the descriptive statistics described in Descriptive Data
Element Statistics. Then, each set was tested against its designated reference alignment to
measure alignment compliance. Both the descriptive and alignment compliance statistics
were reported in the results, and then interpreted in the discussion section.
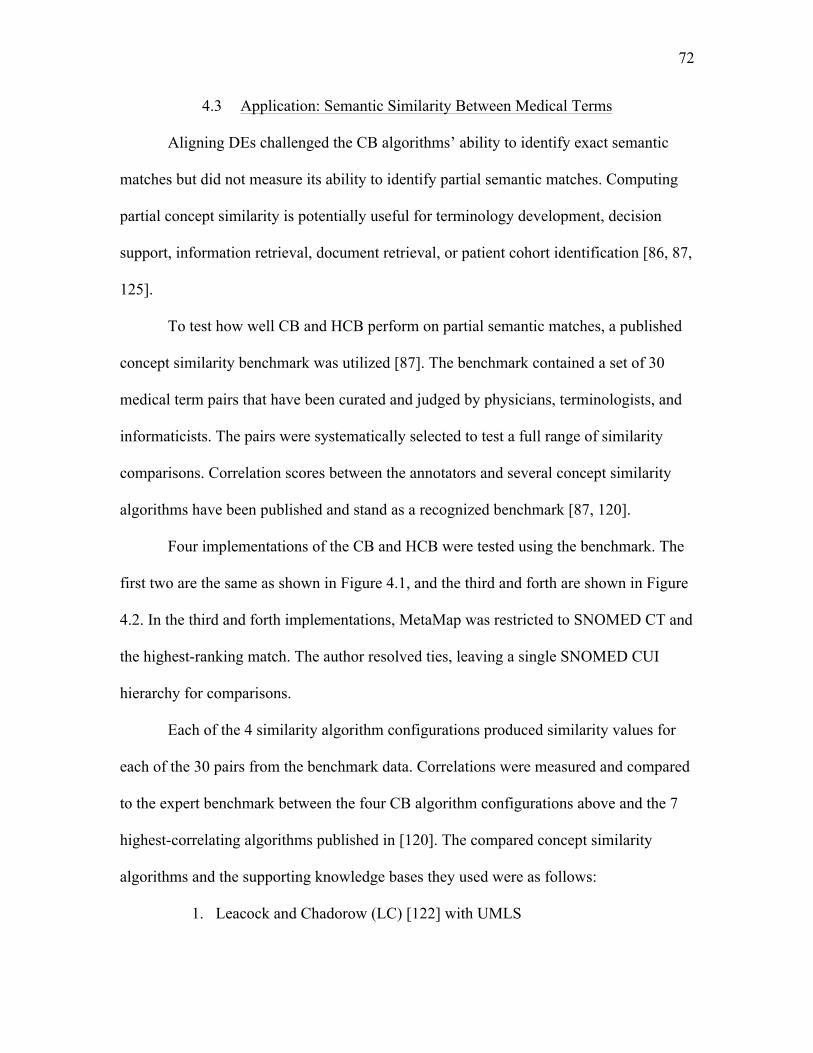
72
4.3 Application: Semantic Similarity Between Medical Terms
Aligning DEs challenged the CB algorithms’ ability to identify exact semantic
matches but did not measure its ability to identify partial semantic matches. Computing
partial concept similarity is potentially useful for terminology development, decision
support, information retrieval, document retrieval, or patient cohort identification [86, 87,
125].
To test how well CB and HCB perform on partial semantic matches, a published
concept similarity benchmark was utilized [87]. The benchmark contained a set of 30
medical term pairs that have been curated and judged by physicians, terminologists, and
informaticists. The pairs were systematically selected to test a full range of similarity
comparisons. Correlation scores between the annotators and several concept similarity
algorithms have been published and stand as a recognized benchmark [87, 120].
Four implementations of the CB and HCB were tested using the benchmark. The
first two are the same as shown in Figure 4.1, and the third and forth are shown in Figure
4.2. In the third and forth implementations, MetaMap was restricted to SNOMED CT and
the highest-ranking match. The author resolved ties, leaving a single SNOMED CUI
hierarchy for comparisons.
Each of the 4 similarity algorithm configurations produced similarity values for
each of the 30 pairs from the benchmark data. Correlations were measured and compared
to the expert benchmark between the four CB algorithm configurations above and the 7
highest-correlating algorithms published in [120]. The compared concept similarity
algorithms and the supporting knowledge bases they used were as follows:
1. Leacock and Chadorow (LC) [122] with UMLS
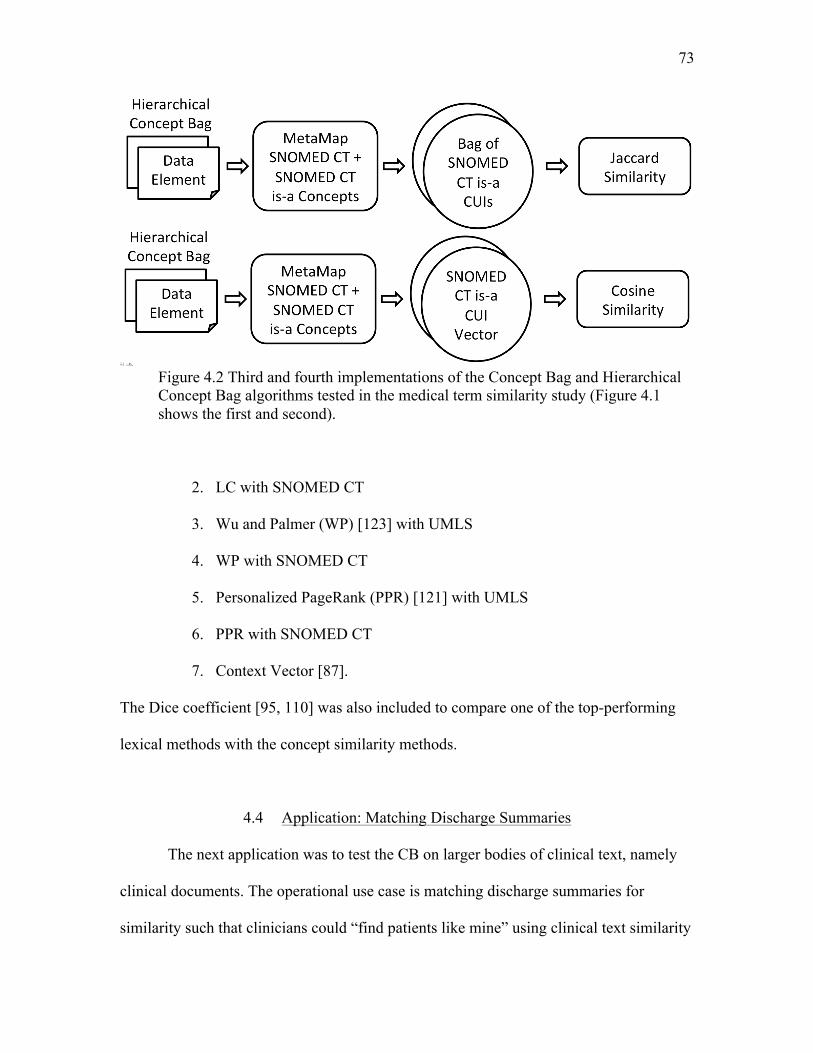
73
Figure 4.2 Third and fourth implementations of the Concept Bag and Hierarchical Concept Bag algorithms tested in the medical term similarity study (Figure 4.1 shows the first and second).
2. LC with SNOMED CT
3. Wu and Palmer (WP) [123] with UMLS
4. WP with SNOMED CT
5. Personalized PageRank (PPR) [121] with UMLS
6. PPR with SNOMED CT
7. Context Vector [87].
The Dice coefficient [95, 110] was also included to compare one of the top-performing
lexical methods with the concept similarity methods.
4.4 Application: Matching Discharge Summaries
The next application was to test the CB on larger bodies of clinical text, namely
clinical documents. The operational use case is matching discharge summaries for
similarity such that clinicians could “find patients like mine” using clinical text similarity
74
as a proxy for patient similarity. For this purpose we used an online resource, the
MIMIC-II online database [154] tools and services, and it offered deidentified intensive
care unit (ICU) discharge summaries from 2001 to 2007. Access was requested via an
online request process. The requirements were straightforward; standard research training
and affiliations were required but IRB approval from the University of Utah was not
necessary. The MIMIC-II IRB was as follows [155]:
This study was approved by the Institutional Review Boards of Beth Israel Deaconess Medical Center (Boston, MA) and the Massachusetts Institute of Technology (Cambridge, MA). Requirement for individual patient consent was waived as the study did not impact clinical care and all data were deidentified.
Our request for access to the data was granted within 2 days. A light amount of reading
was necessary to learn how to use the provided online query tools, but this process was
straightforward and the resource proved to be valuable for research.
One thousand randomly selected electronic text-based ICU Discharge Summaries
(DS) were downloaded from the MIMIC-II database. DSs were deidentified within the
MIMIC-II database but were otherwise fully intact. Patient and provider data had been
removed and dates were randomly offset by the same random offset keeping time
intervals between events accurate; patient ages and other time range lengths were
computable when they were not explicitly stated.
4.4.1 Discharge Summary Benchmark
One hundred random pairs were assembled from the 1000 DSs that were
downloaded. Two biomedical terminologists manually reviewed each pair. They were
given specific instructions on how to login to the secure web site and how to judge each
pair of DSs for similarity. For the review, they were instructed to “...[rank the document
75
similarity] to indicate to other clinicians there are common features between these ICU
visits that are worth/not worth observing for the sake of case comparisons.” Reviewers
were given choices from a 5-point Likert scale to mark how similar the DSs were (see
Figure 4.1). Reviewers were also given the chance to add comments when they could not
decide. Comments and answers were stored in the relational database for reference.
4.4.2 Discharge Summary Similarity Comparator Algorithms
The CB and HCB algorithms were compared with terminologists, Dice [110], and
TF-IDF [156]. Dice is a specific form the n-gram method (see section 2.2.1), is a form of
Shingling (see section 2.4.1), and performs well comparing DEs [111]. TF-IDF performs
well matching “documents.” Evaluating and comparing the performance of each
algorithm on the much larger DSs provides additional evidence about where the textual
boundaries are for each algorithm. The CB and HCB implementations used were the
same two that were used in both of the previous studies, 1) MetaMap with Jaccard
Similarity, and 2) MetaMap with hierarchical SNOMED CT CUIs and Jaccard Similarity.
They are diagramed in Figure 4.3.
4.4.3 Algorithm Correlation Analysis
Similarity measures were computed between the 100 randomly selected DS pairs
using the CB, HCB, and comparator algorithms. Two terminologists reviewed the same
100 DS pairs to provide human-expert comparisons. Correlations between all similarity
measurements were then calculated between each algorithm and expert. The R statistics
software was used to measure correlation via the Spearman method.
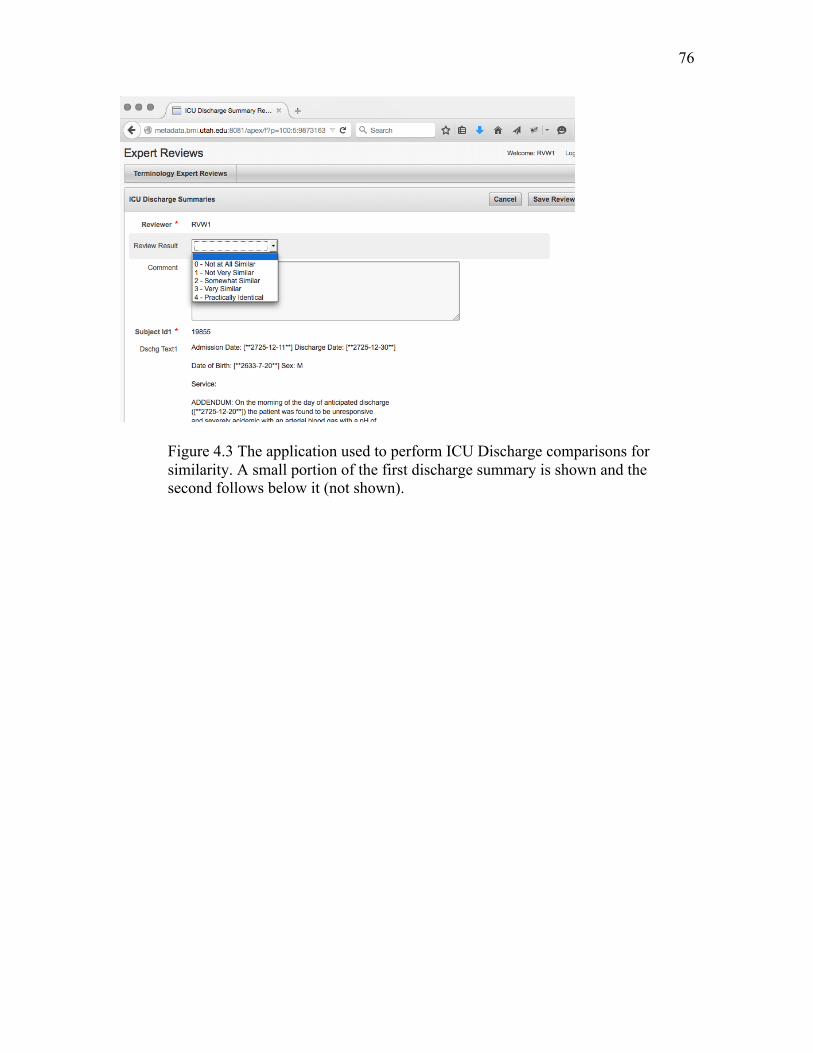
76
Figure 4.3 The application used to perform ICU Discharge comparisons for similarity. A small portion of the first discharge summary is shown and the second follows below it (not shown).
CHAPTER 5
RESULTS
The results of the use cases discussed in Chapter 4 are presented in this chapter.
The previous chapter, Chapter 4, served as the methods chapter and, in general, is where
the reasoning for the chosen methodologies was documented. Also, within this chapter
specific sections are referenced to help the reader find the supportive text. In other cases,
we restate assumptions and specific values. We also included elements of the results-
specific discussion into this chapter for the same reason. The general discussion, future
directions, and conclusions are contained in Chapter 6.
5.1 Descriptive Statistics for Studied Data Sets
This section contains the descriptive statistics for the four studied data sets, 1) the
UMLS data elements (DE) used for the DE alignment study, 2) the REDCap DEs used
for the alignment study, 3) the medical term similarity benchmark used to test degrees of
semantic similarity, and 4) the intensive care unit (ICU) discharge summaries used to
measure patient case similarity.
The descriptive statistics show that each of these data sets had different textual
features such as characters per element, words per element, and controlled vocabulary
coverage. These measurements are useful for comparing corpora and for identifying the
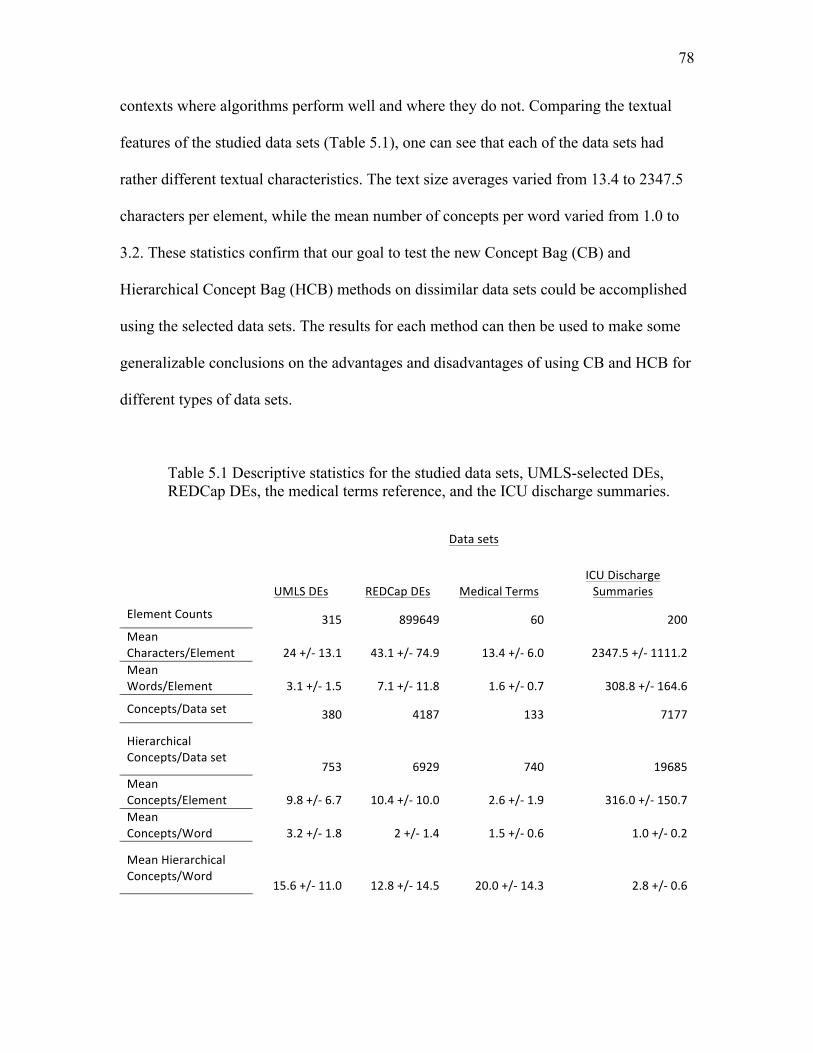
78
contexts where algorithms perform well and where they do not. Comparing the textual
features of the studied data sets (Table 5.1), one can see that each of the data sets had
rather different textual characteristics. The text size averages varied from 13.4 to 2347.5
characters per element, while the mean number of concepts per word varied from 1.0 to
3.2. These statistics confirm that our goal to test the new Concept Bag (CB) and
Hierarchical Concept Bag (HCB) methods on dissimilar data sets could be accomplished
using the selected data sets. The results for each method can then be used to make some
generalizable conclusions on the advantages and disadvantages of using CB and HCB for
different types of data sets.
Table 5.1 Descriptive statistics for the studied data sets, UMLS-selected DEs, REDCap DEs, the medical terms reference, and the ICU discharge summaries.
Datasets
UMLSDEs REDCapDEs MedicalTermsICUDischargeSummaries
ElementCounts 315 899649 60 200MeanCharacters/Element 24+/-13.1 43.1+/-74.9 13.4+/-6.0 2347.5+/-1111.2MeanWords/Element 3.1+/-1.5 7.1+/-11.8 1.6+/-0.7 308.8+/-164.6
Concepts/Dataset 380 4187 133 7177
HierarchicalConcepts/Dataset
753 6929 740 19685MeanConcepts/Element 9.8+/-6.7 10.4+/-10.0 2.6+/-1.9 316.0+/-150.7MeanConcepts/Word 3.2+/-1.8 2+/-1.4 1.5+/-0.6 1.0+/-0.2
MeanHierarchicalConcepts/Word
15.6+/-11.0 12.8+/-14.5 20.0+/-14.3 2.8+/-0.6
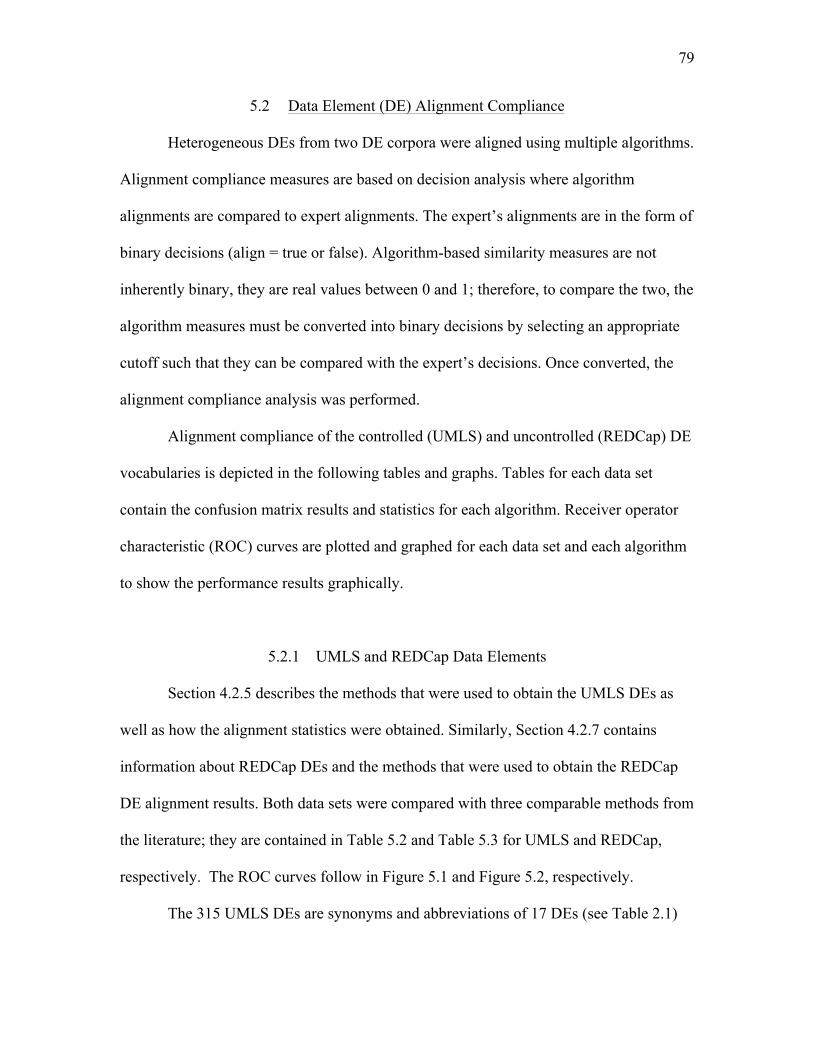
79
5.2 Data Element (DE) Alignment Compliance
Heterogeneous DEs from two DE corpora were aligned using multiple algorithms.
Alignment compliance measures are based on decision analysis where algorithm
alignments are compared to expert alignments. The expert’s alignments are in the form of
binary decisions (align = true or false). Algorithm-based similarity measures are not
inherently binary, they are real values between 0 and 1; therefore, to compare the two, the
algorithm measures must be converted into binary decisions by selecting an appropriate
cutoff such that they can be compared with the expert’s decisions. Once converted, the
alignment compliance analysis was performed.
Alignment compliance of the controlled (UMLS) and uncontrolled (REDCap) DE
vocabularies is depicted in the following tables and graphs. Tables for each data set
contain the confusion matrix results and statistics for each algorithm. Receiver operator
characteristic (ROC) curves are plotted and graphed for each data set and each algorithm
to show the performance results graphically.
5.2.1 UMLS and REDCap Data Elements
Section 4.2.5 describes the methods that were used to obtain the UMLS DEs as
well as how the alignment statistics were obtained. Similarly, Section 4.2.7 contains
information about REDCap DEs and the methods that were used to obtain the REDCap
DE alignment results. Both data sets were compared with three comparable methods from
the literature; they are contained in Table 5.2 and Table 5.3 for UMLS and REDCap,
respectively. The ROC curves follow in Figure 5.1 and Figure 5.2, respectively.
The 315 UMLS DEs are synonyms and abbreviations of 17 DEs (see Table 2.1)
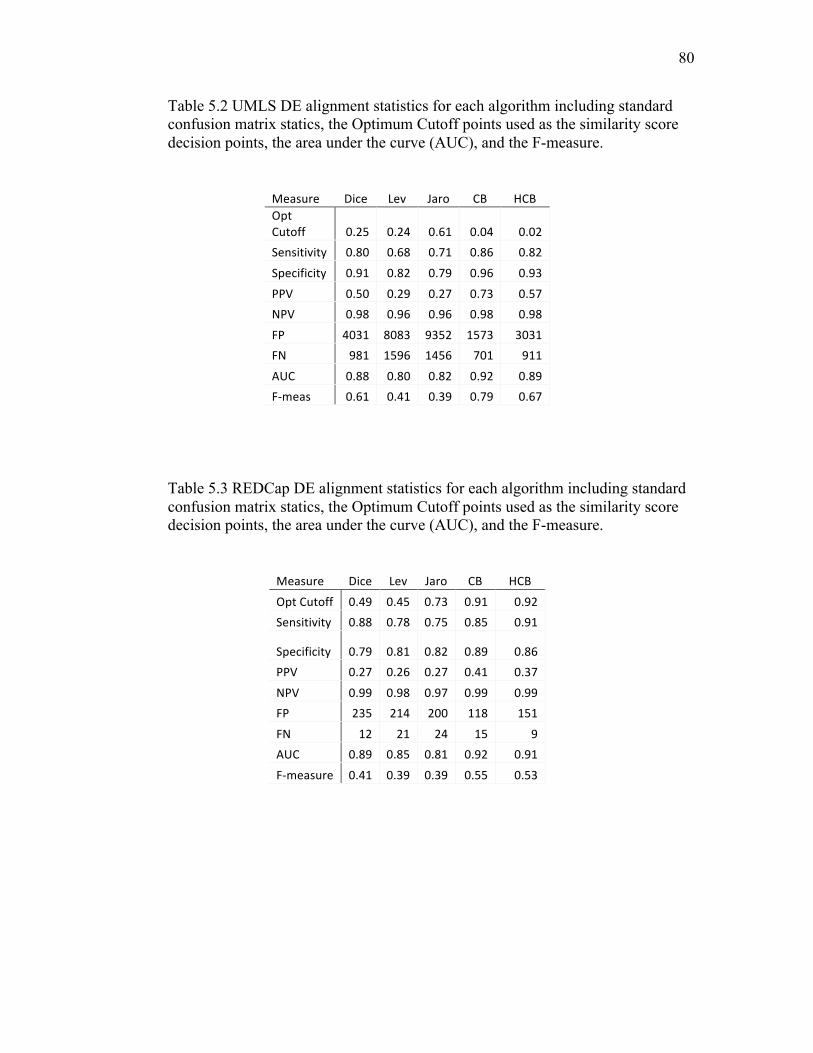
80
Table 5.2 UMLS DE alignment statistics for each algorithm including standard confusion matrix statics, the Optimum Cutoff points used as the similarity score decision points, the area under the curve (AUC), and the F-measure.
Measure Dice Lev Jaro CB HCBOptCutoff 0.25 0.24 0.61 0.04 0.02Sensitivity 0.80 0.68 0.71 0.86 0.82
Specificity 0.91 0.82 0.79 0.96 0.93
PPV 0.50 0.29 0.27 0.73 0.57NPV 0.98 0.96 0.96 0.98 0.98
FP 4031 8083 9352 1573 3031FN 981 1596 1456 701 911
AUC 0.88 0.80 0.82 0.92 0.89F-meas 0.61 0.41 0.39 0.79 0.67
Table 5.3 REDCap DE alignment statistics for each algorithm including standard confusion matrix statics, the Optimum Cutoff points used as the similarity score decision points, the area under the curve (AUC), and the F-measure.
Measure Dice Lev Jaro CB HCB
OptCutoff 0.49 0.45 0.73 0.91 0.92Sensitivity 0.88 0.78 0.75 0.85 0.91
Specificity 0.79 0.81 0.82 0.89 0.86PPV 0.27 0.26 0.27 0.41 0.37
NPV 0.99 0.98 0.97 0.99 0.99FP 235 214 200 118 151
FN 12 21 24 15 9AUC 0.89 0.85 0.81 0.92 0.91
F-measure 0.41 0.39 0.39 0.55 0.53

81
Figure 5.1 ROC curve of the UMLS DE alignment algorithm performance. Curves closest to the top left corner are the best performers.
and the intention of this data set was to test and tune the CB and HCB algorithms. The
reference alignment was simple to create using the UMLS relationships to determine
semantic alignments. The chances of success were higher than they would likely be for
data sets collected in the wild, but it was a great way to test and observe the algorithms.
The optimal cutoff score range is 0 <= cutoff score <= 1 (same as the similarity
measurement range), and indicates what the semantic similarity score needs to be to
decide to align or not align the tested DE pair. The CB and HCB have very low cutoffs
for the UMLS set (Table 5.2) and this indicates that even a slight similarity score is
sufficient to confidently decide to make the alignment decision.
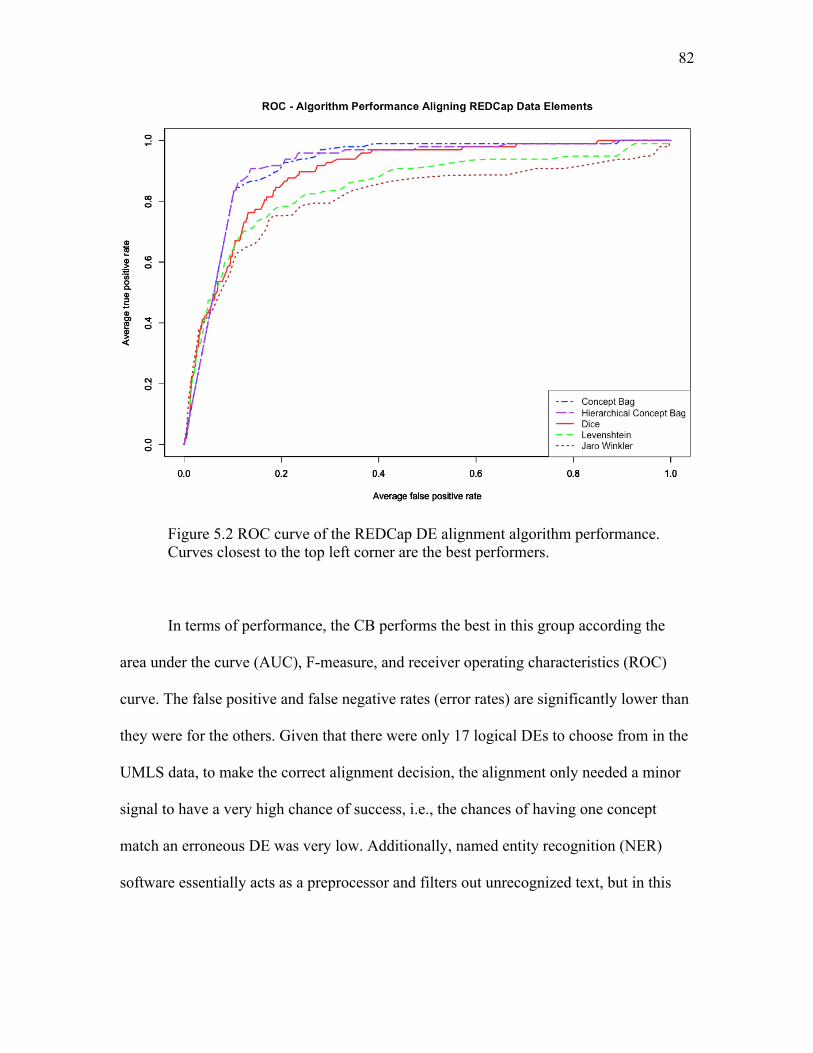
82
Figure 5.2 ROC curve of the REDCap DE alignment algorithm performance. Curves closest to the top left corner are the best performers.
In terms of performance, the CB performs the best in this group according the
area under the curve (AUC), F-measure, and receiver operating characteristics (ROC)
curve. The false positive and false negative rates (error rates) are significantly lower than
they were for the others. Given that there were only 17 logical DEs to choose from in the
UMLS data, to make the correct alignment decision, the alignment only needed a minor
signal to have a very high chance of success, i.e., the chances of having one concept
match an erroneous DE was very low. Additionally, named entity recognition (NER)
software essentially acts as a preprocessor and filters out unrecognized text, but in this
83
case there should not be any unrecognized text. All of the DEs were taken from the same
controlled vocabulary.
The HCB alignment performance was also respectable at aligning UMLS DEs but
produced twice the false positives of the CB. Adding hierarchical concepts essentially
added partial matches to the CBs (versus only equivalent matches), making the bags more
sensitive but less specific. Despite this, the HCB still outperformed all the other methods
considered here.
As we compare the REDCap alignment performance statistics (Table 5.3), notice
the difference in the cutoff scores. The CB cutoff increased from 0.04 for the UMLS DEs
to 0.91 for REDCap for the same reason that there was a lower alignment error rate; in
the UMLS data, the chance of having one concept match an erroneous DE was much
lower. In the REDCap data set the opposite was true: there were 1,199 other DEs to
choose from in the REDCap reference alignment, versus 17 in the UMLS set, indicating
that a much stronger similarity measurement signal was required to predict a semantically
equivalent alignment.
In terms of performance, the CB performed very well at the task of aligning
REDCap DEs, as indicated by the AUC of 0.92, F-measure of 0.55, and ROC curve in
Figure 5.2. These performance numbers are slightly lower than the UMLS DE alignment
performance numbers, but this is certainly expected due to the more complex nature of
the REDCap DEs. REDCap DEs were created without a controlled vocabulary or a
formal curating process, allowing arbitrary abbreviations and local jargon. Even with the
added complexities of REDCap DEs, the CB still had much lower combined false
positive and false negative rates than the other algorithms did.
84
The HCB alignment performance was also good with an AUC = 0.91 and F-
measure = 0.53 for REDCap DEs, and AUC = 0.89 and F-measure = 0.67 for UMLS
DEs. The increased error rate (more false positives and negatives) is consistent with what
happened with the UMLS data, adding hierarchical concepts to CBs added partially
matching concepts to the CB and made the algorithm more specific but less sensitive.
Had the goal been to identify degrees of semantic similarity where correctly identifying
partial matches was considered a success, the HCB would have likely performed better.
The stated goal and criterion for performing auto-alignments was to identify exact
semantic matches, and therefore, adding partially similar concepts added error.
The DE alignment results show that CB reduces errors and improves DE
alignment accuracy on the two data sets studied, and the highly dissimilar characteristics
of these data sets infer that this finding is generalizable. The results also indicate that CB
is adequate for automatic discovery systems where the goal is to search large volumes of
heterogeneous data to discover semantically equivalent DEs. For example, the use case
“find echocardiogram data mine” would require an analyst to input echocardiogram DEs;
from there the algorithm performs the similarity measures and identifies the semantically
equivalent DEs that were discovered. On the other hand, if the application were used to
automatically discover and align patient records for patient care without further manual
review, none of the studied algorithms were adequate and the improvements reported for
CB would not accomplish the levels of performance that may be required in such use
cases.
The CB is definitely appropriate for semiautomatic alignment. The improved
performance reduces the amount of matching corrections an expert must fix. For instance,
85
the total number of UMLS DE mapping tasks is 49,455, and using the top-performing
algorithm, CB, only 2,274 corrections (4.60% error) would have been required. Using the
next-best algorithm, Dice, 5,012 corrections (10.13% error) would have been required.
And similar results are derived when using the CB algorithm to align DEs from REDCap.
The DE alignment results show that the CB and HCB are competitive options to other
methods in the same class. The CB was better at identifying exact semantic matches and
decreased the error rate by 5.54% on the UMLS set and by 5.18% on the REDCap set.
5.2.2 Error Analysis
Additional analysis was performed to compare the nature of the CB, HCB, and
Dice errors. Table 5.4 contains a list of examples. The examples that show the false
positives from the CB (1,2,3 in Table 5.4) are caused by underinterpretation, when the
NER software did not recognize some or several of the textual expressions and therefore
did not output concept codes for those expressions; unrecognized expressions and codes
that may modify the meaning are not included in the bags.
False negatives were often due to overinterpretation, when the NER could not
disambiguate text and would output multiple codes for a single concept, negatively
impacting the similarity ratio. In the CB (4,5,6 in Table 5.4) the false negatives are
largely boundary cases where the strict cutoff score (0.91) filtered out otherwise high
scores. The method of choosing the cutoff score was to optimize performance, but was
intolerant of near misses. Consequently, concept bags had to contain either a perfect
match or a ratio equivalent to 11 out of 12 equal concept codes for the alignment to be
made automatically.
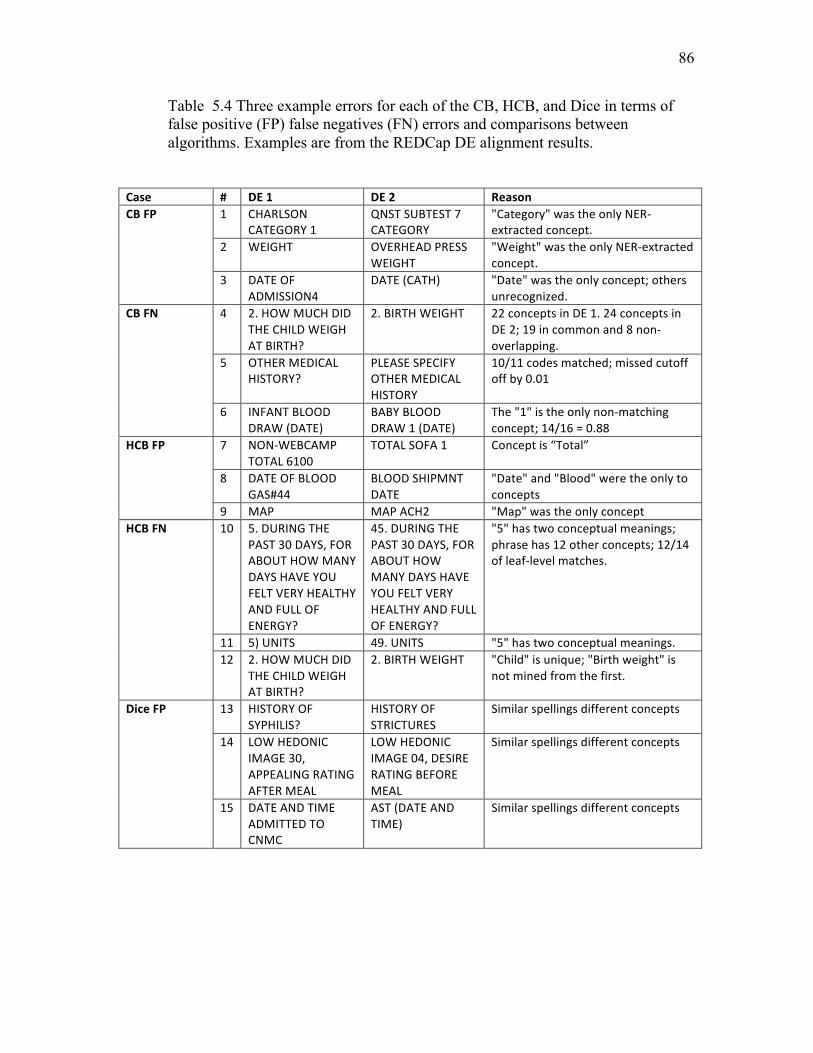
86
Table 5.4 Three example errors for each of the CB, HCB, and Dice in terms of false positive (FP) false negatives (FN) errors and comparisons between algorithms. Examples are from the REDCap DE alignment results.
Case # DE1 DE2 ReasonCBFP 1 CHARLSON
CATEGORY1QNSTSUBTEST7CATEGORY
"Category"wastheonlyNER-extractedconcept.
2 WEIGHT OVERHEADPRESSWEIGHT
"Weight"wastheonlyNER-extractedconcept.
3 DATEOFADMISSION4
DATE(CATH) "Date"wastheonlyconcept;othersunrecognized.
CBFN 4 2.HOWMUCHDIDTHECHILDWEIGHATBIRTH?
2.BIRTHWEIGHT 22conceptsinDE1.24conceptsinDE2;19incommonand8non-overlapping.
5 OTHERMEDICALHISTORY?
PLEASESPECIFYOTHERMEDICALHISTORY
10/11codesmatched;missedcutoffoffby0.01
6 INFANTBLOODDRAW(DATE)
BABYBLOODDRAW1(DATE)
The"1"istheonlynon-matchingconcept;14/16=0.88
HCBFP 7 NON-WEBCAMPTOTAL6100
TOTALSOFA1 Conceptis“Total”
8 DATEOFBLOODGAS#44
BLOODSHIPMNTDATE
"Date"and"Blood"weretheonlytoconcepts
9 MAP MAPACH2 "Map"wastheonlyconceptHCBFN 10 5.DURINGTHE
PAST30DAYS,FORABOUTHOWMANYDAYSHAVEYOUFELTVERYHEALTHYANDFULLOFENERGY?
45.DURINGTHEPAST30DAYS,FORABOUTHOWMANYDAYSHAVEYOUFELTVERYHEALTHYANDFULLOFENERGY?
"5"hastwoconceptualmeanings;phrasehas12otherconcepts;12/14ofleaf-levelmatches.
11 5)UNITS 49.UNITS "5"hastwoconceptualmeanings.12 2.HOWMUCHDID
THECHILDWEIGHATBIRTH?
2.BIRTHWEIGHT "Child"isunique;"Birthweight"isnotminedfromthefirst.
DiceFP 13 HISTORYOFSYPHILIS?
HISTORYOFSTRICTURES
Similarspellingsdifferentconcepts
14 LOWHEDONICIMAGE30,APPEALINGRATINGAFTERMEAL
LOWHEDONICIMAGE04,DESIRERATINGBEFOREMEAL
Similarspellingsdifferentconcepts
15 DATEANDTIMEADMITTEDTOCNMC
AST(DATEANDTIME)
Similarspellingsdifferentconcepts
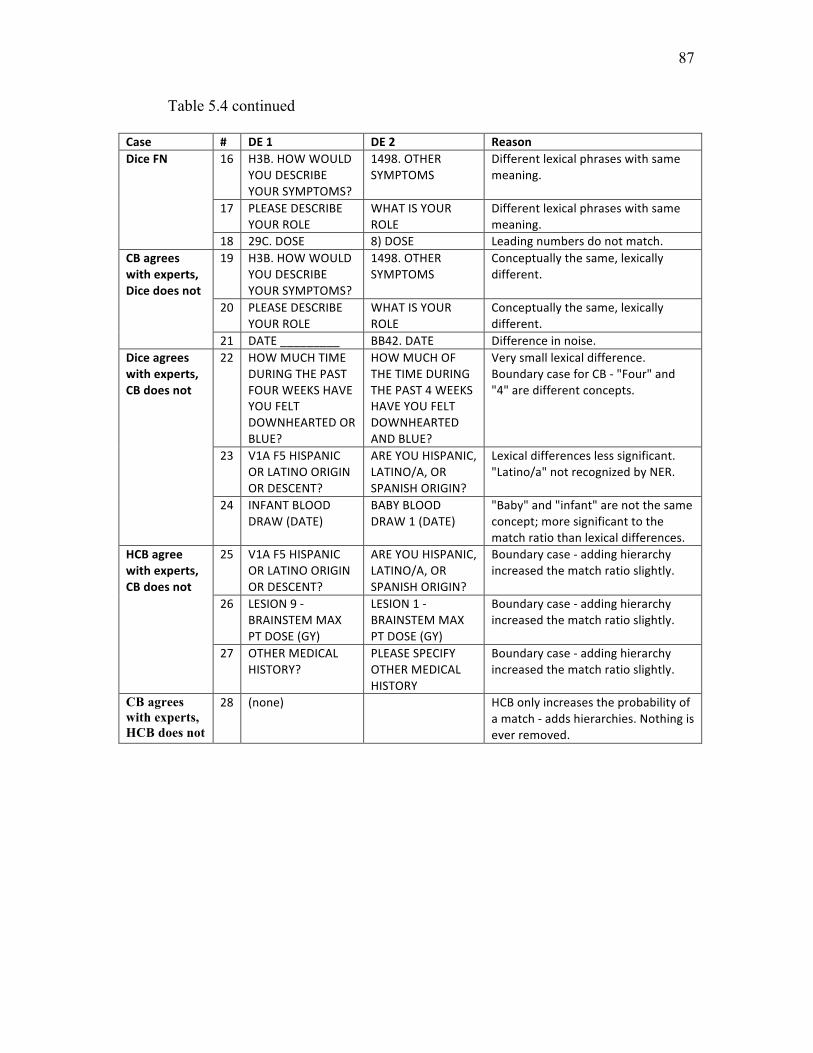
87
Table 5.4 continued
Case # DE1 DE2 ReasonDiceFN 16 H3B.HOWWOULD
YOUDESCRIBEYOURSYMPTOMS?
1498.OTHERSYMPTOMS
Differentlexicalphraseswithsamemeaning.
17 PLEASEDESCRIBEYOURROLE
WHATISYOURROLE
Differentlexicalphraseswithsamemeaning.
18 29C.DOSE 8)DOSE Leadingnumbersdonotmatch.CBagreeswithexperts,Dicedoesnot
19 H3B.HOWWOULDYOUDESCRIBEYOURSYMPTOMS?
1498.OTHERSYMPTOMS
Conceptuallythesame,lexicallydifferent.
20 PLEASEDESCRIBEYOURROLE
WHATISYOURROLE
Conceptuallythesame,lexicallydifferent.
21 DATE_________ BB42.DATE Differenceinnoise.Diceagreeswithexperts,CBdoesnot
22 HOWMUCHTIMEDURINGTHEPASTFOURWEEKSHAVEYOUFELTDOWNHEARTEDORBLUE?
HOWMUCHOFTHETIMEDURINGTHEPAST4WEEKSHAVEYOUFELTDOWNHEARTEDANDBLUE?
Verysmalllexicaldifference.BoundarycaseforCB-"Four"and"4"aredifferentconcepts.
23 V1AF5HISPANICORLATINOORIGINORDESCENT?
AREYOUHISPANIC,LATINO/A,ORSPANISHORIGIN?
Lexicaldifferenceslesssignificant."Latino/a"notrecognizedbyNER.
24 INFANTBLOODDRAW(DATE)
BABYBLOODDRAW1(DATE)
"Baby"and"infant"arenotthesameconcept;moresignificanttothematchratiothanlexicaldifferences.
HCBagreewithexperts,CBdoesnot
25 V1AF5HISPANICORLATINOORIGINORDESCENT?
AREYOUHISPANIC,LATINO/A,ORSPANISHORIGIN?
Boundarycase-addinghierarchyincreasedthematchratioslightly.
26 LESION9-BRAINSTEMMAXPTDOSE(GY)
LESION1-BRAINSTEMMAXPTDOSE(GY)
Boundarycase-addinghierarchyincreasedthematchratioslightly.
27 OTHERMEDICALHISTORY?
PLEASESPECIFYOTHERMEDICALHISTORY
Boundarycase-addinghierarchyincreasedthematchratioslightly.
CB agrees with experts, HCB does not
28 (none) HCBonlyincreasestheprobabilityofamatch-addshierarchies.Nothingiseverremoved.
88
Similar to the CB, the false positive examples from the HCB (7,8,9 in Table 5.4)
were also caused by underinterpretation, when the NER software did not recognize
textual expressions. The false negatives of the HCB (10,11,12 in Table 5.4) were also
boundary cases where the strict cutoff score (0.92) again filtered out close matches.
Adding hierarchical codes to the bags increased the weight of a match since many codes
in the hierarchy would match as a result of a single leaf concept code match. This was the
reason that HCB would sometimes succeed when the CB would not (see examples
25,26,27 in Table 5.4); in boundary cases the larger number of matched concept codes
would push the ratio value over the cutoff boundary.
The lexical methods, such as Dice, produce false positives on phrases that are
spelled similarly but are not exactly the same semantically (see examples 13,14,15 in
Table 5.4). Lexical methods produce false negatives when lexical representations are
different but are semantically similar, or when there is excessive noise or misspellings.
Dice outperformed CB and HCB in several cases where small lexical differences (see 22,
23, 24 in Table 5.4) were subject to multiple semantic interpretations. Numbers, for
example, may be added for display ordering or they may have a significant meaning. The
number “4” may indicate that it is the fourth question or may be part of a question related
to, “4 times a day.” The NER software may not recognize the difference and erroneously
overinterprets and outputs concept codes that do not represent the true meaning in the
context of use.
In summary, CB and HCB errors were cased by overinterpretation,
underinterpretation, or by the chosen boundary restrictions. Overinterpretation occurred
when NER could not disambiguate text and would output multiple meaning codes for a
89
single concept, negatively impacting the similarity ratio. Underinterpretation occurred
when the NER dictionary did not cover the domain adequately, creating false positives
when two texts were really just misunderstood. And boundary restrictions resulted in
false negatives that were very close similarity measurements but were just slightly below
specification due to underinterpretation or overinterpretation errors.
5.3 Medical Term Similarity
5.3.1 Correlation with Physicians and Terminologists
The goal of testing the CB and HCB algorithms for medical term similarity was to
test their ability to assess the degrees of similarity between two terms versus their ability
to identify exact semantic matches. For example, “first name” and “given name” are
exactly the same and perfectly similar, whereas “name” is only partially similar to “first
name,” “last name,” and “middle name.” In the automatic alignment study, only the exact
alignment was acceptable. In this study we were interested in how similar 2 medical
terms were.
To assess the CB and HCB with a full range of similarity measurements, we
utilized a published benchmark of carefully curated medical term pair similarity
measurements. In this benchmark terminology experts and physicians evaluated pairs of
medical concepts and ranked their similarity using a Likert scale. CB and HCB similarity
calculations were compared with the benchmark and other published results on the same
benchmark. Each of the compared methods was described in Section 2.3 and is
referenced individually in Table 5.5. For reference, the breakdown for correlation
measures is as follows [157]:
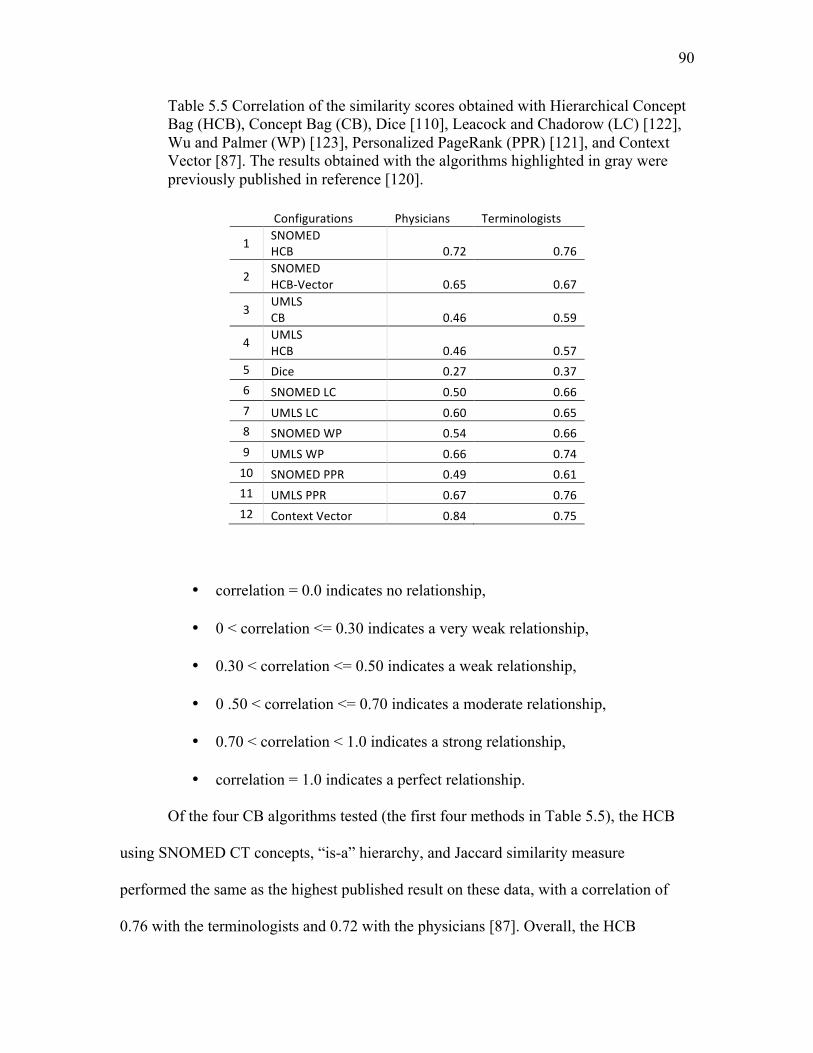
90
Table 5.5 Correlation of the similarity scores obtained with Hierarchical Concept Bag (HCB), Concept Bag (CB), Dice [110], Leacock and Chadorow (LC) [122], Wu and Palmer (WP) [123], Personalized PageRank (PPR) [121], and Context Vector [87]. The results obtained with the algorithms highlighted in gray were previously published in reference [120].
Configurations Physicians Terminologists
1 SNOMEDHCB 0.72 0.76
2SNOMEDHCB-Vector 0.65 0.67
3UMLSCB 0.46 0.59
4 UMLSHCB 0.46 0.57
5 Dice 0.27 0.376 SNOMEDLC 0.50 0.667 UMLSLC 0.60 0.658 SNOMEDWP 0.54 0.669 UMLSWP 0.66 0.7410 SNOMEDPPR 0.49 0.6111 UMLSPPR 0.67 0.7612 ContextVector 0.84 0.75
• correlation = 0.0 indicates no relationship,
• 0 < correlation <= 0.30 indicates a very weak relationship,
• 0.30 < correlation <= 0.50 indicates a weak relationship,
• 0 .50 < correlation <= 0.70 indicates a moderate relationship,
• 0.70 < correlation < 1.0 indicates a strong relationship,
• correlation = 1.0 indicates a perfect relationship.
Of the four CB algorithms tested (the first four methods in Table 5.5), the HCB
using SNOMED CT concepts, “is-a” hierarchy, and Jaccard similarity measure
performed the same as the highest published result on these data, with a correlation of
0.76 with the terminologists and 0.72 with the physicians [87]. Overall, the HCB
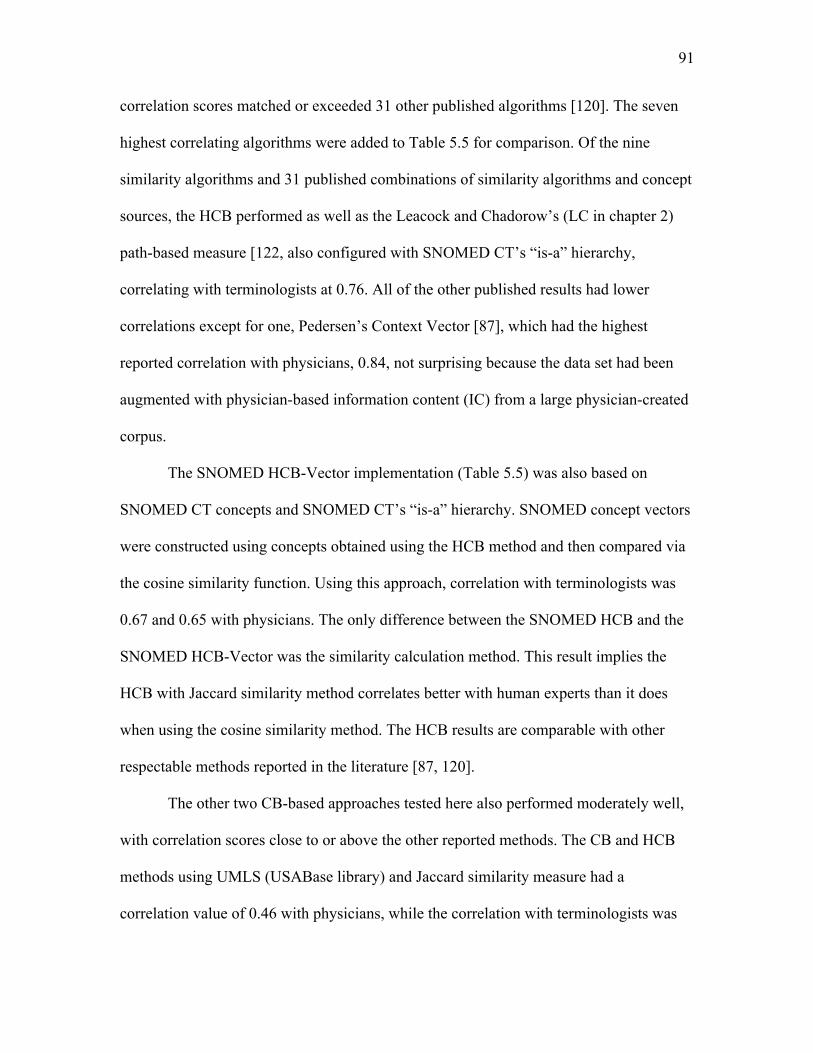
91
correlation scores matched or exceeded 31 other published algorithms [120]. The seven
highest correlating algorithms were added to Table 5.5 for comparison. Of the nine
similarity algorithms and 31 published combinations of similarity algorithms and concept
sources, the HCB performed as well as the Leacock and Chadorow’s (LC in chapter 2)
path-based measure [122, also configured with SNOMED CT’s “is-a” hierarchy,
correlating with terminologists at 0.76. All of the other published results had lower
correlations except for one, Pedersen’s Context Vector [87], which had the highest
reported correlation with physicians, 0.84, not surprising because the data set had been
augmented with physician-based information content (IC) from a large physician-created
corpus.
The SNOMED HCB-Vector implementation (Table 5.5) was also based on
SNOMED CT concepts and SNOMED CT’s “is-a” hierarchy. SNOMED concept vectors
were constructed using concepts obtained using the HCB method and then compared via
the cosine similarity function. Using this approach, correlation with terminologists was
0.67 and 0.65 with physicians. The only difference between the SNOMED HCB and the
SNOMED HCB-Vector was the similarity calculation method. This result implies the
HCB with Jaccard similarity method correlates better with human experts than it does
when using the cosine similarity method. The HCB results are comparable with other
respectable methods reported in the literature [87, 120].
The other two CB-based approaches tested here also performed moderately well,
with correlation scores close to or above the other reported methods. The CB and HCB
methods using UMLS (USABase library) and Jaccard similarity measure had a
correlation value of 0.46 with physicians, while the correlation with terminologists was
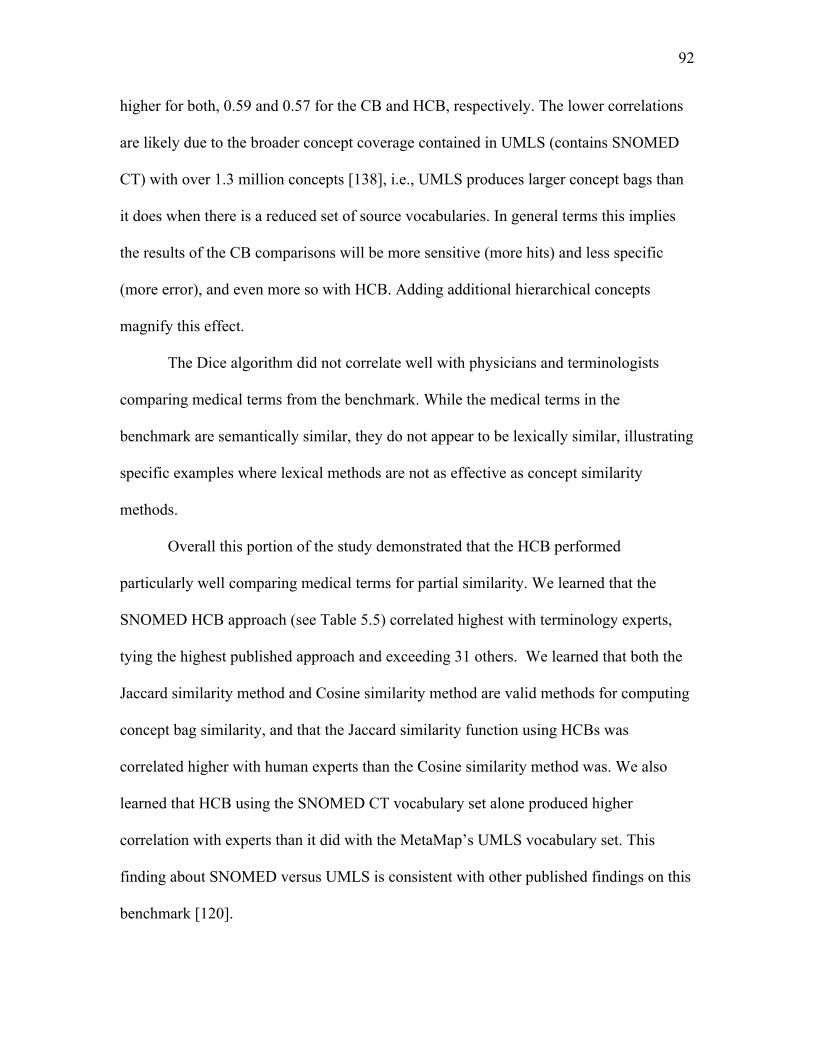
92
higher for both, 0.59 and 0.57 for the CB and HCB, respectively. The lower correlations
are likely due to the broader concept coverage contained in UMLS (contains SNOMED
CT) with over 1.3 million concepts [138], i.e., UMLS produces larger concept bags than
it does when there is a reduced set of source vocabularies. In general terms this implies
the results of the CB comparisons will be more sensitive (more hits) and less specific
(more error), and even more so with HCB. Adding additional hierarchical concepts
magnify this effect.
The Dice algorithm did not correlate well with physicians and terminologists
comparing medical terms from the benchmark. While the medical terms in the
benchmark are semantically similar, they do not appear to be lexically similar, illustrating
specific examples where lexical methods are not as effective as concept similarity
methods.
Overall this portion of the study demonstrated that the HCB performed
particularly well comparing medical terms for partial similarity. We learned that the
SNOMED HCB approach (see Table 5.5) correlated highest with terminology experts,
tying the highest published approach and exceeding 31 others. We learned that both the
Jaccard similarity method and Cosine similarity method are valid methods for computing
concept bag similarity, and that the Jaccard similarity function using HCBs was
correlated higher with human experts than the Cosine similarity method was. We also
learned that HCB using the SNOMED CT vocabulary set alone produced higher
correlation with experts than it did with the MetaMap’s UMLS vocabulary set. This
finding about SNOMED versus UMLS is consistent with other published findings on this
benchmark [120].

93
5.4 ICU Discharge Summary Similarity
Computing similarity between larger medical texts is more complex than
comparing specific medical terms or DEs, in terms of both semantic complexity and
computation. The methods we have explored so far have been focused on relatively short
expressions from 1.6 to 7.1 mean words (see Table 5.1). The studied ICU discharge
summaries (DS) have a mean size of 308.8 words, two orders of magnitude larger. Due to
this size difference we chose a slightly different comparator lineup, TF-IDF (Section
2.4.2), Dice (Section 2.2.2), CB (Section 3.1), and HCB (Section 3.2). The reasoning
behind why these algorithms were selected is given in Section 4.4.2.
One hundred randomly selected ICU discharge summary (DS) pairs were
evaluated by 2 terminologists and 4 algorithms, the CB (see Section 3.1), the HCB (see
Section 3.2), Dice (see Section 2.2.2), and TF-IDF (see Section 2.4.2). The instructions
terminologists were asked to follow are included in Section 4.4.1.
The results are correlations between the similarity scores given by the different
approaches. A correlation of 0.0 indicates there was absolutely no linear relationship
between the two sets compared, whereas a correlation of 1.0 indicates the relationship is
perfectly linear. See the correlation results in Table 5.6. A reference for correlation value
interpretations was provided in Section 5.2.1.
Determining similarity between DSs is much more complicated and challenging
than any of the other two applications discussed above. The text size difference implies
there is significantly more semantic complexity. Moreover, DSs include a large number
of nonspecific common words, increasing the computational challenge of identifying the
key words that truly characterize the document.
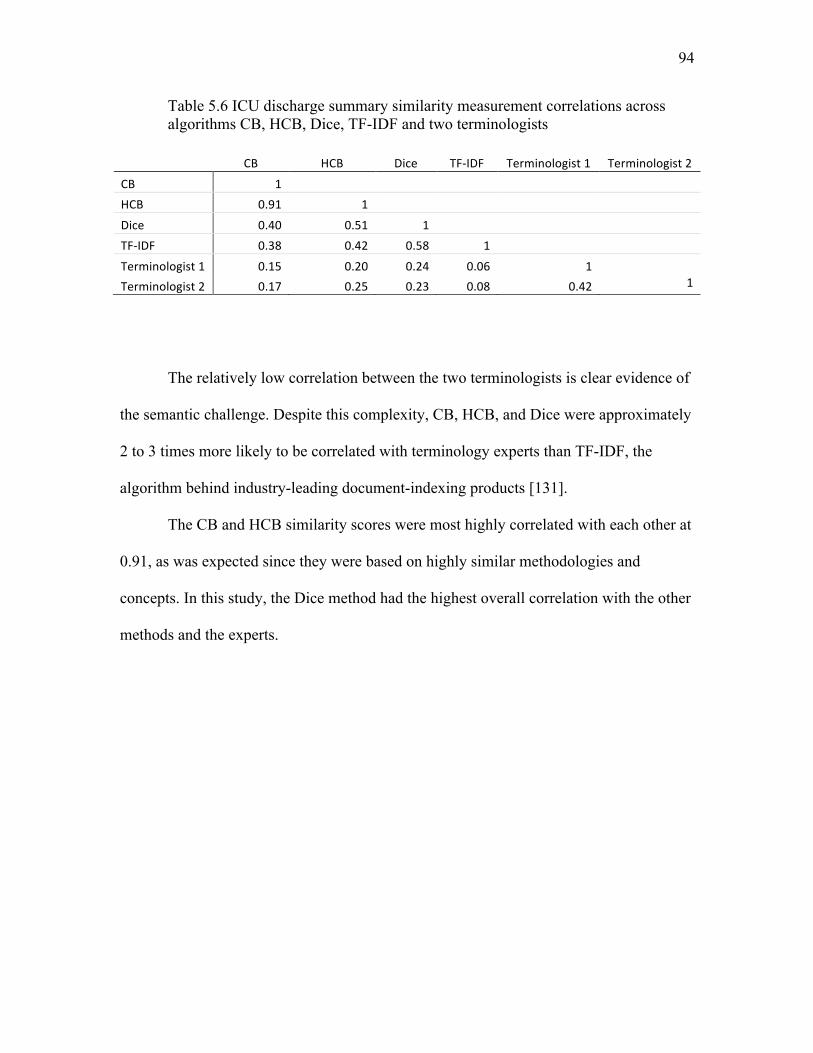
94
Table 5.6 ICU discharge summary similarity measurement correlations across algorithms CB, HCB, Dice, TF-IDF and two terminologists
CB HCB Dice TF-IDF Terminologist1 Terminologist2
CB 1
HCB 0.91 1
Dice 0.40 0.51 1
TF-IDF 0.38 0.42 0.58 1
Terminologist1 0.15 0.20 0.24 0.06 1
Terminologist2 0.17 0.25 0.23 0.08 0.42 1
The relatively low correlation between the two terminologists is clear evidence of
the semantic challenge. Despite this complexity, CB, HCB, and Dice were approximately
2 to 3 times more likely to be correlated with terminology experts than TF-IDF, the
algorithm behind industry-leading document-indexing products [131].
The CB and HCB similarity scores were most highly correlated with each other at
0.91, as was expected since they were based on highly similar methodologies and
concepts. In this study, the Dice method had the highest overall correlation with the other
methods and the experts.
CHAPTER 6
GENERAL DISCUSSION, FUTURE DIRECTIONS, AND CONCLUSIONS
6.1 General Discussion
6.1.1 Advancing Methods for Computing Similarity
A new method for computing semantic similarity has been introduced and
described, the Concept Bag method (CB). The original purpose of its creation was to
align heterogeneous datasets by auto-aligning data elements (DE), and it performed
particularly well at this task. Comparing the CB with Dice, the next closest non-CB
algorithm, the performance gain of the CB reduced the amount of alignment work by
over 5% in both tested data sets (5.54% for the controlled set and 5.18% for the
uncontrolled set). The results were surprisingly replicable between two very different
data sets, a small set of DEs derived from a controlled vocabulary and a very large set
from an uncontrolled vocabulary. We consider this a significant finding that advances the
field of biomedical data integration research.
6.1.2 Expanding Concept Bags with Hierarchical Concepts
The Hierarchical Concept Bag (HCB) was the second configuration of the CB and
it was essentially the same except that hierarchical semantics were added. The original
CB contained only concept matches produced by the named-entity recognition (NER)
96
software. The HCB had the highest overall standing of the three applications. In the case
of aligning DEs, the HCB was only second to the CB but still outperformed the other
algorithms. On the medical term set the HCB was ranked 2nd when compared 7 to other
well-established algorithms [120]. And comparing intensive care unit (ICU) discharge
instructions, the HCB appeared to be second to the Dice algorithm. Due to its versatility,
the HCB would be the best “catch-all” algorithm if requirements were unclear.
One of the surprises of the HCB results was that vector-based HCB correlations
were lower than the bag-based approach for the medical term study. Vector-based
solutions are behind many of the highly successful algorithms in the document similarity
space [158]. One of the consequences of having a small data set with short strings was
that there were not many concepts to establish frequency weights. HCB Vectors were not
weighted like they are in many vector-based implementations. Weights only make sense
when there are significant frequency metrics, however.
6.1.3 Comparison with Compositional Semantics
“Compositional semantics” is based on the definition of compositionality, where
the meaning of an expression is determined by the structure and the meaning of its
components [159]. CBs and HCBs are composed of conceptual codes and are lexicon-
free, but do not support structure beyond set membership and potentially set order when
sets are extended to vectors. They do not contain adequate structure to reverse engineer
meaningful language-based lexical expressions, but they are compositions of semantic
expressions (as expressed by concept codes) that are used to mathematically compare
semantics. The CBs and HCBs are similar to compositional semantics but are not
97
considered compositional semantics as described in the literature.
6.1.4 ICU Discharge Similarity
The first two studies had conclusive results, but the results of the ICU discharge
summary study were inconclusive. The correlation between human experts and/or
algorithms was too low. The terminologists who judged ICU discharge summaries were
admittedly challenged, despite multiple verbal conversations and explicit written
instructions. This is consistent with the literature. Human-based annotation of biomedical
text is recognized as challenging, often requiring a multistep process to achieve modest
consistency [160]. In this experiment terminologists were asked to make a single
judgment between two texts averaging over 300 words each, whereas the task of
annotating texts typically requires sentence-level interpretation. Perhaps a more granular
approach could be followed, annotating the ICU discharge instructions at the sentence
level first, and then using these annotations a final similarity judgment could be made.
Whichever strategy is chosen, more effort needs to be applied to establish a suitable
reference for correlation.
The only highly correlated algorithms were the CB and HCB, and this is a
consequence of one being a derivative of the other. The high correlation between the two
is validation that the methods are not exactly the same but perform similarly, as we saw
in the results of the other studies. One of the weak signals that had a potentially
interesting implication was the fact that all three non-TF-IDF methods had slightly higher
correlations between the other methods and with terminologists. What makes this
interesting is that it starts to form evidence that indicates that the text sizes of the ICU
98
discharge summaries may not have reached the threshold where TF-IDF starts to
outperform the other set comparison approaches (Jaccard and Dice). The TF-IDF
algorithm is “the one to beat” in document matching [158], although we did not find
studies that validated a boundary or rule-of-thumb that identifies when algorithms for
“short” strings are better than algorithms for documents. This was not a conclusive
finding but is an interesting topic that could benefit from more research.
6.1.5 Concept Bag Is Highly Configurable and Generalizable
The CB method is highly configurable and versatile. It was designed such that it
could be tuned for a variety of use cases. The three primary opportunities for tuning the
algorithm are, 1) the named-entity recognition (NER) software and underlying
vocabularies can be changed, 2) the implementation of the concept bag can be a set or a
weighted vector, 3) and the concept bag analysis method could be any number of
analytical methods. Moreover, secondary configuration options include settings that can
be manipulated on the NER software. MetaMap has nearly 100 settings and multiple
underlying vocabularies that contain additional semantic knowledge similar to the
SNOMED CT hierarchy. Additional tuning options for the concept bag implementation
include the way that concept bags are populated, how concepts are selected from the
NER tool output, and how concepts are weighted. CB analysis methods could be simple
sets or vector-based, with a sophisticated weighting strategy. With all of these options
there are many opportunities for further exploration.
All of the options available to configure the CB make it a broadly generalizable
similarity algorithm that can be tailored to perform similarity measurements for nearly
99
any topic.
6.1.6 Scalability and Performance
Given the datasets that were used for the studies, only the REDCap DEs were big
enough to be a computer time/speed performance concern. The term “big” is not used in
terms of bytes, but in terms of the number of comparisons that had to be performed.
Comparing 899,649 DEs from 20,724 data sets requires nearly half a trillion
comparisons. This places the REDCap DE alignment project in the “large schema
matching” category. This study was based on matching DEs and did not scale up to
individual data sets, although this work is feasible, based on what has been done already.
The idea of aggregating aligned data elements is mentioned below in the future work.
We did not find any comparison studies that were in the same category.
Our solution, the parallel matching [151] process (see section 4.2.7.2), was
configured to run 256 parallel jobs using the Center for High Performance Computing
and took 4.1 +/- 1.3 hours for all 256 jobs to complete. One of the benefits of this strategy
is that more jobs and CPUs can be added to reduce the elapsed computing time required;
it is highly scalable due to the fact that similarity computations can be dynamically
subdivided and executed in parallel tasks based on the available computing resources.
6.1.7 Suggested Use
The CB and HCB are recommended for projects where the 5% savings in errors
outweighs the added sophistication required to implement the algorithms. The lexical
methods are very simple and do not require terminologies, database software, or the
100
described process to implement the CB and HCB. The CB and HCB software could be
simplified by bundling the software into a product that would behave almost as simply as
the lexical methods, but still requires more sophisticated computational support,
especially for large numbers of data set comparisons. The cost of implementation would
definitely payoff in a big data project but may not be as compelling for small-ish
alignment projects.
6.2 Future Directions
6.2.1 MetaMap Settings
Several discoveries and realizations occurred during and after the initial
experiments were completed. More experience with MetaMap, for example, helped us
recognize more opportunities for tuning MetaMap. As mentioned, MetaMap has nearly
100 settings for configuring and tuning input and output. The first tuning target will be to
filter out low confidence matches using MetaMap’s confidence score. The second will be
to identify and select relevant semantic types that are associated with UMLS concepts.
The third will focus on selecting the most relevant source vocabularies. We intend to use
the current dataset and linear regression to identify which of these settings impact the
output most positively.
6.2.2 Aligning Data Sets and Projects
One of the interesting results of this method is that concept bags can be
aggregated based on any kind grouping that is desired. The concept bag approach applies
to a project in a similar way that large bags of words are created for large documents.
101
Converting individual DE concept bags into larger sets by performing a union of all the
bags in a given data set creates the “data set” concept bag, and similarly for a project. Or,
by aggregating DE alignments by data set we can identify data set alignments. This
becomes an “n-way” matching problem [78]. Dataset matching techniques normally
focus on 2-way matching, aligning one dataset to another. Preforming data set matching
with these data is performing a 20,724-way matching solution. This is logically
conceivable to imagine but is not trivial to implement, making it a great future research
topic. Or how about comparing institutions, states, or countries? We do not understand
where the limits are yet, but this is the idea, to learn about the concept bag approach on
larger sets.
6.2.3 Comparing Diagnosis and Procedure Codes
Concept bags could be created from diagnosis, procedure codes, laboratory codes,
or using any kinds of codes. Choosing which codes and how to apply weights basically
serves the same function as feature vector engineering that is performed for machine
learning, except that these methods are unsupervised. The use of diagnosis codes and
procedure codes, for example, is a particularly interesting combination. It seems intuitive
that people who share diagnosis and procedure codes would share other things in
common as well.
6.2.4 Reducing Comparisons
A significant amount of the effort for performing big data set analysis is
identifying methods that reduce the data and/or computational complexity as much as
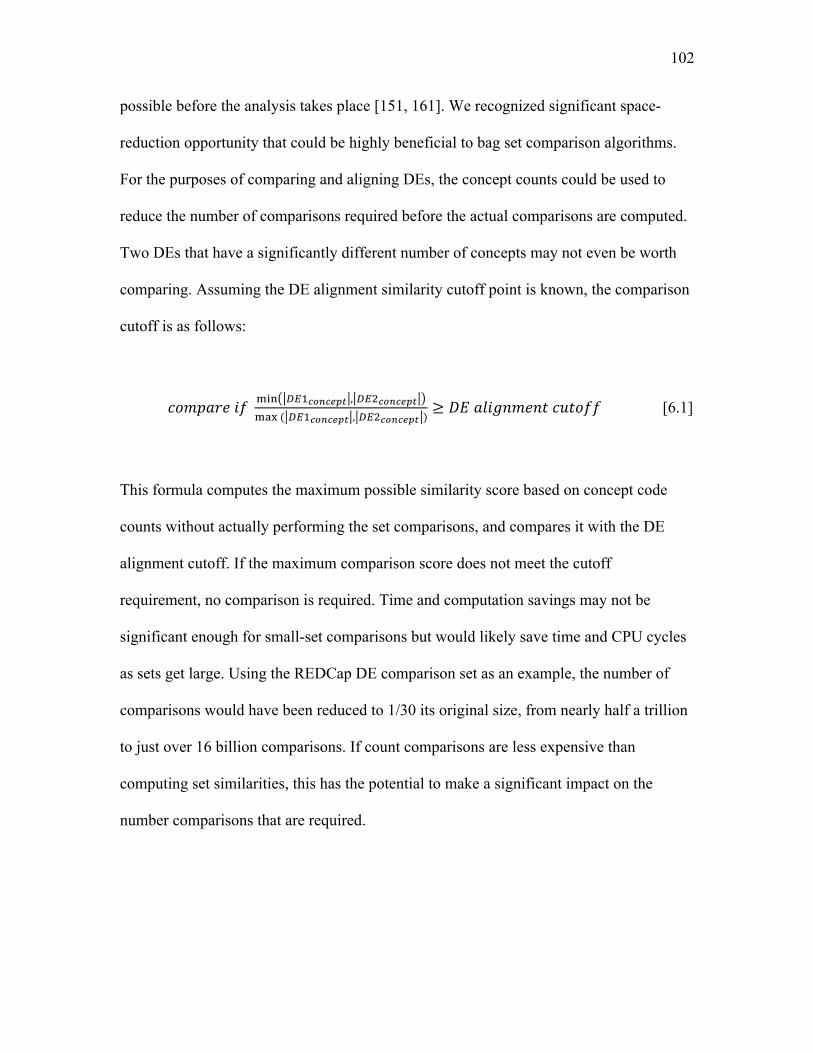
102
possible before the analysis takes place [151, 161]. We recognized significant space-
reduction opportunity that could be highly beneficial to bag set comparison algorithms.
For the purposes of comparing and aligning DEs, the concept counts could be used to
reduce the number of comparisons required before the actual comparisons are computed.
Two DEs that have a significantly different number of concepts may not even be worth
comparing. Assuming the DE alignment similarity cutoff point is known, the comparison
cutoff is as follows:
𝑐𝑜𝑚𝑝𝑎𝑟𝑒 𝑖𝑓 !"# !"!!"#!$%& , !"!!"#!$%&!"# ( !"!!"#!$%& , !"!!"#!$%& )
≥ 𝐷𝐸 𝑎𝑙𝑖𝑔𝑛𝑚𝑒𝑛𝑡 𝑐𝑢𝑡𝑜𝑓𝑓 [6.1]
This formula computes the maximum possible similarity score based on concept code
counts without actually performing the set comparisons, and compares it with the DE
alignment cutoff. If the maximum comparison score does not meet the cutoff
requirement, no comparison is required. Time and computation savings may not be
significant enough for small-set comparisons but would likely save time and CPU cycles
as sets get large. Using the REDCap DE comparison set as an example, the number of
comparisons would have been reduced to 1/30 its original size, from nearly half a trillion
to just over 16 billion comparisons. If count comparisons are less expensive than
computing set similarities, this has the potential to make a significant impact on the
number comparisons that are required.
103
6.2.5 Adding Philological Relationships
The HCB uses SNOMED CT’s is-a hierarchy to measure similarity. Adding
concept codes that share additional philological relationships is a natural extension of the
work that has been performed. Semantic relationships are used to formulate concept
definitions with 80% to 90% accuracy [162], implying that concepts with similar
relationships would have similar definitions as well. It stands to reason that adding
additional philological relationships to Concept Bags would have the same effect; similar
definitions imply similar concepts. A specific strategy to accomplish this was introduced
in Section 3.2. The idea is to pair philological relationships with concepts to create a
composite key that becomes an additional Concept Bag set element. The added elements
essentially add the full meaning of the concept code and philological relationship to the
Concept Bag. We believe this is an interesting new idea that deserves additional research.
6.3 Conclusions
Automatic alignment of heterogeneous biomedical data is very challenging due to
the sophisticated semantics of clinical data. In this dissertation we introduced a new
method that compares ”concept bags” to compute similarity and apply it to the automatic
alignment problem. The algorithm was tested against two diverse data element sets, one
from a controlled vocabulary and one from an uncontrolled vocabulary, and the new
similarity algorithm consistently decreased the alignment error rate by more than 5% as
compared to other well-established alignment methods.
To demonstrate the concept bag’s generalizability, the new method was
configured in different ways, in two ways for the DE alignment study, in four ways for
104
the medical term similarity study, and two ways for the ICU discharge summary study.
Evaluating medical terms for similarity, the CB ranked second among 7 well-established
semantic similarity algorithms after it was configured to utilize SNOMED CT concept
semantics. Measuring patient case similarity between ICU discharge instructions was
much more complex, and human expert judgments had a very low correlation. More
exploration needs to be performed in this area to establish a source of truth such that
algorithms can be iteratively tuned and tested. As with most customizable algorithms,
high performance, both in terms of algorithm accuracy performance and computational
performance, requires iterative tuning and experimentation. Computational performance
was measured on the largest set of comparisons, but performance was not an issue for the
other applications. The similarity methods that were used (Jaccard and TF-IDF) have
been proven to be highly scalable in real-world Big Data applications; it stands to reason
that the new concept bag algorithm will scale similarly. We believe this work applies to
large-scale data-set-alignment projects where the number of data sets is large and auto-
discovery of alignments would help to identify data sets with similar data.
REFERENCES
[1] Shadmi E, Flaks-Manov N, Hoshen M, Goldman O, Bitterman H, Balicer RD, Predicting 30-day readmissions with preadmission electronic health record data, Medical care 53 (2015) 283-289.
[2] Dregan A, van Staa TP, McDermott L, McCann G, Ashworth M, Charlton J, et al., Point-of-care cluster randomized trial in stroke secondary prevention using electronic health records, Stroke; a journal of cerebral circulation 45 (2014) 2066-2071.
[3] Banerjee J, Asamoah FK, Singhvi D, Kwan AW, Morris JK, Aladangady N, Haemoglobin level at birth is associated with short term outcomes and mortality in preterm infants, BMC medicine 13 (2015) 16.
[4] Rasmussen LV, The electronic health record for translational research, Journal of cardiovascular translational research 7 (2014) 607-614.
[5] Narus SP, Srivastava R, Gouripeddi R, Livne OE, Mo P, Bickel JP, et al., Federating clinical data from six pediatric hospitals: process and initial results from the PHIS+ Consortium, AMIA Annu Symp Proc 2011 (2011) 994-1003.
[6] Gouripeddi R, Warner PB, Mo P, Levin JE, Srivastava R, Shah SS, et al., Federating clinical data from six pediatric hospitals: process and initial results for microbiology from the PHIS+ consortium, AMIA Annu Symp Proc 2012 (2012) 281-290.
[7] Ohno-Machado L, Structuring text and standardizing data for clinical and population health applications, J Am Med Inform Assoc 21 (2014) 763.
[8] Boslaugh S, Secondary Data Sources for Public Health: Cambridge University Press, 2007.
[9] Health and social care leaders set out plans to transform people's health and improve services using technology, Journal of perioperative practice 25 (2015) 6.
[10] Anderson JE, Chang DC, Using electronic health records for surgical quality improvement in the era of big data, JAMA surgery 150 (2015) 24-29.
[11] Helm-Murtagh SC, Use of big data by Blue Cross and Blue Shield of North Carolina, North Carolina medical journal 75 (2014) 195-197.
106
[12] Hebert C, Shivade C, Foraker R, Wasserman J, Roth C, Mekhjian H, et al., Diagnosis-specific readmission risk prediction using electronic health data: a retrospective cohort study, BMC Med Inform Decis Mak 14 (2014) 65.
[13] Nishida Y, Takahashi Y, Nakayama T, Soma M, Kitamura N, Asai S, Effect of candesartan monotherapy on lipid metabolism in patients with hypertension: a retrospective longitudinal survey using data from electronic medical records, Cardiovascular diabetology 9 (2010) 38.
[14] Meaningful Use Definition & Objectives, HealthIt.gov (US), <http://www.healthit.gov/providers-professionals/meaningful-use-definition-objectives>, 2015. [15] Nass SJ, Levit LA, Gostin LO, Beyond the HIPAA Privacy Rule: Enhancing Privacy, Improving Health Through ResearchWashington (DC), 2009.
[16] Kijsanayotin B, Speedie SM, Connelly DP, Linking patients' records across organizations while maintaining anonymity, AMIA Annu Symp Proc (2007) 1008.
[17] Pantazos K, Lauesen S, Lippert S, De-identifying an EHR database - anonymity, correctness and readability of the medical record, Stud Health Technol Inform 169 (2011) 862-866.
[18] He S, Hurdle JF, Botkin JR, Narus SP, Integrating a Federated Healthcare Data Query Platform With Electronic IRB Information Systems, AMIA Annu Symp Proc 2010 (2010) 291-295.
[19] Kahn MG, Raebel MA, Glanz JM, Riedlinger K, Steiner JF, A pragmatic framework for single-site and multisite data quality assessment in electronic health record-based clinical research, Medical care 50 Suppl (2012) S21-29.
[20] Chen H, Hailey D, Wang N, Yu P, A review of data quality assessment methods for public health information systems, International journal of environmental research and public health 11 (2014) 5170-5207.
[21] Clemmer TP, Monitoring outcomes with relational databases: does it improve quality of care?, Journal of critical care 19 (2004) 243-247.
[22] Oniki TA, Coyle JF, Parker CG, Huff SM, Lessons learned in detailed clinical modeling at Intermountain Healthcare, J Am Med Inform Assoc 21 (2014) 1076-1081.
[23] ISO 13606-2: 2008, Electronic health record communication part 2: Archetype interchange specification. [24] Coyle JF, Heras Y, Oniki TA, Huff S. Clinical Element Model, Dissertation, Salt Lake City: University of Utah, 2008. [25] HL7 version 3: 2006, Reference information model release 4.
107
[26] Euzenat J, Shvaiko P, The matching problem, Ontology Matching: Springer, 2007, p. 41-42.
[27] Sujansky W, Heterogeneous database integration in biomedicine, J Biomed Inform 34 (2001) 285-298.
[28] Amaglobeli G, Semantic Triangle and Linguistic Sign, Scientific Journal in Humanities 1 (2012) 37-40.
[29] Cimino JJ, Desiderata for controlled medical vocabularies in the twenty-first century, Methods Inf Med 37 (1998) 394-403.
[30] de Keizer NF, Abu-Hanna A, Zwetsloot-Schonk JH, Understanding terminological systems. I: Terminology and typology, Methods Inf Med 39 (2000) 16-21.
[31] Library of Congress Subject Headings: Pre- vs. Post-Coordination and Related Issues, in: Congress Lo, editor: Library of Congress, http://www.loc.gov, 2007.
[32] Miller RA, Johnson KB, Elkin PL, Brown SH, Interface Terminologies: Facilitating Direct Entry of Clinical Data into Electronic Health Record Systems, Journal of the American Medical Informatics Association 13 (2006) 277-288.
[33] Euzenat J, Shvaiko P, Semantic-based techniques, Ontology Matchng: Springer, 2007, p. 110-115.
[34] Nadkarni PM, Ohno-Machado L, Chapman WW, Natural language processing: an introduction, J Am Med Inform Assoc 18 (2011) 544-551.
[35] Kawamoto K, Honey A, Rubin K, The HL7-OMG Healthcare Services Specification Project: motivation, methodology, and deliverables for enabling a semantically interoperable service-oriented architecture for healthcare, J Am Med Inform Assoc 16 (2009) 874-881.
[36] Boyer J, Gao S, Malaika S, Maximilien M, Salz R, Simeon J, Experiences with JSON and XML Transformations, in: IBM, editor, W3C Workshop on Data and Services Integration: WC3, http://www.w3.org, 2011.
[37] Viglas SD, Data Provenance and Trust, Data Science 12 (2013).
[38] Freire J, Silva CT, Making Computations and Publications Reproducable with VisTrails, Computing in Science and Engineering 14 (2012) 18-25.
[39] Murphy SN, Mendis ME, Berkowitz DA, Kohane I, Chueh HC, Integration of clinical and genetic data in the i2b2 architecture, AMIA Annu Symp Proc (2006) 1040.
[40] Murphy SN, Weber G, Mendis M, Gainer V, Chueh HC, Churchill S, et al., Serving the enterprise and beyond with informatics for integrating biology and the bedside (i2b2), J Am Med Inform Assoc 17 (2010) 124-130.
108
[41] OpenFurther: Univeristy of Utah Biomedical Informatics, <http://openfurther.org>, 2015. [42] Bradshaw RL, Matney S, Livne OE, Bray BE, Mitchell JA, Narus SP, Architecture of a federated query engine for heterogeneous resources, AMIA Annu Symp Proc 2009 (2009) 70-74.
[43] Livne OE, Schultz ND, Narus SP, Federated querying architecture with clinical & translational health IT application, J Med Syst 35 (2011) 1211-1224.
[44] Weber GM, Murphy SN, McMurry AJ, Macfadden D, Nigrin DJ, Churchill S, et al., The Shared Health Research Information Network (SHRINE): a prototype federated query tool for clinical data repositories, J Am Med Inform Assoc 16 (2009) 624-630.
[45] Murphy SN, Mendis M, Hackett K, Kuttan R, Pan W, Phillips LC, et al., Architecture of the open-source clinical research chart from Informatics for Integrating Biology and the Bedside, AMIA Annu Symp Proc (2007) 548-552.
[46] Mendis M, Wattanasin N, Kuttan R, Pan W, Philips L, Hackett K, et al., Integration of Hive and cell software in the i2b2 architecture, AMIA Annu Symp Proc (2007) 1048.
[47] Huser V, Cimino JJ, Desiderata for healthcare integrated data repositories based on architectural comparison of three public repositories, AMIA Annu Symp Proc 2013 (2013) 648-656.
[48] Natter MD, Quan J, Ortiz DM, Bousvaros A, Ilowite NT, Inman CJ, et al., An i2b2-based, generalizable, open source, self-scaling chronic disease registry, J Am Med Inform Assoc 20 (2013) 172-179.
[49] i2b2 Installations: Partners Healthcare, <https://www.i2b2.org/work/i2b2_installations.html>, 2015.
[50] Johnson EK, Broder-Fingert S, Tanpowpong P, Bickel J, Lightdale JR, Nelson CP, Use of the i2b2 research query tool to conduct a matched case-control clinical research study: advantages, disadvantages and methodological considerations, BMC Med Res Methodol 14 (2014) 16.
[51] Wattanasin N, Porter A, Ubaha S, Mendis M, Phillips L, Mandel J, et al., Apps to display patient data, making SMART available in the i2b2 platform, AMIA Annu Symp Proc 2012 (2012) 960-969.
[52] Meystre SM, Deshmukh VG, Mitchell J, A clinical use case to evaluate the i2b2 Hive: predicting asthma exacerbations, AMIA Annu Symp Proc 2009 (2009) 442-446.
[53] Rocha RA, Hurdle JF, Matney S, Narus SP, Meystre S, LaSalle B, et al., Utah's statewide informatics platform for translational and clinical science, AMIA Annu Symp Proc (2008) 1114.
109
[54] Warner PB, Mo P, Shultz ND, Gouripeddi R, Facelli JC, On the Fly Linkage of Records Containing Protected Health Information (PHI) Within the FURTHeR Framework, Fall AMIA Annual Symposium 2013Washington D.C., 2013.
[55] Lasalle B, Varner M, Botkin J, Jackson M, Stark L, Cessna M, et al., Biobanking informatics infrastructure to support clinical and translational research, AMIA Joint Summits on Translational Science proceedings AMIA Summit on Translational Science 2013 (2013) 132-135.
[56] Schultz ND, Bradshaw RL, Narus SP, Mitchell JA, Perfect Forward Secrecy for Patient Identifiers During Federation within FURTHeR, Fall AMIA Annual Symposium 2012Chicago, IL, 2012.
[57] Bradshaw RL, Shultz ND, Madsen R, Gouripeddi R, Butcher R, LaSalle BA, et al., Going FURTHeR with Three Federated Query Types, Fall AIMIA Annual SymposiumWashington D.C., 2013.
[58] Matney S, Bradshaw RL, Livne OE, Bray BE, Mitchell JA, Narus SP, Developing a Semantic Framework for Clinical and Translational Research , AMIA Summit on Translational Bioinformatics, 2011.
[59] Bradshaw RL, Staes CJ, Del Fiol G, Narus SP, Mitchell JA, Going FURTHeR with the Metadata Repository, AMIA 2012 Annual SymposiumWashington D.C., 2012.
[60] Chute CG, Beck SA, Fisk TB, Mohr DN, The Enterprise Data Trust at Mayo Clinic: a semantically integrated warehouse of biomedical data, J Am Med Inform Assoc 17 (2010) 131-135.
[61] Halevy A, Why Your Data Won't Mix, ACMQueue October 2005 (2005) 52-58.
[62] Mortensen JM, Musen MA, Noy NF, Crowdsourcing the verification of relationships in biomedical ontologies, AMIA Annu Symp Proc 2013 (2013) 1020-1029.
[63] Fan JW, Friedman C, Deriving a probabilistic syntacto-semantic grammar for biomedicine based on domain-specific terminologies, J Biomed Inform 44 (2011) 805-814.
[64] Jezek P, Moucek R, Semantic framework for mapping object-oriented model to semantic web languages, Frontiers in neuroinformatics 9 (2015) 3.
[65] Hogan WR, Wagner MM, Free-text fields change the meaning of coded data, Proc AMIA Annu Fall Symp (1996) 517-521.
[66] Brazhnik O, Jones JF, Anatomy of data integration, J Biomed Inform 40 (2007) 252-269.
110
[67] Aronsky D, Kendall D, Merkley K, James BC, Haug PJ, A comprehensive set of coded chief complaints for the emergency department, Academic emergency medicine : official journal of the Society for Academic Emergency Medicine 8 (2001) 980-989.
[68] Coyle JF, The Clinical Element Model Detailed Clinical Models: University of Utah, 2011.
[69] Parker CG, Rocha RA, Campbell JR, Tu SW, Huff SM, Detailed clinical models for sharable, executable guidelines, Stud Health Technol Inform 107 (2004) 145-148.
[70] HL7 Master Grid of Standards: v2 Messages 2007-2015, <http://www.hl7.org/implement/standards/v2messages.cfm>. [71] Del Fiol G, Huser V, Strasberg HR, Maviglia SM, Curtis C, Cimino JJ, Implementations of the HL7 Context-Aware Knowledge Retrieval ("Infobutton") Standard: Challenges, strengths, limitations, and uptake, J Biomed Inform (2012).
[72] 2015 Edition Health Information Technology (Health IT) Certification Criteria, 2015 Edition Base Electronic Health Record (EHR) Definition, and ONC Health IT Certification Program Modifications, in: Department HaHS, editor: Federal Register, FederalRegister.gov, 2015. [73] HL7 Fast Healthcare Interoperabilty Resources – FHIR, <http://wiki.hl7.org/index.php?title=FHIR>. [74] Post van der Burg S, Freeman R, The Healthcare Services Platform (HSPC), <https://healthservices.atlassian.net/wiki/display/HSPC/Healthcare+Services+Platform+Consortium>, 2015.
[75] Grieve G, HL7 needs a fresh look because V3 has failed, Health Intersections: Healthcare Interoperability, 2011.
[76] Lin KW, Tharp M, Conway M, Hsieh A, Ross M, Kim J, et al., Feasibility of using Clinical Element Models (CEM) to standardize phenotype variables in the database of genotypes and phenotypes (dbGaP), PLoS One 8 (2013) e76384.
[77] Zhu Q, Freimuth RR, Pathak J, Chute CG, Using clinical element models for pharmacogenomic study data standardization, AMIA Joint Summits on Translational Science proceedings AMIA Summit on Translational Science 2013 (2013) 292-296.
[78] Bellahsense Z, Bonifati A, Rahm E, Schema Matching and Mapping: Springer, 2011.
[79] Euzenat J, Shvaiko P, Ontology Matching: Springer, 2007.
[80] Rahm E, A survey of approaches to automatic schema matching, The VLDB Journal 10 (2001) 334-350.
111
[81] Bernstein PA, Melnik S, Model management 2.0: manipulating richer mappings, Proceedings of the 2007 ACM SIGMOD international conference on Management of data: ACM, 2007.
[82] ISO/IEC 11179: 2004, Metadata registries (MDR).
[83] Euzenat J, Shvaiko P, Name-based techniques, Ontology Matching: Springer, 2007, p. 74-92.
[84] Taxonomy, <http://dictionary.reference.com>.
[85] Gruber T, Ontology, in: Liu L, Ozsu MT, editors, Encyclopedia of Database Systems: Springer-Verlag, 2009.
[86] Harispe S, Ranwez S, Janaqi S, Montmain J, Semantic Measures for the Comparison of Units of Language, Concepts or Instances from Text and Knowledge Representation Analysis, CoRR abs/1310.1285 (2013).
[87] Pedersen T, Pakhomov SV, Patwardhan S, Chute CG, Measures of semantic similarity and relatedness in the biomedical domain, J Biomed Inform 40 (2007) 288-299.
[88] Lin D, An Information-Theoretic Definition of Similarity, Proceedings of the Fifteenth International Conference on Machine Learning: Morgan Kaufmann Publishers Inc., 1998.
[89] Traingle Inequality, in: Team M, editor: Wolfram Research, Inc., <http://mathworld.wolfram.com/TriangleInequality.html>, 2015.
[90] Fung KW, Bodenreider O, Aronson AR, Hole WT, Srinivasan S, Combining lexical and semantic methods of inter-terminology mapping using the UMLS, Stud Health Technol Inform 129 (2007) 605-609.
[91] Yip V, Mete M, Topaloglu U, Kockara S, Concept Discovery for Pathology Reports using an N-gram Model, AMIA Joint Summits on Translational Science proceedings AMIA Summit on Translational Science 2010 (2010) 43-47.
[92] Heja G, Surjan G, Using n-gram method in the decomposition of compound medical diagnoses, Int J Med Inform 70 (2003) 229-236.
[93] Suen CY, n-Gram Statistics for Natural Language Understanding and Text Processing, IEEE transactions on pattern analysis and machine intelligence 1 (1979) 164-172.
[94] Rocha RA, Huff SM, Using Digrams to Map Controlled Medical Vocabularies, Proc Annu Symp Comput Appl Med Care, 1994, p. 172-176.
112
[95] Sorenson T, A method of establishing groups of equal amplitude in plant sociology based on similarity of species and its application to analyses of the vegetation on Danish commons, Kongelige Danske Videnskabernes Selskab 5 (1948) 1-34.
[96] Liu B, Xu J, Zou Q, Xu R, Wang X, Chen Q, Using distances between Top-n-gram and residue pairs for protein remote homology detection, BMC Bioinformatics 15 Suppl 2 (2014) S3.
[97] Razmara J, Deris SB, Parvizpour S, A context evaluation approach for structural comparison of proteins using cross entropy over n-gram modelling, Computers in biology and medicine 43 (2013) 1614-1621.
[98] Tomovic A, Janicic P, Keselj V, n-gram-based classification and unsupervised hierarchical clustering of genome sequences, Computer methods and programs in biomedicine 81 (2006) 137-153.
[99] Vries JK, Liu X, Bahar I, The relationship between n-gram patterns and protein secondary structure, Proteins 68 (2007) 830-838.
[100] Xu R, Zhou J, Liu B, He Y, Zou Q, Wang X, et al., Identification of DNA-binding proteins by incorporating evolutionary information into pseudo amino acid composition via the top-n-gram approach, Journal of biomolecular structure & dynamics (2014) 1-11.
[101] Xu R, Zhou J, Liu B, He Y, Zou Q, Wang X, et al., Identification of DNA-binding proteins by incorporating evolutionary information into pseudo amino acid composition via the top-n-gram approach, Journal of biomolecular structure & dynamics 33 (2015) 1720-1730.
[102] Bromuri S, Zufferey D, Hennebert J, Schumacher M, Multi-label classification of chronically ill patients with bag of words and supervised dimensionality reduction algorithms, J Biomed Inform 51 (2014) 165-175.
[103] Galaro J, Judkins AR, Ellison D, Baccon J, Madabhushi A, An integrated texton and bag of words classifier for identifying anaplastic medulloblastomas, Conf Proc IEEE Eng Med Biol Soc 2011 (2011) 3443-3446.
[104] Xu R, Hirano Y, Tachibana R, Kido S, Classification of diffuse lung disease patterns on high-resolution computed tomography by a bag of words approach, Medical image computing and computer-assisted intervention: MICCAI International Conference on Medical Image Computing and Computer-Assisted Intervention 14 (2011) 183-190.
[105] Wu L, Hoi SC, Yu N, Semantics-preserving bag-of-words models and applications, IEEE transactions on image processing: a publication of the IEEE Signal Processing Society 19 (2010) 1908-1920.
[106] Lin J, Demner-Fushman D, "Bag of words" is not enough for strength of evidence classification, AMIA Annu Symp Proc (2005) 1031.
113
[107] Ruch P, Baud R, Geissbuhler A, Evaluating and reducing the effect of data corruption when applying bag of words approaches to medical records, Int J Med Inform 67 (2002) 75-83.
[108] Baayen RH, Hendrix P, Ramscar M, Sidestepping the combinatorial explosion: an explanation of n-gram frequency effects based on naive discriminative learning, Language and speech 56 (2013) 329-347.
[109] Jimeno-Yepes A, McInnes BT, Aronson AR, Collocation analysis for UMLS knowledge-based word sense disambiguation, BMC Bioinformatics 12 Suppl 3 (2011) S4.
[110] Dice L, Measures of the Amount of Ecologic Association Between Species, Ecology 26 (1945) 297-302.
[111] Kunz I, Lin MC, Frey L, Metadata mapping and reuse in caBIG, BMC Bioinformatics 10 Suppl 2 (2009) S4.
[112] Suzuki KM, Porto Filho CH, Cozin LF, Pereyra LC, de Azevedo Marques PM, Deterministic record linkage versus similarity functions: a study in health databases from Brazil, Stud Health Technol Inform 192 (2013) 562-566.
[113] Luo Z, Miotto R, Weng C, A human-computer collaborative approach to identifying common data elements in clinical trial eligibility criteria, J Biomed Inform 46 (2013) 33-39.
[114] Levenshtein V, Binary codes capable of correcting deletions, insertions, and reversals, 1966.
[115] Levenshtein distance, <https://en.wikipedia.org/wiki/Levenshtein_distance>. [116] Grannis SJ, Overhage JM, McDonald C, Real world performance of approximate string comparators for use in patient matching, Stud Health Technol Inform 107 (2004) 43-47.
[117] Jaro MA, Probabilistic linkage of large public health data files, Statistics in medicine 14 (1995) 491-498.
[118] Winkler WE, The state of record linkage and current research problems, Statistical Research Division, US Census Bureau, 1999. [119] Jaro-Winkler Distance, <https://en.wikipedia.org/wiki/Jaro-Winkler_distance>. [120] Garla VN, Brandt C, Semantic similarity in the biomedical domain: an evaluation across knowledge sources, BMC Bioinformatics 13 (2012) 261.
[121] Aquire E, cuadros M, Rigua G, Soroa A, Exploring Knowledge Bases for Similarity, in: Calzolari N, Choukri K, Maegaard B, Mariani J, Odijk J, Piperidis S, et al.,
114
editors, Proceedings of the Seventh International Conference on Language Resources and Evaluation: European Language Resources Association, Valleta, Malta, 2010.
[122] Leacock C, Chodorow M, Using Corpus Statistics and Wordnet Relations for Sense Identification, in: Fellbaum C, editor, Wordnet: An Electronic Lexical Database: MIT Press, p. 265-283.
[123] Wu Z, Palmer M, Verbs semantics and lexical selection, Proceedings of the 32nd annual meeting on Association for Computational Linguistics: Association for Computational Linguistics Las Cruces, New Mexico, 1994.
[124] Resnik P, Using information content to evaluate semantic similarity in a taxonomy, Proceedings of the 14th international joint conference on Artificial intelligence: Morgan Kaufmann Publishers Inc., Montreal, Quebec, Canada, 1995.
[125] Caviedes JE, Cimino JJ, Towards the development of a conceptual distance metric for the UMLS, J Biomed Inform 37 (2004) 77-85.
[126] Page L, Brin S, Motwani R, Winograd T, The PageRank Citation Ranking: Bringing Order to the Web, 1999.
[127] White T, Hadoop The Definitive Guide 3 ed: O'Reilly, 2012.
[128] Philips J, Jaccard Similarity and Shingling, Data Mining: University of Computer Science Department, Online, 2015.
[129] Bag-of-words model, <https://en.wikipedia.org/wiki/Bag-of-words_model>. [130] Vector space model, <https://en.wikipedia.org/wiki/Vector_space_model>. [131] Apache Lucene, <https://lucene.apache.org/>. [132] Dumais ST, Latenet semantic analysis, Annual Review of Information Science and Technology 38 (2004).
[133] Boyack KW, Newman D, Duhon RJ, Klavans R, Patek M, Biberstine JR, et al., Clustering more than two million biomedical publications: comparing the accuracies of nine text-based similarity approaches, PLoS One 6 (2011) e18029.
[134] Mabotuwana T, Lee MC, Cohen-Solal EV, An ontology-based similarity measure for biomedical data-application to radiology reports, J Biomed Inform 46 (2013) 857-868.
[135] Rivas AR, Iglesias EL, Borrajo L, Study of query expansion techniques and their application in the biomedical information retrieval, The Scientific World Journal 2014 (2014) 132-158.
115
[136] Zheng JG, Howsmon D, Zhang B, Hahn J, McGuinness D, Hendler J, et al., Entity linking for biomedical literature, BMC Med Inform Decis Mak 15 Suppl 1 (2015) S4.
[137] Aronson AR, Lang FM, An overview of MetaMap: historical perspective and recent advances, J Am Med Inform Assoc 17 (2010) 229-236.
[138] Medicine NLo, Metamap - a tool for recognizing UMLS concepts in text, 2014.
[139] Lindberg DA, Humphreys BL, McCray AT, The Unified Medical Language System, Methods Inf Med 32 (1993) 281-291.
[140] UMLS Source Vocabulary Documentation: National Library of Medicine, <http://www.nlm.nih.gov>.
[141] Savova GK, Masanz JJ, Ogren PV, Zheng J, Sohn S, Kipper-Schuler KC, et al., Mayo clinical Text Analysis and Knowledge Extraction System (cTAKES): architecture, component evaluation and applications, J Am Med Inform Assoc 17 (2010) 507-513.
[142] Divita G, Zeng QT, Gundlapalli AV, Duvall S, Nebeker J, Samore MH, Sophia: A Expedient UMLS Concept Extraction Annotator, AMIA Annu Symp Proc 2014 (2014) 467-476.
[143] Bioportal for Systemized Nomenclature of Medicine - Clinical Terms: The National Center for Biomedical Ontology, 2015.
[144] Whetzel PL, Noy NF, Shah NH, Alexander PR, Nyulas C, Tudorache T, et al., BioPortal: enhanced functionality via new Web services from the National Center for Biomedical Ontology to access and use ontologies in software applications, Nucleic acids research 39 (2011) W541-545.
[145] Fellbaum C, Wordnet: An Electronic Lexical Database: MIT Press, Cambridge, MA, 1998.
[146] Lopez-Raton M, Rodriguez-Alvarez M, Cadarso-Suarez C, Gude-Sampedro F, Optimal Cutpoints: An R Package for Selecting Optimal Cutpoints in Diagnostic Tests, Journal of Statistical Software 61 (2015) 1-36.
[147] Sing T, Sander O, Beerenwinkel N, Lengauer T, ROCR Prediction Performance Plot, 2014, p. ROCR is a R statistics software package for graphing ROC curves
[148] Bellahsense Z, Duchateau F, Similarity Measure Parameters, Schema Matching and Mapping: Springer, 2011, p. 302-304.
[149] Harris PA, Taylor R, Thielke R, Payne J, Gonzalez N, Conde JG, Research electronic data capture (REDCap)--a metadata-driven methodology and workflow process for providing translational research informatics support, J Biomed Inform 42 (2009) 377-381.
116
[150] Mailman MD, Feolo M, Jin Y, Kimura M, Tryka K, Bagoutdinov R, et al., The NCBI dbGaP database of genotypes and phenotypes, Nature genetics 39 (2007) 1181-1186.
[151] Rahm E, Towards Large-Scale Schema and Ontology Matching, in: Bellahsense Z, Bonifati A, Rahm E, Schema Matching and Mapping: Springer, 2011, p. 3-28.
[152] Barney B, Message Passing Interface (MPI): Blaise Barney, Lawrence Livermore National Laboratory, computing.llnl.gov, 2015.
[153] Melnik S, Garcia-Molina H, Rahm E, Similarity Flooding: A Versatile Graph Matching Algorithm, 18th International Conference on Data EngineeingSan Jose, 2002, p. 117-128.
[154] Saeed M, Villarroel M, Reisner AT, Clifford G, Lehman LW, Moody G, et al., Multiparameter Intelligent Monitoring in Intensive Care II: a public-access intensive care unit database, Critical care medicine 39 (2011) 952-960.
[155] Physionet MIMIC-II Project IRB Approval, <http://mimic.physionet.org>.
[156] Jones K, A statistical interpretation of term specificity and its application in retrieval, Document retrieval systems: Taylor Graham Publishing, 1972, p. 11-21.
[157] How to Interpret a Correlation Coefficient, Making Everything Easier for Dummies: Wiley, Dummies.com, 2015.
[158] Cohen WW, Ravikumar P, E. FS, A comparison of string distance metrics for name-matching tasks, Carnegie Melon University School of Computer Science, 2003.
[159] Compositionality, in: Zalta EN, The Stanford Encyclopedia of Philosophy: The Metaphysics Research Lab Center for the Study of Language and Information, Stanford University. [160] Wilbur WJ, Rzhetsky A, Shatkay H, New directions in biomedical text annotation: definitions, guidelines and corpus construction, BMC Bioinformatics 7 (2006) 356.
[161] Phillips J, Statistical Principles: Data Mining, University of Utah Computer Science Department, 2015. [162] Petrova A, Ma Y, Tsatsaronis G, Kissa M, Distel F, Baader F, et al., Formalizing biomedical concepts from textual definitions, Journal of biomedical semantics 6 (2015) 22.