Embed Size (px)
Citation preview
Concept Based Author Recommender System for CiteSeer
Kannan Chandrasekaran
B.E., Computer Science and Engineering,
Arulmigu Kalasalingam College of Engineering, Krishnan Kovil
Madurai Kamaraj University,
India – May 2003
Master’s Thesis
Submitted to the Department of Electrical Engineering and Computer Science and the
Faculty of the Graduate School of the University of Kansas in partial fulfillment of the
requirements for the degree of Master of Science in Computer Science
Thesis Committee:
_______________________________Chairperson: Prof. Joseph Evans
_______________________________Co-Chairperson: Prof. Susan Gauch
_______________________________Dr. Arvin Agah
_______________________________Dr. Luke Huan
_______________________________ Date defended:
ii
The Thesis Committee for Kannan Chandrasekaran certifies
that this is the approved Version of the following thesis:
Concept Based Author Recommender System for CiteSeer
Thesis Committee:
_______________________________Chairperson: Prof. Joseph Evans
_______________________________Co-Chairperson: Prof. Susan Gauch
_______________________________Dr. Arvin Agah
_______________________________Dr. Luke Huan
_______________________________ Date Approved:
iii
AbstractThe information explosion in today’s electronic world has created the need for
information filtering techniques that help users filter out extraneous content to identify
the right information they need to make important decisions. Recommender systems are
one approach to this problem, based on presenting potential items of interest to a user
rather than requiring the user to go looking for them. In this paper we propose a
recommender system that recommends research papers of potential interest to the author
from the CiteSeer database. For each author participating in the study, we create a user
profile based on their previously published papers. Based on similarities between the
user profile and profiles for documents in the collection, additional papers are
recommended to the author. We introduce a novel way of representing the user profiles
as tree of concepts and an algorithm for computing the similarity between the user
profiles and document profiles using a tree-edit distance measure. Experiments with a
group of volunteers show that our tree based algorithm provides better recommendations
than a traditional vector-space model based technique.

iv
To Almighty and my Family

v
Acknowledgements
I would like to express my deepest gratitude to Dr. Susan Gauch for the opportunity she
gave me to work with her. I am amazed and thankful to the patience she showed in
answering the infinite number of questions that I asked her. Her association has helped
me grow both professionally and personally. I thank her for the constant support and
guidance that she provided not only during this research work but throughout my
Master’s Degree
I am honored and thankful to Dr. Joseph Evans, for agreeing to be the chair of my thesis
committee and to Dr. Arvin Agah and Dr. Luke Huan for agreeing to be part of my
committee. Their valuable feedback has helped me improve my work. I also thank the
committee for their willingness to attend my Thesis defense in spite of the bad weather
on that day. Special Thanks to Students, Praveen Lakkaraju and Mirco Speretta for their
timely help during my research work. Their inputs really helped me familiarize with the
existing system which enabled me to complete my research work on time.
I would also like to thank my Family and all my Friends who have helped me in every
aspect of my life. I am forever indebted to them for their continuous support. Lastly I
thank the almighty without whom none of the wonderful things that has happened to me
would have been possible. I thank him for the Courage, Wisdom and Hope that he gives
me everyday to face the challenges in life.
vi
Table of Contents
Abstract ........................................................................................................................... iiiChapter 1: Introduction .................................................................................................... 21.1 Motivation.................................................................................................................. 2Chapter 2: Related Work ................................................................................................. 52.1 Content Based Recommender Systems: .................................................................... 62.2 Collaborative Filtering Recommender systems:...................................................... 122.3 Hybrid Recommender systems: ............................................................................... 17Chapter 3: Approach ..................................................................................................... 243.1 Overview.................................................................................................................. 243.2 System Architecture................................................................................................. 24
3.2.1 Classifier: ......................................................................................................... 253.2.2 Profiler: ............................................................................................................ 263.2.3 Recommender: ................................................................................................. 283.2.4 Time Vs Timeless: ........................................................................................... 33
Chapter 4: Evaluations and Results ............................................................................... 344.1 Data set.................................................................................................................... 354.2 Subjects ................................................................................................................... 354.3 Baseline Vector Space Method:.............................................................................. 364.4 Conceptual Recommendation Method:................................................................... 374.5 Experiments ............................................................................................................ 38
4.5.1 Naming Conventions: ...................................................................................... 384.5.2 Collecting User Feedback ................................................................................ 404.5.3 Evaluation Metric............................................................................................. 424.5.4 Results.............................................................................................................. 43
Chapter 5 Conclusions and Future work........................................................................ 535.1 Conclusions.............................................................................................................. 535.2 Future Work ............................................................................................................. 54References...................................................................................................................... 56
vii
List of Figures
FIGURE 2. 1 ALGORITHM FOR LEARNING SHORT AND LONG TERM INTERESTS .................... 8
FIGURE 2. 2. GRAPHICAL MODEL REPRESENTATION FOR FLEXIBLE MIXTURE MODEL ...... 12
FIGURE 2. 3 GRAPH BASED MODEL FOR RECOMMENDER SYSTEM..................................... 22
FIGURE 3. 1 AUTHOR RECOMMENDER SYSTEM FOR CITESEER .......................................... 25
FIGURE 3. 2. ALGORITHM FOR CONVERTING VECTOR OF CONCEPTS TO TREE OF CONCEPTS
................................................................................................................................... 31
FIGURE 4. 1 REGISTRATION PAGE OF EVALUATION SYSTEM............................................. 36
FIGURE 4. 2 SCREEN SHOT 1 OF EVALUATION SYSTEM...................................................... 41
FIGURE 4. 3 SCREEN SHOT 2 OF EVALUATION SYSTEM...................................................... 42
FIGURE 4. 4. EXPERIMENT TO TEST HYPOTHESIS 1 ............................................................ 45
FIGURE 4. 5 BEST OF TREE OF CONCEPTS ALGORITHM ...................................................... 46
FIGURE 4. 6. TREE OF CONCEPTS VS. VECTOR OF CONCEPTS VS. BASELINE....................... 47
FIGURE 4. 7. EXPERIMENT TO TEST HYPOTHESIS 2 ............................................................ 49
FIGURE 4. 8. BEST OF TIME VARIANT ALGORITHM ............................................................ 50
FIGURE 4. 9 TIME INVARIANT VS. TIME VARIANT VS. BASELINE ....................................... 51
2
Chapter 1: Introduction
1.1 MotivationThe web has grown tremendously since its inception. Traditional search engines gave the
same results to all the users without considering their specific user needs. However the
nature of information available on the web, its applications, and its user base has
diversified significantly. In addition, a user’s ability to locate relevant content would be
based on their ability to construct good queries. This has lead to the development of
systems that identify the needs of individual users and provide them with very specific
information to satisfy their requirements. “Recommender systems” which recommend
items to the users by capturing their interests and needs, are one approach to
implementing personalized information filtering systems [20].
Recommender systems have been used to recommend different types of items. For
example, websites like Amazon.com use recommendation engines to make personalized
recommendations of the products to its users, and digital libraries like CiteSeer [23] make
recommendations of technical papers to its users. Most existing recommender systems
use a form of recommendation called as collaborative filtering [22]. In this approach,
every user in the system has a neighborhood of similar users who share many of the
current user’s interests. The recommendations provided for the current user are provided
as a function of ratings provided by the users in their neighborhood. However, this
approach requires the availability of sufficient number of ratings for the items which is
always not the case. Even when there are a large numbers of users to provide
recommendations and large numbers of items to be recommended; only a small portion
3
of items receive a sufficient number of ratings to form the neighborhood. Consequently,
the recommendations are isolated to only a subset of the available items. Also, when a
new item is introduced, there are no ratings available for its recommendation. These
problems can be avoided if the recommendation is based on the content of the item.
Digital libraries such as CiteSeer consist of mostly textual data. Previous research has
shown that recommendation is a very valuable service to the users of digital libraries
[21]. The large amount of textual information can be leveraged to provide content based
recommendations. Traditional content based recommender systems [24] have used the
TF-IDF [3] similarity measure to compute the similarity between documents. In this
model, the documents are modeled as vector of keywords and similarity is computed
using a distance metric such as cosine similarity measure. However, this model relies
heavily on the exact keyword match and does not consider factors like synonyms of the
words, polysemy, i.e., words with multiple related meanings, or other ambiguities present
in natural language. Our work is based on the belief that such issues can be addressed if
the documents are represented in a way that the main idea/topic is included in its
representation. In this work, we propose a content based recommender system called
“Author Recommender” that represents documents and the user profiles as trees of
concepts and computes the similarity between the documents and user profile using a
simplified version of the tree-edit distance algorithm.

4
This thesis has two main objectives:
1. Study the effectiveness of using concept trees for providing technical paper
recommendations in a digital library like CiteSeer.
2. Study the influence of year of publication on the recommendations to the user.

5
Chapter 2: Related WorkIn this chapter, we review some of the work done by others on recommender systems.
Recommender systems typically have a utility function that identifies the usefulness of an
item to the user of the item. Given a set of users and items, the main idea of the
recommender system is to select items for users so as to maximize this utility function.
This utility function is generally represented to the user as a set of ratings from a
particular scale, i.e., (1-5, 1-10, etc,) or as a list of Top N recommendations. There are
three major categories of recommender systems:
1) Content based recommender systems: These recommend new items to the user
based on the content of the previously purchased/used items.
2) Collaborative filtering recommender systems: These try to simulate the word of
mouth phenomenon practiced by humans by recommending items based on the
likes/dislikes of other users. They are especially useful for recommending non-
textual items such as music, movies, products, etc., where it is difficult to extract
the content of the item.
3) Hybrid recommender systems: These systems usually combine both collaborative
and content based recommendation approaches.
In the sections below, we discuss some examples of the different types of recommender
systems with more emphasis given to recommendation systems for textual data such as
book recommendations and digital library recommendations since these are directly
related to our work.
6
2.1 Content Based Recommender Systems: In this section, we describe some of the applications where content based
recommendations have proven to be useful. [8] and [10] describe the application of
recommendation engines to the problems of distributing conference papers to conference
reviewers and suggesting news items to the users of a mobile device, respectively. [18]
takes a slightly different approach and focuses on the problem of recommending novel
items instead of just recommending known items. Various algorithms for detecting
novelty and redundancy have been proposed and evaluated.
In [8], the authors model the task of assigning technical papers to conference reviewers as
a problem of recommending the papers to the authors based on their interests. They
propose a system wherein they analyze the effect of combining different sources of
information using WHIRL [9], an information integration system, on problem of
recommendation. WHIRL is a conventional database with an extension to handle
heterogeneous sources of text based on similarity of values instead of using just the strict
equality measure. The similarity is computed based on the TF-IDF [3] scheme. Using
WHIRL, the multiple information sources are handled in two ways:
1) QueryConcat: In this method, multiple sources are combined into a single
source by taking the union of the words appearing in the two sources before
including it as part of the query submitted to the database.
2) QueryConjunct: In this method, the multiple sources are included in the query
independently as part of its WHERE clause. The final similarity score is
computed as the product of the individual similarity scores.
7
They consider two main sources of information, papers and reviewers. Each is
represented as vector of keywords. The paper sources include information obtained from
title, abstract, and a set of keywords from a pre-specified list. The information sources for
the reviewers include the reviewer’s home page and the papers that are referenced from
the home page. Using WHIRL, each comparison between a reviewer’s representation and
the paper representations is implemented as a query that returns a rank ordered list of
papers. A score is then assigned to each query based on the some evaluation measure
such as “precision” at Top N.
They evaluated their algorithms on a set of 256 papers submitted to the AAAI-98
conference using the actual preferences stated by the 122 reviewers as the ground truth
value. They used the random assignment of papers as their baseline method. Results of
their experiments showed that the “QueryConcat” method performed better than the
“Query Conjunct” method and their method outperformed the baseline by a factor of 2 to
5. They achieved their best result when the abstract was treated as the paper source and
the homepage was treated as the reviewer source. They also found that as adding more
information sources to the WHIRL query led to better results.
[10], describes a content based recommender system for recommending news items for
users of handheld devices such as PDA’s and cell phones. Implicit information is
collected and is modeled as a profile describing the user’s interest. A content based
machine learning algorithm then learns this model and provides recommendations for the
news items. The central component of the system is an Adaptive Information Server
8
(AIS) that maintains a database containing information on current news items and
personal user preferences. The news items are categorized into different categories such
as top stories, politics, business, etc. that are displayed as menus in user interface of the
handheld device. As the user navigates through the interface, news items are presented as
headlines. These headlines are rank ordered according to the user profiles. Selecting a
headline fetches its first paragraph and is treated as positive feedback. Scores are
assigned incrementally as more and more information is requested for the news item from
the server. In contrast, skipping a story is treated as a negative feedback. The algorithm
used for learning the user profiles modeled both the short term and the long term interests
of the user. The short term model is based on the Nearest Neighbor text classification
algorithm [11] that represents the news items as vector of keywords and the long term
model used a probabilistic learning algorithm, a naïve Bayesian classifier that assessed
the probability that a news item is interesting give a specific set of features representing
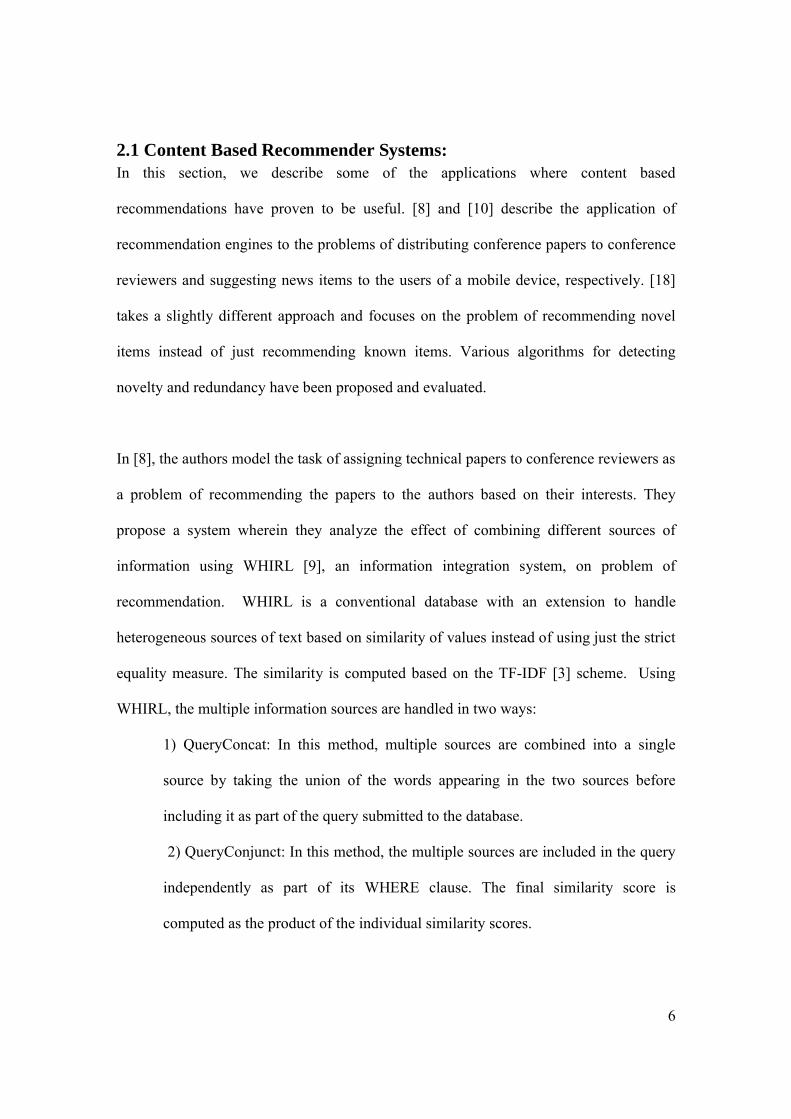
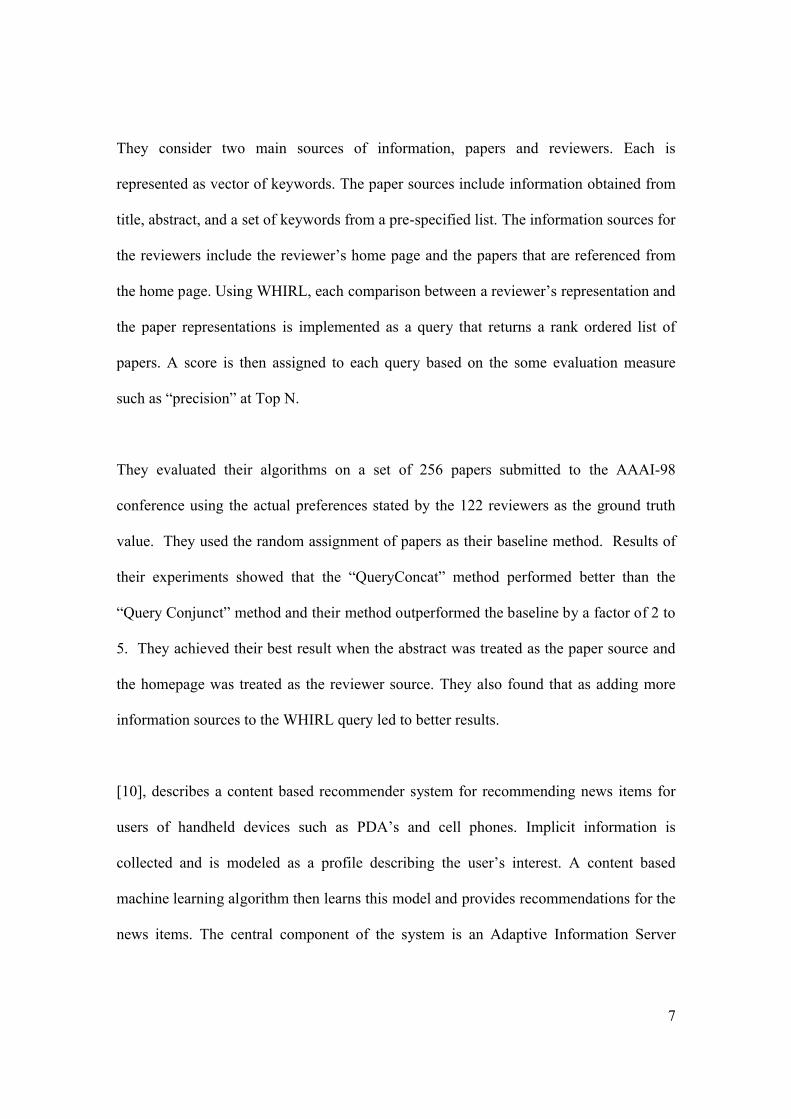
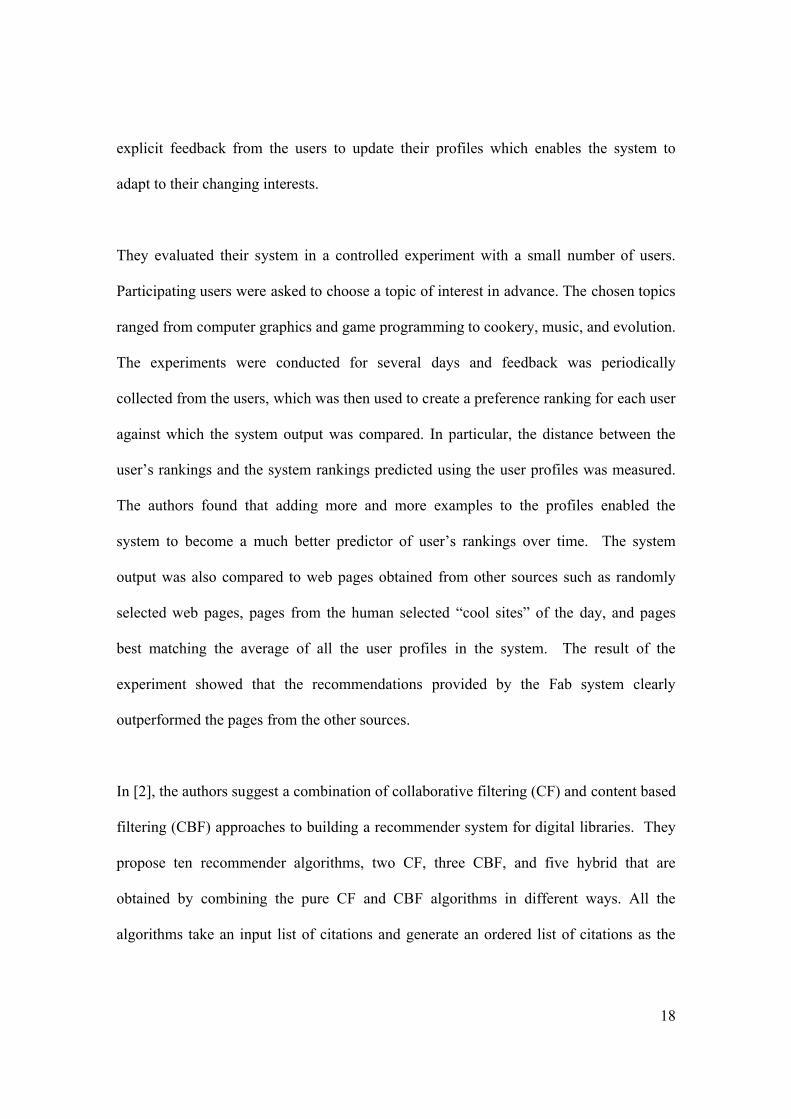
the news item. The learning algorithm can be summarized as shown in the figure 2.1:
Figure 2. 1 Algorithm for Learning Short and Long Term Interests
If the Story can be classified by short term model{
Score = weighted average over nearest neighborsIf story is too close to known story
Score = score * SMALL_CONSTANT}
Else{
If Story can be classified by long term modelScore = probability estimated by naïve Baye’s
ElseScore = DEFAULT_SCORE
9
They evaluated their approach by comparing their adaptive news items with static news
items without any personalization. They conducted their experiments for a period of ten
days and measured the mean rank of all the stories selected by the users. They found that
the personalized stories were on the top 2 headline positions 93.6 % of the time when
compared to 72.8 % for the static news items. They concluded that effective
personalization can be achieved without requiring any extra effort from the user.
In [18], the authors propose algorithms for extending information filtering systems to
identify novelty and redundancy of relevant documents. They propose solutions for
overcoming the common problem of distinguishing between relevant documents
containing new information and relevant documents that contain already known
information. The task of identifying redundant information is divided into two stages:
1) calculate a redundancy score for each document with respect to a user profile,
2) identify documents with redundancy scores above a specific threshold.
The first of the two points mentioned above is the focus of their research paper. The
algorithms for calculating a redundancy score for the document discussed below:
Let,
A, B: sets of documents,
dt: a document being evaluated for redundancy at time t,
D (t): set of all documents delivered to the profile before time t,
DR (t): set of all relevant documents delivered to the profile.
R (dt): redundancy measure for dt,
di: a relevant document delivered before dt
10
Set Difference: The documents are represented as set of words. It is based on the
idea that a word wi occurring frequently in dt but not in di represents some new
information in dt. The corpus specific and topic specific stop words are smoothed
by dividing the document’s word frequencies with the word counts from the
previously seen documents. Thus, redundancy measure of document dt given di
is,
R (dt| di) = | Set (dt ) (intersect) Set’(di )|
Where:
Wj belongs to Set (d) iff Count(Wj ,d) > k
Count (Wj, d) = alpha1 * term frequency of word Wj in document d +
alpha2 * no. of filtered documents that contain Wj + alpha3
* no. of delivered relevant documents that contain word Wj
Cosine Similarity: Here the documents are represented as vector of keywords and
the redundancy score between dt and di is measured as cosine of the angle
between the two vectors:
R (dt |di) = cos (dt, di)
Distributional similarity: Here a document d is represented as a unigram word
distribution Θ. The Kullback-Leibler (KL) [19], similarity measure is used for
measuring the redundancy of dt given di.
R (dt| di ) = -KL (Θdt ,Θdi )
= - ∑ P(Wj|Θdt ) log (P(Wj|Θdi ) / P(Wj|Θdt ) )
where θ is found using the Maximum likelihood estimation technique (MLE):
P(Wi |d ) = tf (Wi ,d) / ∑Wj tf (Wj , d)
11
Mixture Model: In this case the authors assume that the relevant document is
generated from three language models: 1) a general English language model “Θe”
which represent words such as “is” or “was” in the document, 2) topic specific
language model “Θt” that identify words representing the main topic of the
document and 3) document specific model “Θd”. As “Θd” represents the core
information of the document, the redundancy is computed using the KL measure
as :
R (dt| di) = KL (Θdt, Θdi)
Using this model, both relevant and redundant documents can be identified. If the focus is
to identify relevant document then similarity is computed using “Θt” which identifies
documents relevant to a particular topic whereas “Θd” can be used to identify redundant
documents by focusing on the actual content of the document.
The authors evaluated the different algorithms on a subset of data obtained from the
TREC CDs. For a total of 50 topics, assessors were asked to judge whether or not a
document was redundant, based on previously seen documents about a paticular topic.
Their judgments were considered as truth values. By running their algorithms on this test
data, they found that the Cosine similarity model and the Mixture model perfomed better
than the others.
As we can see, most of the current content based recommendation has only been applied
to textual data. This is because it is difficult to extract semantic features for the content of
non-textual data such as music or movies.
12
2.2 Collaborative Filtering Recommender systems: In this section we describe two model-based [25] approaches to collaborative filtering
applied to movie recommendation. [12], uses a probabilistic model for recommending
movies to the users whereas in [16] the authors apply dimensionality reduction
techniques such as singular value decomposition to reduce the complexity of the
collaborative filtering algorithm before applying the vector based model nearest
neighborhood calculation.
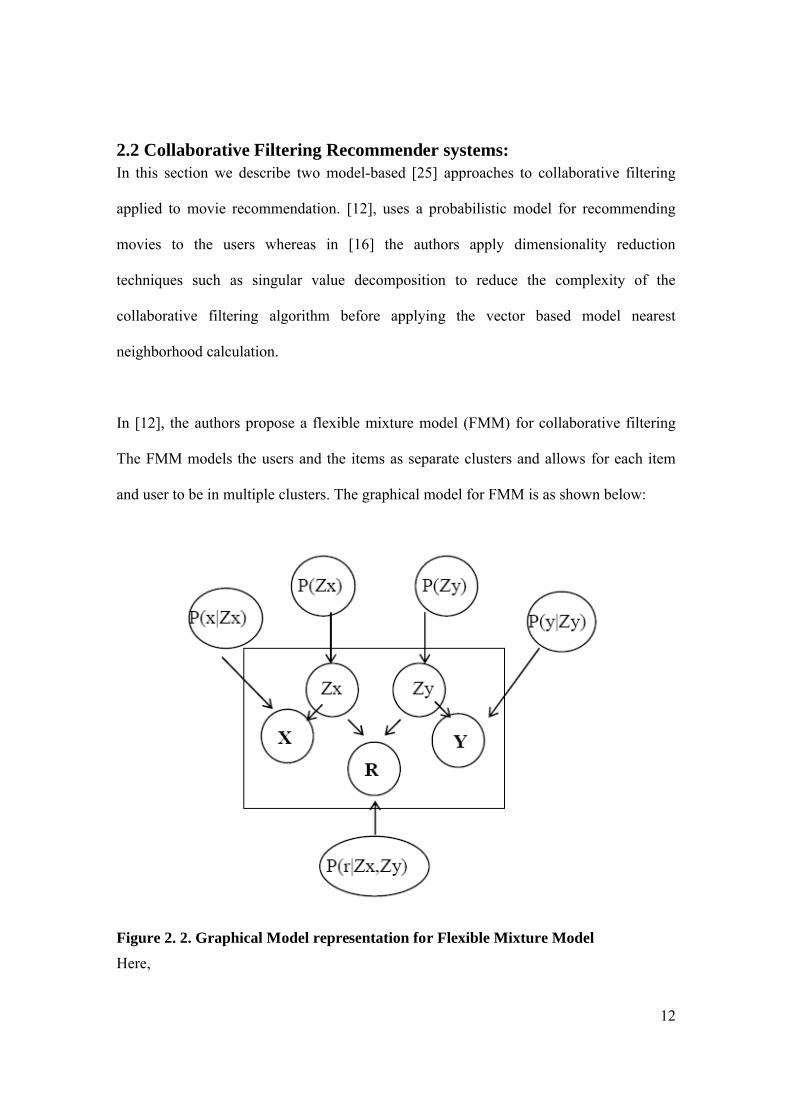
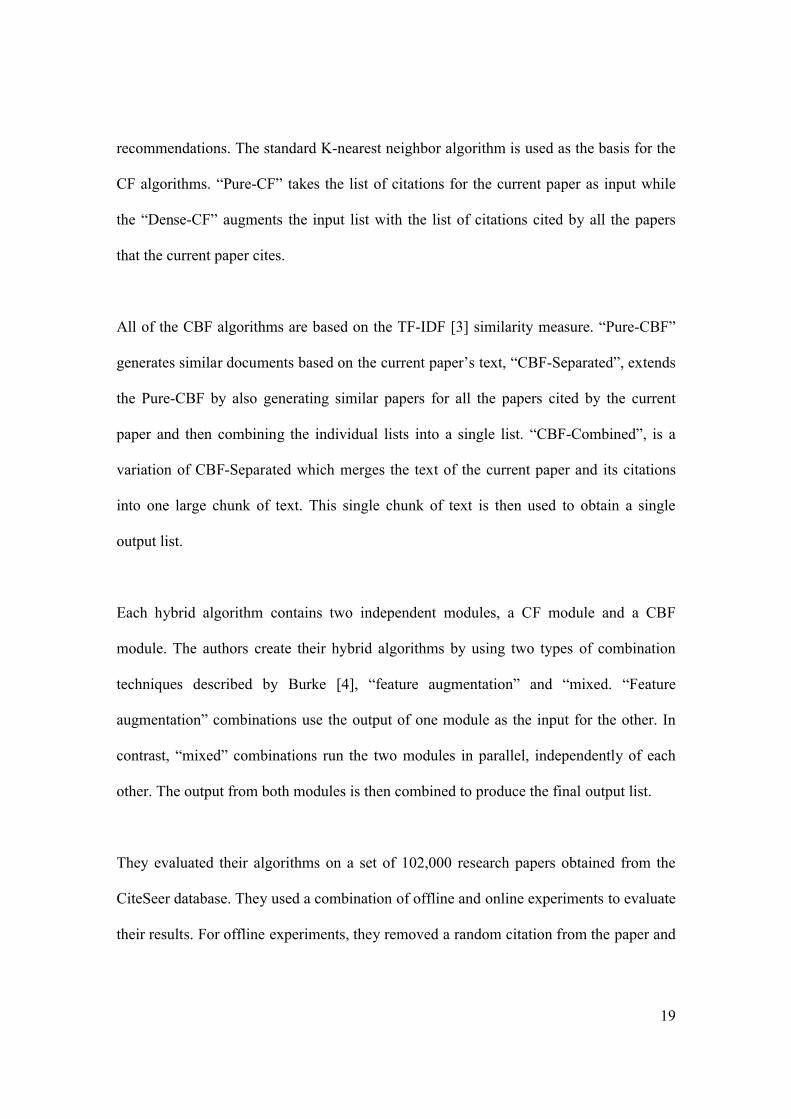
In [12], the authors propose a flexible mixture model (FMM) for collaborative filtering
The FMM models the users and the items as separate clusters and allows for each item
and user to be in multiple clusters. The graphical model for FMM is as shown below:
Figure 2. 2. Graphical Model representation for Flexible Mixture Model
Here,
13
X = number of items,
Y = number of users,
R = number of ratings,
Zx and Zy = Latent variables that indicate the class membership for items and users
respectively,
P (Zy) = multinomial distribution on the user classes,
P (Zx) = multinomial distribution on the item classes
P (X| Zx) = conditional probability of items X given a specific item class Zx,
P (Y| Zy) = conditional probability of users Y given a specific user class Zy,
P (r| Zx, Zy) = conditional probability of ratings r given a specific item class Zx and
specific user class Zy.
With the above annotations, the joint probability P(x, y, r) for FMM can be written as:
P(x, y, r) = ∑ P(Zx) P(Zy) P(x| Zx) P(y| Zy) P (r| Zx, Zy) (1)
The training procedure for building the model is carried out using a modified version of
EM algorithm [14] called Annealed EM algorithm [15]. The algorithm consists of two
stages. In the expectation stage, the joint posterior probabilities of the latent variables
{Zx, Zy} are calculated which are then used to update the model parameters in the
maximization step. A variable ‘b’ is introduced in the expectation stage as a control
parameter. The prediction ratings for the test user yt on unseen items is based on the set
of observed ratings for the test user yt. The core idea of the prediction process is to
estimate the joint probability of the rating, item and the test user and to predict the rating
with an expectation. The joint probability is calculated as shown below:
P(x, yt, r) = ∑ P(Zx) P(Zy) P(x| Zx) P(yt | Zy) P (r| Zx, Zy) (2)
14
The joint probability the prediction of rating on item x by user y is as given below:
Ryt (x) = ∑r * (P(x, yt, r) / ∑P(x, yt, r) ) (3)
The authors argue that even though two users A and B may have the same likes and
dislikes, their ratings may differ. For example, A may have a very strict nature and might
rate bad movies as 1 and good movies as 3, whereas user B with the same taste might
have a moderate nature and rate them as 3 and 5 respectively. To account for this
problem they suggest converting the ratings into the “true” preference ratings and use this
preference value instead of the ratings to make the predictions. They call this model as
“decoupled model” (DM). Two factors are taken into account when converting the
ratings into preference value viz. 1) the percentage of items with ratings <= ‘r’ and 2) the
percentage of items that have been rated as ‘r’. Based on this the preference probability
for rating ‘r’ from user ‘y’ can be given as:
P_Ry(r) = P (Rating <= r| y) – P (Rating = r| y)/2 (4)
Similarly the rating ‘r’ for an estimated preference value Vy(x) is given as the preference
probability that is closest to the estimated probability.
Ry(x) = argmin | P_Ry(r) - Vy(x) | (5)
The DM model can then be combined with the FMM to predict the ratings. The idea is to
first convert the ratings ‘r’ for the known items in the training database into their
corresponding preference values using DM model and then use this preference value to
predict the ratings on unseen items by converting the preference value back to ratings
15
using equation (5). They evaluated their algorithm on two datasets of movie ratings each
consisting between 100 – 400 users. They compared their algorithms with other
collaborative filtering algorithms like Pearson Correlation Coefficient method (PCC),
Vector similarity method (VS), Aspect model and Personality Diagnosis model
(PD).They found that the proposed FMM model performed better than all the other
algorithms. They also compared the performance of FMM with and without the DM and
found that the FMM/DM model outperformed the one without the DM model.
In [16], the authors describe experimental results of applying the singular value
decomposition (SVD), a dimensionality reduction technique to recommender systems.
Collaborative filtering systems have always had the problem of sparse ratings where there
isn’t enough overlap of items among the users and hence not much correlation among
them. By applying dimensionality reductions techniques like SVD the authors aim to
provide meaningful recommendations even for sparsely populated cases. The authors
apply SVD to:
1) Capture the relationships between the users and the products and use it to make
predictions that a user likes a particular product and
2) Produce a low dimensional representation of the user-product space, compute
the neighborhood information and use that to generate a list of Top N
recommendations for the customer.
By reducing the dimensionality of the input space the authors aim to reduce the
complexity of the nearest neighborhood calculations used by the collaborative filtering
algorithms.
16
To make predictions, they start with a sparse user-product matrix, fill in the null values
with product average, and normalize the matrix by subtracting the customer average for
each rating. Then, the steps mentioned in [17] are followed to obtain a low ranked
matrices Uk, Sk1/2, Vk. The dot product between the between the matrices Uk Sk
½ and Sk
½ Vk is used to compute the prediction for the new item. For generating the
recommendations they again apply the dimensionality reduction techniques mentioned
above and use the cosine similarity measure to form the neighborhood in the reduced
space. Once the neighborhood is formed, a frequency count list on all the products
purchased by the neighbors is generated. The list is then sorted to produce the Top N
recommendations for the target user.
They evaluated their algorithm on datasets obtained from ’MovieLens’ and an e-
commerce company. They used the CF algorithm, based on the Pearson nearest neighbor
algorithm, as their baseline for the prediction experiment and an algorithm that computes
the cosine similarity in high dimensional space to form the neighborhood as the baseline
for the recommendation experiment. The results showed that, for the prediction
experiment, the SVD algorithm performed better than the CF algorithm when the training
data was sparse. However, the CF algorithm performed better when sufficient training
data was available. For the recommendation experiment, the recommendation quality in
the low dimensional space performed better than their counterparts in the high
dimensional space.
17
2.3 Hybrid Recommender systems: Hybrid recommendations systems were developed to overcome the limitations of both the
content and the collaborative recommendation systems. Researchers identified that the
two systems complemented each other. [7], describes one of the earliest hybrid
recommendation engine developed to recommend web pages to its users. [2] and [5]
focuses on providing recommendations for digital libraries. While [2] uses a subset of
CiteSeer itself as its dataset, [5] describes the analogy between buying books in a e-
commerce book store and lending books in a digital library and uses data from a Chinese
e-commerce book store to evaluate its recommendation algorithm.
In [7], the authors propose ‘Fab’, a content-based collaborative recommender system for
recommending web pages to its users. The recommendation process consists of two
stages:
1) collection of items to create an index or database
2) selection of items from the database to a particular user.
The ‘Fab’ system is divided into three main modules, i.e., the selection agent, the
collection agent, and the central router. During the collection stage, pages relevant to
specific topics are gathered by the collection agent. The pages are then delivered to many
users at the selection stage by the selection agent. Each agent maintains a profile based on
the content of the web pages. The selection agent’s profile represents the interests of a
user whereas the collection agent’s profile represents a particular topic. A central router
acts as a controller module, receives the web pages from the collection agents, maps them
according to the user profiles and forwards them to the selection agents. Thus, each user
receives pages based on their selection agent profile. In addition, the selection agent uses
18
explicit feedback from the users to update their profiles which enables the system to
adapt to their changing interests.
They evaluated their system in a controlled experiment with a small number of users.
Participating users were asked to choose a topic of interest in advance. The chosen topics
ranged from computer graphics and game programming to cookery, music, and evolution.
The experiments were conducted for several days and feedback was periodically
collected from the users, which was then used to create a preference ranking for each user
against which the system output was compared. In particular, the distance between the
user’s rankings and the system rankings predicted using the user profiles was measured.
The authors found that adding more and more examples to the profiles enabled the
system to become a much better predictor of user’s rankings over time. The system
output was also compared to web pages obtained from other sources such as randomly
selected web pages, pages from the human selected “cool sites” of the day, and pages
best matching the average of all the user profiles in the system. The result of the
experiment showed that the recommendations provided by the Fab system clearly
outperformed the pages from the other sources.
In [2], the authors suggest a combination of collaborative filtering (CF) and content based
filtering (CBF) approaches to building a recommender system for digital libraries. They
propose ten recommender algorithms, two CF, three CBF, and five hybrid that are
obtained by combining the pure CF and CBF algorithms in different ways. All the
algorithms take an input list of citations and generate an ordered list of citations as the
19
recommendations. The standard K-nearest neighbor algorithm is used as the basis for the
CF algorithms. “Pure-CF” takes the list of citations for the current paper as input while
the “Dense-CF” augments the input list with the list of citations cited by all the papers
that the current paper cites.
All of the CBF algorithms are based on the TF-IDF [3] similarity measure. “Pure-CBF”
generates similar documents based on the current paper’s text, “CBF-Separated”, extends
the Pure-CBF by also generating similar papers for all the papers cited by the current
paper and then combining the individual lists into a single list. “CBF-Combined”, is a
variation of CBF-Separated which merges the text of the current paper and its citations
into one large chunk of text. This single chunk of text is then used to obtain a single
output list.
Each hybrid algorithm contains two independent modules, a CF module and a CBF
module. The authors create their hybrid algorithms by using two types of combination
techniques described by Burke [4], “feature augmentation” and “mixed. “Feature
augmentation” combinations use the output of one module as the input for the other. In
contrast, “mixed” combinations run the two modules in parallel, independently of each
other. The output from both modules is then combined to produce the final output list.
They evaluated their algorithms on a set of 102,000 research papers obtained from the
CiteSeer database. They used a combination of offline and online experiments to evaluate
their results. For offline experiments, they removed a random citation from the paper and
20
checked to see if the citation was recommended by their algorithms. They also conducted
an online study in which participants were asked to rate the recommendations. They
found that different algorithms produced better recommendations depending on the genre
of papers. Some were better at recommending broad overview papers, such as survey or
overview papers whereas others were better at recommending introductory papers, or
novel papers, etc. However, in general, the Fusion algorithm performed significantly
better than all the other algorithms.
Other approaches treat the problem of recommendations as a graph search problem. In
[5], the authors describe a graph based hybrid recommender system applied to
recommending books for a Chinese book store. The online records for the book contents,
customer information, purchase histories in the book store are analogous to the document
content information, user’s personal attributes, and their usage history in the digital
library environments. They model the information obtained from the bookstore as a two
layered extended graph that incorporates book-to-book, user-to-user, and book-to-user
correlations.
Their approach consists of two stages of computation. In the first stage, the customers
and the books are represented as feature vectors. The feature vector for the customer is
comprised of the customer’s demographic data and the feature vector for the book
consists of both the attributes of the book such as author, edition, and publisher, as well
as content extracted from the title and body. Tin the second stage, book-to-book
similarity and user-to-user similarity is computed using some similarity function. In the
21
second stage, the books, customers, and purchase histories are modeled as a two layered
graph. The first layer is called the book layer wherein a book is represented as a node and
the links between the nodes represent similarity between the books. The second layer is
called the customer layer wherein a customer is represented as a node in the graph and
the similarities between customers are represented by the links between the nodes. These
two layers are then connected by links representing the purchase of the book by a
customer. Each link in the graph has a weight between 0 and 1 that represents the degree
of similarity between the nodes. Once this model is set up, the recommendation activity
reduces to a graph search task.
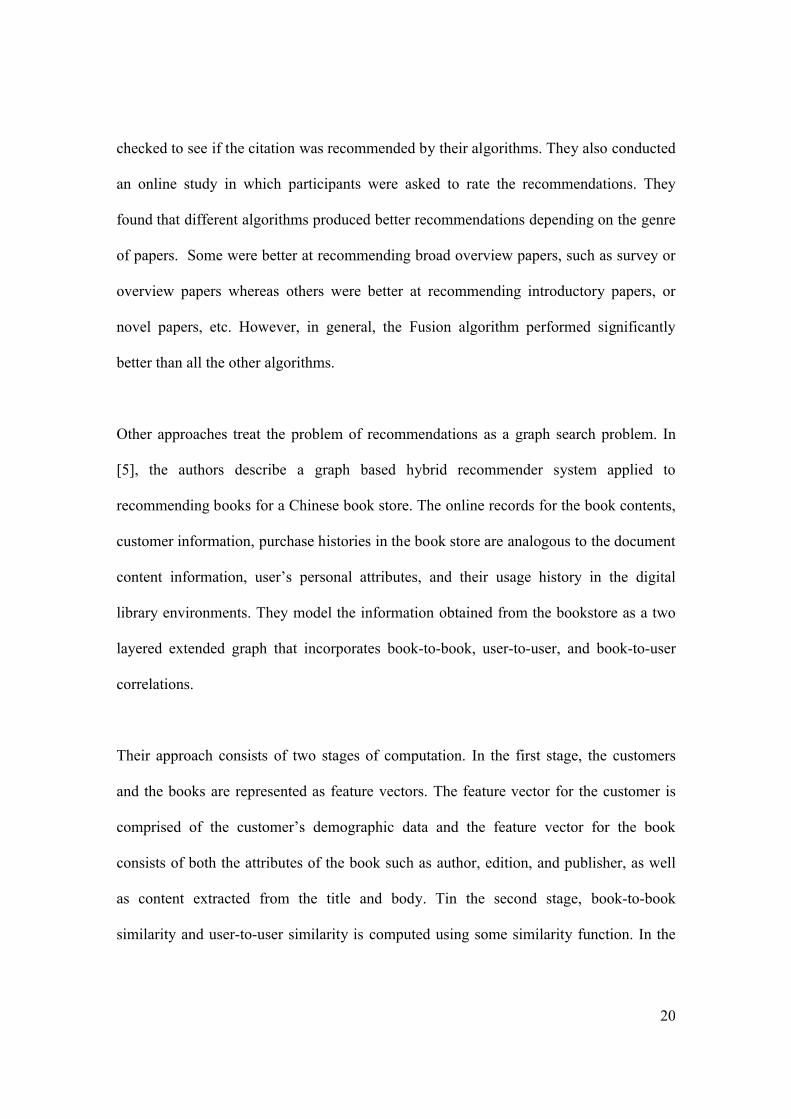
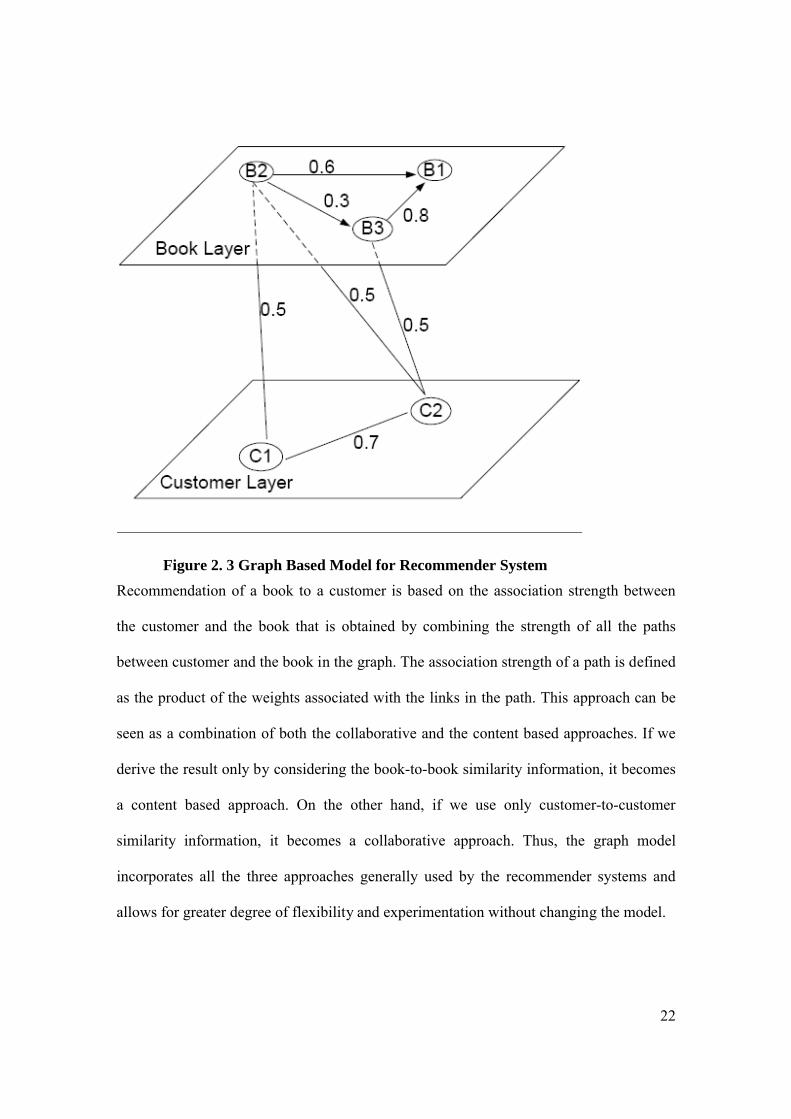
For example, consider the following sample graph. The book layer consists of 3 books
B1, B2, B3 and the customer layer consists of 2 customers C1 and C2. The degree of
similarity is represented by the weights associated with the links between the nodes in the
graph.
22
Figure 2. 3 Graph Based Model for Recommender System
Recommendation of a book to a customer is based on the association strength between
the customer and the book that is obtained by combining the strength of all the paths
between customer and the book in the graph. The association strength of a path is defined
as the product of the weights associated with the links in the path. This approach can be
seen as a combination of both the collaborative and the content based approaches. If we
derive the result only by considering the book-to-book similarity information, it becomes
a content based approach. On the other hand, if we use only customer-to-customer
similarity information, it becomes a collaborative approach. Thus, the graph model
incorporates all the three approaches generally used by the recommender systems and
allows for greater degree of flexibility and experimentation without changing the model.
23
The authors evaluated their system on a dataset containing 9,695 books, 2,000 customers,
and 18,771 transactions. They experimented with both a simple different weight
propagation algorithms and found that the hybrid approach outperforms both the pure
content based and the pure collaborative approaches [6]. They also conducted a
subjective evaluation of their recommendations using human evaluations and found that
the content based approach outperformed both the collaborative and the hybrid
approaches. Thus, the message produced by this study is mixed.
From the survey above, we can see that most pure content based recommendation
systems represent the user profiles as vectors of keywords and use TF-IDF for similarity
calculations whereas pure collaborative recommendation systems try to generate a model
from the existing data and make predictions using the model. Our work is similar to the
other content based recommender systems in that the profile information for the user is
generated based on the actual content of the data, however like [5] we differ in the way
the profile information is modeled. [5], models them as a graph and treats the
recommendation as graph search problem while we model them as a tree of concepts and
obtain the recommendations using a tree similarity algorithm.
24
Chapter 3: Approach
3.1 OverviewThe Author Alert system for CiteSeer recommends papers by first constructing a
conceptual profile for each document in the collection. It then creates a conceptual user
profile for an author. It then uses similarities between these profiles to find papers of
interest for an author.
As part of [27], all the documents in CiteSeer were categorized into a predefined set of
concepts according to the ACM's Computing Classification system taxonomy [28]. This
taxonomy is 3 levels deep with 368 concepts. Thus, each document in the CiteSeer has an
associated set of concepts that represent the central ideas in the document. We extract this
concept information associated with each of the author’s publications from the CiteSeer
database to construct the user profile. The CiteSeer database is then searched for
documents that are represented by a similar set of concepts as those present in the user
profile using a similarity computation algorithm. The top N papers from the final list are
output as recommended papers for the author. The classification of documents into
predefined set of concepts is done by the classifier module. The profile building is done
by the profiler module and the similarity comparison is then done by the Recommender
module. Each of these modules is explained in detail in the following sections.
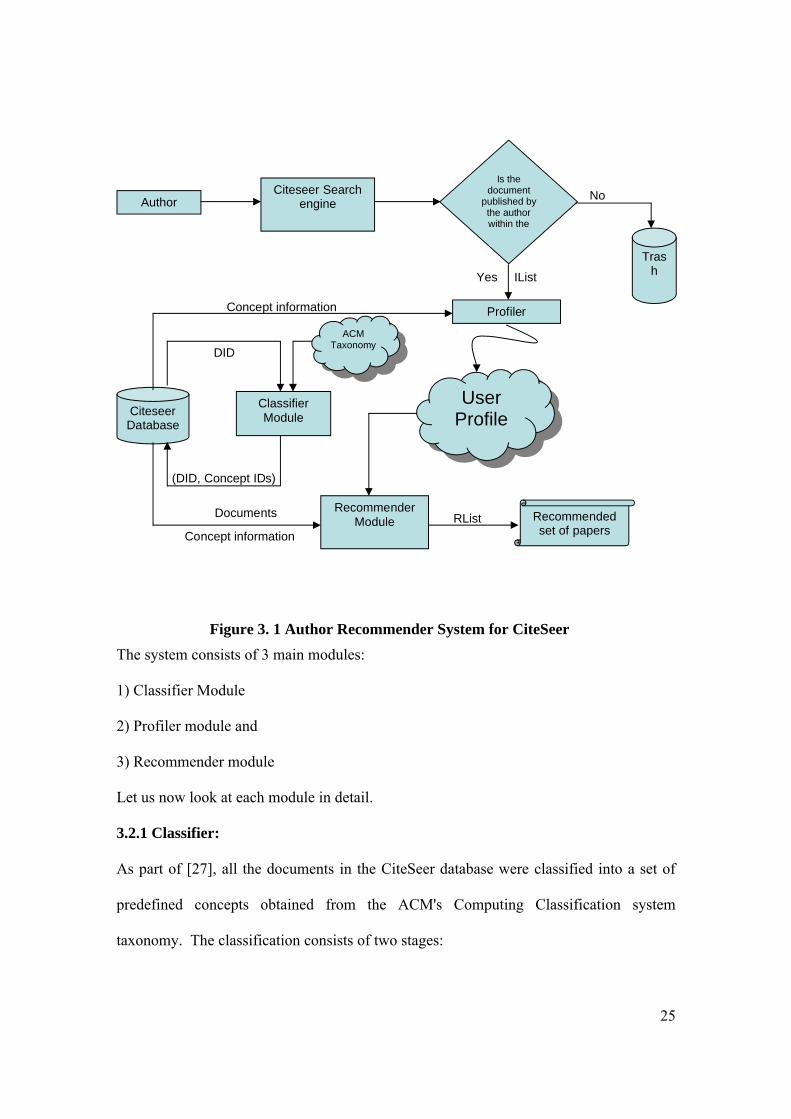
3.2 System ArchitectureThe Architectural diagram for the Author Recommender system for CiteSeer is shown
below:
25
Figure 3. 1 Author Recommender System for CiteSeer
The system consists of 3 main modules:
1) Classifier Module
2) Profiler module and
3) Recommender module
Let us now look at each module in detail.
3.2.1 Classifier:
As part of [27], all the documents in the CiteSeer database were classified into a set of
predefined concepts obtained from the ACM's Computing Classification system
taxonomy. The classification consists of two stages:
Author Details
Citeseer Search engine
Profiler
Recommender Module
Citeseer Database
Documents
Concept information
RList Recommended set of papers
User Profile
Is the document
published by the author within the
specific time
Concept information
IList
TrashYes
No
ClassifierModule
DID
(DID, Concept IDs)
ACM Taxonomy
26
1) Training stage: During this stage, certain documents are pre-assigned one or more
concepts in the taxonomy either manually or by some other method. These
documents form the training set for the classifier. The classifier uses these
training set to learn the model for each concept in the taxonomy.
2) Classification stage: In this stage the classifier uses the model learnt in the
training stage to classify the input documents. The output is a list of concepts for
each input document along with their corresponding weights which indicate the
degree of association between the concept and the document. The top 3 concepts
for each document were retained and stored in the CiteSeer database.
Experiments with KNN, SVM and Rocchio classifiers showed that Rocchio gave the best
performance and hence Rocchio classifier was used for classifying all the documents in
the CiteSeer database.
3.2.2 Profiler:
The main objective of the profiler module is to create a user profile for the author, for
whom we are trying to recommend papers. The user profile attempts to capture the
interests of the author at a higher level of abstraction than provided by keywords. The
input to the profiler module is a list of documents from the CiteSeer database that were
published by the author within a particular time frame. We have considered a time period
of eleven years from 1994-2005 for our experiments. We retrieve this list by querying the
CiteSeer search engine with the author's first, last or other common names used by them
in their publications. The result of the query is then manually examined to ensure that the
27
author indeed is the publisher of the document and if the publication date is within the
considered time period. The documents not published by the author that are retrieved
because they contain the author's name as text or in a citation are discarded manually. Let
us call this list of documents the input list, or IList, for the author. This IList is then
provided as input to the profiler module.
As mentioned earlier, each document in the CiteSeer database has 3 concepts associated
with it and is represented as a list of (concept, wt) pairs. The wt represents the degree of
strength of association between the document and the associated concept as calculated by
the document profiling system. We use this category and weight information to construct
the user profile. For each document in the IList, we retrieve the set of associated concepts
and sort them in decreasing order by wt. If two or more documents are associated with
the same concept then the wt contributed by each document is added to represent the final
wt for that particular concept in the user profile.
wt(cpj) = ∑ wt(dk, cp) , for all k documents in the IList
where
wt (cpj) = wt of concept c in the profile p of author j
wt (dk, cp) = wt of the document dk associated with concept c
Thus, the output of the profiler module is a vector of (concept, wt) pairs which
encapsulates the interest areas of the author.
28
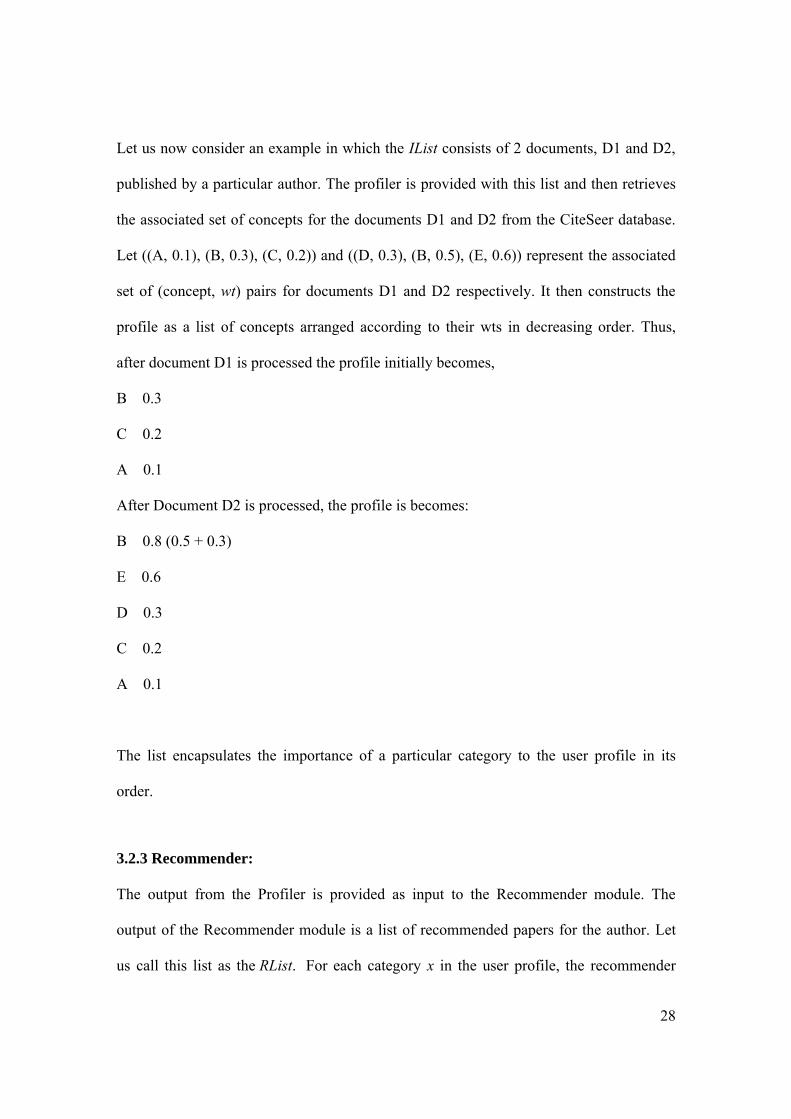
Let us now consider an example in which the IList consists of 2 documents, D1 and D2,
published by a particular author. The profiler is provided with this list and then retrieves
the associated set of concepts for the documents D1 and D2 from the CiteSeer database.
Let ((A, 0.1), (B, 0.3), (C, 0.2)) and ((D, 0.3), (B, 0.5), (E, 0.6)) represent the associated
set of (concept, wt) pairs for documents D1 and D2 respectively. It then constructs the
profile as a list of concepts arranged according to their wts in decreasing order. Thus,
after document D1 is processed the profile initially becomes,
B 0.3
C 0.2
A 0.1
After Document D2 is processed, the profile is becomes:
B 0.8 (0.5 + 0.3)
E 0.6
D 0.3
C 0.2
A 0.1
The list encapsulates the importance of a particular category to the user profile in its
order.
3.2.3 Recommender:
The output from the Profiler is provided as input to the Recommender module. The
output of the Recommender module is a list of recommended papers for the author. Let
us call this list as the RList. For each category x in the user profile, the recommender
29
module searches the CiteSeer database for documents which have the category x in its
associated category set. The number of categories (β) to be considered from the user
profile is passed in as a parameter to the recommender module. If a match is found, the
document is added to the RList. When adding the document to the RList the wt associated
with the category x in the profile is multiplied by the wt associated with the document.
wt(i, j) = wt(cpj) * wt(i, cpj)
where
wt(i,j) = the weight of document i added to the RList for author j
wt(cpj) = weight of concept c in the profile of author j
wt(i, cpj) = weight of document i associated with the same category c in the user
profile of author j
Finally, the document is checked to see if it was published within the time period
considered. If the year of publication does not fall within the desired time period, the
document is not added to the RList.
After processing the concepts in the user profile, the RList holds the list of document
identifiers (DIDs) that are associated with the concepts in the author’s profile. The final
step is to rank order these documents in decreasing order of their likely interest to the
author. Thus, for each document in the RList, the Recommender module retrieves all of
the associated categories. Next, it uses the "Conceptual Tree Edit Distance Algorithm"
[27] to compute the distance between the document and the user profile. This algorithm
30
calculates the cost of modifying the document profile to match the user profile. The
closer the two profiles, the lower the cost of the required modifications. Thus, the
Recommender module calculates the cost of transforming each document profile into the
author profile, which is effectively a measurement of the distance between the profiles. It
then sorts the documents in the RList in increasing order so that the closest documents
appear first and the most distant documents appear last. The closest 10 documents are
then displayed to the author as the recommended set of papers.
3.2.3.1 User-Document Distance Computation:
Let us now examine the “Concept Tree Model” that has been used to compute the
distance between the user profile and the documents in more detail. Traditionally, content
based recommendations used the vector space model for this purpose. In that model, the
documents are treated as a vector of keywords and the cosine similarity measure is used
to find the similarity between the documents. This model, although simple to implement,
assumes that the keywords in the vector are independent of each other which is often not
the case and it requires an exact match between the keywords. It does not take into
account the ambiguity of natural language due to factors such as synonymy and polysemy
Another way to look at this problem is to represent the documents based on their central
ideas instead of their keywords. We can achieve this by classifying the documents into a
predefined set of concepts using a text classifier and then represent the documents as
vector of concepts rather than a vector of keywords. However, we find that the categories
are often hierarchical in nature, having inter-relationships among themselves. By treating
31
the documents as vector of concepts, we are ignoring this hierarchical structure. To
exploit this natural inter-relationship, we make use of a document representation based on
a tree of concepts [27].
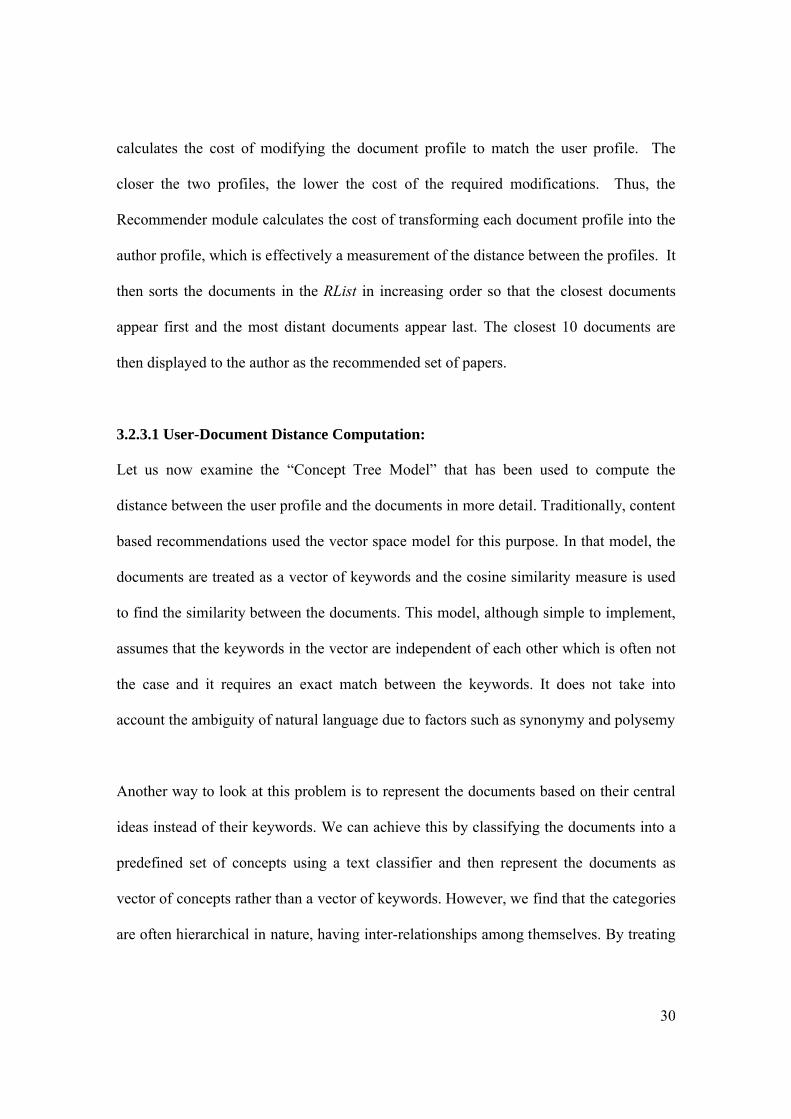
Figure 3. 2. Algorithm for Converting Vector of Concepts to Tree of Concepts
In this work, the Recommender module first converts the document and user profiles
from Vector of Concepts into Tree of Concepts using the algorithm shown in Figure 3.2.
The input to the algorithm is a Vector of Concepts representing the user or document
profile. The output of the algorithm is a weighted Tree of Concepts. This conversion is
performed by first adding each concept and its weight into the tree and then recursively
adding the parent concepts and their weights into the tree until the root of the taxonomy is
Tree vector_to_tree (Categories) {
for each cat in (Categories){
add_to_tree (cat, Tree); } return tree;}
void add_to_tree (category, Tree){
if(category == root) return;
else{
Tree.add (category);Tree.add (category.wt);parent = getParent (category);parent.wt += * category.wt;add_to_tree (parent, Tree);
}}
32
reached. Essentially, the concepts in the representations come from a hierarchical
concept space, and their weights are propagated up the tree until the (possibly disjoint)
subtrees are all reconnected. A tuning parameter called ‘’ is introduced to control the
percent of weight that is propagated by the child concept to its parent. The weight of the
Parent is calculated as follows:
Wtp += * Wtc
where
Wtp = Weight of the parent concept,
Wtc = Weight of the parent concept
= tuning parameter which varies between 0 and 1.
Once the user profile and the documents are represented as trees, the problem of
computing the distance between them is reduced to finding the distance between the two
trees. Based on previous research [27], we use the Tree-Edit distance measure to
calculate the cost of transforming one tree into another with the minimum number of
operations where operations are defined as follows:
1) insertion: Inserting a new node into the tree
2) deletion : Deleting a existing node from the tree
3) substitution: The cost of transforming the one node into another
The cost of deletion or insertion of a node is equal to the weight associated with the node
and the cost of substitution is equal to the difference between weights of the substituted
nodes. For a more detailed explanation please refer [27]
33
3.2.4 Time Vs Timeless: As one of our objectives, we study the influence of year of publication on recommending
technical papers to an author. In this work, we compare two approaches for
recommending relevant papers.
Time Variant: In this case more importance is given to recently published
documents over older documents. The assumption is that, among relevant papers,
the author is more interested in finding recent publications than older ones. This is
implemented by introducing a new parameter, time_wt. Based on their year of
publication; recently published documents receive more time_wt than the older
ones. To weigh the documents differently based on their age, the concept vectors
for the documents in the RList are pre-multiplied by time_wt before they are input
to the Recommender.
Time Invariant: As a baseline for comparison, in this case no importance is given
to the publication date. All documents receive a time_wt equal to 1.
34
Chapter 4: Evaluations and ResultsIn this chapter we evaluate the two goals stated in Chapter 1. To evaluate our first goal,
using concept trees in technical paper recommendations, we compare our concept tree
algorithm with the traditional vector based algorithm. By varying the parameter, we
generate the two versions of the concept tree algorithm, one where the weight associated
with the child concept is propagated to its parent concept ( > 0) and the other where the
weight associated with the child is not propagated to the parent concept ( = 0) which is
essentially a concept vector approach. We then compare the two versions of the concept
tree algorithm with the vector based algorithm. To evaluate our second goal (i.e.) the
influence of publication date on the recommendations to the user, we again vary the
‘time_wt’ parameter as mentioned in chapter 3 and obtain Time Variant and the Time
Invariant versions of the algorithm. We then compare the two versions with the vector
based algorithm. In all cases, comparisons between the algorithms were done based on
the ratings given by the users. In summary, our experiments were designed to test the
following two hypotheses:
Hypothesis 1: The algorithm computing the similarity using the Tree of concepts (
> 0) is better than the algorithm computing the similarity using vector of concepts (
= 0) which is in turn better than the algorithm computing the similarity using vector
of keywords.
Hypothesis 2: The year of publication of the document affects the interest of the
users positively; i.e., users would consider the more recent documents as better
recommendations than older documents.
35
4.1 Data setCiteSeer is a search engine and digital repository of scientific and academic papers. It is a
collection of over 700,000 documents primarily in the field of computer and information
science. We used a subset of that document collection published from 1994-2005 as the
dataset for carrying out our experiments.
4.2 SubjectsTo establish truth for the recommended documents, we conducted a user study. Since we
needed published authors as subjects (in order to use their publication records for the user
profiles), we contacted 20 computer science and computer engineering professors from
KU and other universities. Ultimately, 8 professors were included for the study, after
registering with the evaluation system. During registration, the professors entered basic
information such as their First Name, Last Name, Email Address and any common names
that they used in their published papers. This information is used when querying the
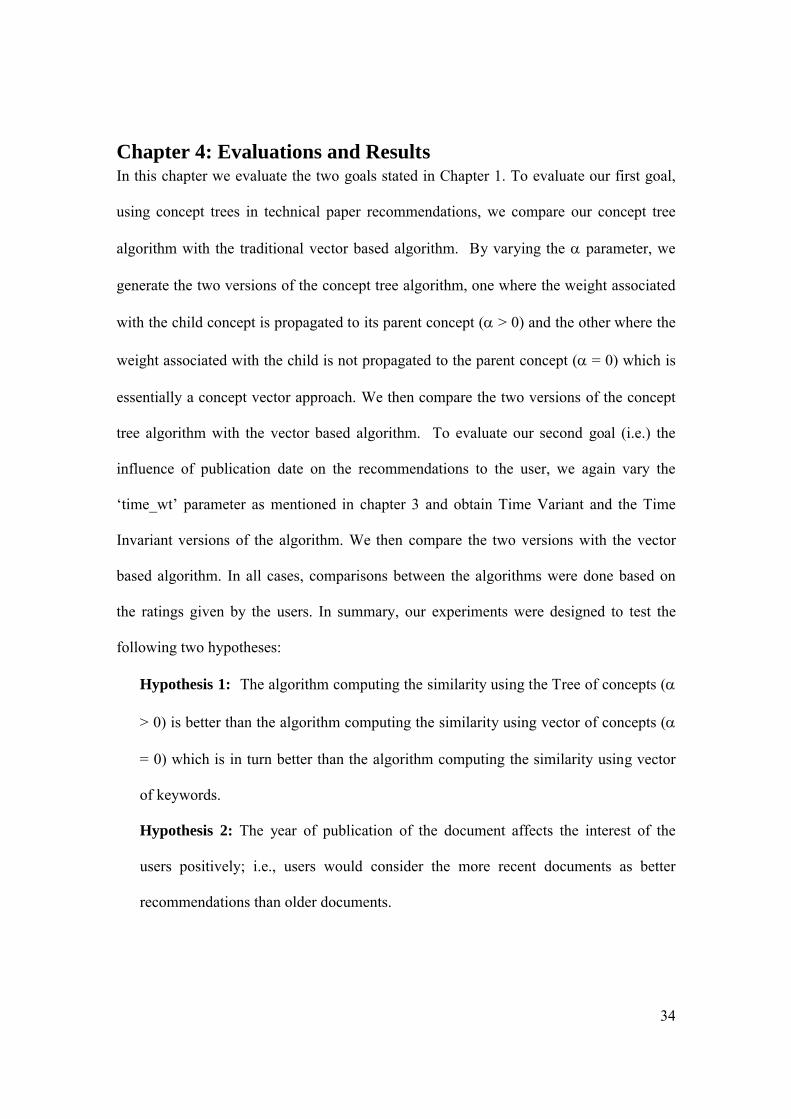
CiteSeer search engine for generating the IList. Figure 4.1 shows a screen shot of the web
interface for the registration process is as shown below:
36
Figure 4. 1 Registration Page of Evaluation System
After an author registers with a system, the common names are fed as query terms to the
CiteSeer search engine to obtain a list of papers containing the author’s name. This list is
then filtered as explained in chapter 3 to obtain the IList. The IList is then used to create
the user profile for the author that is used to recommend papers to them in the baseline
experiment and in our experiments on conceptual recommender systems.
4.3 Baseline Vector Space Method CiteSeer has a built-in recommender system that can compute the similarity between
documents using different semantic features [1]. The TF-IDF [3] scheme is used to
measure the similarity between documents by treating them as word vectors. CiteSeer
also uses the string matching algorithms to find the similarity between the headers in the
document. Headers contain the author, title, institution and other such information that is
given in the start of the document before its actual content. It can also use citations
37
present in the document as an indication of the document similarity. All the documents
cited by the document ‘A’ are handpicked by the author and hence is a direct
representation of its relatedness to document ‘A’. In addition, it can also use the location
of the citation within the document text to find the context in which the cited document is
related to document ‘A’.
As our baseline method for comparison, we have used the TF-IDF scheme implemented
by CiteSeer. In order to identify the most similar documents for a registered author, for
each document in the author’s IList, we use CiteSeer to retrieve the most similar
documents based on TF-IDF similarity. Thus, for each document in the IList, we get a list
of the most similar document in the database which includes the document identifier and
a weight signifying the degree of similarity. The list is presented in decreasing order by
similarity and the highest weighted ten documents for each IList document are retained.
These lists are then merged together to create the final list by including the unique
documents in each list in decreasing order of their weights. If more than one list
contained the same document then the weights belonging to each list is added together to
produce the final weight for that document. The top 10 documents from the final list are
then treated as the final set of recommendations produced by the baseline method and is
then presented to the author for evaluation.
4.4 Conceptual Recommendation Method The common names of the authors obtained from the registration process are input to the
CiteSeer search engine and the list of documents obtained as results are then filtered to
create the IList as mentioned in the section 3.2.2. The same IList is then used by the
38
baseline method for generating the recommendations and by the concept tree method to
generate user profile for the author. The profiler module uses the concepts associated
with each document in IList to construct the user profile. Once the user profile is
constructed the recommender module constructs a tree out of it and uses the tree
matching algorithm described in Section 3.2.3 to generate the set of recommendations for
the author.
4.5 Experiments 4.5.1 Naming Conventions:
In this section, we discuss the input parameters to the system, experiments conducted by
varying the input parameters and the outcome of the experiments.
As discussed in chapter 3, the Author Recommender system has three main input
parameters.
Weight Propagation factor (): This parameter determines the amount of weight
propagated by the child node to its parent during the similarity computation using
the concept tree algorithm. We test four different values, i.e., 0, 0.33, 0.67, 1.00,
of this parameter. When the weight propagation factor is zero, no weight
information is propagated from the child node to its parent. Thus the concepts are
treated as vectors instead of trees during the similarity computation.
Number of user profile categories (β): The user profile consists of a list of
(concept, wt) pairs. The number of such pairs to be considered from the list when
performing the similarity match is passed into the Recommender module as a
parameter. We considered three values viz. 15, 10 and 5 for this parameter in our
experiments. The authors whose user profile consisted of less than 15 categories
39
were not considered for our experiment. This was due to the lack of sufficient
number of author’s publications in the CiteSeer database. After such pruning we
had 8 authors at the end whose user profiles consisted of more than 15 categories.
These 8 authors form the basis for our experiments.
Time/ Timeless: As discussed in Chapter 3.2.4, the two cases are represented
using a Boolean flag called Time and is passed as a parameter into the
Recommender module. Time and the Timeless versions are represented when the
Time flag is set to 1 and 0 respectively.
For each value of ‘β’ considered, the flag representing the time factor is varied to obtain 2
outputs representing the time invariant and the time variant versions of the algorithm. Let
us denote the time invariant algorithm as ‘TL β’ and time variant algorithm as ‘T β’. For
example, when ‘β’ has a value 15 the algorithms are denoted as ‘TL15’ and ‘T15’
respectively. For a given value of ‘’, 6 different versions of the algorithm viz. T5, T10,
T15 and TL5, TL10 and TL15 are generated. This process is repeated for each value of
‘’ and there are four different ‘’ values. Thus a total of 24 different combinations were
used to generate different set of recommendations for an author.
No of iterations = No of values * No of β values * 2
= 4*3*2 = 24.
The outcome of each of the iteration is an RList that provides a set of recommendations.
We consider each RList as the results of a different version of the Tree concept
recommender. However, we do not need to have multiple versions of individual

40
documents judged by our human subjects. So, to reduce their work, we remove the
duplicate documents from each RList and merge the top ten documents from each RList.
The duplicate documents if any within an RList are removed using a Perl script. This
unique list of documents is then presented to the author for evaluation.
4.5.2 Collecting User Feedback:
Once the recommended papers have been identified, the author is emailed to notify them
that they have papers to review. For easier and more efficient interactions, a web
interface was provided for rating the documents. The author logs in to a URL provided in
the email notification using the email Id that he entered during the registration process to
view the recommended documents. The papers are displayed to the author in random
order, and they are asked to submit their ratings. For each recommended document, the
following information was included to facilitate the evaluation process:
1) The title of the document
2) The abstract of the document
3) The link to the original document
The author is then asked to rate the documents using on of four ratings described below:
1 – I could have written it
2 – I should refer it
3 – I should read it for background info
4 – I have no interest in this paper.
While rating each paper, the authors were only required to use the abstracts and the title
information. Reading the entire document was optional and the link to the original
document could be used for that purpose if the author felt that the abstract information
41
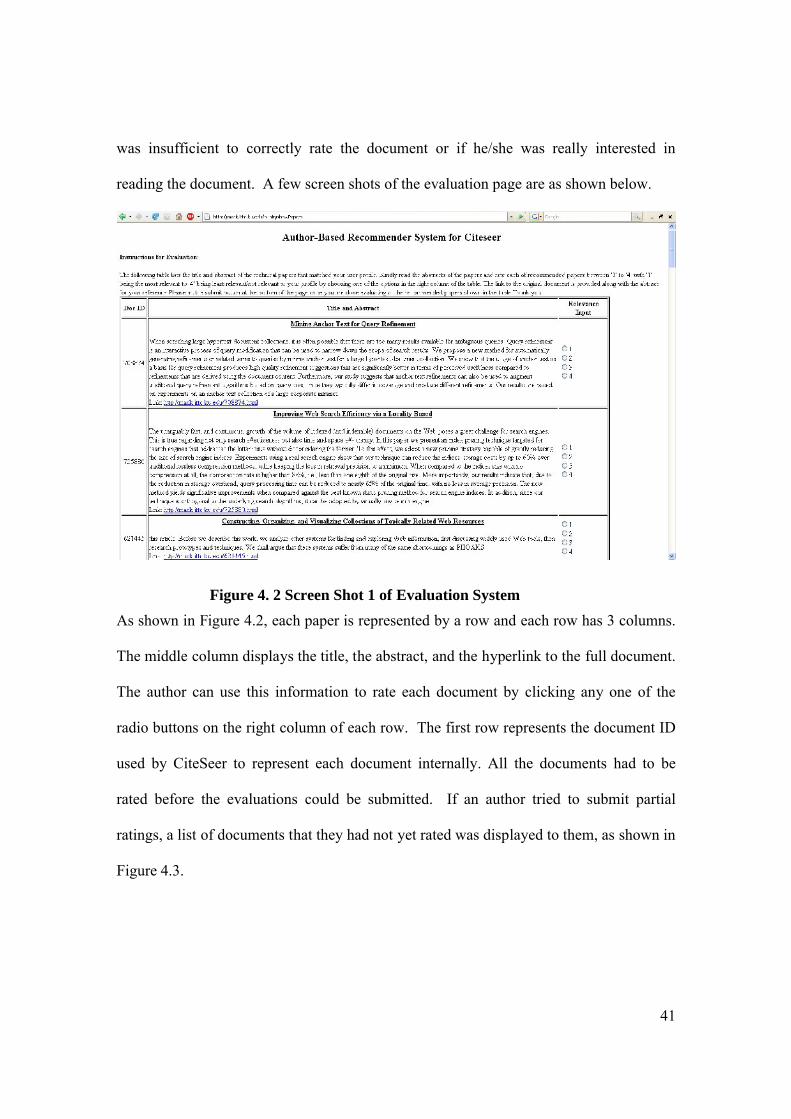
was insufficient to correctly rate the document or if he/she was really interested in
reading the document. A few screen shots of the evaluation page are as shown below.
Figure 4. 2 Screen Shot 1 of Evaluation System
As shown in Figure 4.2, each paper is represented by a row and each row has 3 columns.
The middle column displays the title, the abstract, and the hyperlink to the full document.
The author can use this information to rate each document by clicking any one of the
radio buttons on the right column of each row. The first row represents the document ID
used by CiteSeer to represent each document internally. All the documents had to be
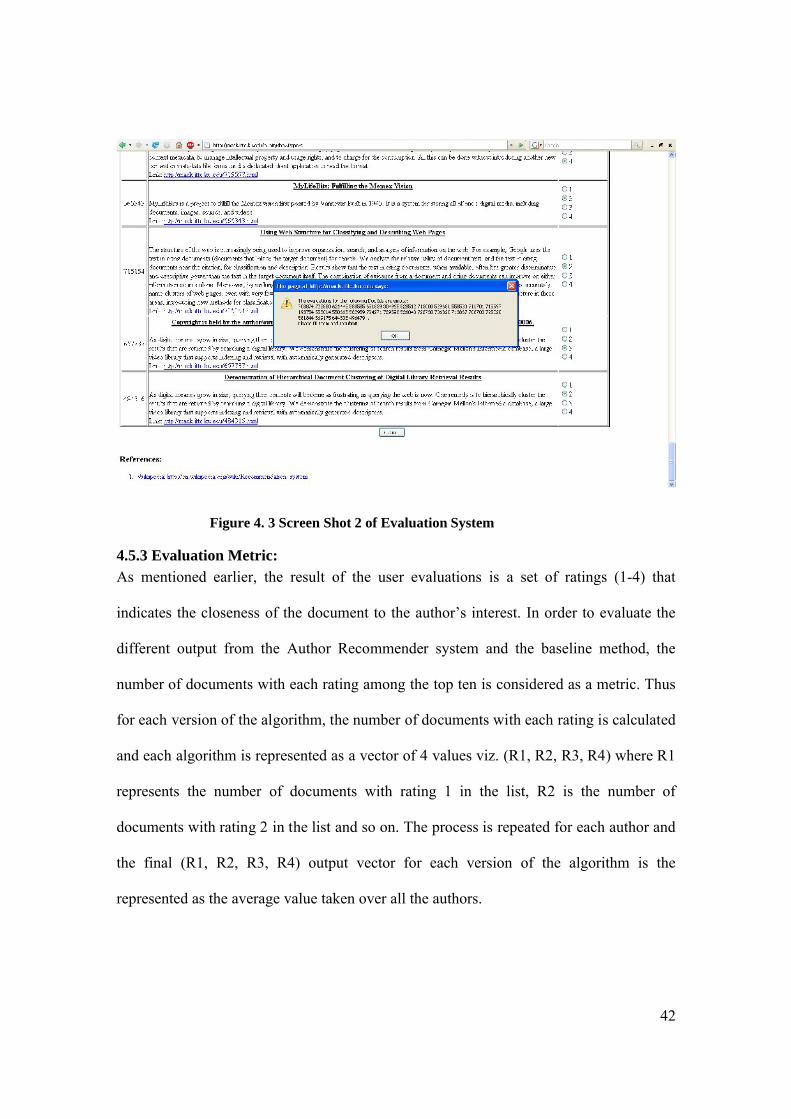
rated before the evaluations could be submitted. If an author tried to submit partial
ratings, a list of documents that they had not yet rated was displayed to them, as shown in
Figure 4.3.
42
Figure 4. 3 Screen Shot 2 of Evaluation System
4.5.3 Evaluation Metric:As mentioned earlier, the result of the user evaluations is a set of ratings (1-4) that
indicates the closeness of the document to the author’s interest. In order to evaluate the
different output from the Author Recommender system and the baseline method, the
number of documents with each rating among the top ten is considered as a metric. Thus
for each version of the algorithm, the number of documents with each rating is calculated
and each algorithm is represented as a vector of 4 values viz. (R1, R2, R3, R4) where R1
represents the number of documents with rating 1 in the list, R2 is the number of
documents with rating 2 in the list and so on. The process is repeated for each author and
the final (R1, R2, R3, R4) output vector for each version of the algorithm is the
represented as the average value taken over all the authors.
43
Definition of a Good Recommendation:
R1: In this case we consider only the documents with ratings 1 as good recommendation.
So the total score the algorithm receives is the number of documents among the top ten
with rating 1. This is a very strict measure of good recommendation.
R1+R2: In this case we consider only the documents with ratings 1 and 2 as good
recommendations. So the total score the algorithm receives is the sum of the total
number of documents with ratings 1 and 2 among the top ten in the RList.
R1+R2+R3: In this case we consider the documents with ratings 1, 2 and 3 to be good
recommendations for the author. The total score the algorithm receives is the sum of the
total number of documents with ratings 1, 2 and 3 among the top ten in the RList.
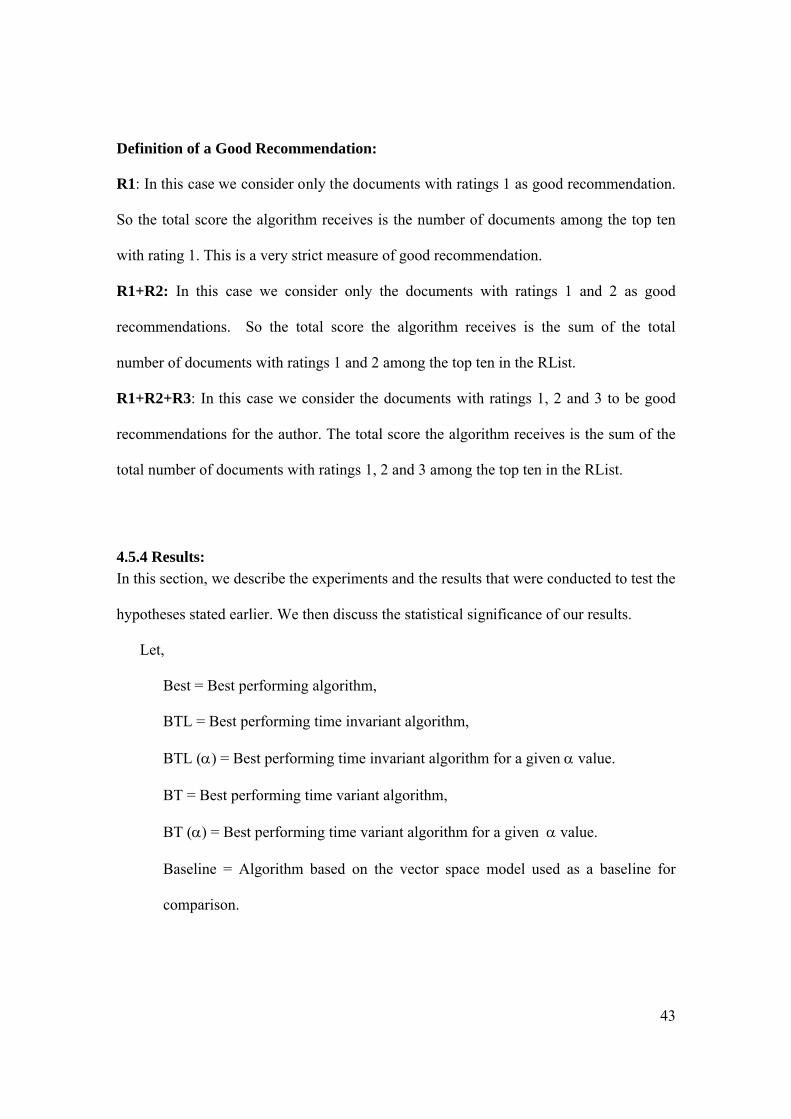
4.5.4 Results:
In this section, we describe the experiments and the results that were conducted to test the
hypotheses stated earlier. We then discuss the statistical significance of our results.
Let,
Best = Best performing algorithm,
BTL = Best performing time invariant algorithm,
BTL () = Best performing time invariant algorithm for a given value.
BT = Best performing time variant algorithm,
BT () = Best performing time variant algorithm for a given value.
Baseline = Algorithm based on the vector space model used as a baseline for
comparison.
44
Evaluation of Hypothesis 1:
The first hypothesis states that the recommender system based on the Tree of Concepts is
better than the algorithm using the Vector of Concepts which in turn is better than the
Vector of Keywords. To evaluate this, we compared the best performing algorithm that
uses the Tree of Concepts with the best performing algorithm that uses the Vector of
Concepts and the Baseline method that uses a Vector of Keywords. As mentioned in
Section 4.4.1, when > 0, we get the tree of concepts algorithm and when = 0 we get
the vector of concepts algorithm.
To ignore the effect of time for this experiment, we set the Boolean Time flag to 0 for all
runs and vary β to get the best performing algorithm (BTL ()) for a given value of .
We consider BTL ( = 0) as the best performing vector of concept algorithm
(BestVectorConcept). We obtain the best performing tree concept algorithm (BestTreeConcept) by
comparing all the BTL ( > 0). Finally we compare the BestTreeConcept, BestVectorConcept and
the Baseline method to get the best performing algorithm. All the comparisons are done
based on the definitions of good recommendation, as explained in section 4.6. Figure 4.4
illustrates these steps.
45
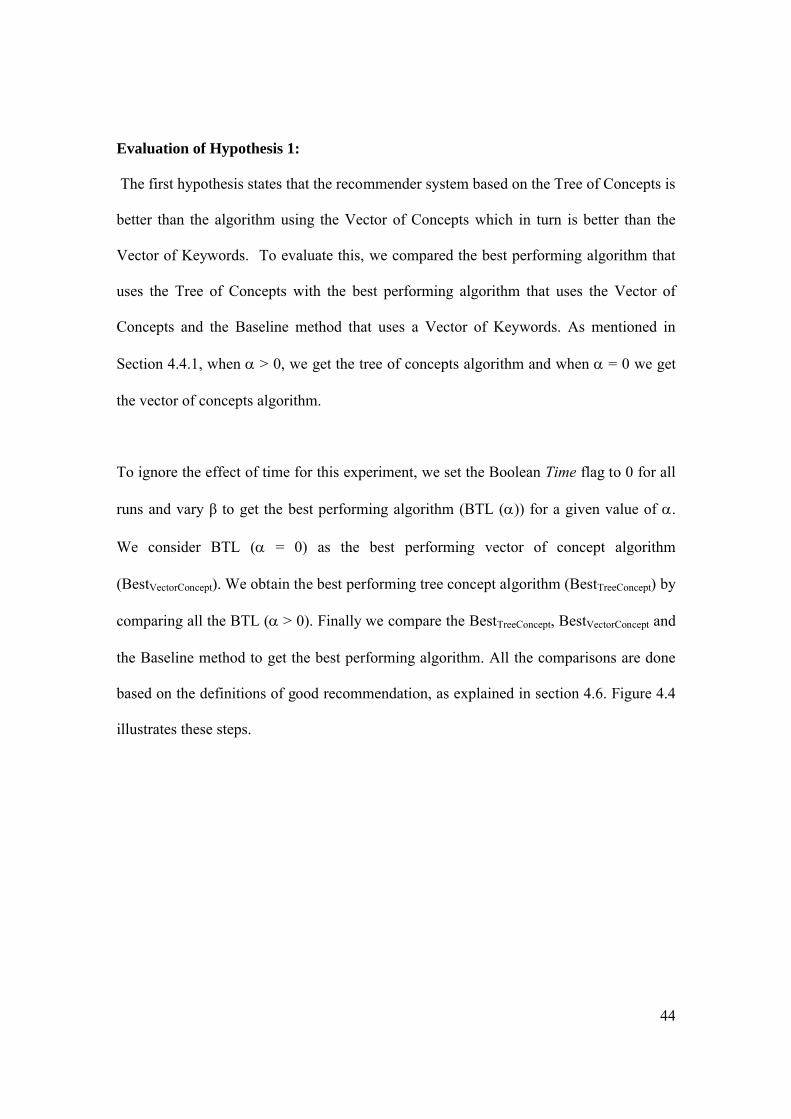
Figure 4. 4. Experiment to Test Hypothesis 1
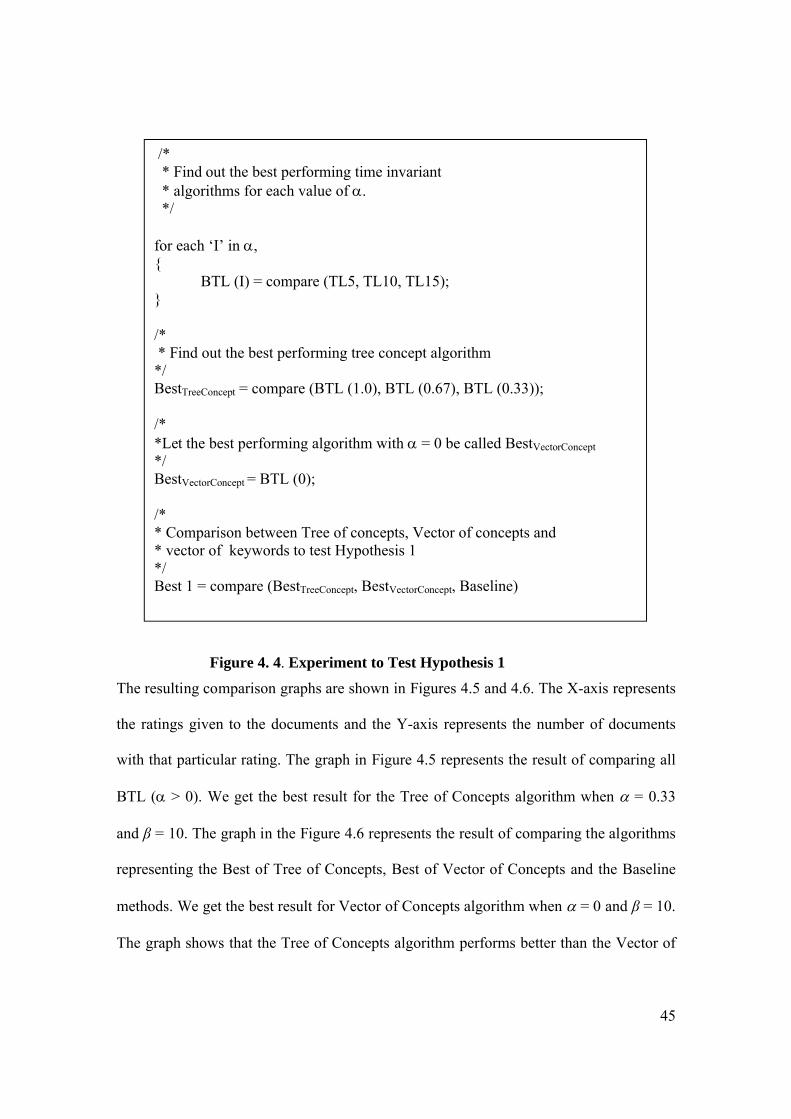
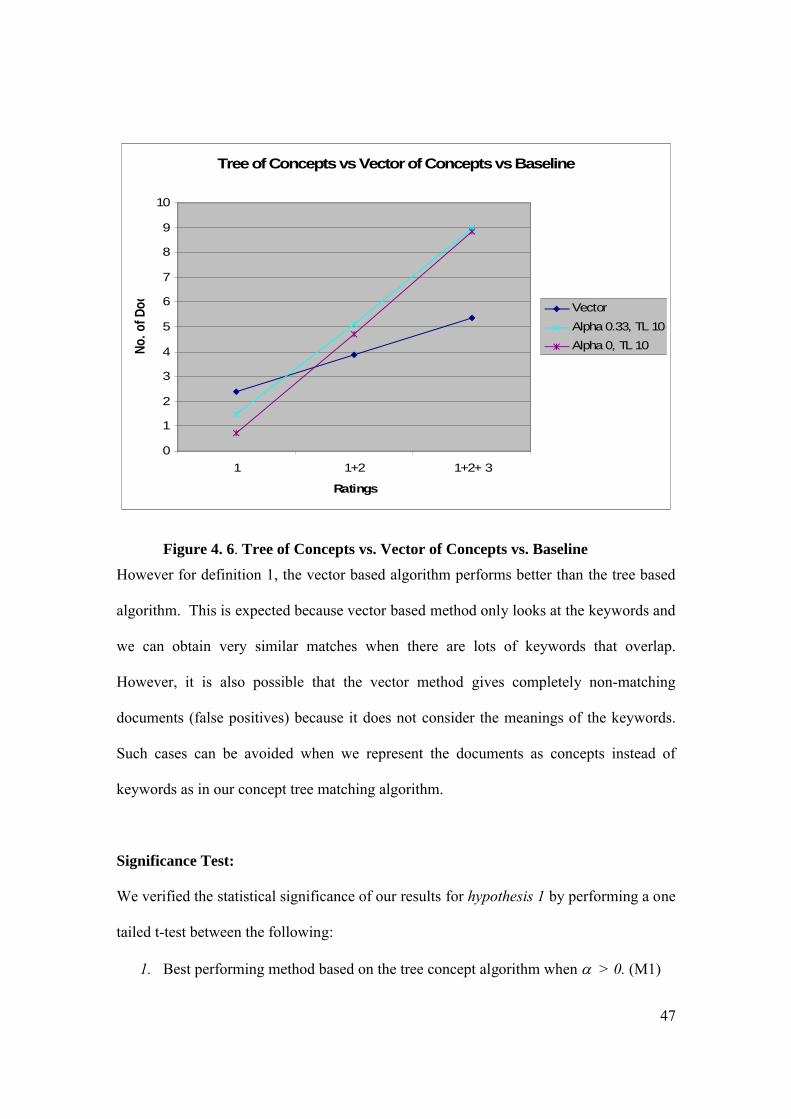
The resulting comparison graphs are shown in Figures 4.5 and 4.6. The X-axis represents
the ratings given to the documents and the Y-axis represents the number of documents
with that particular rating. The graph in Figure 4.5 represents the result of comparing all
BTL ( > 0). We get the best result for the Tree of Concepts algorithm when = 0.33
and β = 10. The graph in the Figure 4.6 represents the result of comparing the algorithms
representing the Best of Tree of Concepts, Best of Vector of Concepts and the Baseline
methods. We get the best result for Vector of Concepts algorithm when = 0 and β = 10.
The graph shows that the Tree of Concepts algorithm performs better than the Vector of
/* * Find out the best performing time invariant * algorithms for each value of . */
for each ‘I’ in ,{
BTL (I) = compare (TL5, TL10, TL15);}
/* * Find out the best performing tree concept algorithm */BestTreeConcept = compare (BTL (1.0), BTL (0.67), BTL (0.33));
/**Let the best performing algorithm with = 0 be called BestVectorConcept
*/BestVectorConcept = BTL (0);
/* * Comparison between Tree of concepts, Vector of concepts and * vector of keywords to test Hypothesis 1*/Best 1 = compare (BestTreeConcept, BestVectorConcept, Baseline)
46
Concepts algorithm which in turn performs better than the Baseline algorithm for the
second and third definitions of the good recommendation considered earlier. Hence, we
consider the statement in hypothesis 1 to be true.
Best of Tree of Concepts Algorithm
0
1
2
3
4
5
6
7
8
9
10
1 1+2 1+2+ 3
Ratings
No.
of D
ocs
Alpha 1.0, TL 15
Alpha 0.67, TL 10
Alpha 0.33, TL 10
Figure 4. 5 Best of Tree of Concepts Algorithm
47
Tree of Concepts vs Vector of Concepts vs Baseline
0
1
2
3
4
5
6
7
8
9
10
1 1+2 1+2+ 3
Ratings
No.
of D
ocs
Vector
Alpha 0.33, TL 10
Alpha 0, TL 10
Figure 4. 6. Tree of Concepts vs. Vector of Concepts vs. Baseline
However for definition 1, the vector based algorithm performs better than the tree based
algorithm. This is expected because vector based method only looks at the keywords and
we can obtain very similar matches when there are lots of keywords that overlap.
However, it is also possible that the vector method gives completely non-matching
documents (false positives) because it does not consider the meanings of the keywords.
Such cases can be avoided when we represent the documents as concepts instead of
keywords as in our concept tree matching algorithm.
Significance Test:
We verified the statistical significance of our results for hypothesis 1 by performing a one
tailed t-test between the following:
1. Best performing method based on the tree concept algorithm when > 0. (M1)
48
2. Best performing method based on the tree concept algorithm when = 0.(M2)
3. Baseline method. (M3)
The t-test tests the probability ‘p’ with which the null hypothesis is true. If the probability
value of ‘p’ is below the critical value then we can safely reject the null hypothesis stated.
The critical value of ‘p’ is set as 0.10. Let the null hypothesis be stated as, Mi < Mj is
true (i.e.) the method Mi does not perform better than the method Mj. When p < = 0.10
we can say that there is at most only 10% chance that Mi < Mj and we can reject the null
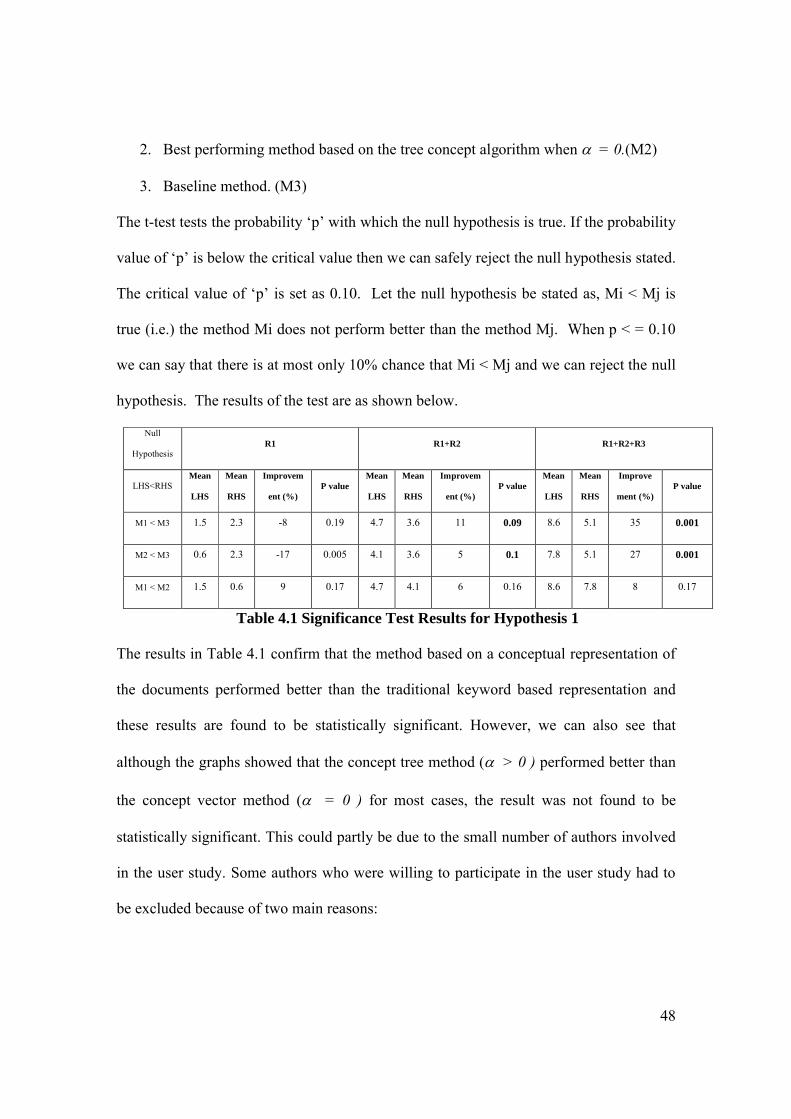
hypothesis. The results of the test are as shown below.
Null
HypothesisR1 R1+R2 R1+R2+R3
LHS<RHSMean
LHS
Mean
RHS
Improvem
ent (%)P value
Mean
LHS
Mean
RHS
Improvem
ent (%)P value
Mean
LHS
Mean
RHS
Improve
ment (%)P value
M1 < M3 1.5 2.3 -8 0.19 4.7 3.6 11 0.09 8.6 5.1 35 0.001
M2 < M3 0.6 2.3 -17 0.005 4.1 3.6 5 0.1 7.8 5.1 27 0.001
M1 < M2 1.5 0.6 9 0.17 4.7 4.1 6 0.16 8.6 7.8 8 0.17
Table 4.1 Significance Test Results for Hypothesis 1
The results in Table 4.1 confirm that the method based on a conceptual representation of
the documents performed better than the traditional keyword based representation and
these results are found to be statistically significant. However, we can also see that
although the graphs showed that the concept tree method ( > 0 ) performed better than
the concept vector method ( = 0 ) for most cases, the result was not found to be
statistically significant. This could partly be due to the small number of authors involved
in the user study. Some authors who were willing to participate in the user study had to
be excluded because of two main reasons:
49
1) They did not have sufficient number of publications in the CiteSeer database to
generate a user profile
2) The profile generated did not have the minimum number of concepts required to
perform our experiments.
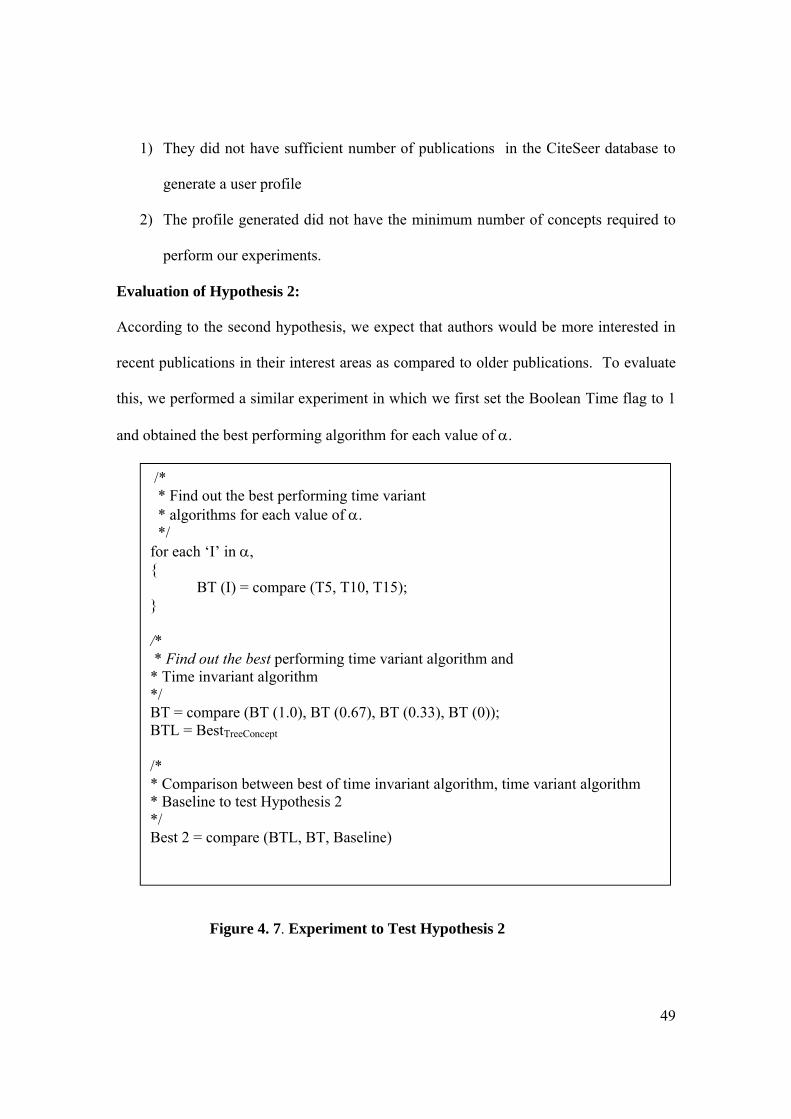
Evaluation of Hypothesis 2:
According to the second hypothesis, we expect that authors would be more interested in
recent publications in their interest areas as compared to older publications. To evaluate
this, we performed a similar experiment in which we first set the Boolean Time flag to 1
and obtained the best performing algorithm for each value of .
Figure 4. 7. Experiment to Test Hypothesis 2
/* * Find out the best performing time variant * algorithms for each value of . */for each ‘I’ in ,{
BT (I) = compare (T5, T10, T15);}
/* * Find out the best performing time variant algorithm and
* Time invariant algorithm */BT = compare (BT (1.0), BT (0.67), BT (0.33), BT (0));BTL = BestTreeConcept
/** Comparison between best of time invariant algorithm, time variant algorithm * Baseline to test Hypothesis 2*/Best 2 = compare (BTL, BT, Baseline)
50
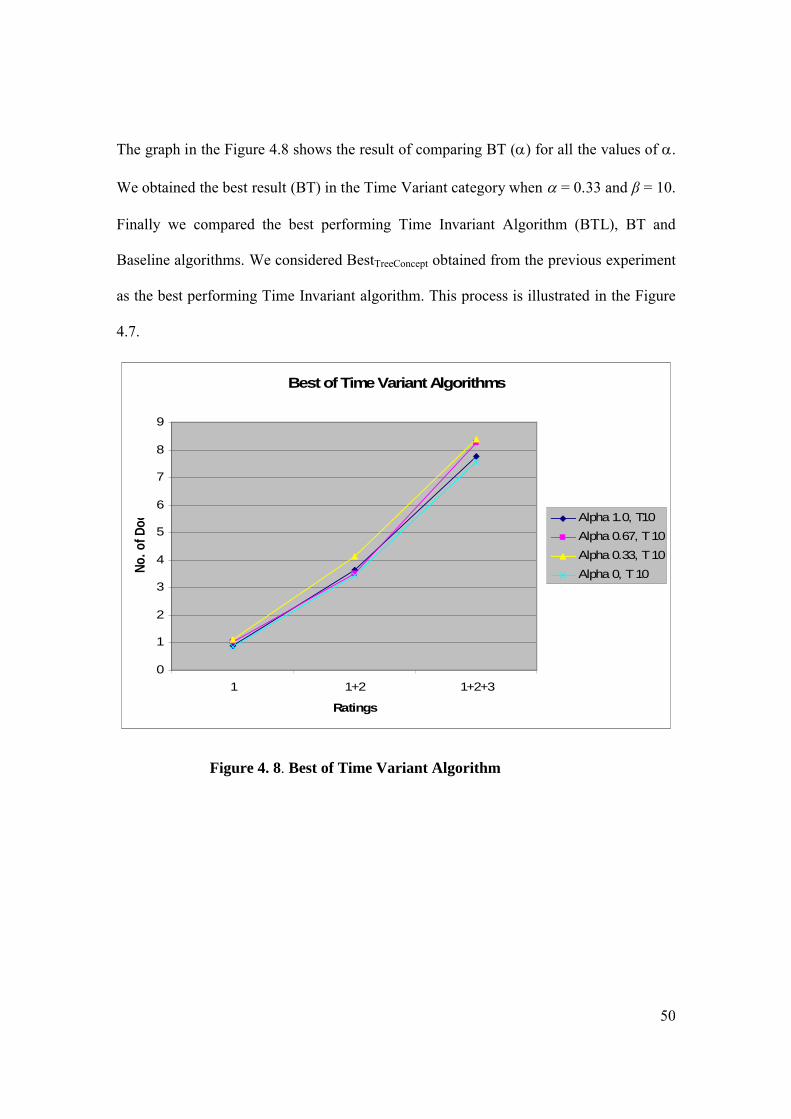
The graph in the Figure 4.8 shows the result of comparing BT () for all the values of .
We obtained the best result (BT) in the Time Variant category when = 0.33 and β = 10.
Finally we compared the best performing Time Invariant Algorithm (BTL), BT and
Baseline algorithms. We considered BestTreeConcept obtained from the previous experiment
as the best performing Time Invariant algorithm. This process is illustrated in the Figure
4.7.
Best of Time Variant Algorithms
0
1
2
3
4
5
6
7
8
9
1 1+2 1+2+3
Ratings
No.
of D
ocs
Alpha 1.0, T10
Alpha 0.67, T 10
Alpha 0.33, T 10
Alpha 0, T 10
Figure 4. 8. Best of Time Variant Algorithm
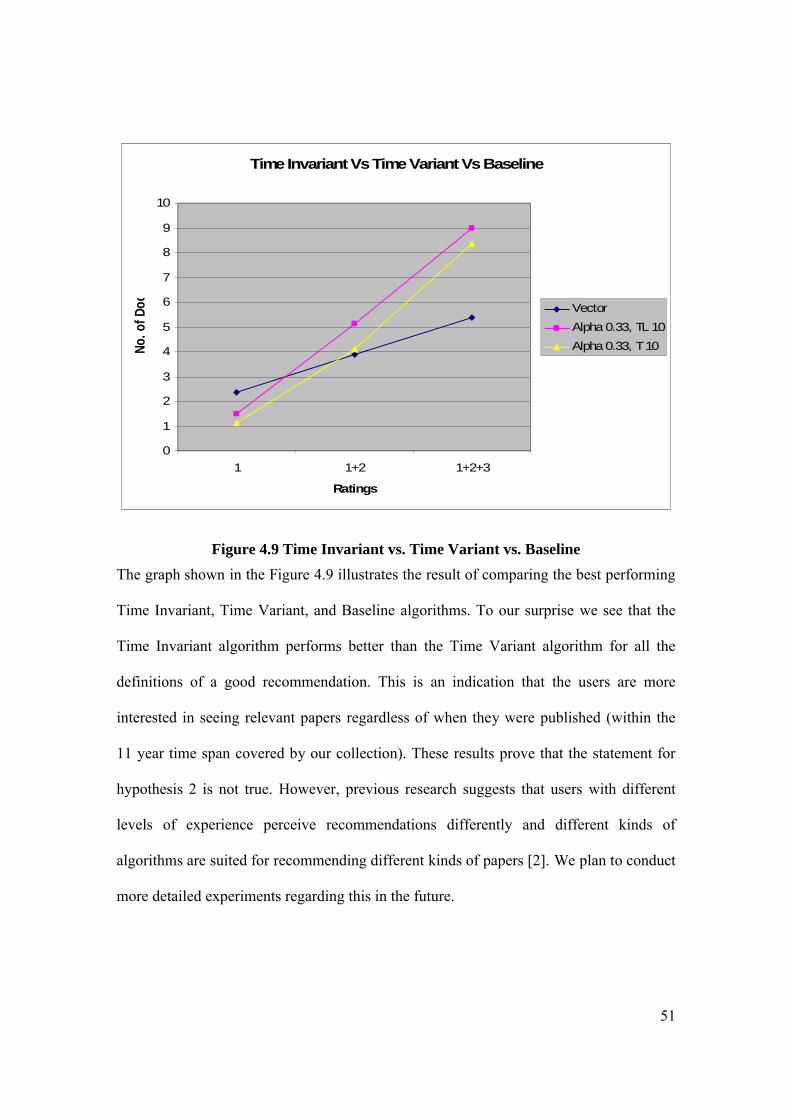
51
Time Invariant Vs Time Variant Vs Baseline
0
1
2
3
4
5
6
7
8
9
10
1 1+2 1+2+3
Ratings
No.
of D
ocs
Vector
Alpha 0.33, TL 10
Alpha 0.33, T 10
Figure 4.9 Time Invariant vs. Time Variant vs. Baseline
The graph shown in the Figure 4.9 illustrates the result of comparing the best performing
Time Invariant, Time Variant, and Baseline algorithms. To our surprise we see that the
Time Invariant algorithm performs better than the Time Variant algorithm for all the
definitions of a good recommendation. This is an indication that the users are more
interested in seeing relevant papers regardless of when they were published (within the
11 year time span covered by our collection). These results prove that the statement for
hypothesis 2 is not true. However, previous research suggests that users with different
levels of experience perceive recommendations differently and different kinds of
algorithms are suited for recommending different kinds of papers [2]. We plan to conduct
more detailed experiments regarding this in the future.
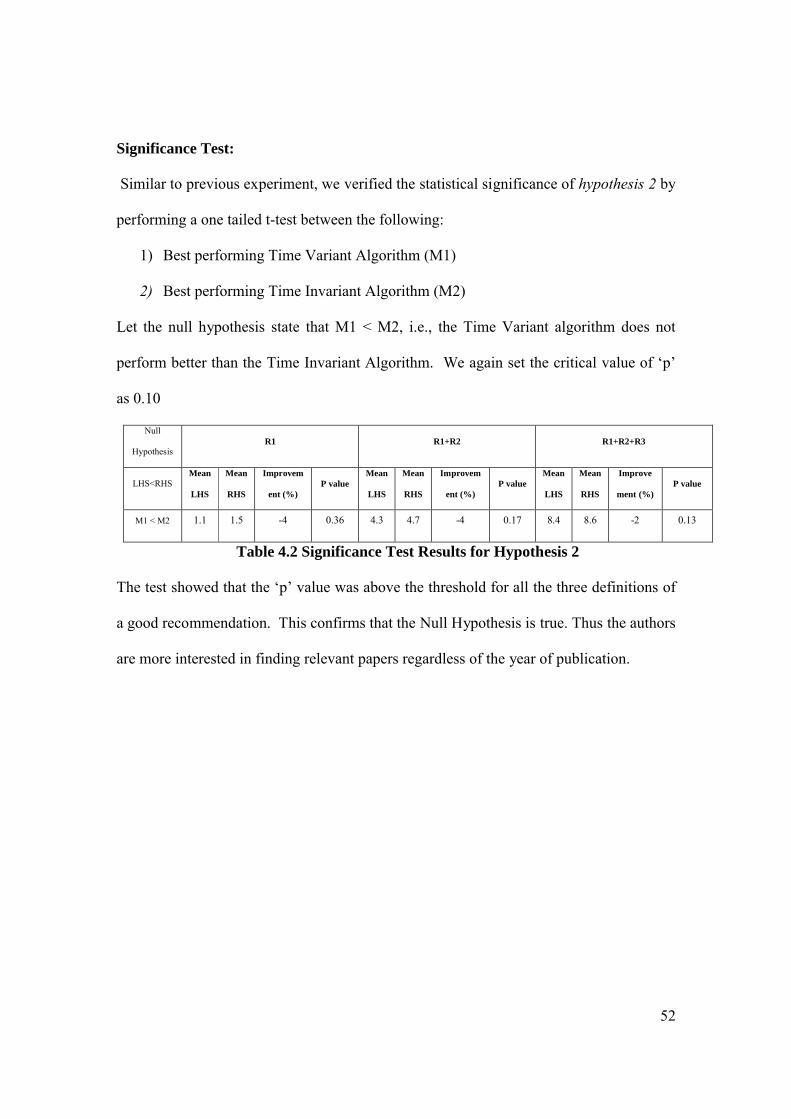
52
Significance Test:
Similar to previous experiment, we verified the statistical significance of hypothesis 2 by
performing a one tailed t-test between the following:
1) Best performing Time Variant Algorithm (M1)
2) Best performing Time Invariant Algorithm (M2)
Let the null hypothesis state that M1 < M2, i.e., the Time Variant algorithm does not
perform better than the Time Invariant Algorithm. We again set the critical value of ‘p’
as 0.10
Null
HypothesisR1 R1+R2 R1+R2+R3
LHS<RHSMean
LHS
Mean
RHS
Improvem
ent (%)P value
Mean
LHS
Mean
RHS
Improvem
ent (%)P value
Mean
LHS
Mean
RHS
Improve
ment (%)P value
M1 < M2 1.1 1.5 -4 0.36 4.3 4.7 -4 0.17 8.4 8.6 -2 0.13
Table 4.2 Significance Test Results for Hypothesis 2
The test showed that the ‘p’ value was above the threshold for all the three definitions of
a good recommendation. This confirms that the Null Hypothesis is true. Thus the authors
are more interested in finding relevant papers regardless of the year of publication.
53
Chapter 5 Conclusions and Future work
5.1 Conclusions
In this work, we presented a novel way recommending technical papers to the users of the
CiteSeer. We represent the user profiles and the documents as tree of concepts and used a
tree matching algorithm to compute the similarity between them. We also studied the
influence of time in recommending technical papers to the author. To evaluate our system
we conducted a user study where some professors from KU and other universities
participated. From the CiteSeer database, user profiles were generated for them and
recommendations were made. The authors rated each recommended paper within a scale
of 1-4 with ‘1’ being the most relevant and ‘4’ being the least relevant. We obtained the
best results when = 0.33, β = 10 and with no importance given to time.
We conclude that the following from our results:
1) The concept tree matching algorithm performed much better than the traditional
algorithm based on keywords for providing recommendations. The result was
found to be statistically significant. We found an improvement of 8% and 31 %
on the average for the second and third definitions of good recommendation.
2) The tree of concepts ( > 0) method performed better than the vector of concepts
( = 0) method. We found an improvement of 6 to 9 % on the average. However
this result was not statistically significant. We stated our reasons for this and plan
to conduct more experiments in the future.
3) We also found that authors are most interested in seeing the most relevant papers,
regardless of their publication date, rather than seeing more recent papers that
54
might be slightly less relevant. This was confirmed by the rejection of our
hypothesis that including publication date in the recommendation ranking would
improve the recommendations. Although the Time Invariant algorithm showed a
slight improvement of 2 to 4% over the Time Variant algorithm, this
improvement was not statistically significant.
5.2 Future Work
The algorithm currently considers only the publications of the author for building the user
profile. A simple extension could be to build a better profile by also considering all the
documents which the current document cites as references. Also the current
implementation is not adaptive. The recommendation process could be improved by
capturing the short term and long term interests of the user and updating the user profile
accordingly. The traditional content based recommendation systems fail to provide good
recommendations for non-textual data. Our method could be extended to provide
recommendations for non-textual data such as videos or images. By categorizing them
into concepts, one can use similar tree matching algorithms to provide recommendations.
This is a very interesting application of our method and forms a good topic for future
research. Our algorithm could be combined with other similarity computation algorithms
like TF-IDF, citation [1] methods used by CiteSeer to improve the overall
recommendations to the user.
We used a very simple tree matching algorithm to compute the similarity between the
user profiles and documents. One of the reasons for using such a simple algorithm is that
all our concepts are derived from a single taxonomy. It would be interesting to see how

55
the algorithm performs when the concepts are derived from multiple taxonomies or when
other sophisticated algorithms are used for tree similarity computation.
As mentioned earlier it would be interesting to see the results of performing the
experiments with more number of users with different levels of expertise and consider a
more extended time period than the one that we considered here for our experiments.
56
References1) Bollacker K., Lawrence S., Giles C.L., "CiteSeer: An Autonomous Web Agent
for Automatic Retrieval and Identification of Interesting
Publications," Agents’98, 2nd International ACM Conference on Autonomous
Agents, 116-123, 1998.
2) Torres, R.; McNee, S.M.; Abel, M.; Konstan, J.A.; Riedl, J. Enhancing digital
libraries with TechLens, Digital Libraries, 2004. Proceedings of the 2004 Joint
ACM/IEEE Conference on Volume , Issue , 7-11 June 2004 Page(s): 228 – 236
3) Salton, G. and C.Buckley, Term weighting approaches in automatic text retrieval.
Information Processing and Management, 24(5), 1988, p. 513-523.
4) Burke, R. Hybrid Recommender systems: Survey and Experiments. User
Modeling and User-adapted Interaction, 12(4), 2002, pp. 331-370.
5) Huang, Zan and Chung, Wingyan and Ong, Thian-Huat and Chen, Hsinchun
(2002) A Graph-based Recommender System for Digital Library. In Proceedings
Joint Conference on Digital Libraries, pages pp. 65-73, Portland.
6) Chen, H., Ng, T. An Algorithmic Approach to Concept Exploration in a Large
Knowledge Network (Automatic Thesaurus Consultation): Symbolic Branch-and-
Bound Search vs. Connectionist Hopfield Net Activation. Journal of the American
Society for Information Science, 46 (5), (1995). 348-369
7) Balabanović, Shoham, Fab: content-based, collaborative recommendation,
Communications of the ACM, v.40 n.3, p.66-72, March 1997
57
8) Basu C., Hirsh H., Cohen W., and Nevill-Manning C.. Technical paper
recommendation: A study in combining multiple information sources. Journal of
Artificial Intelligence Research, 14:231--252, 2001
9) Cohen W. The WHIRL approach to information integration. In Trends and
Controversies, Marti Hearst ed., IEEE Intelligent Systems, October 1998. IEEE
Press.
10) Billsus D, Pazzani, M. J., and Chen, J. "A learning agent for wireless news
access." Proceedings of the 2000 International Conference on Intelligent User
Interfaces , 2000, Pages 33 - 36.
11) Allan J., Carbonell J., Doddington G., Yamron J., and Yang Y. Topic detection
and tracking pilot study: Final report. In Proceedings of the DARPA Broadcast
News Transcription and Understanding Workshop, 1998.
12) Si L. and Jin R., “Flexible Mixture Model for Collaborative Filtering,” Proc. 20th
Int’l Conf. Machine Learning, Aug. 2003.
13) Hofmann T. & Puzicha J. (1999). Latent Class Models for Collaborative Filtering.
In the Proceedings of International Joint Conference on Artificial Intelligence.
14) Arthur Dempster, Nan Laird, and Donald Rubin. "Maximum likelihood from
incomplete data via the EM algorithm". Journal of the Royal Statistical Society,
Series B, 39(1):1–38, 197
15) Hofmann T. & Puzicha J. (1998). Statistical models for co-occurrence data
(Technical eport). Artificial Intelligence Laboratory Memo 1625, M.I.T.
58
16) Sarwar B., Karypis G., Konstan J., and Riedl J. Application of dimensionality
reduction in recommender systems--a case study. In ACM WebKDD Workshop,
2000
17) Deerwester S., Dumais S. T., Furnas, G. W., Landauer, T. K., & Harshman, R.
(1990). Indexing by latent semantic analysis. Journal of the American Society for
Information Science, 41(6), 391-407.
18) Zhang, Y, Callan, J & Minka, T (2002). Novelty and redundancy detection in
adaptive filtering. Proc. ACM SIGIR 2002, pp.81-88.
19) http://en.wikipedia.org/wiki/Kullback-Leibler_divergence
20) Brusilovsky P., Kobsa A., and Nejdl W.(Eds.): The Adaptive Web, LNCS 4321,
pp. 54 – 89, 2007
21) Geisler, G., McArthur, D., and Giersch, S. 2001. Developing recommendation
services for a digital library with uncertain and changing data. In Proceedings of
the 1st ACM/IEEE-CS Joint Conference on Digital Libraries (Roanoke, Virginia,
United States). JCDL '01. ACM Press, New York, NY, 199-200.
22) Brusilovsky P., Kobsa A., and Nejdl W.(Eds.): The Adaptive Web, LNCS 4321,
pp. 291 – 324, 2007
23) http://citeseer.ist.psu.edu/
24) Brusilovsky P., Kobsa A., and Nejdl W.(Eds.): The Adaptive Web, LNCS 4321,
pp. 325 – 341, 2007
25) Adomavicius, G. and Tuzhilin, A. Toward the next generation of recommender
systems: A survey of the state-of-the-art and possible extensions. IEEE Trans. On
Knowledge and Data Engineering 17, 6 (June 2005), 734-749
59
26) Breese J.S., Heckerman D. and Kadie C., “Empirical Analysis of Predictive
Algorithms for Collaborative Filtering,” Proc. 14th Conf. Uncertainty in Artificial
Intelligence, July 1998
27) Lakkaraju P. Document Similarity Based on Concept Tree Distance, Masters
Thesis at KU
28) http://acm.org/class/1998/