Embed Size (px)
Citation preview
Reprinted from Proc. Fla. State Hort. Soc. 91:27-33. 1978.
CONCEPTS
CITRUS- CONCEPTS1•
2
HIGHER DENSITY PLANTINGS FOR FLORIDA T. ADAIR WHEATON, w. s. CASTLE, D. P .. fi. TUCKER,
AND J. D. WHITNEY
University of Florida, Institute of Food and Agricultural Sciences,
Agricultural Research and Education Center, P.O. Box 1088, Lake Alfred, FL 33850
Additional index words. spacing, production efficiency, light interception, growth model, bearing volume.
Abstract. The design of citrus groves to optimize eco· nomic returns depends on several biological concepts. The 4 concepts considered are light interception, the relationship between bearing volume per acre and productivity, the need to optimize bearing volume over the life of the grove, and the concept of production efficiency. Various planting systems were considered in relation to these concepts. Grove designs that result in the rapid development of a hedgerow oriented in a north-south direction appeared advantageous in terms of light interception, rapid development of bearing volume, and earl ier and improved productivity.
Citrus plantings should be planned so that the ~i<;>logical and management aspects are mte~related to maximize. economic return. Changes in economic factors, labor relat10ns, management practices, market .demand.s, government r.egulations, and tree loss rates reqmre contmual reevaluati~:m of citrus plantings to establish optimum systems. In Florida, a number of changes have occurred which affect ret1!rns from citrus production: land va;lue~ and taxes hav~ mcreas~d; certain zoning laws favor iftgricultural prod~ction; availability of good land for ci~r1f has decrease~; citrus grow~ on poorer soil types results m ', smalle~ tree size ~ue to various limiting factors; loss of tre~s to disease ha~ mcreased; a?d there have been increases in capital expenditures for equipment and irrigation, interest rates, and labor cos~s. B~cause of these changes, it appears that citrus production m the future must make more efficient use of the limited amounts of good land and provide for i;nore ra:eid recovery of investment capital in order to provide maximum average net return. In this symposium, we will attempt to evaluate the potential of higher density plantings of citrus as related to economic, production, and ha~vesting ~acto~s. Althou~h results of research on higher density plantmgs m some citrus producing areas have been encouraging (1, 3, 4, 9, l~, 17, 19, .20), no systematic attempt to evaluate higher ~ensity plantmgs for citrus has been made. Conversely, considerable research and theoretical evaluation have demonstrated the advantages of higher density systems for deciduous fruit, particularly _apples (6, 7, 11, 24). Many of the concepts ~asic to high~r density plantings for apples also apply ~o cit~us, and t.his research on apples has been used extensively m preparmg this report.
lFlorida Agricultural Experiment Stations Journal Series No. 1523. 2Acknowledgments: We are indebted to Drs. C. A. Anderson, R. C. J.
Koo, and M. Cohen, University of Flo:ida, IFA~, and Mr. J. ""."·Todd, Florida Crop and Livestock Reportmg Service, for supplymg unpublished tree growth data. We thank Dr. J . H. Stamper for developing the equations relating tree replacement rates to average tree age in a grove.
Pro~. Fla. State Hort. Soc. 91: 1978.
In this paper, we consider some of the concepts involved in optimizing designs for citrus groves. Emphasis is placed on 4 biological concepts: 1) the relation between light and productivity, 2) the relation between canopy bearing volume and productivity, 3) the n~ed to optimize productivity over the life of the grove rather than optimization at maturity, and 4) production efficiency. Some of these concepts can become highly theoretical and perhaps controversial. The purpose of this paper is not to consider these theories per se, but rather to show how these concepts relate to the design of citrus groves. There are also important economic concepts to be considered. Although our experience with higher density plantings does not justify detailed economic analysis at the present time, ultimately decisions must be based on economic models.
Light and Productivity
If water and nutrients are provided in adequate amounts, the interception and utilization of sunlight then becomes the next most important consideration in the design of a grove. In fact, the ultimate limit on productivity of citrus or any other agricultural crop is the amount of photosynthetically active radiation intercepted. Furthermore, radiant energy or light is the one production resource that is available at no cost. It is also one that is largely wasted during the early years of a grove planting when a very small part of the incoming radiation is intercepted by citrus leaves. Much of the planning that goes into the design of higher density groves and orchards is actually based on improving average light interception over the life of the planting. This involves both minimizing the amount of light which strikes the ground and providing canopy structures in which the largest amount of the canopy receives optimum light intensity.
The light intensity for maximum net photosynthesis is somewhere between full shade and full sunlight. The amount of shading that citrus will tolerate is not known, but interception of approximately 303 of the annual radiation is probably required to maintain good production efficiency. The effect of insufficient light is frequently observed in mature citrus groves that are not hedged regularly. Shading first causes a reduction of fruiting on the lower parts of the tree, and eventually reduced foliage in that area.
Not only is a minimum amount of light required for productivity, but radiation intensities above some critical value are of little or no value. Fig. 1 shows the relationship between light intensity and photosynthetic rate of citrus leaves (14). Light intensities above approximately 20 to 253 of full sunlight do not contribute to a higher photosynthetic rate. This indicates that a leaf perpendicular to the sun would waste 75 to 803 of the light falling on it. However, the intensity of sunlight on the surface can be reduced by changing the angle of incidence. The majority of leaves on a citrus tree will be inclined at varying angles to the incident light with a corresponding reduction of intensity on the leaf surface. Thus, in practice, light energy losses due to leaves receiving full sunlight are probably minor. However, it is significant that structures which have a depth factor such as a citrus tree canopy will use inter-
.27

Cf)
Cf) LLJ ::c .,__ :z >-Cf)
0 .,__ 0 I 0....
i LL.. 0
LLJ .,__ ~ 0::: ....._ LLJ z
20 40 60 PERCENT OF FULL SUN LIGHT
Fig. 1. Light ~turation curve for photosynthesis of citrus leaves, adapted from Knedemann (14).
cepted light much more efficiently than would the same surface covered by a single layer of leaves perpendicular to the incoming light. This is because canopies have few leaves perpendicular to the sun at any time, and because inner layers of canopy intercept and use light that passes through ~he outside layer. A more comprehensive model of light mterception and photosynthesis of citrus tree canopies has been developed recently by Stamper and Allen (23).
Factors in the design of a citrus planting that affect light interception of a mature grove include width of the drive middle, wall angle, tree height, and row orientation. It is obvious that all of the light can be intercepted only if all of the ground is covered (which is possible in the highly productive grain crops, for example). In a mature grove maintained in a hedgerow, the principal loss of solar radiation is that falling on the ground between the rows. With present machinery, the minimum clear space that must be maintained is generally considered to be about 8 ft. However, only when the sun is directly overhead are the middles fully illuminated. At other times, depending on the azimuth and elevation of the suh, trees will intercept varying amounts of the incident radiation.
The actual amount .. of intercepted radiation can be calculated for various spacings, tree height, hedging angles, and row orientations. Intercepted radiation also varies with latitude, time of year, and time of day. Light interception in apple orchards has been studied extensively by Cain (8). Although information on the levels of shading tolerated by citrus is incomplete, it appears that the conclusions drawn for apples are also appropriate for citrus.
1. In plantings with standard 8 ft middles, considerably more light is intercepted by hedgerows oriented in a northsouth (N-S) direction than east-west (E-W). In addition, the N-S orientation gives a much more even distribution of light between the 2 sides of the hedgerow than rows planted in an E-W direction.
2. It is possible to calculate a critical spacing angle between the horizontal and a line from the base of the wall of one row to the top of an adjacent row which will pro-
28
vide critical minimum illumination at the base of the row. This angle determines the relation between tree height and middle width for the most efficient interception of radiation. At a hedging angle of 20° which was found to be ~onvenient and practical for commercial use in apples (and 1s also appropriate for citrus (18)), this critical spacing angle was 48. 7 °.
. 3. A "rule of thumb" for the 20° hedging angle is the height of the tree should not exceed twice the middle width for adequate illumination at the base of the wall; i.e., with an 8 ft middle, trees hedged at 20° should be no higher than 16 ft.
It is encouraging that these calculations yield results that are similar to recommendations and practices currently followed in Florida citrus groves, practices that were developed after years of research and grower observations. The re~l value of the theoretical approach may come in the design of future plantings and in reduction of costly and long-term spacing-yield studies. For example, if smaller trees an~/ or. sma~ler equipmei:it becom.es available, allowing a reduct10n m dnve middle width, optimum tree height can ?e calcul~ted for su~h.planti~gs based on knowledge of light 111tercept1on and mm1mum light levels required.
Canopy Bearing Volume
One concept useful in comparing potential productivity of various kinds of agricultural planting systems is the amount of leaf surface area or bearing volume a crop has per unit of land area. For annual crops, an index called the leaf area index (LAI) is frequently used which is a measure of the number of acres of leaf surface a crop has per acre of land. The approaches we have used for the measurement of canopy development of citrus trees are:
1. Ground area-the area of ground covered by the tree canopy
2. Canopy area-the total surface area of the tree canopy 3. Canopy volume-the total volume of the tree canopy 4. Bearing volume-the volume of the outer 3 ft of the
tree canopy. The bearing volume of a citrus tree is calculated as the outer 3 ft of the tree since the bearing portion of a tree's crown is largely limited to this outer shell (5) and since 90% of the solar radiation is absorbed by the first 3 ft of canopy (12, 23).3
An index may be calculated for each of the methods of canopy measurement that allows simple comparisons among various planting systems. The ground area index is the proportion of the ground area that is covered by tree canopy. For example, a ground area index of 0.5 indicates that 50% of the total ground area is covered by tree canopy. Canopy surface area index measures canopy surface area per unit of land area. An index value of 2.0 would equate to 2 acres of canopy surface per acre of land. For canopy volume or bearing volume, the indices are calculated as cubic ft of canopy or bearing volume per unit of land area (ft3 /ft2
), or ft of canopy. A canopy volume index of 4.0 could be visualized as an even layer of canopy 4 ft in depth over an acre of land. All of these ways of considering canopy development may provide useful information, and the selection of one as being the best index of productivity is rather arbitrary at present. The concepts of bearing volume and bearing volume index appear to be particularly useful for citrus as shown later. Assuming leaf density is limited to and constant within the bearing volume, LAI should be a function of bearing volume index.
The productive potential of an acre of fruit trees is a
3For metric conversions see table at front of this volume. Ed.
Proc. Fla. 'State Hort. Soc. 91: 1978.

function of the amount of canopy that is present (24). In a citrus grove, part of the land area is productive, and part is nonproductive. The space occupied by the canopy is productive, whereas the space required for drive middles and turn-around at ends of rows is nonproductive.
Similarly, the tree may also be divided into productive and nonproductive parts since fruiting is primarily limited to the outer 3 ft of the canopy. In a grove of small trees or a narrow hedgerow, the total volume of the trees may be considered productive; however, large trees may have an inner nonproductive portion that is a significant portion of the total tree volume.
In designing a grove or orchard, the relative amounts of bearing and nonbearing parts can be planned. An acre with a large portion of its volume devoted to bearing has a greater potential for productivity than one with most of its volume devoted to tree support, middles, or other functions. Tukey (24) observed that the production potential (measured as volume of bearing surface) may be increased by: 1) increasing tree height, 2) reducing tree spread, 3) reducing the width of middles, 4) changing tree form to a rectangular solid (hedgerow), 5) stimulating earlier bearing and restricting tree growth, and 6) increasing the number of trees per acre through controlled closer spacing.
There are limits, however, as to the extent that the bearing volume of an acre can be increased. Adequate space in middles is required for equipment and harvesting operations. There is also an effective limit in height of trees both from the labor and equipment efficiency 'standpoint, and from decreased vigor due to shading. And finally, there is a limit to how closely trees may be spaced, since tree spacing must be in some kind of balance with natural tree growth, and it must be possible to contain trees in a predetermined space without loss in productivity.
Since the productive potential of an acre of citrus is a function of the amount of canopy, or bearing volume, a concept useful in maximizing productivity is to design planting systems that provide for the maximum amount of canopy and still provide adequate access to the grove. It is possible to calculate canopy areas or volumes per acre and corresponding index values for various spacings (Table 1 ).
For these calculations, we assumed that trees were mature. Mature trees are defined for this discussion as trees which are being hedged and topped and have filled the
Table 1. Canopy index values for various tree spacings. Calculations are based on: 1) mature trees that have filled available space and are being maintained at final size with regular hedging and topping, 2) vertical hedging to maintain an 8 ft drive middle in I direction for hedgerows and 2 directions for individual trees, and 3) horizontal topping at 16 ft.
Spacing Index values In Canopy Bearing row Between Ground Canopy vol vol (ft) row area area (ft) (ft)
Individual trees 30 30 0.54 2.10 8.60 4.91 25 30 0.50 · 2.16 7.98 4.92 25 25 0.46 2.20 7.40 4.88 20 25 0.41 2.26 6.53 4.81 20 20 0.36 2.28 5.76 4.59
Hedgerow NAz 30 0.73 1.80 11.73 4.80 NA 25 0.68 1.96 10.88 5.16 NA 20 0.60 2.20 9.60 5.70 NA 15 0.47 2.60 7.46 6.60
zCanopy calculations are independent of actual in-row spacing in a hedgerow at maturity or final size.
Proc. Fla. State Hort. Soc. 91: 1978.
space available to them. Calculations were made for both plantings in which trees were maintained as individual trees with drive middles in both directions, and also for plantings in which trees were allowed to develop as a hedgerow in one direction.
The ground area index calculations show that in a mature grove maintained as individual trees, 543 of the land area is covered by trees spaced 30 x 30 ft, but decreases to 363 of the land area for trees in a 20 x 20 ft spacing. Hedgerow trees also spaced 30 ft between rows cover a much larger land area (733) than individual trees, but show a similar decrease in the ground area index as the distance between rows is reduced. As tree rows are spaced closer together, the number of rows increases and a higher percentage of the land is used for drive middles. Also, the lateral extent of the canopy becomes more limited. Similar effects of tree spacing on canopy volume calculations were reported by McCarty, Brown, and Burkner (15).
Changes in the bearing volume index values are probably more meaningful. Bearing volume index values remain relatively constant for groves of individual trees over the range of spacings considered, while those for hedgerows are generally higher and increase as row spacing decreases. Similar observations were reported in bearing volume comparisons among different apple tree planting systems (2). Assuming that bearing volume is related to productivity, these results indicate that at maturity total yield potential for groves maintained as individual trees will be similar for all spacings considered, but that improvements in yield potential in the range 15 to 303 might be expected for hedgerows at 25 to 15 ft between-row spacing.
The effect of drive middle width must also be considered. Up to this point, all calculations were based on a drive middle of 8 ft and tree height of 16 ft, following the "rule of thumb" that for adequate light the tree height should not exceed twice the width of the clear area between rows. Reducing the width of the middle (assuming for example, that smaller equipment was available), and keeping other tree dimensions the same would result in higher canopy index values or more canopy per acre. What happens, however, if tree height is adjusted for middle width to maintain the ratio of height to middle constant at a value of 2? Table 2 provides the results for various tree spacings with tree heights of 20, 16, and 12 ft and middle widths of 10, 8, and 6 ft, respectively. Although the ground area index increases as middle width decreases, canopy volume and bearing volume decrease. Thus, in terms of productive potential at maturity, it appears that plantings with reduced tree height may be at a disadvantage even if planted with reduced middle widths. However, other offsetting advantages may provide an overall advantage for these smaller trees. For example, all of the calculations in this section reflect production potential when trees have reached final size and do not consider the time required to reach maturity or average potential production over the life of the planting.
Average Bearing Volume
Up to this point, we have discussed approaches toward providing maximum bearing volume per acre in a mature grove. However, citrus plantings should be designed to provide maximum average net return over the life of the grove. Plantings are frequently designed to provide maximum returns at maturity without adequate consideration given to the time and costs required to reach maturity. Traditionally, citrus has been planted using relatively wide spacings and many years are required to reach full productivity. Today, higher land costs, capital costs, and in-
29
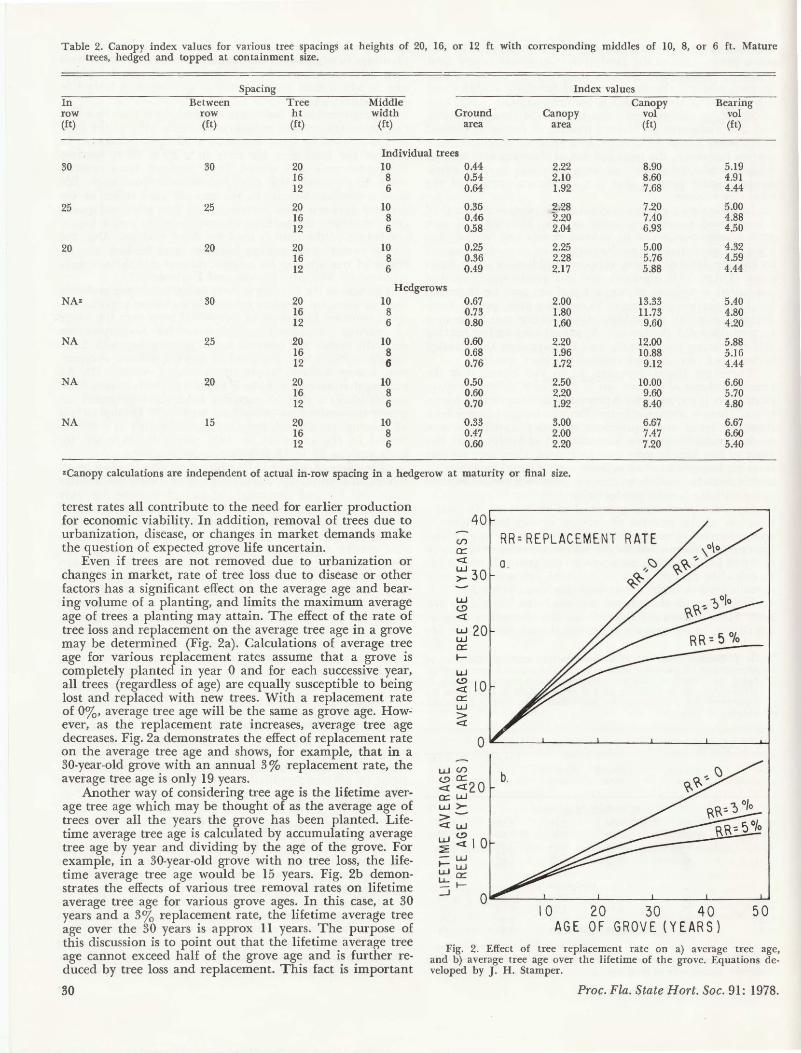
Table 2. Canopy index values for various tree spacings at heights of 20, trees, hedged and topped at containment size.
16, or 12 ft with corresponding middles of 10, 8, or 6 ft. Mature
Spacing Index values In Between Tree <Middle Canopy Bearing row row ht width Ground Canopy vol vol (ft) (ft) (ft) (ft) area area (ft) (ft)
Individual trees 30 30 20 10 0.44 2.22 8.90 5.19
16 8 0.54 2.10 8.60 4.91 12 6 0.64 1.92 7.68 4.44
25 25 20 10 0.36 2.28 7.20 5.00 16 8 0.46 2.20 7.40 4.88 12 6 0.58 2.04 6.93 4.50
20 20 20 10 0.25 2.25 5.00 4.32 16 8 0.36 2.28 5.76 4.59 12 6 0.49 2.17 5.88 4.44
Hedgerows NAz 30 20 10 0.67 2.00 13.33 5.40
16 8 0.73 1.80 11.73 4.80 12 6 0.80 1.60 9.60 4.20
NA 25 20 10 0.60 2.20 12.00 5.88 16 8 0.68 1.96 10.88 5.16 12 6 0.76 1.72 9.12 4.44
NA 20 20 10 0.50 2.50 10.00 6.60 16 8 0.60 2.20 9.60 5.70 12 6 0.70 1.92 8.40 4.80
NA 15 20 10 0.33 3.00 6.67 6.67 16 8 0.47 2.00 7.47 6.60 12 6 0.60 2.20 7.20 5.40
zCanopy calculations are independent of .actual in-row spacing in a hedgerow at maturity or final size.
terest rates all contribute to the need for earlier production for economic viability. In addition, removal of trees due to urbanization, disease, or changes in market demands make the question of expected grove life uncertain.
Even if trees are not removed due to urbanization or changes in market, rate of tree loss due to disease or other factors has a significant effect on the average age and bearing volume of a planting, and limits the maximum average age of trees a planting may attain. The effect of the rate of tree loss and replacement on the average tree age in a grove may be determined (Fig. 2a). Calculations of average tree age for various replacement rates assume that a grove is completely planted in year 0 and for each successive year, all trees (regardless of age) are equally susceptible to being lost and replaced with new trees. With a replacement rate of 03, average tree age will be the same as grove age. How~ ever, as the replacement rate increases, average tree age decreases. Fig. 2a demonstrates the effect of replacement rate on the average tree age and shows, for example, that in a 30-year-old grove with an annual 3 % replacement rate, the average tree age is only 19 years.
Another way of considering tree age is the lifetime average tree age which may be thought of as the average age of trees over all the years the grove has been planted. Lifetime average tree age is calculated by accumulating average tree age by year and dividing by the age of the grove. For example, in a 30-year-old grove with no tree loss, the lifetime average tree age would be 15 years. Fig. 2b demonstrates the effects of various tree removal rates on lifetime average tree age for various grove ages. In this case, · at 30 years and a 33 replacement rate, the lifetime average tree age over the 30 years is approx 11 years. The purpose of this discussion is to point out that the lifetime average tree age cannot exceed half of the grove age and is further reduced by tree loss and replacement. This fact is important
·30
Cf)
a:
40 RR=REPLACEMENT RATE
<I: a. ~30 UJ (!) <l'.
UJ 20 UJ a:: ~
LL.J
~ 10 a:: UJ > <l'.
uJ Cf)
(!) 0::: <l'. <l'. 2 0 a:: w uJ >-> -<l'. UJ
~~I 0 -w t- UJ uJ 0:::
'::: t_J
10 20 30 40 50 AGE OF GROVE(YEARS)
Fig. 2. Effect of tree replacement rate on a) average tree age, and b) average tree age over the lifetime of the grove. Equations developed by J. H. Stamper.
Proc.. Fla. State Hort. Soc. 91: 1978.

in designing a grove to opt1m1ze production parameters over the life of the planting.
Thus, it is necessary to reconsider bearing volume of a planting, not in terms of the final bearing volume, but in terms of maximizing average bearing volume over the life of the grove. Although final bearing volumes for various planting systems vary somewhat (Tables I and 2) , increases in lifetime average bearing volume depend primarily on the selection of planting systems in which the bearing volume per acre or bearing volume index increases rapidly.
Prediction of the bearing volume index for trees at various spacings and ages requires knowledge of the growth rate of individual trees. We have attempted to develop growth curves for a Florida orange tree based on tree dimension measurements obtained from · various sources (see acknowledgments). The values used are based primarily on Florida Crop and Livestock Reporting Service's data collected in the 1950's. Growth rates in more recently planted groves may be higher due to improved budline sources, widespread use of permanent irrigation, and improved management. Fig. 3 shows the growth in tree height and diameter and the calculated canopy volume, bearing volume, canopy surface area, and ground area. These calculations are based on formulas for the surface area and volume of a paraboloid. Note in particular that with tree growth, bearing volume does not increase as rapidly as total volume.
Using this rate-of-growth information, and making several assumptions, it is possible to calculate the rate of development of bearing volume and the bearing volume index for different planting systems. One of the assumptions is that the rate of growth of tree height and diameter will remain similar in different planting systems. This is probably true until hedging and topping are required or until
er w 1-
~ 15 <C
Cl
er 0 10 1-:::c <.!> UJ
:c 5 UJ UJ a:: I-
0
4000
,., t-u..
u.J 3000 ~
:::> _J
0 > 0:: 0
,;;-t-
2000~
1000
01....-<~~~~~10"=--~-1~5~____,2~0,.--~~25=--~=3~0- 0
TREE AGE (YEARS)
<(
L.1..1 0:: <C
L.1..1 uJ a: t-
Fig. 3. Growth of a Florida orange tree expressed as diameter, height, volume, bearing volume, surface area, and ground area.
Proc. Fla. State Hort. Soc. 91: 1978.
trees start growing together in a hedgerow. Growth rates under these latter conditions are not known. It is likely that there is some redistribution of growth to other parts of the tree when hedging is started, but there may also be a loss in rate of bearing volume development, particularly in hedgerows where competition among trees may be a factor. It is possible, however, to calculate bearing volume index values up to the time hedging or growing together in a hedgerow begins, and from Tables I and 2, the final bearing indices are known. Fig. 4 shows the rate of development of bearing volume indices for various planting systems. The portions of the curves shown in broken line represent our uncertainty about the growth rates during the transition period from the beginning of hedging to the attainment of final size.
Results shown in Fig. 4 demonstrate the advantage of closely spaced and hedgerow systems in their more rapid development of bearing volume. For example, the bearing volume index value for a 20-year-old grove spaced 25 x 25 ft is only 503 of the value for a grove spaced 20 x 12 ft. It is also possible to visualize the effect of tree replacement rate on bearing volume. The reduction of average tree age in a 30-year-old grove to 19 years due to a 33 replacement rate (from Fig. 2) would correspond to nearly a 25% reduction in bearing volume per acre. The information in Fig. 4 can also be used to calculate lifetime average bearing index values for various spacings and expected life of grove. Such calculations would be particularly useful if grove loss due to urbanization were anticipated.
Production Efficiency
Production efficiency may be defined as yield per unit of production capacity. For citrus, efficiency is frequently expressed as boxes per tree or boxes per acre. Since the production potential of citrus is also a function of canopy development, other ways of expressing efficiency may be more useful. For example, efficiency may be calculated as yield per unit of ground area, canopy area, canopy volume, or
t-u...
>< uJ Cl :z
u.J ~ :::> _J
0 > (.!)
z 0:: <[
uJ CD
6
5
4
3
2
SPACING 18xl0 ft,, --2oxl2
HEDGEROWS .·· • • ~-·
~--
__ . ...;.20x20
.- -· - -,25x25
INDIVIDUAL TREES
1000
800~ x 0 CD
_J
600::: 1-:z uJ lo 0...
400 Cl _J
UJ
>-
200
00 ~~~5~~~,~o~~,~5~~2~0~~~2~5~~3~oll--'O
TREE AGE (YEARS)
Fig. 4. Change in bearing volume index values during growth of orange trees at several spacings. Assumptions include regular hedging when required to maintain an 8 ft drive middle in 1 direction for hedgerows, 2 directions for individual trees, and topping at 16 ft. Calculated yield potential is shown assuming an efficiency of 3.7 boxes per thousand ft3 of bearing volume.
.31
bearing volume. If these efficiency values are known, yield potential per acre for various planting systems at various ages can easily be calculated based on the ground area, canopy area, canopy volume, or bearing volume indices.
But are these efficiency values constant for trees of different sizes and ages? Up to this point, we have primarily considered optimization of bearing volume, assuming yield would be directly related. However, if efficiency values vary with tree size or age, yield potential calculations would have to include these factors.
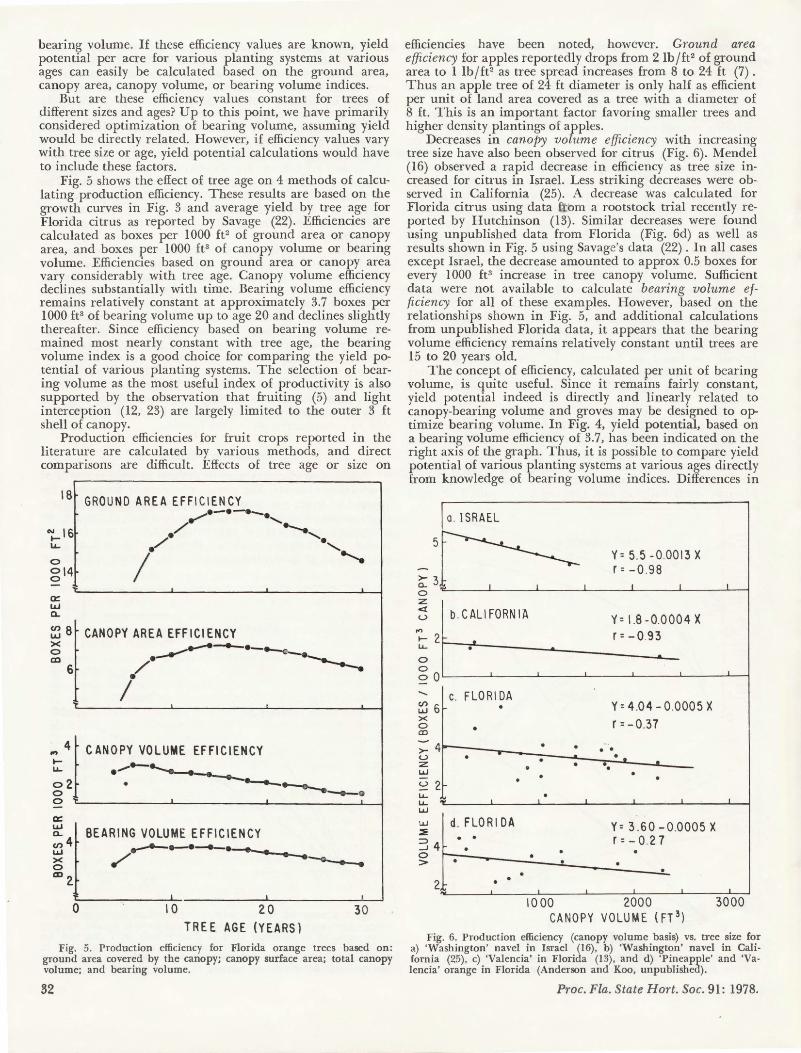
Fig. 5 shows the effect of tree age on 4 methods of calculating production efficiency. These results are based on the growth curves in Fig. 3 and average yield by tree age for Florida citrus as reported by Savage (22). Efficiencies are calculated as boxes per 1000 ft2 of ground area or canopy area, and boxes per 1000 ft 3 of canopy volume or bearing volume. Efficiencies based on ground area or canopy area vary considerably with tree age. Canopy volume efficiency declines substantially with time. Bearing volume efficiency remains relatively constant at approximately 3.7 boxes per 1000 ft3 of bearing volume up to age 20 and declines slightly thereafter. Since efficiency based on bearing volume remained most nearly constant with tree age, the bearing volume index is a good choice for comparing the yield potential of various planting systems. The selection of bearing volume as the most useful index of productivity is also supported by the observation that fruiting (5) and light interception (12, 23) are largely limited to the outer 3 ft shell of canopy.
Production efficiencies for fruit crops reported in the literature are calculated by various methods, and direct comparisons are difficult. Effects of tree age or size on
IS GROUND AREA EFFICIENCY ..,,.,.·-·----., ./ --....., ~16
U., I / ., I ....... I I .
~ 8 • CANOPY AREA EFF IC\ ENCY x 0 Cil
/ -~..------·-~-.__....- ·~
I I .
u.. ....-------...._.
~ 4] CANO PY VOLUME EFFICIENCY
0 2 • • ---...._._._~ 0 ._.__ Q 'i' I I I
BEARING VOLUME E FFIC IEN CY _________ __._. ____ ~•-... ~---~ ·~~
0 10 20 30 TREE AGE (YEARS)
Fig. 5. Production efficiency for Florida orange trees based on: ground area covered by the canopy; canopy surface area; total canopy volume; and bearing volume.
32
efficiencies have been noted, however. Ground area efficiency for apples reportedly drops from 2 lb/ft2 of ground area to 1 lb/ft2 as tree spread increases from 8 to 24 ft (7). Thus an apple tree of 24 ft diameter is only half as efficient per unit of land area covered as a tree with a diameter of 8 ft. This is an important factor favoring smaller trees and higher density plantings of apples.
Decreases in canopy volume efficiency with increasing tree size have also been observed for citrus (Fig. 6). Mendel (16) observed a rapid decrease in efficiency as tree size increased for citrus in Israel. Less striking decreases were observed in California (25). A decrease was calculated for Florida citrus using data ftom a rootstock trial recently reported by Hutchinson (13). Similar decreases were found using unpublished data from Florida (Fig. 6d) as well as results shown in Fig. 5 using Savage's data (22). In all cases except Israel, the decrease amounted to approx 0.5 boxes for every I 000 ft3 increase in tree canopy volume. Sufficient data were not available to calculate bearing volume efficiency for all of these examples. However, based on the relationships shown in Fig. 5, and additional calculations from unpublished Florida data, it appears that the bearing volume efficiency remains relatively constant until trees are 15 to 20 years old.
The concept of efficiency, calculated per unit of bearing volume, is quite useful. Since it remains fairly constant, yield potential indeed is directly and linearly related to canopy-bearing volume and groves may be designed to optimize bearing volume. In Fig. 4, yield potential, based on a bearing volume efficiency of 3. 7, has been indicated on the right axis of the graph. Thus, it is possible to compare yield potential of various planting systems at various ages directly from knowledge of bearing volume indices. Differences in
5
~3
a. ISRAEL
y: 5.5 -0.0013 x r = -0 .98
0 "C.-~~--'-~~--'~~~~~~--L..~~~..__~~-'----1
z c:i: <...)
0 0
b. C All FORN IA '(: 1.8-0.0004 x r = -0.93
~ oL--~~-L...~~---L~~~-'-~~-'-~~--''--~~-'---1
-~6 x 0 CD
c. FLORIDA Y=4.04-0.0005X r=-0.37
~ 4~-;-----,,,_~~~---:---~·~·~·_,_ __ _... __ ~ UJ ••
<...) 2 u.. u.. UJ
. . Y= 3.60 -0.0005 X r=-0 .27
1000 2000 3000 CANOPY VOLUME ( FT 3 )
:Fig. 6. Production efficiency (canopy volume basis) vs. tree size for a) 'Washington' navel in Israel (16), b) 'Washington' navel in California (25), c) 'Valencia' in Florida (13), and d) 'Pineapple' and 'Valencia' orange in Florida (Anderson and Koo, unpublished).
Proc. Fla. State Hort. Soc. 91: 1978.

efficiencies may also be useful in comparing scions, rootstocks, management practices, etc. It is interesting that the bearing volume efficiency of approx 3.7 shown in Fig. 5 corresponds to a yield potential for a mature 25 x 25 ft grove (bearing volume index = 4.9) of 780 boxes per acre. Bearing volume efficiencies around 4.6 have been observed in our research plantings, corresponding to potential yields of up to 920 boxes- per acre for a 25 x 25 planting at grove maturity. Although a number of assumptions have been made in calculating yield potentials based on bearing volume efficiency and bearing volume index, it is rewarding that these calculated values correspond in general with the authors observations on actual maximum yield potential of Florida citrus. Since efficiency is central to production potential, future research should emphasize this concept and not rely solely on selections of genetic material or management practices that superficially outperform others because of more rapid growth of the tree.
The results presented in Fig. 4 indicate that groves at closer spacings have higher yield potentials during the early years of a planting and also reach maximum yield potential at an earlier age. Savage (2 1) reached similar conclusions in a survey of groves of different spacings and ages. He found that the per-acre yield of young trees was directly proportional to the number of trees per acre until trees began to crowd each other. He also showed that groves at closer spacings reached maximum productivity at an earlier age. Groves planted 90-99 trees per acre reached maximum production at 25-29 years, whereas groves planted 60-69 trees per acre had not reached maximum productivity even at 50 years. Yield in groves at the closest spacings declined after maximum production was achieved. However, this survey was completed before hedging and topping were common, and yields were generally low. Additional research is now needed to determine if high levels of productivity can be maintained by improved management in higher density plantings after the trees have reached containment size.
Concluding Remarks
A number of biological concepts have been considered and related to the design of groves. Since productivity is a function of bearing volume of the canopy, groves with the highest average lifetime productivity must develop a large bearing volume per acre as rapidly as possible. In general, higher density plantings that rapidly develop into a hedgerow appear to be advantageous and should be given serious consideration in future plantings. These conclusions are based on a number of assumptions and limited data. In addition, potential problems of higher density plantings have not been considered. Nor is it certain that currently available scion/stock combinations can be maintained at high levels of productivity when tree size is limited. How-
Proc. Fla. State Hort. Soc. 91: 1978.
ever, the biological concepts provided should be of value in developing economic models that will allow biological and management aspects to be interrelated to maximize economic return.
Literature Cited
1. Barnhart, E. L. 1977. Citrus tree spacings. Proc. Int. Soc. Citriculture 1:156-157.
2. Berlage, A. G., and G. E. Yost. 1968. Tree walls for the tree fruit industry. Agr. Eng. 49:198-201.
3. Boswell, S. B., D. R. Atkin, and K. W. Opitz. 1977. Citrus tree spacing in California. Proc. Int. Soc. Citriculture 1:166-169.
4. Boswell, S. B., C. D. McCarty, K. W. Hench, and L. N. Lewis. 1975. Effect of tree density on the first ten years of growth and production of 'Washington' navel orange trees. ]. Amer. Soc. Hort. Sci. 100:370-373.
5. Brown, G. K., C. E. Schertz, and C. K. Huszar. 1971. Fruit-bearing characteristics of orange and grapefruit trees in California. U.S. Dept. Agr. Agr. Res. Sero. Pub. pp. 42-181.
6. Cain, J. C. 1969. Tree spacing in relation to orchard production efficiency. New York Agr. Exp. Sta. Res. Cir. No. 15. 10 pp.
7. Cain, J. C. 1970. Optimum tree density for apple orchards. HortScience 5:232-234.
8. Cain, J. C. 1972. Hedgerow orchard design for most efficient interception of solar radiation. Effects of tree size, shape, spacing, and row direction. Search Agr. 2(7):1-14.
9. Campbell, C. W. 1972. Effect of population density on yield of Tahiti lime. Proc. Tropical Region, Amer. Soc. Hort. Sci. 16:29-34.
10. Cary, P. R. 1977. New concepts in citrus tree spacing and pruning practices. Proc. Int. Soc. Citriculture 1:162-165.
11. Folley, R . R. W. 1973. An economist's review on the choice of tree form and planting system for commercial apple production. Scientia Hort. 1 :205-219. ·
12. Greene, B. A., and J. F. Gerber. 1967. Radiant energy distribution in citrus trees. Proc. Amer. Soc. Hort. Sci. 90:77-85.
13. Hutchinson, D. J. 1977. Influence of rootstock on the performance of 'Valencia' sweet orange. Proc. Int. Soc. Citriculture 2:523-525.
14. Kriedemann, P. E. 1968. Some photosynthetic characteristics of citrus leaves. Aust.]. Biol. Sci. 21 :895-905.
15. McCarty, C. D., G. K. Brown, and P. F. Burkner. 1969. Citrus tree and orchard modification to facilitate mechanical harvest. Proc. Int. Soc. Citricultme 2:653-658.
16. Mendel, K. 1969. New concepts in stionic relations of citrus. Proc. Int. Soc. Citriculture 1 :387-390.
17. Passos, 0. S., A. P. Cunha Sobrinho, Y. W. Coelho, and E. M. Rodrigues. 1977. Behavior of orange trees under three spacings in the state of Bahia, Brazil. Proc. Int. Soc. Citriculture 1:169-171.
18. Phillips, R. L. 1972. Hedging angles for 'Hamlin' oranges. Proc. Fla. State Hort. Soc. 85:48-50.
19. Phillips, R. L. 1974. Performance of 'Pineapple' orange at three tree spacings. Proc. Fla. State Hort. Soc. 87:81-84.
20. Phillips, R. L. Citrus tree spacing and size control. Proc. Int. Soc. Citriculture, 1978. 2:43-46.
21. Savage, Z. 1956. Relationships of yield to age of trees and trees per acre. Citrus Ind. 37(6):6, 18.
22. Savage, Z. 1966. Citrus yield per tree by age. Univ. Florida, Agr. Ext. Sero., Economics Series 66-3.
23. Stamper, J. H., and J. C. Allen. A model of the daily photosynthetic rate in a tree. Agr. Afeteorology (in press).
24. Tukey, L. D. 1978. Designing orchards for greater profits. British Columbia Orchardist 16(4):13-15.
25. Turrell, F. M. 1961. Growth of the photosynthetic area of citrus. Bot. Gaz. 122:284-298.
33