Embed Size (px)
Citation preview
Conceptual Analysis of Electron Transpiration Cooling
for the Leading Edges of Hypersonic Vehicles
Hicham Alkandry,∗ Kyle M. Hanquist,† and Iain D. Boyd‡
Department of Aerospace Engineering, University of Michigan, Ann Arbor, MI
Recent progress is presented in an ongoing effort to perform a conceptual analysis ofpossible electron transpiration cooling using thermo-electric materials at the leading edgesof hypersonic vehicles. The implementation of a new boundary condition in the CFDcode LeMANS to model the thermionic emission of electrons from the leading edges ofhypersonic vehicles is described. A parametric study is performed to understand the effectsof the material work function, the freestream velocity, and the leading edge geometry onthis cooling effect. The numerical results reveal that lower material work functions, higherfreestream velocities, and smaller leading edges can increase the cooling effect due to largeremission current densities. The numerical results also show that the electric field producedby the electron emission may not have a significant effect on the predicted properties.Future work recommendations are provided that may improve the physical accuracy of themodeling capabilities used in this study.
Nomenclature
AR Richardson constantCs Charge of species sDs Diffusion coefficient of species sE Electric fieldje Electric current densityJe Emission current densitykb Boltzmann constant, 1.38× 10⁻²³ J/Km Mass blowing rateMs Molar mass of species sNA Avogadro constant, 6.02× 10²³ mol−1
ns Number density of species sNS Number of speciesp PressureQe Elementary charge, 1.60× 10⁻¹⁹ Cqw Heat transfer to the vehicleRn Nose radiusRu Universal gas constant, 8.31 J/K/molT TemperatureU Velocityws Production rate of species sYs Mass fraction of species sε Material emissivityε0 Vacuum permittivity, 8.85× 10⁻¹² F/mφ Electric potentialΦ Material work function
∗Research Fellow, Member AIAA.†Graduate Student Research Assistant, Student Member AIAA.‡James E. Knott Professor of Engineering, Fellow AIAA.
1 of 18
American Institute of Aeronautics and Astronautics
Dow
nloa
ded
by U
nive
rsity
of
Mic
higa
n -
Dud
erst
adt C
ente
r on
Dec
embe
r 13
, 201
7 | h
ttp://
arc.
aiaa
.org
| D
OI:
10.
2514
/6.2
014-
2674
11th AIAA/ASME Joint Thermophysics and Heat Transfer Conference
16-20 June 2014, Atlanta, GA
10.2514/6.2014-2674
Copyright © 2014 by H.
Alkandry, K. M. Hanquist, and I. D. Boyd. Published by the American Institute of Aeronautics and Astronautics, Inc., with permission.
AIAA AVIATION Forum
ρ Densityσ Electric conductivityσsb Stefan-Boltzmann constant, 5.67× 10⁻⁸ W/m2/K4
subscripts∞ Freestreamw Wall
I. Introduction
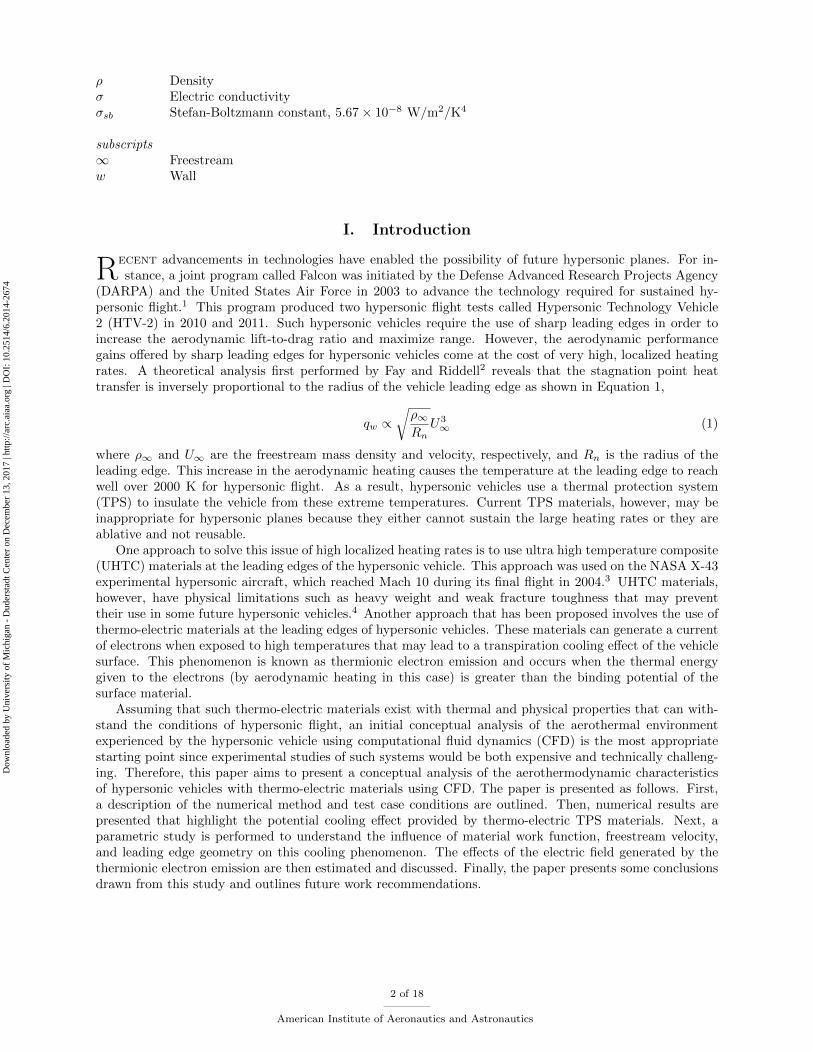
Recent advancements in technologies have enabled the possibility of future hypersonic planes. For in-stance, a joint program called Falcon was initiated by the Defense Advanced Research Projects Agency
(DARPA) and the United States Air Force in 2003 to advance the technology required for sustained hy-personic flight.1 This program produced two hypersonic flight tests called Hypersonic Technology Vehicle2 (HTV-2) in 2010 and 2011. Such hypersonic vehicles require the use of sharp leading edges in order toincrease the aerodynamic lift-to-drag ratio and maximize range. However, the aerodynamic performancegains offered by sharp leading edges for hypersonic vehicles come at the cost of very high, localized heatingrates. A theoretical analysis first performed by Fay and Riddell2 reveals that the stagnation point heattransfer is inversely proportional to the radius of the vehicle leading edge as shown in Equation 1,
qw ∝√ρ∞Rn
U3∞ (1)
where ρ∞ and U∞ are the freestream mass density and velocity, respectively, and Rn is the radius of theleading edge. This increase in the aerodynamic heating causes the temperature at the leading edge to reachwell over 2000 K for hypersonic flight. As a result, hypersonic vehicles use a thermal protection system(TPS) to insulate the vehicle from these extreme temperatures. Current TPS materials, however, may beinappropriate for hypersonic planes because they either cannot sustain the large heating rates or they areablative and not reusable.
One approach to solve this issue of high localized heating rates is to use ultra high temperature composite(UHTC) materials at the leading edges of the hypersonic vehicle. This approach was used on the NASA X-43experimental hypersonic aircraft, which reached Mach 10 during its final flight in 2004.3 UHTC materials,however, have physical limitations such as heavy weight and weak fracture toughness that may preventtheir use in some future hypersonic vehicles.4 Another approach that has been proposed involves the use ofthermo-electric materials at the leading edges of hypersonic vehicles. These materials can generate a currentof electrons when exposed to high temperatures that may lead to a transpiration cooling effect of the vehiclesurface. This phenomenon is known as thermionic electron emission and occurs when the thermal energygiven to the electrons (by aerodynamic heating in this case) is greater than the binding potential of thesurface material.
Assuming that such thermo-electric materials exist with thermal and physical properties that can with-stand the conditions of hypersonic flight, an initial conceptual analysis of the aerothermal environmentexperienced by the hypersonic vehicle using computational fluid dynamics (CFD) is the most appropriatestarting point since experimental studies of such systems would be both expensive and technically challeng-ing. Therefore, this paper aims to present a conceptual analysis of the aerothermodynamic characteristicsof hypersonic vehicles with thermo-electric materials using CFD. The paper is presented as follows. First,a description of the numerical method and test case conditions are outlined. Then, numerical results arepresented that highlight the potential cooling effect provided by thermo-electric TPS materials. Next, aparametric study is performed to understand the influence of material work function, freestream velocity,and leading edge geometry on this cooling phenomenon. The effects of the electric field generated by thethermionic electron emission are then estimated and discussed. Finally, the paper presents some conclusionsdrawn from this study and outlines future work recommendations.
2 of 18
American Institute of Aeronautics and Astronautics
Dow
nloa
ded
by U
nive
rsity
of
Mic
higa
n -
Dud
erst
adt C
ente
r on
Dec
embe
r 13
, 201
7 | h
ttp://
arc.
aiaa
.org
| D
OI:
10.
2514
/6.2
014-
2674
II. Numerical Approach
The numerical simulations are performed in this study using the CFD code LeMANS.5,6 LeMANS isa three-dimensional, parallel code that solves the Navier-Stokes equations on unstructured computationalgrids including thermo-chemical nonequilibrium effects. In LeMANS, the flow is modeled assuming that thecontinuum approximation is valid. It is also assumed that the translational and rotational energy modes canbe described by a single temperature, Ttr, and that the vibrational, electronic, and electron translationalenergy modes are described by a different temperature Tve. The fluid conservation equations solved inLeMANS are,
∂Q
∂t+∇ · (F + Fv) = S (2)
where, Q, F, and Fv are the vectors of conserved variables, inviscid flux, and viscous flux, respectively, andare given by,
Q =
ρ1...
ρNS
ρU
Et
Eve
, F =
ρ1U...
ρNSU
ρUU + pI
(Et + p) U
EveU
, Fv =
J1
...
JNS
−τ−τU + (qtr + qve) +
∑Jshs
qve +∑
Jseve,s
(3)
In the expressions above, ρ1 · · · ρNS are the species densities, U is the bulk velocity, Et and Eve are the totaland vibrational-electron-electronic energy per unit volume of mixture, p is the pressure, I is the identitymatrix, τ is the viscous stress tensor, qtr and qve are the translational-rotational and vibrational-electron-electronic heat fluxes, Js is the diffusion flux of species s, and hs is the enthalpy of species s.
The source terms vector, S, accounts for the production/consumption of species by chemical reactionsand the transfer of energy to/from the vibrational-electronic-electron mode and is given by,
S =
w1
...
wNS
0
0
wve
(4)
The mixture transport properties are calculated using Wilke’s semi-empirical mixing rule7 with speciesviscosities calculated using Blottner’s curve fits8 and species thermal conductivities determined using Eu-cken’s relation.9 The mass diffusion coefficient for each species is replaced by a single binary coefficient thatis computed assuming a constant Lewis number of 1.4. The mass diffusion fluxes of heavy particles aremodeled using a modified version of Fick’s Law,10 and the diffusion flux of electrons is calculated assumingambipolar diffusion. The viscous stresses are modeled assuming a Newtonian fluid and Stokes’ hypothesis,and the heat fluxes are modeled according to Fourier’s law for all temperatures.
The set of governing equations are solved using the finite-volume method applied to unstructured gridswith second-order spatial accuracy. LeMANS can simulate two-dimensional and axisymmetric flows usingany mixture of quadrilateral and triangular mesh cells, and three-dimensional flows using any mixture ofhexahedra, tetrahedra, prisms, and pyramids. A modified Steger-Warming Flux Vector Splitting scheme11
is used to discretize the inviscid fluxes across cell faces, which is less dissipative and produces better resultsin boundary layers compared to the original scheme. The viscous terms are computed using cell-centeredand nodal values. LeMANS is parallelized using METIS12 to partition the computational mesh, and theMessage Passing Interface (MPI) to communicate the necessary information between processors.
A new boundary condition has been implemented in LeMANS to model thermionic electron emission atthe surface of a hypersonic vehicle. The production rate of electrons (in mol/s/m2) at the surface due toemission and ion recombination is calculated by,
3 of 18
American Institute of Aeronautics and Astronautics
Dow
nloa
ded
by U
nive
rsity
of
Mic
higa
n -
Dud
erst
adt C
ente
r on
Dec
embe
r 13
, 201
7 | h
ttp://
arc.
aiaa
.org
| D
OI:
10.
2514
/6.2
014-
2674
we =Je
QeNAv+∑
s=ions
ws (5)
where Je is the emission current density, Qe is the electron charge, NA is the Avogadro constant, and wi isthe production rate of ions. The current density is calculated using Richardson’s law,13,14 which relates thecurrent from a heated material to the temperature of the material and is given by,
Je = ART2w exp
(−Φ
kbTw
)(6)
where Tw is the surface temperature, kb is the Boltzmann constant, AR is a material-dependent constantassumed to be equal to 1.20 × 10⁶ A/m2/K2 in the current study, and Φ is the work function defined asthe minimum energy needed to remove an electron from the material. The work function depends on theatomic configuration at the surface of the vehicle and, therefore, varies based on the material (e.g. 4 eV foraluminum and 2 eV for cesium15). Note that in the current study, electrons can only be emitted from thesurface using Richardson’s law and are assumed to not recombine back to the surface. The production ratesof ions (and the corresponding neutrals) are calculated assuming that the surface is fully catalytic to ionsand are given by,16
wi = − ρiMi
√RuTw2πMi
(7)
The gas properties at the surface of the hypersonic vehicle are calculated in LeMANS by solving thespecies mass balance,
−ρwDs,w∇Ys,w + mYs,w = Msws (8)
momentum balance,
pn + ρnv2n = pw +
m2
ρw(9)
and energy balance,
qw = σsbεT4w +
JeQe
(Φ + 2kbTw) (10)
equations to obtain the species mass fractions (Yk,w), gas density (ρw), temperature (Tw), and gas normalvelocity (vw). The mass blowing rate, m, is defined as the product of the electron production rate and theelectron mass,
m = Mewe (11)
III. Test Case Description
The geometry of the test case considered in this study is representative of the leading edge of a hypersonicvehicle and is shown in Fig. 1. The nose radius is 1.0 cm (unless otherwise stated), the length of the modelis 0.25 m, and the cone angle is 5.0◦. The material emissivity is assumed to be equal to 1.0. The freestreamconditions are presented in Table 1 and correspond to an altitude of 60 km. A standard finite-rate chemistrymodel17 for eleven species reacting air (N2, O2, NO, N, O, N+
2 , O+2 , NO+, N+, O+, and e) is used in this
study. Park’s two-temperature model17 is used to account for the effect of thermal nonequilibrium on theforward and backward chemical reaction rates. Only one-half of the leading edge geometry is consideredin the numerical simulations in order to reduce the computational cost. The computational grid containsapproximately 20,000 cells, with 160 cells normal to the vehicle and 125 cells along the surface. A gridconvergence study using the conditions without thermionic electron emission revealed that the solution isgrid-independent using this mesh.
4 of 18
American Institute of Aeronautics and Astronautics
Dow
nloa
ded
by U
nive
rsity
of
Mic
higa
n -
Dud
erst
adt C
ente
r on
Dec
embe
r 13
, 201
7 | h
ttp://
arc.
aiaa
.org
| D
OI:
10.
2514
/6.2
014-
2674
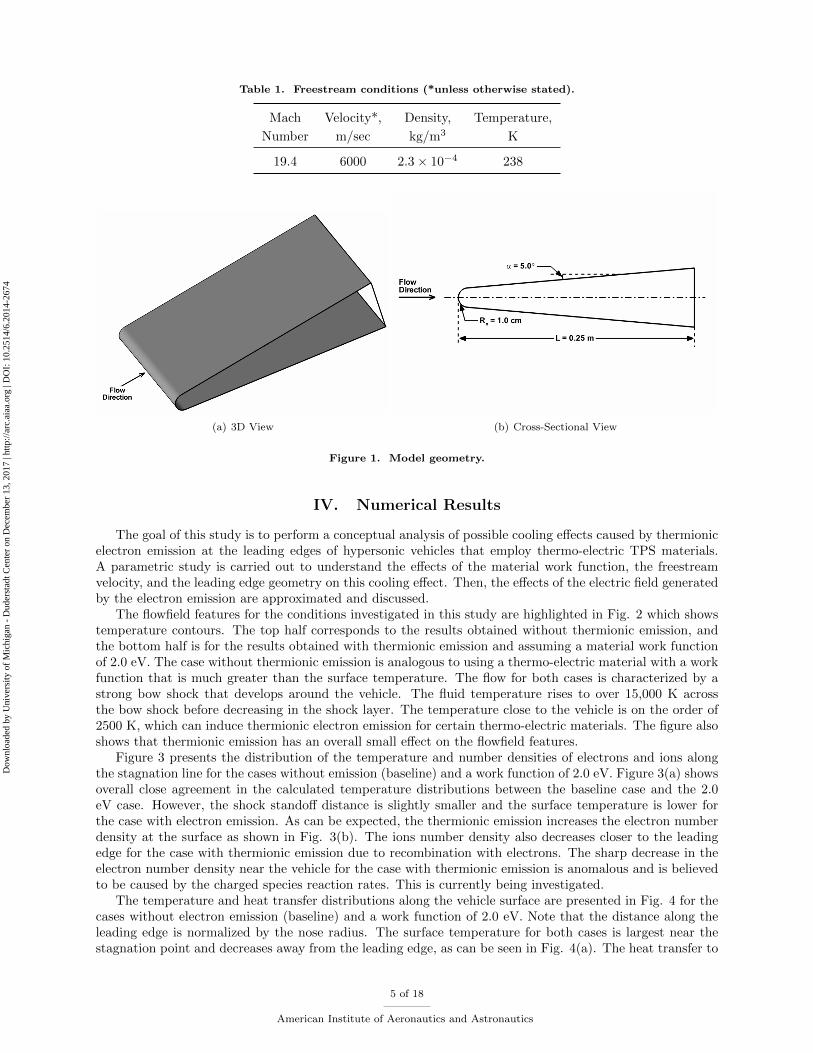
Table 1. Freestream conditions (*unless otherwise stated).
Mach Velocity*, Density, Temperature,
Number m/sec kg/m3 K
19.4 6000 2.3× 10⁻⁴ 238
(a) 3D View (b) Cross-Sectional View
Figure 1. Model geometry.
IV. Numerical Results
The goal of this study is to perform a conceptual analysis of possible cooling effects caused by thermionicelectron emission at the leading edges of hypersonic vehicles that employ thermo-electric TPS materials.A parametric study is carried out to understand the effects of the material work function, the freestreamvelocity, and the leading edge geometry on this cooling effect. Then, the effects of the electric field generatedby the electron emission are approximated and discussed.
The flowfield features for the conditions investigated in this study are highlighted in Fig. 2 which showstemperature contours. The top half corresponds to the results obtained without thermionic emission, andthe bottom half is for the results obtained with thermionic emission and assuming a material work functionof 2.0 eV. The case without thermionic emission is analogous to using a thermo-electric material with a workfunction that is much greater than the surface temperature. The flow for both cases is characterized by astrong bow shock that develops around the vehicle. The fluid temperature rises to over 15,000 K acrossthe bow shock before decreasing in the shock layer. The temperature close to the vehicle is on the order of2500 K, which can induce thermionic electron emission for certain thermo-electric materials. The figure alsoshows that thermionic emission has an overall small effect on the flowfield features.
Figure 3 presents the distribution of the temperature and number densities of electrons and ions alongthe stagnation line for the cases without emission (baseline) and a work function of 2.0 eV. Figure 3(a) showsoverall close agreement in the calculated temperature distributions between the baseline case and the 2.0eV case. However, the shock standoff distance is slightly smaller and the surface temperature is lower forthe case with electron emission. As can be expected, the thermionic emission increases the electron numberdensity at the surface as shown in Fig. 3(b). The ions number density also decreases closer to the leadingedge for the case with thermionic emission due to recombination with electrons. The sharp decrease in theelectron number density near the vehicle for the case with thermionic emission is anomalous and is believedto be caused by the charged species reaction rates. This is currently being investigated.
The temperature and heat transfer distributions along the vehicle surface are presented in Fig. 4 for thecases without electron emission (baseline) and a work function of 2.0 eV. Note that the distance along theleading edge is normalized by the nose radius. The surface temperature for both cases is largest near thestagnation point and decreases away from the leading edge, as can be seen in Fig. 4(a). The heat transfer to
5 of 18
American Institute of Aeronautics and Astronautics
Dow
nloa
ded
by U
nive
rsity
of
Mic
higa
n -
Dud
erst
adt C
ente
r on
Dec
embe
r 13
, 201
7 | h
ttp://
arc.
aiaa
.org
| D
OI:
10.
2514
/6.2
014-
2674
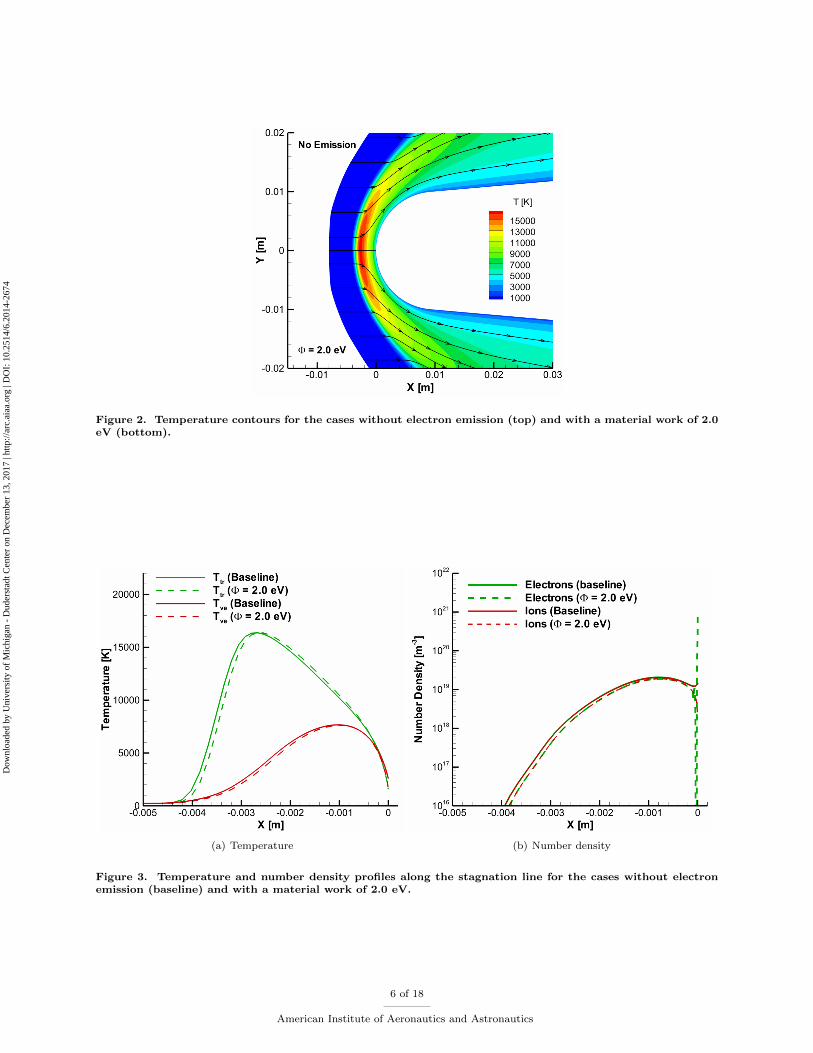
Figure 2. Temperature contours for the cases without electron emission (top) and with a material work of 2.0eV (bottom).
(a) Temperature (b) Number density
Figure 3. Temperature and number density profiles along the stagnation line for the cases without electronemission (baseline) and with a material work of 2.0 eV.
6 of 18
American Institute of Aeronautics and Astronautics
Dow
nloa
ded
by U
nive
rsity
of
Mic
higa
n -
Dud
erst
adt C
ente
r on
Dec
embe
r 13
, 201
7 | h
ttp://
arc.
aiaa
.org
| D
OI:
10.
2514
/6.2
014-
2674
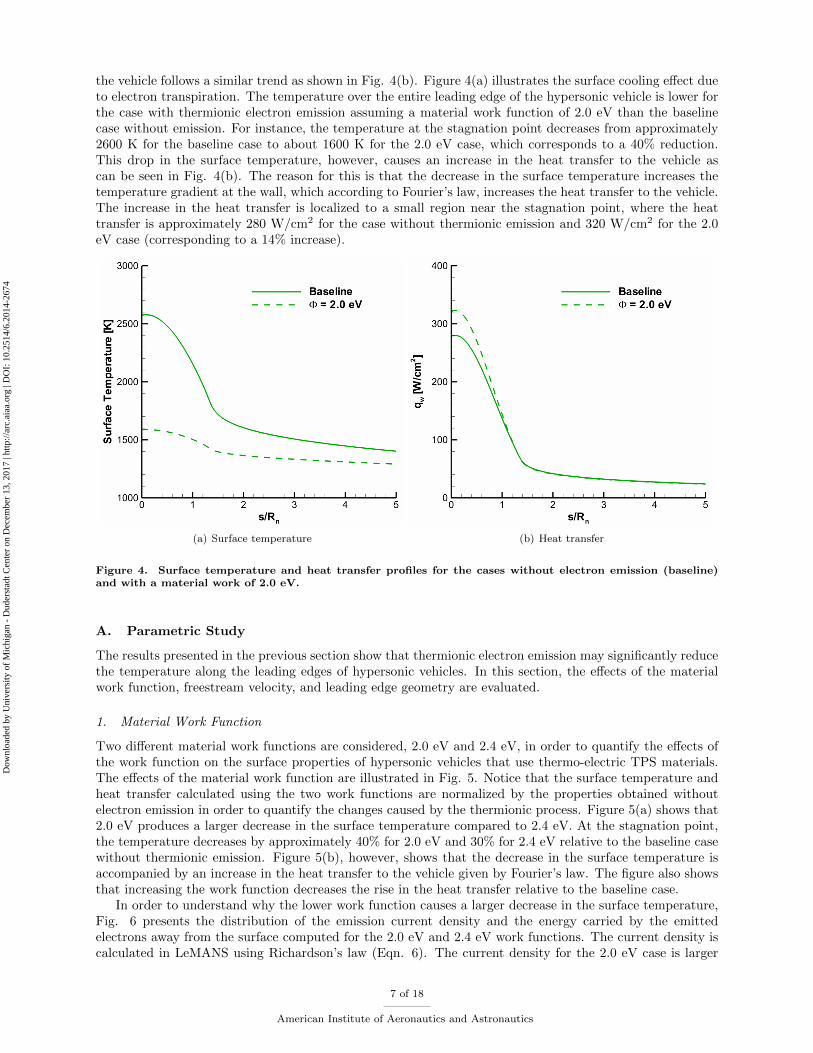
the vehicle follows a similar trend as shown in Fig. 4(b). Figure 4(a) illustrates the surface cooling effect dueto electron transpiration. The temperature over the entire leading edge of the hypersonic vehicle is lower forthe case with thermionic electron emission assuming a material work function of 2.0 eV than the baselinecase without emission. For instance, the temperature at the stagnation point decreases from approximately2600 K for the baseline case to about 1600 K for the 2.0 eV case, which corresponds to a 40% reduction.This drop in the surface temperature, however, causes an increase in the heat transfer to the vehicle ascan be seen in Fig. 4(b). The reason for this is that the decrease in the surface temperature increases thetemperature gradient at the wall, which according to Fourier’s law, increases the heat transfer to the vehicle.The increase in the heat transfer is localized to a small region near the stagnation point, where the heattransfer is approximately 280 W/cm2 for the case without thermionic emission and 320 W/cm2 for the 2.0eV case (corresponding to a 14% increase).
(a) Surface temperature (b) Heat transfer
Figure 4. Surface temperature and heat transfer profiles for the cases without electron emission (baseline)and with a material work of 2.0 eV.
A. Parametric Study
The results presented in the previous section show that thermionic electron emission may significantly reducethe temperature along the leading edges of hypersonic vehicles. In this section, the effects of the materialwork function, freestream velocity, and leading edge geometry are evaluated.
1. Material Work Function
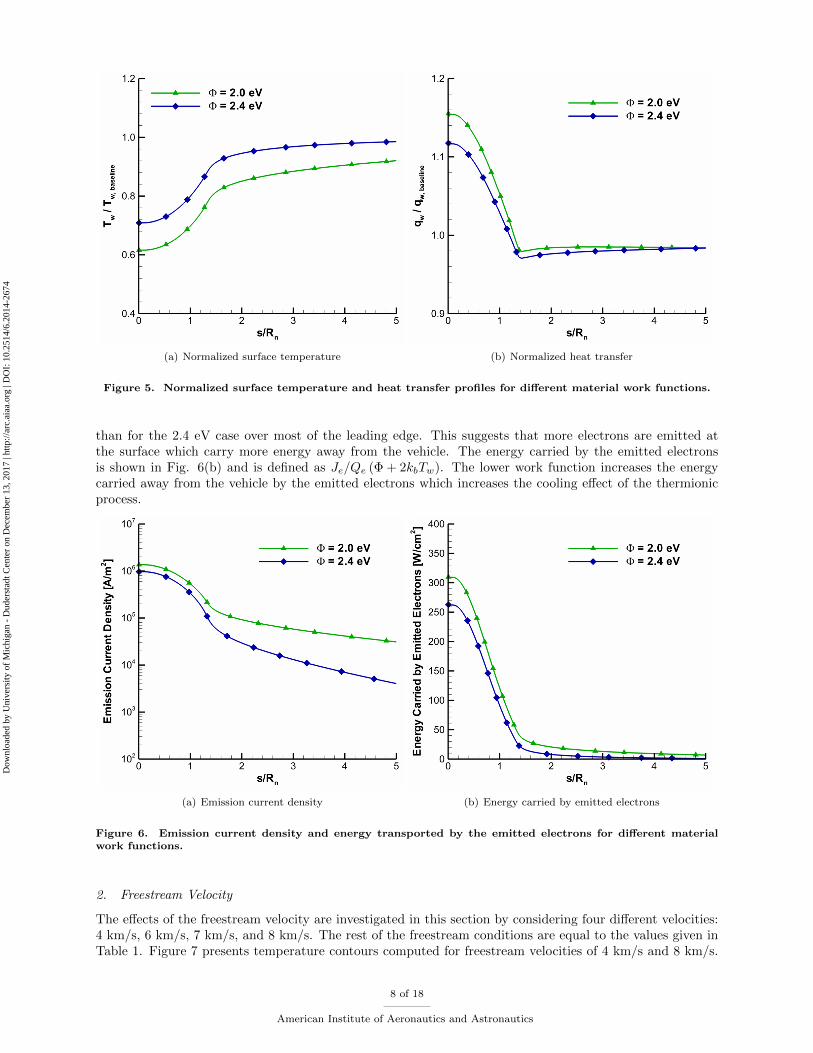
Two different material work functions are considered, 2.0 eV and 2.4 eV, in order to quantify the effects ofthe work function on the surface properties of hypersonic vehicles that use thermo-electric TPS materials.The effects of the material work function are illustrated in Fig. 5. Notice that the surface temperature andheat transfer calculated using the two work functions are normalized by the properties obtained withoutelectron emission in order to quantify the changes caused by the thermionic process. Figure 5(a) shows that2.0 eV produces a larger decrease in the surface temperature compared to 2.4 eV. At the stagnation point,the temperature decreases by approximately 40% for 2.0 eV and 30% for 2.4 eV relative to the baseline casewithout thermionic emission. Figure 5(b), however, shows that the decrease in the surface temperature isaccompanied by an increase in the heat transfer to the vehicle given by Fourier’s law. The figure also showsthat increasing the work function decreases the rise in the heat transfer relative to the baseline case.
In order to understand why the lower work function causes a larger decrease in the surface temperature,Fig. 6 presents the distribution of the emission current density and the energy carried by the emittedelectrons away from the surface computed for the 2.0 eV and 2.4 eV work functions. The current density iscalculated in LeMANS using Richardson’s law (Eqn. 6). The current density for the 2.0 eV case is larger
7 of 18
American Institute of Aeronautics and Astronautics
Dow
nloa
ded
by U
nive
rsity
of
Mic
higa
n -
Dud
erst
adt C
ente
r on
Dec
embe
r 13
, 201
7 | h
ttp://
arc.
aiaa
.org
| D
OI:
10.
2514
/6.2
014-
2674
(a) Normalized surface temperature (b) Normalized heat transfer
Figure 5. Normalized surface temperature and heat transfer profiles for different material work functions.
than for the 2.4 eV case over most of the leading edge. This suggests that more electrons are emitted atthe surface which carry more energy away from the vehicle. The energy carried by the emitted electronsis shown in Fig. 6(b) and is defined as Je/Qe (Φ + 2kbTw). The lower work function increases the energycarried away from the vehicle by the emitted electrons which increases the cooling effect of the thermionicprocess.
(a) Emission current density (b) Energy carried by emitted electrons
Figure 6. Emission current density and energy transported by the emitted electrons for different materialwork functions.
2. Freestream Velocity
The effects of the freestream velocity are investigated in this section by considering four different velocities:4 km/s, 6 km/s, 7 km/s, and 8 km/s. The rest of the freestream conditions are equal to the values given inTable 1. Figure 7 presents temperature contours computed for freestream velocities of 4 km/s and 8 km/s.
8 of 18
American Institute of Aeronautics and Astronautics
Dow
nloa
ded
by U
nive
rsity
of
Mic
higa
n -
Dud
erst
adt C
ente
r on
Dec
embe
r 13
, 201
7 | h
ttp://
arc.
aiaa
.org
| D
OI:
10.
2514
/6.2
014-
2674
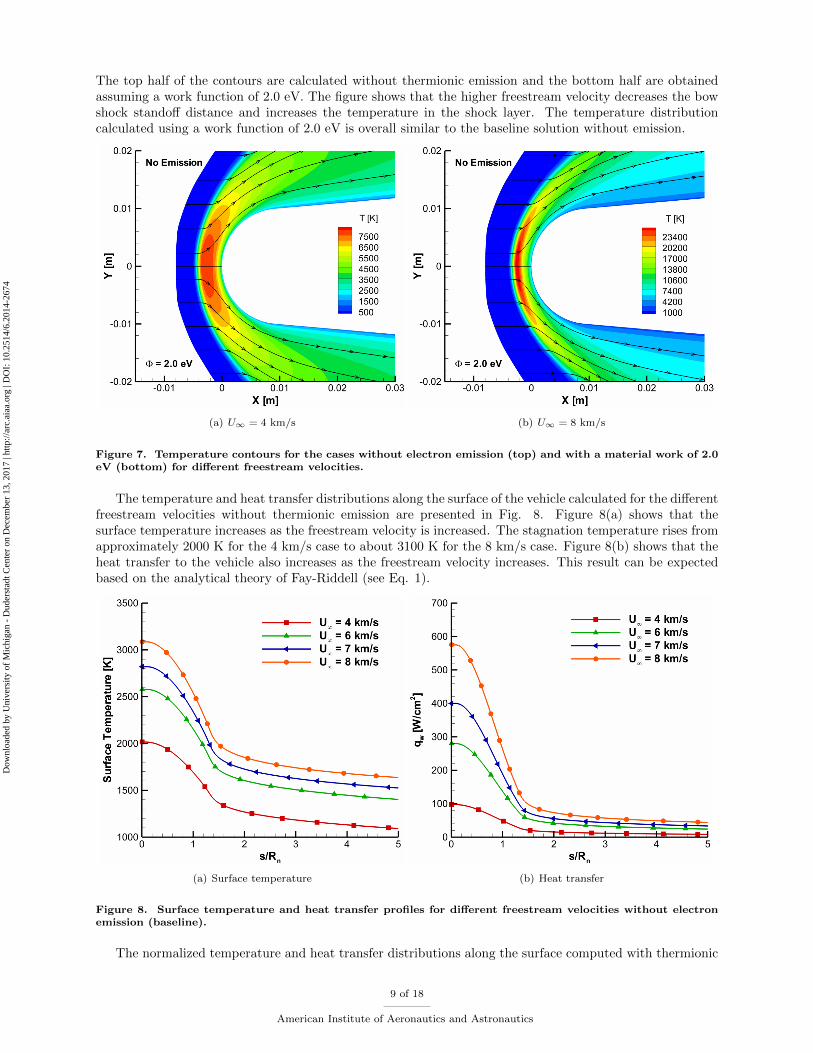
The top half of the contours are calculated without thermionic emission and the bottom half are obtainedassuming a work function of 2.0 eV. The figure shows that the higher freestream velocity decreases the bowshock standoff distance and increases the temperature in the shock layer. The temperature distributioncalculated using a work function of 2.0 eV is overall similar to the baseline solution without emission.
(a) U∞ = 4 km/s (b) U∞ = 8 km/s
Figure 7. Temperature contours for the cases without electron emission (top) and with a material work of 2.0eV (bottom) for different freestream velocities.
The temperature and heat transfer distributions along the surface of the vehicle calculated for the differentfreestream velocities without thermionic emission are presented in Fig. 8. Figure 8(a) shows that thesurface temperature increases as the freestream velocity is increased. The stagnation temperature rises fromapproximately 2000 K for the 4 km/s case to about 3100 K for the 8 km/s case. Figure 8(b) shows that theheat transfer to the vehicle also increases as the freestream velocity increases. This result can be expectedbased on the analytical theory of Fay-Riddell (see Eq. 1).
(a) Surface temperature (b) Heat transfer
Figure 8. Surface temperature and heat transfer profiles for different freestream velocities without electronemission (baseline).
The normalized temperature and heat transfer distributions along the surface computed with thermionic
9 of 18
American Institute of Aeronautics and Astronautics
Dow
nloa
ded
by U
nive
rsity
of
Mic
higa
n -
Dud
erst
adt C
ente
r on
Dec
embe
r 13
, 201
7 | h
ttp://
arc.
aiaa
.org
| D
OI:
10.
2514
/6.2
014-
2674
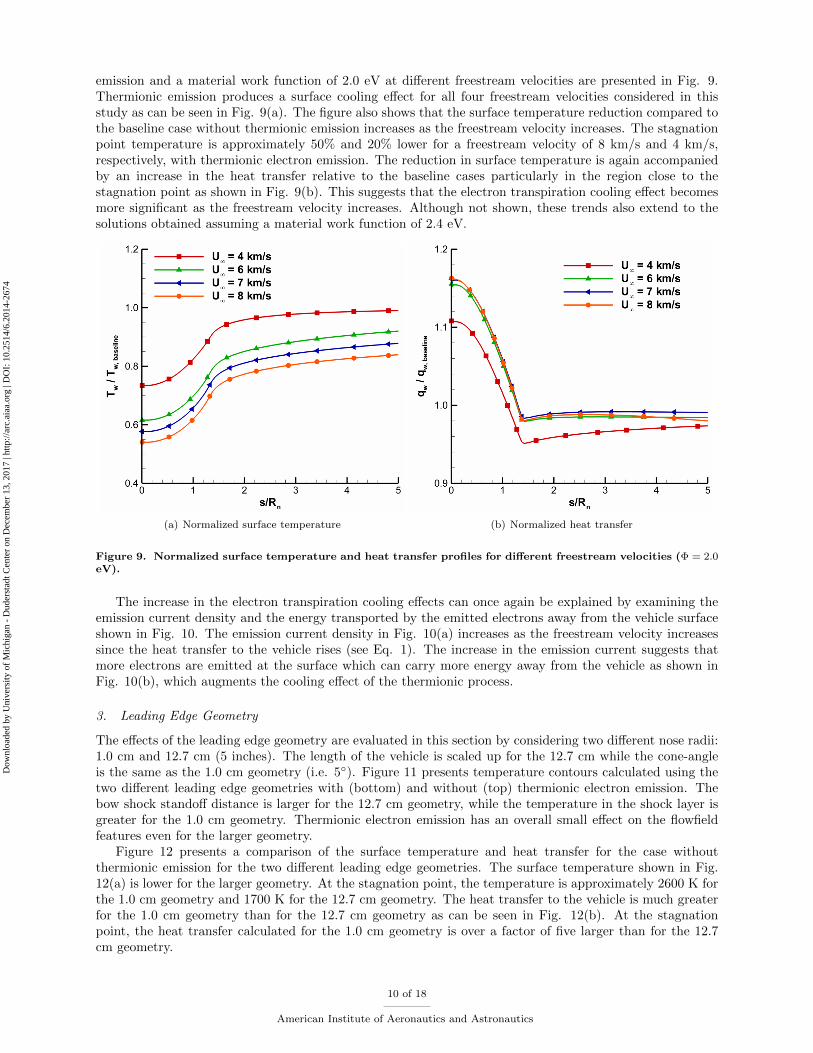
emission and a material work function of 2.0 eV at different freestream velocities are presented in Fig. 9.Thermionic emission produces a surface cooling effect for all four freestream velocities considered in thisstudy as can be seen in Fig. 9(a). The figure also shows that the surface temperature reduction compared tothe baseline case without thermionic emission increases as the freestream velocity increases. The stagnationpoint temperature is approximately 50% and 20% lower for a freestream velocity of 8 km/s and 4 km/s,respectively, with thermionic electron emission. The reduction in surface temperature is again accompaniedby an increase in the heat transfer relative to the baseline cases particularly in the region close to thestagnation point as shown in Fig. 9(b). This suggests that the electron transpiration cooling effect becomesmore significant as the freestream velocity increases. Although not shown, these trends also extend to thesolutions obtained assuming a material work function of 2.4 eV.
(a) Normalized surface temperature (b) Normalized heat transfer
Figure 9. Normalized surface temperature and heat transfer profiles for different freestream velocities (Φ = 2.0eV).
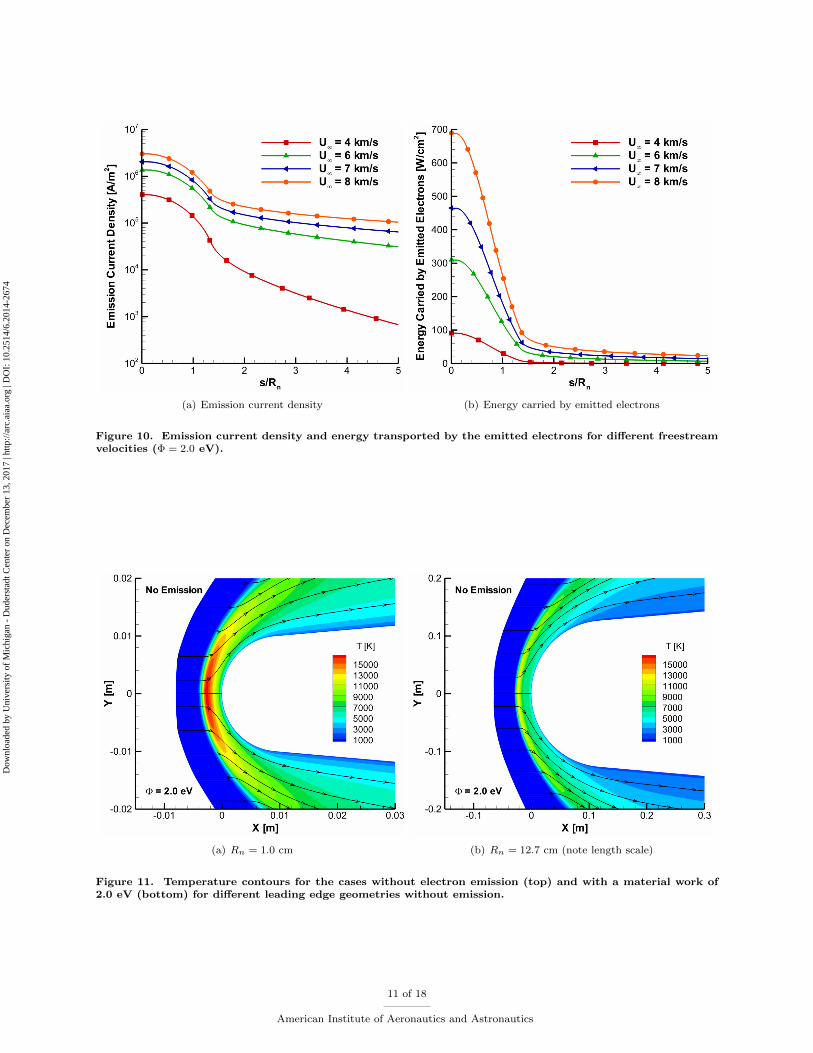
The increase in the electron transpiration cooling effects can once again be explained by examining theemission current density and the energy transported by the emitted electrons away from the vehicle surfaceshown in Fig. 10. The emission current density in Fig. 10(a) increases as the freestream velocity increasessince the heat transfer to the vehicle rises (see Eq. 1). The increase in the emission current suggests thatmore electrons are emitted at the surface which can carry more energy away from the vehicle as shown inFig. 10(b), which augments the cooling effect of the thermionic process.
3. Leading Edge Geometry
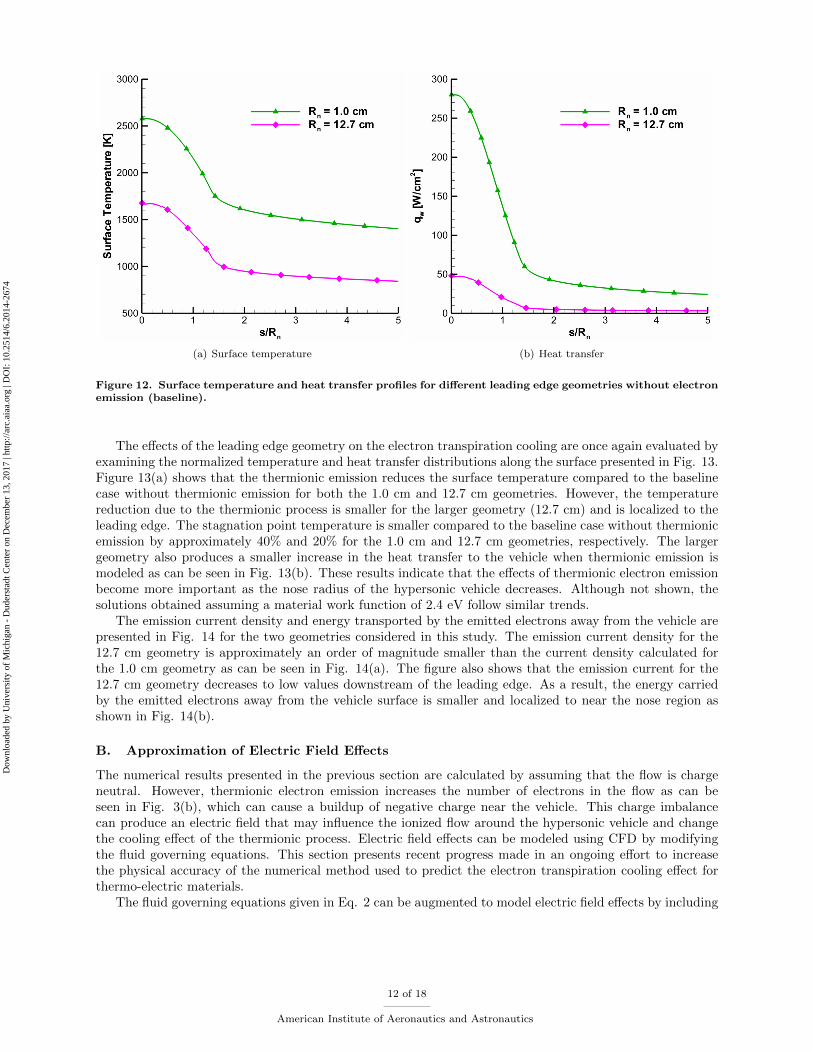
The effects of the leading edge geometry are evaluated in this section by considering two different nose radii:1.0 cm and 12.7 cm (5 inches). The length of the vehicle is scaled up for the 12.7 cm while the cone-angleis the same as the 1.0 cm geometry (i.e. 5◦). Figure 11 presents temperature contours calculated using thetwo different leading edge geometries with (bottom) and without (top) thermionic electron emission. Thebow shock standoff distance is larger for the 12.7 cm geometry, while the temperature in the shock layer isgreater for the 1.0 cm geometry. Thermionic electron emission has an overall small effect on the flowfieldfeatures even for the larger geometry.
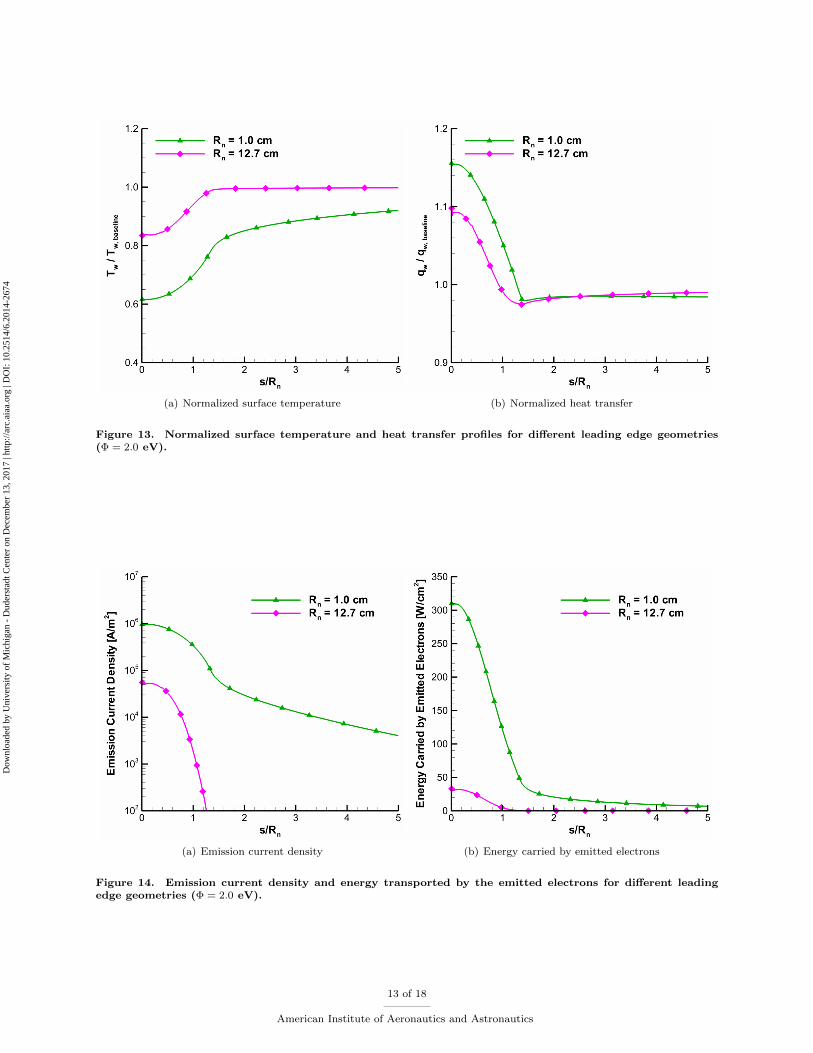
Figure 12 presents a comparison of the surface temperature and heat transfer for the case withoutthermionic emission for the two different leading edge geometries. The surface temperature shown in Fig.12(a) is lower for the larger geometry. At the stagnation point, the temperature is approximately 2600 K forthe 1.0 cm geometry and 1700 K for the 12.7 cm geometry. The heat transfer to the vehicle is much greaterfor the 1.0 cm geometry than for the 12.7 cm geometry as can be seen in Fig. 12(b). At the stagnationpoint, the heat transfer calculated for the 1.0 cm geometry is over a factor of five larger than for the 12.7cm geometry.
10 of 18
American Institute of Aeronautics and Astronautics
Dow
nloa
ded
by U
nive
rsity
of
Mic
higa
n -
Dud
erst
adt C
ente
r on
Dec
embe
r 13
, 201
7 | h
ttp://
arc.
aiaa
.org
| D
OI:
10.
2514
/6.2
014-
2674
(a) Emission current density (b) Energy carried by emitted electrons
Figure 10. Emission current density and energy transported by the emitted electrons for different freestreamvelocities (Φ = 2.0 eV).
(a) Rn = 1.0 cm (b) Rn = 12.7 cm (note length scale)
Figure 11. Temperature contours for the cases without electron emission (top) and with a material work of2.0 eV (bottom) for different leading edge geometries without emission.
11 of 18
American Institute of Aeronautics and Astronautics
Dow
nloa
ded
by U
nive
rsity
of
Mic
higa
n -
Dud
erst
adt C
ente
r on
Dec
embe
r 13
, 201
7 | h
ttp://
arc.
aiaa
.org
| D
OI:
10.
2514
/6.2
014-
2674
(a) Surface temperature (b) Heat transfer
Figure 12. Surface temperature and heat transfer profiles for different leading edge geometries without electronemission (baseline).
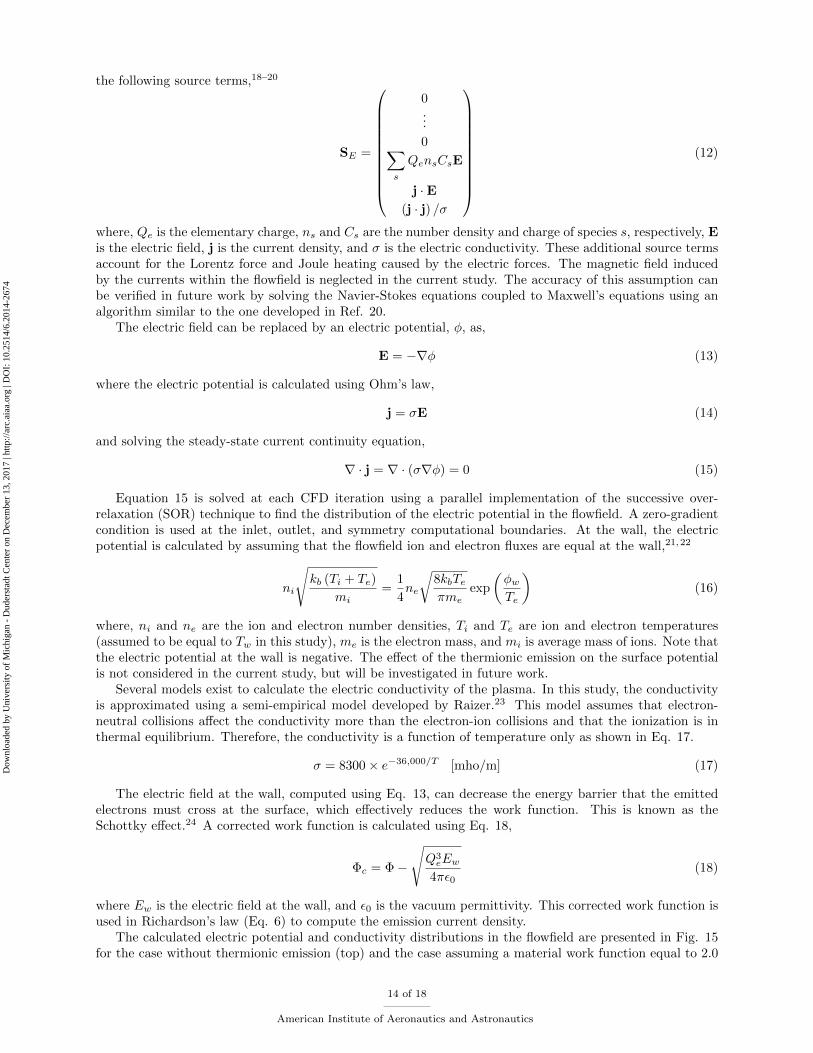
The effects of the leading edge geometry on the electron transpiration cooling are once again evaluated byexamining the normalized temperature and heat transfer distributions along the surface presented in Fig. 13.Figure 13(a) shows that the thermionic emission reduces the surface temperature compared to the baselinecase without thermionic emission for both the 1.0 cm and 12.7 cm geometries. However, the temperaturereduction due to the thermionic process is smaller for the larger geometry (12.7 cm) and is localized to theleading edge. The stagnation point temperature is smaller compared to the baseline case without thermionicemission by approximately 40% and 20% for the 1.0 cm and 12.7 cm geometries, respectively. The largergeometry also produces a smaller increase in the heat transfer to the vehicle when thermionic emission ismodeled as can be seen in Fig. 13(b). These results indicate that the effects of thermionic electron emissionbecome more important as the nose radius of the hypersonic vehicle decreases. Although not shown, thesolutions obtained assuming a material work function of 2.4 eV follow similar trends.
The emission current density and energy transported by the emitted electrons away from the vehicle arepresented in Fig. 14 for the two geometries considered in this study. The emission current density for the12.7 cm geometry is approximately an order of magnitude smaller than the current density calculated forthe 1.0 cm geometry as can be seen in Fig. 14(a). The figure also shows that the emission current for the12.7 cm geometry decreases to low values downstream of the leading edge. As a result, the energy carriedby the emitted electrons away from the vehicle surface is smaller and localized to near the nose region asshown in Fig. 14(b).
B. Approximation of Electric Field Effects
The numerical results presented in the previous section are calculated by assuming that the flow is chargeneutral. However, thermionic electron emission increases the number of electrons in the flow as can beseen in Fig. 3(b), which can cause a buildup of negative charge near the vehicle. This charge imbalancecan produce an electric field that may influence the ionized flow around the hypersonic vehicle and changethe cooling effect of the thermionic process. Electric field effects can be modeled using CFD by modifyingthe fluid governing equations. This section presents recent progress made in an ongoing effort to increasethe physical accuracy of the numerical method used to predict the electron transpiration cooling effect forthermo-electric materials.
The fluid governing equations given in Eq. 2 can be augmented to model electric field effects by including
12 of 18
American Institute of Aeronautics and Astronautics
Dow
nloa
ded
by U
nive
rsity
of
Mic
higa
n -
Dud
erst
adt C
ente
r on
Dec
embe
r 13
, 201
7 | h
ttp://
arc.
aiaa
.org
| D
OI:
10.
2514
/6.2
014-
2674
(a) Normalized surface temperature (b) Normalized heat transfer
Figure 13. Normalized surface temperature and heat transfer profiles for different leading edge geometries(Φ = 2.0 eV).
(a) Emission current density (b) Energy carried by emitted electrons
Figure 14. Emission current density and energy transported by the emitted electrons for different leadingedge geometries (Φ = 2.0 eV).
13 of 18
American Institute of Aeronautics and Astronautics
Dow
nloa
ded
by U
nive
rsity
of
Mic
higa
n -
Dud
erst
adt C
ente
r on
Dec
embe
r 13
, 201
7 | h
ttp://
arc.
aiaa
.org
| D
OI:
10.
2514
/6.2
014-
2674
the following source terms,18–20
SE =
0...
0∑s
QensCsE
j ·E(j · j) /σ
(12)
where, Qe is the elementary charge, ns and Cs are the number density and charge of species s, respectively, Eis the electric field, j is the current density, and σ is the electric conductivity. These additional source termsaccount for the Lorentz force and Joule heating caused by the electric forces. The magnetic field inducedby the currents within the flowfield is neglected in the current study. The accuracy of this assumption canbe verified in future work by solving the Navier-Stokes equations coupled to Maxwell’s equations using analgorithm similar to the one developed in Ref. 20.
The electric field can be replaced by an electric potential, φ, as,
E = −∇φ (13)
where the electric potential is calculated using Ohm’s law,
j = σE (14)
and solving the steady-state current continuity equation,
∇ · j = ∇ · (σ∇φ) = 0 (15)
Equation 15 is solved at each CFD iteration using a parallel implementation of the successive over-relaxation (SOR) technique to find the distribution of the electric potential in the flowfield. A zero-gradientcondition is used at the inlet, outlet, and symmetry computational boundaries. At the wall, the electricpotential is calculated by assuming that the flowfield ion and electron fluxes are equal at the wall,21,22
ni
√kb (Ti + Te)
mi=
1
4ne
√8kbTeπme
exp
(φwTe
)(16)
where, ni and ne are the ion and electron number densities, Ti and Te are ion and electron temperatures(assumed to be equal to Tw in this study), me is the electron mass, and mi is average mass of ions. Note thatthe electric potential at the wall is negative. The effect of the thermionic emission on the surface potentialis not considered in the current study, but will be investigated in future work.
Several models exist to calculate the electric conductivity of the plasma. In this study, the conductivityis approximated using a semi-empirical model developed by Raizer.23 This model assumes that electron-neutral collisions affect the conductivity more than the electron-ion collisions and that the ionization is inthermal equilibrium. Therefore, the conductivity is a function of temperature only as shown in Eq. 17.
σ = 8300× e−36,000/T [mho/m] (17)
The electric field at the wall, computed using Eq. 13, can decrease the energy barrier that the emittedelectrons must cross at the surface, which effectively reduces the work function. This is known as theSchottky effect.24 A corrected work function is calculated using Eq. 18,
Φc = Φ−
√Q3
eEw
4πε0(18)
where Ew is the electric field at the wall, and ε0 is the vacuum permittivity. This corrected work function isused in Richardson’s law (Eq. 6) to compute the emission current density.
The calculated electric potential and conductivity distributions in the flowfield are presented in Fig. 15for the case without thermionic emission (top) and the case assuming a material work function equal to 2.0
14 of 18
American Institute of Aeronautics and Astronautics
Dow
nloa
ded
by U
nive
rsity
of
Mic
higa
n -
Dud
erst
adt C
ente
r on
Dec
embe
r 13
, 201
7 | h
ttp://
arc.
aiaa
.org
| D
OI:
10.
2514
/6.2
014-
2674
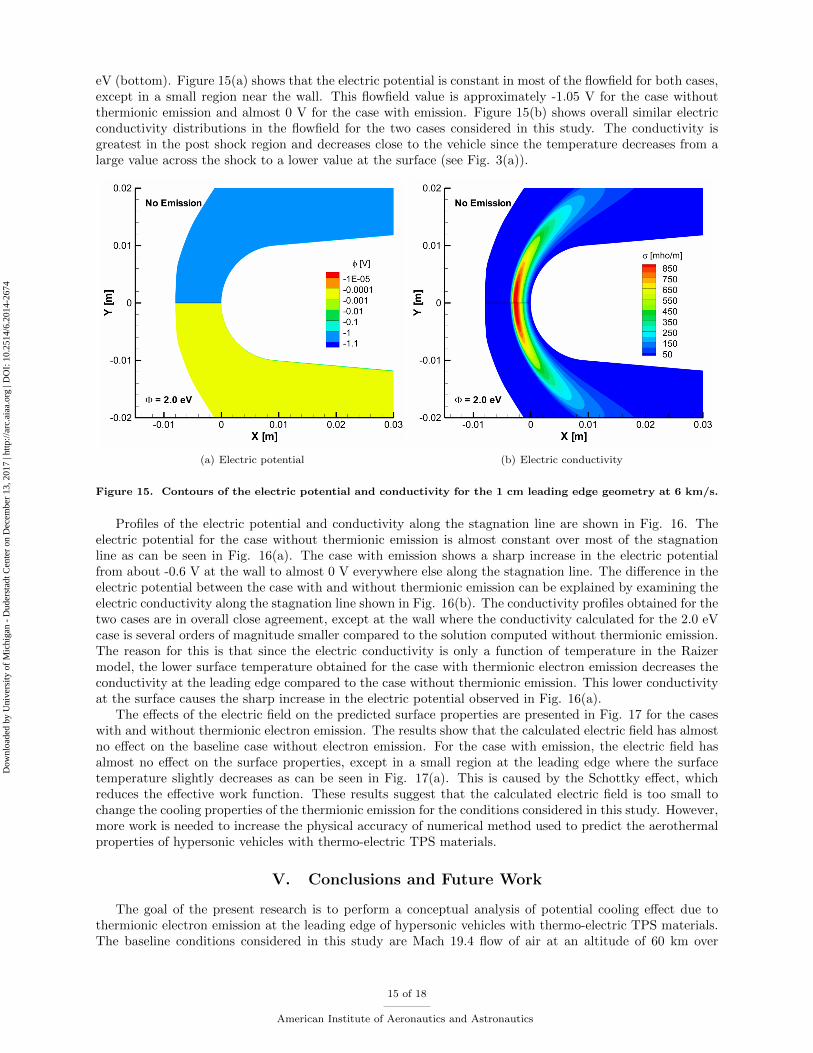
eV (bottom). Figure 15(a) shows that the electric potential is constant in most of the flowfield for both cases,except in a small region near the wall. This flowfield value is approximately -1.05 V for the case withoutthermionic emission and almost 0 V for the case with emission. Figure 15(b) shows overall similar electricconductivity distributions in the flowfield for the two cases considered in this study. The conductivity isgreatest in the post shock region and decreases close to the vehicle since the temperature decreases from alarge value across the shock to a lower value at the surface (see Fig. 3(a)).
(a) Electric potential (b) Electric conductivity
Figure 15. Contours of the electric potential and conductivity for the 1 cm leading edge geometry at 6 km/s.
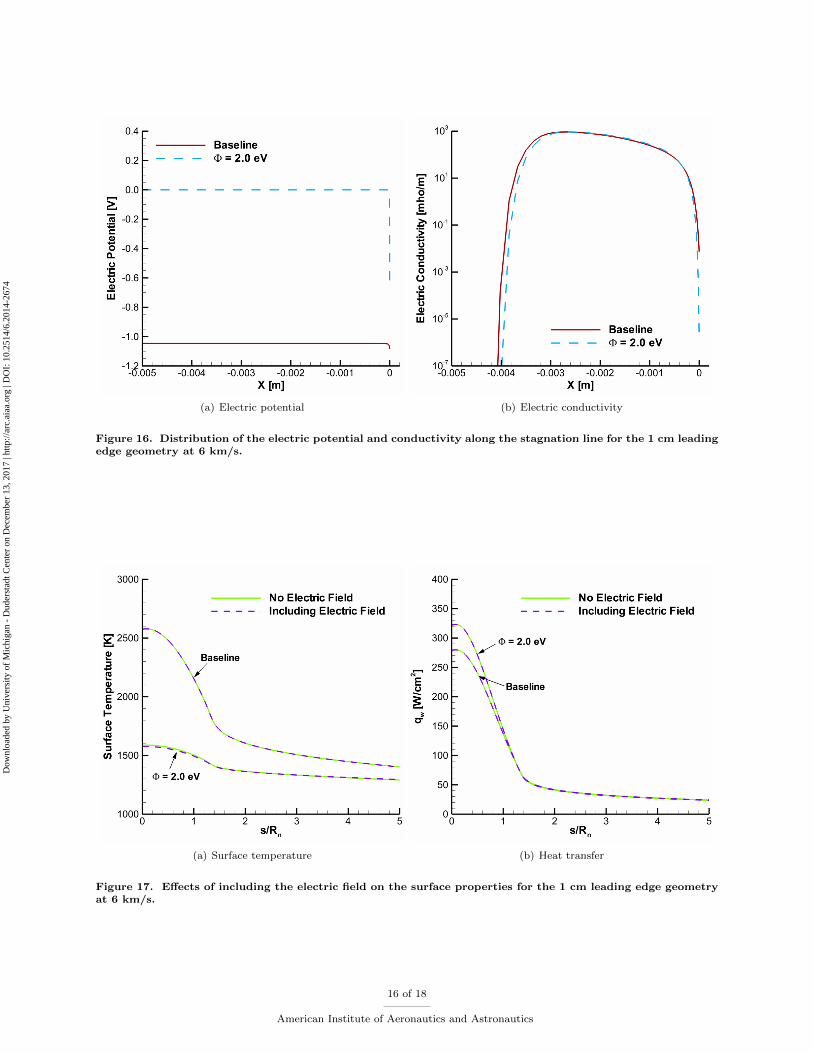
Profiles of the electric potential and conductivity along the stagnation line are shown in Fig. 16. Theelectric potential for the case without thermionic emission is almost constant over most of the stagnationline as can be seen in Fig. 16(a). The case with emission shows a sharp increase in the electric potentialfrom about -0.6 V at the wall to almost 0 V everywhere else along the stagnation line. The difference in theelectric potential between the case with and without thermionic emission can be explained by examining theelectric conductivity along the stagnation line shown in Fig. 16(b). The conductivity profiles obtained for thetwo cases are in overall close agreement, except at the wall where the conductivity calculated for the 2.0 eVcase is several orders of magnitude smaller compared to the solution computed without thermionic emission.The reason for this is that since the electric conductivity is only a function of temperature in the Raizermodel, the lower surface temperature obtained for the case with thermionic electron emission decreases theconductivity at the leading edge compared to the case without thermionic emission. This lower conductivityat the surface causes the sharp increase in the electric potential observed in Fig. 16(a).
The effects of the electric field on the predicted surface properties are presented in Fig. 17 for the caseswith and without thermionic electron emission. The results show that the calculated electric field has almostno effect on the baseline case without electron emission. For the case with emission, the electric field hasalmost no effect on the surface properties, except in a small region at the leading edge where the surfacetemperature slightly decreases as can be seen in Fig. 17(a). This is caused by the Schottky effect, whichreduces the effective work function. These results suggest that the calculated electric field is too small tochange the cooling properties of the thermionic emission for the conditions considered in this study. However,more work is needed to increase the physical accuracy of numerical method used to predict the aerothermalproperties of hypersonic vehicles with thermo-electric TPS materials.
V. Conclusions and Future Work
The goal of the present research is to perform a conceptual analysis of potential cooling effect due tothermionic electron emission at the leading edge of hypersonic vehicles with thermo-electric TPS materials.The baseline conditions considered in this study are Mach 19.4 flow of air at an altitude of 60 km over
15 of 18
American Institute of Aeronautics and Astronautics
Dow
nloa
ded
by U
nive
rsity
of
Mic
higa
n -
Dud
erst
adt C
ente
r on
Dec
embe
r 13
, 201
7 | h
ttp://
arc.
aiaa
.org
| D
OI:
10.
2514
/6.2
014-
2674
(a) Electric potential (b) Electric conductivity
Figure 16. Distribution of the electric potential and conductivity along the stagnation line for the 1 cm leadingedge geometry at 6 km/s.
(a) Surface temperature (b) Heat transfer
Figure 17. Effects of including the electric field on the surface properties for the 1 cm leading edge geometryat 6 km/s.
16 of 18
American Institute of Aeronautics and Astronautics
Dow
nloa
ded
by U
nive
rsity
of
Mic
higa
n -
Dud
erst
adt C
ente
r on
Dec
embe
r 13
, 201
7 | h
ttp://
arc.
aiaa
.org
| D
OI:
10.
2514
/6.2
014-
2674
a 1.0 cm cylindrical geometry that is representative of the leading edge of a hypersonic vehicle. First, thenumerical approach that is used to perform this conceptual analysis was presented. Then, a parametric studywas performed to understand the effects of the material work function, freestream velocity, and leading edgegeometry on this potential cooling effect provided by the thermo-electric materials. The results showedthat thermionic emission can reduce the surface temperature by approximately 40% assuming a materialwork function of 2.0 eV for the conditions considered in this study. The results also showed that theelectron transpiration cooling effect was augmented by decreasing the material work function, increasingthe freestream velocity, and decreasing the leading edge radius. Some ongoing work was then described tocapture the effects of the electric field on the predicted properties. The results showed that the magnitudeof the calculated electric field is relatively small, which causes negligible effects on the predicted surfaceproperties of hypersonic vehicles with thermo-electric TPS materials.
The results obtained in the current study show promising trends in the cooling properties of thermo-electric TPS materials. However, further work is needed to both continue the analysis and improve themodeling capabilities of the numerical method. For future work, the parametric study will be extended toinclude the effects of the freestream conditions by considering different altitudes and various angles of attack.The thermionic emission boundary condition will also be modified to allow for the recombination of emittedelectrons back to the surface. Future work will also incorporate better physical models to calculate theeffects of the electric field. These include: 1) account for forced diffusion (drift), 2) implement higher fidelitymodels for the electric conductivity, 3) estimate the effect of electron emission on the electric potential atthe surface, and 4) couple the Navier-Stokes equations to Maxwell’s equations to solve for both the fluid andelectromagnetic properties.
Acknowledgments
The authors gratefully acknowledge support for this work from the Lockheed-Martin Corporation. Inaddition, we thank Dr. Luke Uribarri and Dr. Ned Allen of Lockheed for essential technical oversight. Theauthors also thank Dr. Erin Farbar and Mr. Kentaro Hara from the University of Michigan for several usefuldiscussions.
References
1Walker, S. H. and Rodgers, F., “Falcon Hypersonic Technology Overview,” AIAA Paper 2005-3253 , 2005.2Fay, J. A. and Riddell, F. R., “Theory of Stagnation Point Heat Transfer in Dissociated Air,” Journal of the Aeronautics
Sciences, Vol. 25, 1958, pp. 73–85.3Voland, R. T., Huebner, L. D., and McClinton, C. R., “X-43A Hypersonic Vehicle Technology Development,” AIAA
Paper IAC-05-D2.6.01 , 2005.4Glass, D. E., “Physical Challenges and Limitations Confronting the Use of UHTCs on Hypersonic Vehicles,” AIAA Paper
2011-2304 , 2011.5Scalabrin, L. C., Numerical Simulation of Weakly Ionized Hypersonic Flow over Reentry Capsules, Ph.D. thesis, Uni-
versity of Michigan, 2007.6Martin, A., Scalabrin, L. C., and Boyd, I. D., “High Performance Modeling of Atmospheric Re-entry Vehicles,” Journal
of Physics: Conference Series, Vol. 341, No. 1, 2012, Article 012002.7Wilke, C. R., “A Viscosity Equation for Gas Mixtures,” Journal of Chemical Physics, Vol. 18 No. 4, 1950, pp. 517–519.8Blottner, F. G., Johnson, M., and Ellis, M., “Chemically Reacting Viscous Flow Program for Multi-Component Gas
Mixtures,” Tech. rep., SC-RR-70-754, Sandia Laboratories, Albuquerque, New Mexico, 1971.9Vincenti, W. G. and Kruger, C. H., Introduction to Physical Gas Dynamics, Krieger Publishing Company, 2002.
10Sutton, K. and Gnoffo, P. A., “Multi-Component Diffusion with Application to Computational Aerothermodynamics,”AIAA Paper 1998-2575 , June 1998.
11MacCormack, R. W. and Candler, G. V., “The Solution of the Navier-Stokes Equations using Gauss-Seidel Line Relax-ation,” Computers and Fluids, Vol. 17, 1989, pp. 135–150.
12Karypis, G. and Kumar, V., “METIS: A Software Package for Partitioning Unstructured Graphs, Partitioning Meshes,and Computing Fill-Reducing Orderings of Sparse Matrices,” University of Minnesota, 1998.
13Richardson, O. W., The Emission of Electricity from Hot Bodies, Longmans, Green and Co., 1921.14Angrist, S. W., Direct Energy Conversion, Allyn and Bacon, Inc., 1982.15CRC Handbook of Chemistry and Physics.16Scott, C. D., “Wall Catalytic Recombination and Boundary Conditions in Nonequilibrium Hypersonic Flows - with
Applications,” Advances in Hypersonics - Modeling Hypersonic Flows, Vol. 2, 1992, pp. 176–250.17Park, C., Nonequilibrium Hypersonic Aerothermodynamics, John Wiley & Sons, 1990.18Bisek, N. J., Boyd, I. D., and Poggie, J., “Three Dimensional Simulations of Hypersonic MHD Flow Control,” AIAA
Paper 2009-3731 , 2009.
17 of 18
American Institute of Aeronautics and Astronautics
Dow
nloa
ded
by U
nive
rsity
of
Mic
higa
n -
Dud
erst
adt C
ente
r on
Dec
embe
r 13
, 201
7 | h
ttp://
arc.
aiaa
.org
| D
OI:
10.
2514
/6.2
014-
2674

19Kim, M. and Boyd, I. D., “Effectiveness of a Magnetohydrodynamics System for Mars Entry,” Journal of Spacecraft andRockets, Vol. 49, No. 6, 2012, pp. 1141–1149.
20MacCormack, R. W., “Solution of the Equations of Magneto-Fluid Dynamics with Chemical Reaction,” AIAA Paper2010-4636 , 2010.
21Lieberman, M. A. and Lichtenberg, A. J., Principles of Plasma Discharges and Materials Processing, John Wiley &Sons, 1994.
22Benilov, M. S. and Marotta, A., “A model of the Cathode Region of Atmospheric Pressure Arcs,” Journal of Physics D:Applied Physics, Vol. 28, No. 9, 1995, pp. 1869–1882.
23Raizer, Y. P., Gas Discharge Physics, Springer-Verlag, 1991.24Fridman, A. and Kennedy, L. A., Plasma Physics and Engineering, Taylor & Francis, 2004.
18 of 18
American Institute of Aeronautics and Astronautics
Dow
nloa
ded
by U
nive
rsity
of
Mic
higa
n -
Dud
erst
adt C
ente
r on
Dec
embe
r 13
, 201
7 | h
ttp://
arc.
aiaa
.org
| D
OI:
10.
2514
/6.2
014-
2674