Embed Size (px)
Citation preview
ISABE-2019-24285 1
ISABE-2019-24285
Conceptual Design of a Counter-Rotating Fan System for Distributed
Boundary Layer Ingesting Propulsion B.J.Lee1, May-Fun Liou2, and M. Celestina2
Vantage Partners, LLC1
NASA Glenn Research Center2
Aero-propulsion Division Cleveland USA
ABSTRACT
The present paper details the design of counter rotating fans for a Turboelectric
Distributed Propulsion (TeDP) system. Sixteen propulsors installed are embedded on an
aerodynamically optimized hybrid wing-body configuration in mail-slot-shape nacelles.
The hybrid wing-body configuration which was previously designed to satisfy the
conditions of trim, longitudinally static stability and specific cargo space is employed as
the influencing body configuration in pursuing an optimal distributed propulsion system.
A counter-rotating fan system for the distributed propulsors is conceptually designed and
the performance is evaluated against the target thrust mandated by the mission
requirements. The concept of the distributed propulsion allows the fan pressure ratio to
be around 1.30 to achieve the target thrust. In addition, further splitting of the fan pressure
ratio by using the counter-rotating fans for each slot realizes the target pressure ratio with
low tip speed. Aerodynamic shape optimizations of the fan blades are performed in a
sequential multi-objective optimization process for various design objectives, such as
mass flow rate condition, fan pressure ratio, efficiency and the exit flow angle of the fan
stage by using a genetic algorithm, NSGA-II. The radial chord distribution, and meanline
distribution of the rotors are designed on the circumferentially averaged axisymmetric
inlet profiles and tested on the profiles from six divided sectors to reckon the flow
distortion. The performances of the counter rotating fans are, thus, evaluated and
compared with a conventional high-speed fan accordingly to find distortion tolerant
characteristics of the present concept.
Keywords: Boundary Layer Ingestion, Hybrid Wing/body, Turbo-machinery,
Aerodynamic Conceptual Design, Distributed Electric Propulsion, Counter Rotating fans
NOMENCLATURE ADP aerodynamic design point
AOA angle of attack
AIP aerodynamic interface plane
BLI boundary layer ingestion
CRFs counter rotation fan system
FPR fan pressure ratio
FSPR fan stage pressure ratio
HWB hybrid wing-body
IMM immersion index
ISA international standard atmosphere
M mach number
�̇� mass flow rate
N physical rotational speed (in RPM)
Nc corrected rotational speed (in RPM)
Re/m Reynolds number per meter
PAI propulsion airframe integration
Pshaft shaft power
Pt total pressure
2 ISABE-2019-24285
ps static pressure
P0i reference air pressure (e.g. 101.35 kN/m2, STD)
PR total pressure ratio
Pp propulsive power
r radius in the cylindrical coordinate
R1 front rotor
R2 rear rotor
Th0 target thrust
Ts static temperature
Tt total temperature
U rotational velocity of the blade (rω)
Wm meridional velocity
Wc corrected mass flow rate
ρ density
ηad adiabatic efficiency
ηpoly polytropic efficiency
𝜑 pressure ratio of the front and after rotors
𝛼 flow swirl angle in absolute frame
𝛽 flow swirl angle in relative frame
ω rotational angular velocity
Subscript
1 property of the front rotor
2 property of the rear rotor
∞ free stream condition
c corrected
f fan
goal target property for design
e exit
h hub
s shroud (tip)
1.0 INTRODUCTION
A hybrid wing-body (HWB) concept is being considered by NASA as a potential
subsonic transport aircraft that meets aerodynamic, fuel, emission, and noise goals in the
time frame beyond 2050. While the concept promises advantages over the conventional
wing-and-tube aircraft, it poses unknowns and risks, and thus requires in-depth and broad
assessments. Specifically, the configuration entails a tight integration of the airframe and
propulsion geometries; the aerodynamic impact should be carefully evaluated. This
realization has led to several studies and research efforts in the past, including a system
analysis1 of a baseline design of the N3-X, high-fidelity flow simulations to understand
the effects of the propulsion-airframe integration (PAI) on the flow and later aerodynamic
redesign through optimization techniques.2-6 Among those efforts, HWB has been dealt
in three aspects: airframe with nacelle, propulsor with flow-path, and PAI with stability.
On the airframe with nacelle side, the Class function/Shape function Transformation
which is a CAD (Computer-Aided Design) and non-dimensional airfoil/wing generation
method, was adopted to effectively construct the HWB airframe-propulsion
configuration.2 The parameterization method enables a PAI design approach that
considered both the airframe and propulsion system together at the outset of the
aerodynamic design of the aircraft. Furthermore, the nacelle cowl shape was designed
and optimized using adjoint method to improve aerodynamic performance of the nacelle.3
On the propulsion side, a numerically efficient body force model was introduced to
incorporate the effects of turning and flow loss from the fan stage4,5 to make the PAI
optimization computationally feasible.
Recently, aerodynamic shape design and optimization were performed to determine
geometric shape parameters by minimizing the drag while was subjected to the lift,
pitching moment, and cargo capacity constraints.6 Thus, a conceptual configuration of the
N3-X aircraft for 300-passenger-seats was designed and named N3X-Dep300 (Dep:
B.LEE ET AL. ISABE-2019-24285 3
distributed electric propulsion). The latest work resolved the challenges against minimal
drag with fixed lift, being longitudinally static stable, trimmable with a physical cargo
space. However, the ducted propulsor was simply modeled by an assumption of a uniform
back pressure boundary condition at the inlet throat. The accuracy of this 1-D assumption
may not be adequate in case highly distorted flow is ingested into the nacelle because the
impacts of the radial and circumferential variations of the static pressure were
unaccounted for. Thus, an actuator disk model is applied latter to derive an appropriate
inlet profile for the propulsion system.5 Ref. [5] illustrated the expected power saving for
the distributed propulsor relative to clean inlet flow engines and derived the target design
conditions for the propulsor design in an optimization manner.
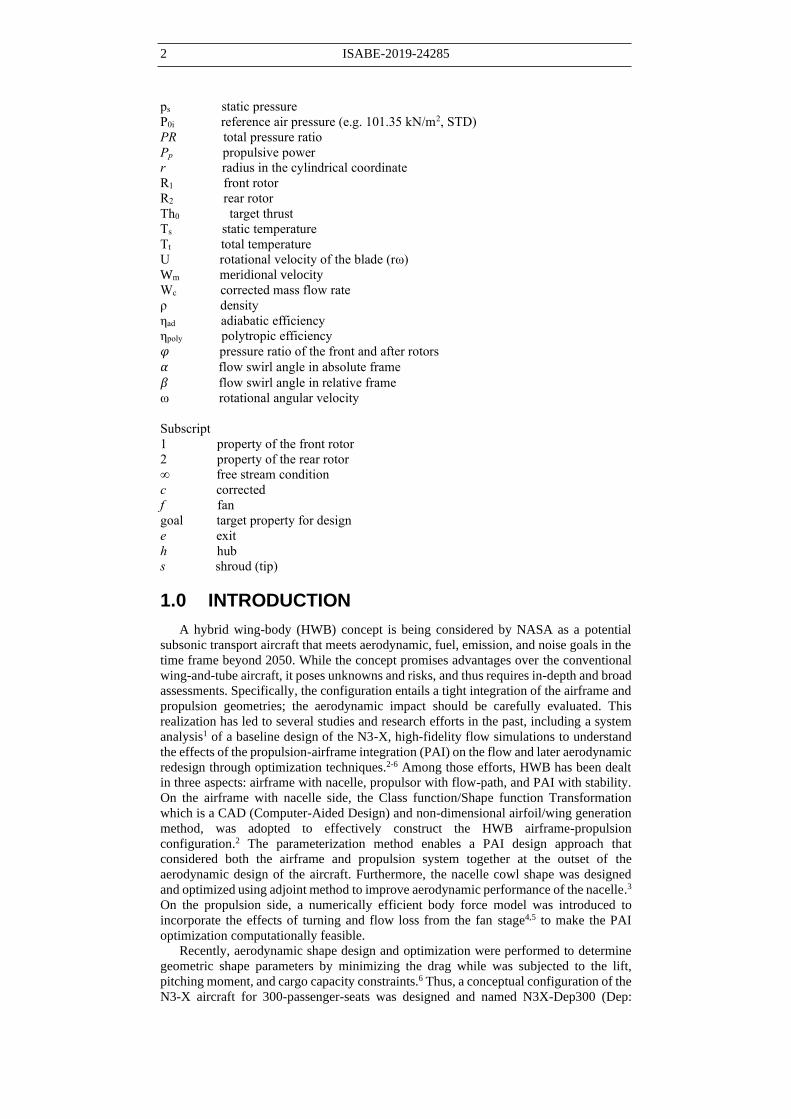
Figure 1. Previous design of N3X-DEP3005,6, propulsion airframe integration and jet flow
(pressure iso-surface) from the mail-slot propulsion system
(Cruise Condition: M=0.84, Re= 7.2 million/m, 40kft Altitude, 80kN Thrust generation)
The present study focuses on the conceptual design of its boundary layer tolerant
turbo-machinery component built on the bases of the previously reported and described
airframe6 and distributed propulsion system5 in order to complete the whole PAI
configuration as shown in Fig. 1. The biggest concern in designing the embedded
propulsor is the impact of the swirl distortion from the incoming boundary layer profile
causing significant incidence swing at the fan face. The problem becomes more
significant as the rotor tip speed exceeds the sonic speed. As a result of the needs to lower
the tip loading and reduce performance deficit from the significant incidence swing to the
rotors, the concepts of distributed propulsion system and splitting the loading of each
rotor into a pair of counter-rotating fans (CRFs) are adopted in the present design. The
design optimization of CRFs are carried out based on turbomachinery CFD analysis7,8
and a multi-objective evolutionary algorithm.9
The present paper consists of 5 chapters hereafter. Chapter 2 will briefly introduce the
design requirements, inlet profile and design strategies of the CRFs. Chapter 3 will
discuss the vector diagram of the fan design to determine the speed ratio and constraints
in the current study. Chapter 4 is going to discuss about the optimization results and the
comparisons between designs for axisymmetric and non-axisymmetric inlet profile, then
followed by chapter 5 that will detail the overall propulsor performance compared with a
conventional high-speed fan and the advantages from the current conceptual propulsor
design.
2.0 DESIGN STRATEGY
2.1 System Design Requirements
The thrust requirements for each flight condition from the original N3-X system
design1 are provided in table 1. The propulsor design are focused on the cruise condition
at the altitude of 40,000 feet. The minimum thrust requirement is 74kN based on the clean
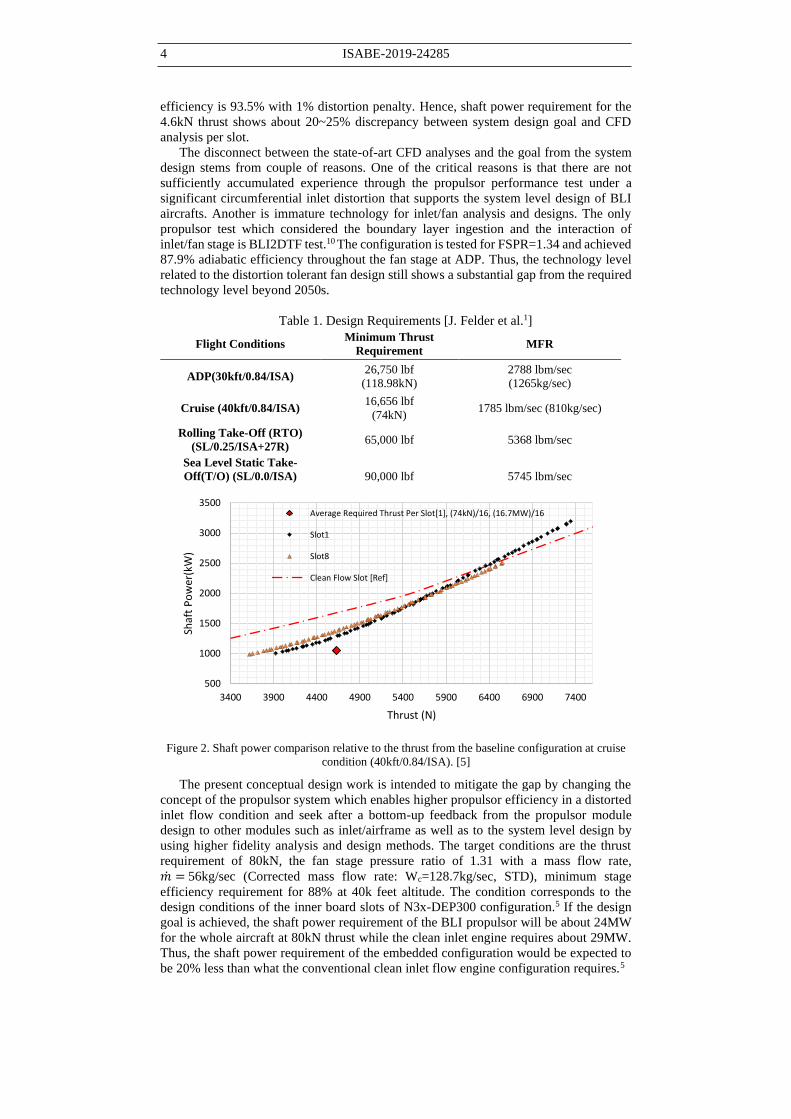
wing aircraft. The figure 2 shows the thrust–shaft power curve of the N3x-DEP300
compared with a clean inlet propulsor and the original system design at the condition. It
is observed that each slot shows different thrust-shaft power curve and power saving
relative to the clean inlet propulsor depending on the amount of the ingested boundary
layer. The model applied to obtain the curves is actuator disk model of which fan stage
pressure ratio is 1.28~1.31 and stage adiabatic efficiency is 88%. However, the modeling
in the original system design assumed that the fan pressure ratio is 1.30, adiabatic
4 ISABE-2019-24285
efficiency is 93.5% with 1% distortion penalty. Hence, shaft power requirement for the
4.6kN thrust shows about 20~25% discrepancy between system design goal and CFD
analysis per slot.
The disconnect between the state-of-art CFD analyses and the goal from the system
design stems from couple of reasons. One of the critical reasons is that there are not
sufficiently accumulated experience through the propulsor performance test under a
significant circumferential inlet distortion that supports the system level design of BLI
aircrafts. Another is immature technology for inlet/fan analysis and designs. The only
propulsor test which considered the boundary layer ingestion and the interaction of
inlet/fan stage is BLI2DTF test.10 The configuration is tested for FSPR=1.34 and achieved
87.9% adiabatic efficiency throughout the fan stage at ADP. Thus, the technology level
related to the distortion tolerant fan design still shows a substantial gap from the required
technology level beyond 2050s.
Table 1. Design Requirements [J. Felder et al.1]
Flight Conditions Minimum Thrust
Requirement MFR
ADP(30kft/0.84/ISA) 26,750 lbf
(118.98kN)
2788 lbm/sec
(1265kg/sec)
Cruise (40kft/0.84/ISA) 16,656 lbf
(74kN) 1785 lbm/sec (810kg/sec)
Rolling Take-Off (RTO)
(SL/0.25/ISA+27R) 65,000 lbf 5368 lbm/sec
Sea Level Static Take-
Off(T/O) (SL/0.0/ISA)
90,000 lbf 5745 lbm/sec
Figure 2. Shaft power comparison relative to the thrust from the baseline configuration at cruise
condition (40kft/0.84/ISA). [5]
The present conceptual design work is intended to mitigate the gap by changing the
concept of the propulsor system which enables higher propulsor efficiency in a distorted
inlet flow condition and seek after a bottom-up feedback from the propulsor module
design to other modules such as inlet/airframe as well as to the system level design by
using higher fidelity analysis and design methods. The target conditions are the thrust
requirement of 80kN, the fan stage pressure ratio of 1.31 with a mass flow rate,
�̇� = 56kg/sec (Corrected mass flow rate: Wc=128.7kg/sec, STD), minimum stage
efficiency requirement for 88% at 40k feet altitude. The condition corresponds to the
design conditions of the inner board slots of N3x-DEP300 configuration.5 If the design
goal is achieved, the shaft power requirement of the BLI propulsor will be about 24MW
for the whole aircraft at 80kN thrust while the clean inlet engine requires about 29MW.
Thus, the shaft power requirement of the embedded configuration would be expected to
be 20% less than what the conventional clean inlet flow engine configuration requires.5
500
1000
1500
2000
2500
3000
3500
3400 3900 4400 4900 5400 5900 6400 6900 7400
Shaf
t P
ow
er(k
W)
Thrust (N)
Average Required Thrust Per Slot[1], (74kN)/16, (16.7MW)/16
Slot1
Slot8
Clean Flow Slot [Ref]
B.LEE ET AL. ISABE-2019-24285 5
2.2 Inlet Profiles & Turbo-machinery Design Conditions
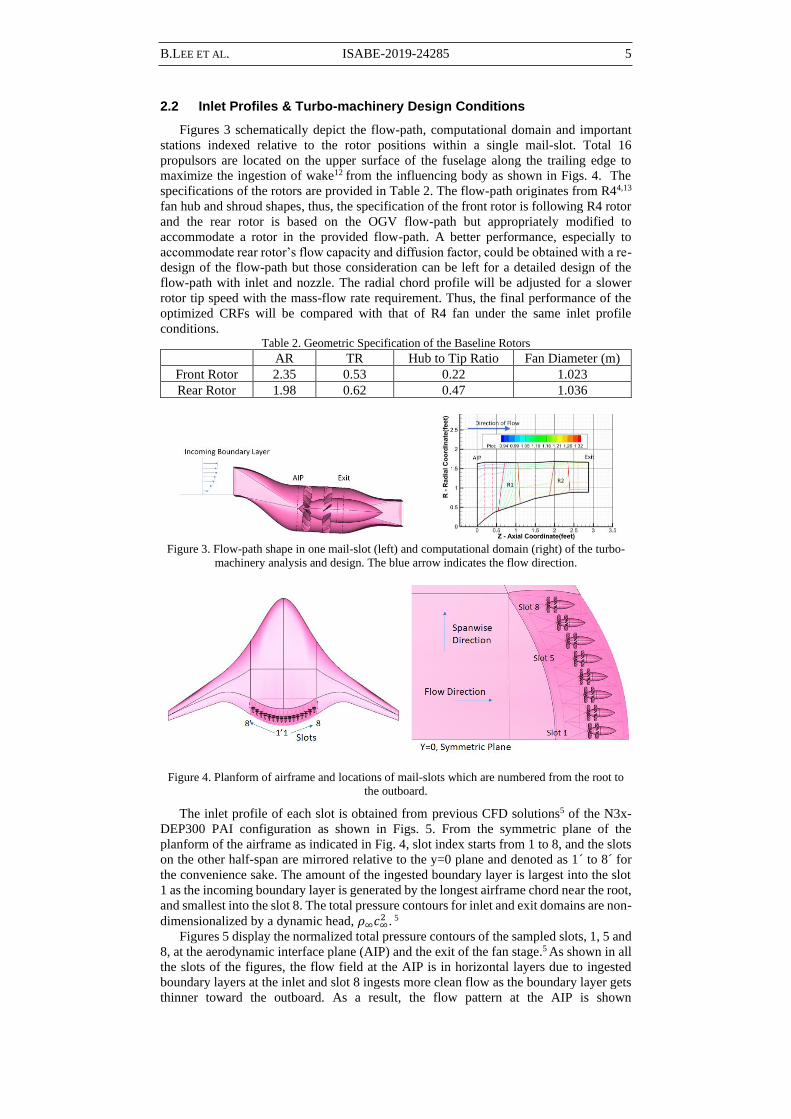
Figures 3 schematically depict the flow-path, computational domain and important
stations indexed relative to the rotor positions within a single mail-slot. Total 16
propulsors are located on the upper surface of the fuselage along the trailing edge to
maximize the ingestion of wake12 from the influencing body as shown in Figs. 4. The
specifications of the rotors are provided in Table 2. The flow-path originates from R44,13
fan hub and shroud shapes, thus, the specification of the front rotor is following R4 rotor
and the rear rotor is based on the OGV flow-path but appropriately modified to
accommodate a rotor in the provided flow-path. A better performance, especially to
accommodate rear rotor’s flow capacity and diffusion factor, could be obtained with a re-
design of the flow-path but those consideration can be left for a detailed design of the
flow-path with inlet and nozzle. The radial chord profile will be adjusted for a slower
rotor tip speed with the mass-flow rate requirement. Thus, the final performance of the
optimized CRFs will be compared with that of R4 fan under the same inlet profile
conditions. Table 2. Geometric Specification of the Baseline Rotors
AR TR Hub to Tip Ratio Fan Diameter (m)
Front Rotor 2.35 0.53 0.22 1.023
Rear Rotor 1.98 0.62 0.47 1.036
Figure 3. Flow-path shape in one mail-slot (left) and computational domain (right) of the turbo-
machinery analysis and design. The blue arrow indicates the flow direction.
Figure 4. Planform of airframe and locations of mail-slots which are numbered from the root to
the outboard.
The inlet profile of each slot is obtained from previous CFD solutions5 of the N3x-
DEP300 PAI configuration as shown in Figs. 5. From the symmetric plane of the
planform of the airframe as indicated in Fig. 4, slot index starts from 1 to 8, and the slots
on the other half-span are mirrored relative to the y=0 plane and denoted as 1´ to 8´ for
the convenience sake. The amount of the ingested boundary layer is largest into the slot
1 as the incoming boundary layer is generated by the longest airframe chord near the root,
and smallest into the slot 8. The total pressure contours for inlet and exit domains are non-
dimensionalized by a dynamic head, 𝜌∞𝑐∞2 . 5
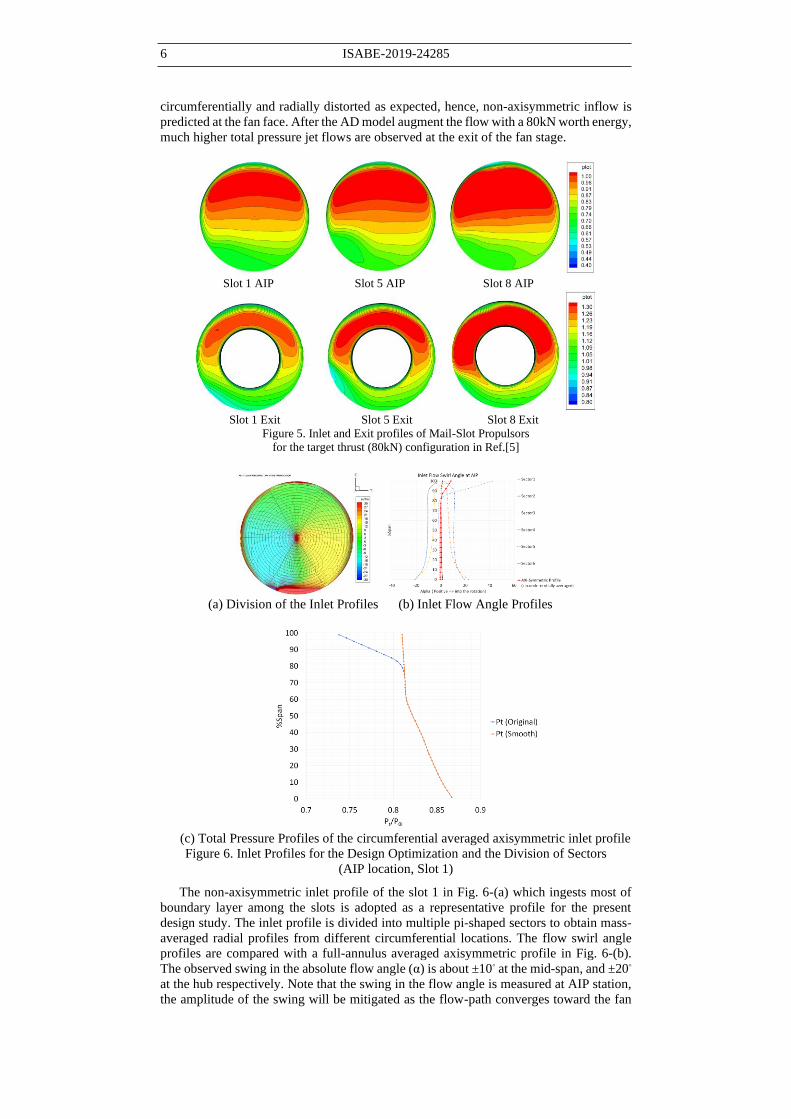
Figures 5 display the normalized total pressure contours of the sampled slots, 1, 5 and
8, at the aerodynamic interface plane (AIP) and the exit of the fan stage.5 As shown in all
the slots of the figures, the flow field at the AIP is in horizontal layers due to ingested
boundary layers at the inlet and slot 8 ingests more clean flow as the boundary layer gets
thinner toward the outboard. As a result, the flow pattern at the AIP is shown
6 ISABE-2019-24285
circumferentially and radially distorted as expected, hence, non-axisymmetric inflow is
predicted at the fan face. After the AD model augment the flow with a 80kN worth energy,
much higher total pressure jet flows are observed at the exit of the fan stage.
Slot 1 AIP Slot 5 AIP Slot 8 AIP
Slot 1 Exit Slot 5 Exit Slot 8 Exit
Figure 5. Inlet and Exit profiles of Mail-Slot Propulsors
for the target thrust (80kN) configuration in Ref.[5]
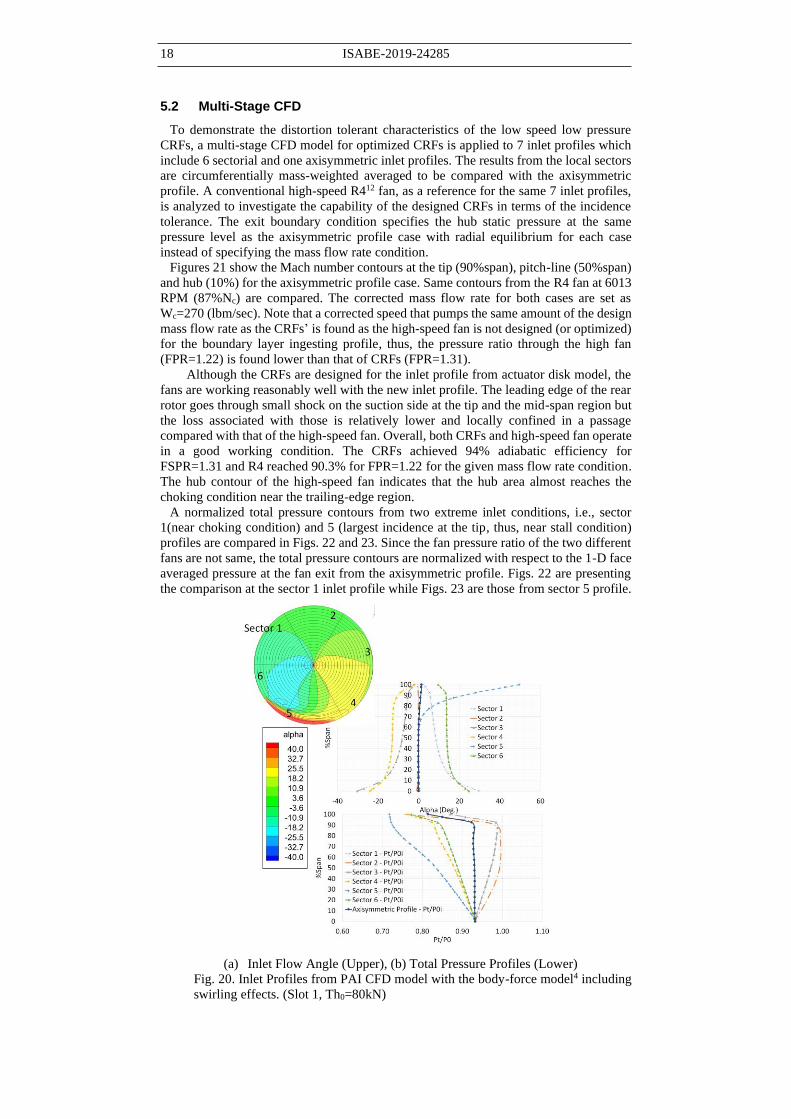
(a) Division of the Inlet Profiles (b) Inlet Flow Angle Profiles
(c) Total Pressure Profiles of the circumferential averaged axisymmetric inlet profile
Figure 6. Inlet Profiles for the Design Optimization and the Division of Sectors
(AIP location, Slot 1)
The non-axisymmetric inlet profile of the slot 1 in Fig. 6-(a) which ingests most of
boundary layer among the slots is adopted as a representative profile for the present
design study. The inlet profile is divided into multiple pi-shaped sectors to obtain mass-
averaged radial profiles from different circumferential locations. The flow swirl angle
profiles are compared with a full-annulus averaged axisymmetric profile in Fig. 6-(b).
The observed swing in the absolute flow angle (α) is about ±10◦ at the mid-span, and ±20◦
at the hub respectively. Note that the swing in the flow angle is measured at AIP station,
the amplitude of the swing will be mitigated as the flow-path converges toward the fan

B.LEE ET AL. ISABE-2019-24285 7
face. The separation from the S-shaped duct causes a singular point of the incidence
(swing up to +40◦ from -5◦) at the tip in sector 5. Even though the separated incoming
flow is confined in a local region and it is believed that the singularity characteristics of
the sector 5 tip could be reduced by the further refinement in the inlet design, the effect
of the profile at 80~100%span in the sector 5 is removed in the averaged axisymmetric
design profile as shown in Fig. 6-(c), while the performance check will be carried out for
the sectorial profile.
(a) CRFs Geometry Output from the BLADELTE V1.0 (Example)
(b) Meanline Parameters (Example) (c) Thickness Parameters (Example)
Figure 7. Blade Design Outputs and Control Points for the Design Parameters
2.3 Geometric Representation of Blades
The blade geometries are generated using BLADELTE v1.07 which is a NASA’s in-
house turbo-machinery geometric design tool. The 3-D blade shape is represented by the
meanline, thickness distributions in the chord-wise and radial directions, and radial chord
distribution. Those design parameters are represented by a B-spline surface and re-
stacked along the provided stacking axis. If the stacking axis is not provided, the default
option of the rotor stacking is performed based on the sectional CG point which is
calculated along each streamline defined in the meridional planes. At the current stage of
a conceptual aerodynamic design of the CRFs, the default option is applied throughout
all the design processes.
A detailed design should be followed by including thickness variables to realize
further distortion tolerance capability. However, the scope of the current study will stop
at the demonstration of the capability of overcoming the circumferential distortion using
CRFs. In other words, the planform and meanline shaping of a pair of low pressure/low
speed counter rotating fans will be designed with axisymmetric profiles and be analysed
in the off-design profiles from the divided sectors to account for the penalty against the
high level incoming circumferential distortion. A total of 25 meanline variables and 5
chord variables, i.e. 5 meanline and 1 chord variables per each blade section, defined in
5 streamlines are used. The tip clearances of the rotors are ignored during the current
conceptual design.
2.4 Quasi-2D Meanline Analysis
The initial blade geometries are obtained from a quasi-2D meanline code14. The initial
rotational speed of the front rotor and the speed ratio between the rotors are found from
8 ISABE-2019-24285
the velocity vector study that will be discussed in Chapter 3. The initial blade angles at
the leading and trailing edges are generated via the quasi-2D meanline code analysis for
each design condition as explained in Ref.[14]. The axi-symmetric inlet profiles from
section 2.2 are applied. The rotational speed of both rotors are constrained by the rotor
tip Mach number below 0.7, so that the flow through the CRF system does not experience
any significant shock loss. Hence, the corrected rotational speed of the front rotor is
limited below 4800RPM and the speed of the rear rotor is defined according to the speed
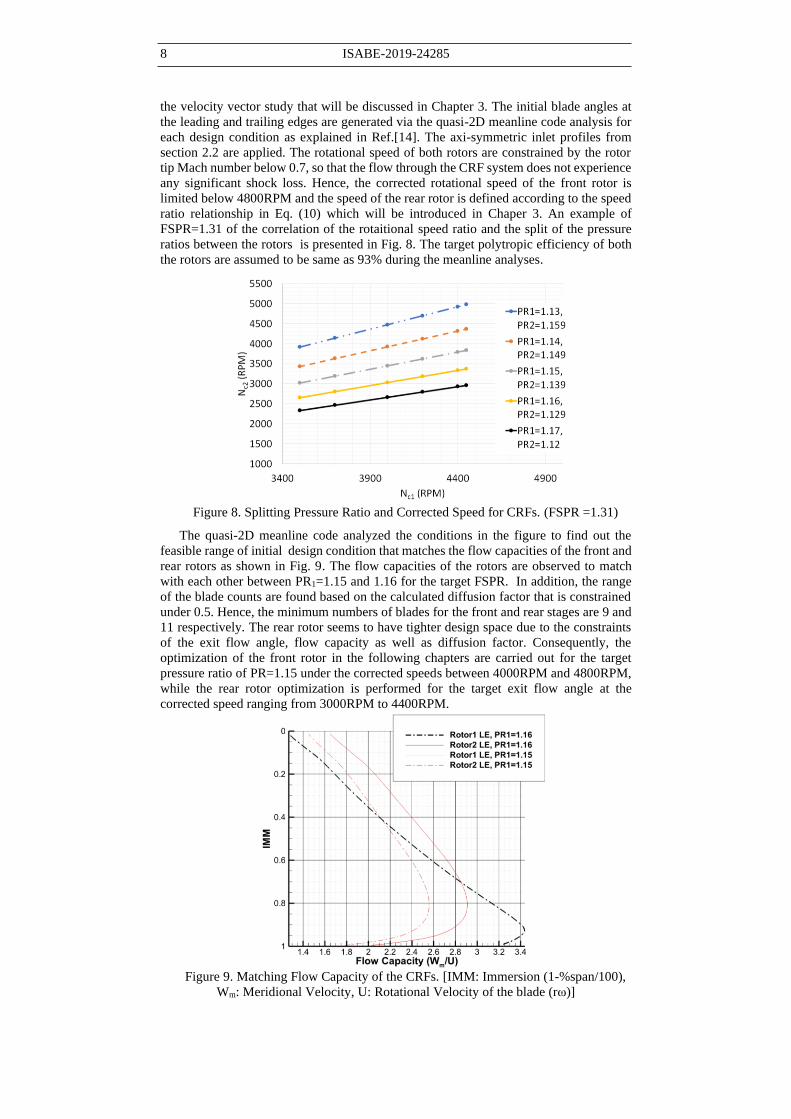
ratio relationship in Eq. (10) which will be introduced in Chaper 3. An example of
FSPR=1.31 of the correlation of the rotaitional speed ratio and the split of the pressure
ratios between the rotors is presented in Fig. 8. The target polytropic efficiency of both
the rotors are assumed to be same as 93% during the meanline analyses.
Figure 8. Splitting Pressure Ratio and Corrected Speed for CRFs. (FSPR =1.31)
The quasi-2D meanline code analyzed the conditions in the figure to find out the
feasible range of initial design condition that matches the flow capacities of the front and
rear rotors as shown in Fig. 9. The flow capacities of the rotors are observed to match
with each other between PR1=1.15 and 1.16 for the target FSPR. In addition, the range
of the blade counts are found based on the calculated diffusion factor that is constrained
under 0.5. Hence, the minimum numbers of blades for the front and rear stages are 9 and
11 respectively. The rear rotor seems to have tighter design space due to the constraints
of the exit flow angle, flow capacity as well as diffusion factor. Consequently, the
optimization of the front rotor in the following chapters are carried out for the target
pressure ratio of PR=1.15 under the corrected speeds between 4000RPM and 4800RPM,
while the rear rotor optimization is performed for the target exit flow angle at the
corrected speed ranging from 3000RPM to 4400RPM.
Figure 9. Matching Flow Capacity of the CRFs. [IMM: Immersion (1-%span/100),
Wm: Meridional Velocity, U: Rotational Velocity of the blade (rω)]
B.LEE ET AL. ISABE-2019-24285 9
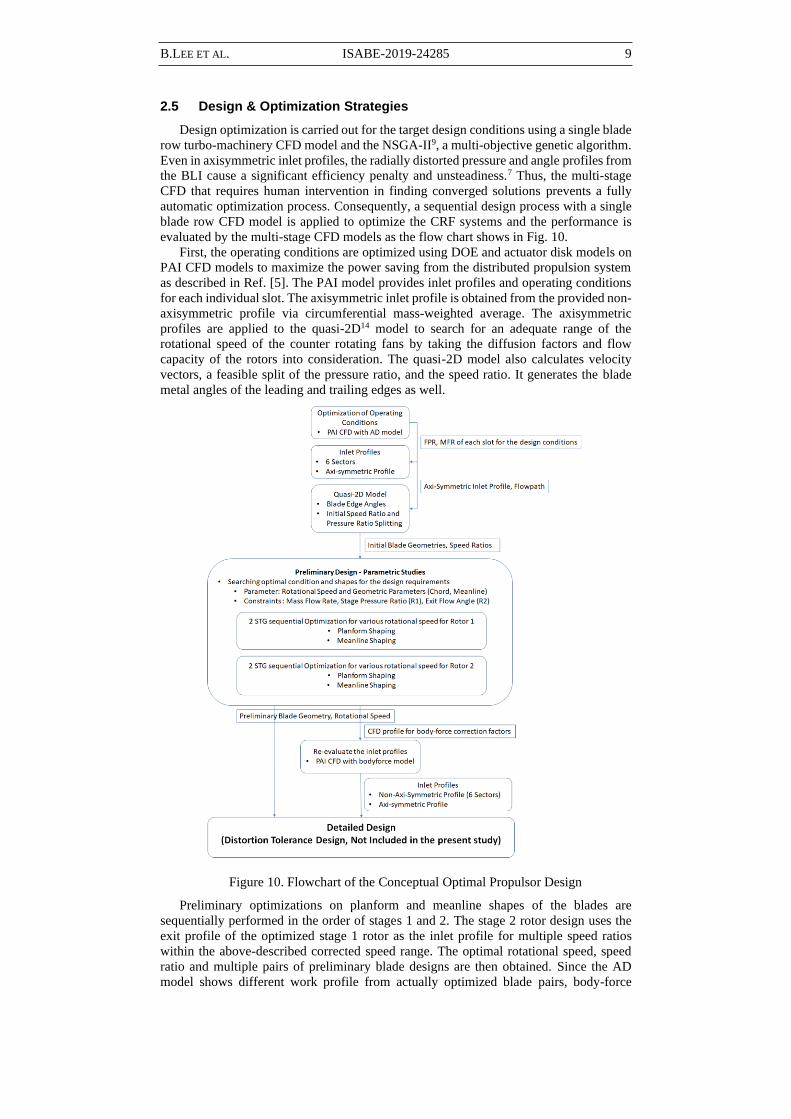
2.5 Design & Optimization Strategies
Design optimization is carried out for the target design conditions using a single blade
row turbo-machinery CFD model and the NSGA-II9, a multi-objective genetic algorithm.
Even in axisymmetric inlet profiles, the radially distorted pressure and angle profiles from
the BLI cause a significant efficiency penalty and unsteadiness.7 Thus, the multi-stage
CFD that requires human intervention in finding converged solutions prevents a fully
automatic optimization process. Consequently, a sequential design process with a single
blade row CFD model is applied to optimize the CRF systems and the performance is
evaluated by the multi-stage CFD models as the flow chart shows in Fig. 10.
First, the operating conditions are optimized using DOE and actuator disk models on
PAI CFD models to maximize the power saving from the distributed propulsion system
as described in Ref. [5]. The PAI model provides inlet profiles and operating conditions
for each individual slot. The axisymmetric inlet profile is obtained from the provided non-
axisymmetric profile via circumferential mass-weighted average. The axisymmetric
profiles are applied to the quasi-2D14 model to search for an adequate range of the
rotational speed of the counter rotating fans by taking the diffusion factors and flow
capacity of the rotors into consideration. The quasi-2D model also calculates velocity
vectors, a feasible split of the pressure ratio, and the speed ratio. It generates the blade
metal angles of the leading and trailing edges as well.
Figure 10. Flowchart of the Conceptual Optimal Propulsor Design
Preliminary optimizations on planform and meanline shapes of the blades are
sequentially performed in the order of stages 1 and 2. The stage 2 rotor design uses the
exit profile of the optimized stage 1 rotor as the inlet profile for multiple speed ratios
within the above-described corrected speed range. The optimal rotational speed, speed
ratio and multiple pairs of preliminary blade designs are then obtained. Since the AD
model shows different work profile from actually optimized blade pairs, body-force
10 ISABE-2019-24285
models that represent the preliminary design are constructed and PAI CFD model is
analysed to refine the inlet profiles physically more correct.
The axisymmetric inlet profile and the non-axisymmetric profiles from the 6 sectors
from the new PAI CFD model are applied to assess the performance of the preliminary
optimal designs. Again, note that detailed design toward the further distortion tolerance
is not covered and the scope of the current study is focused on the optimization of the
‘distributed low pressure/low speed counter rotating fans’ and the demonstration of
the distortion tolerance characteristics of the design concept. Please note that all
designs covered in this study are on the basis of PAI perspective.
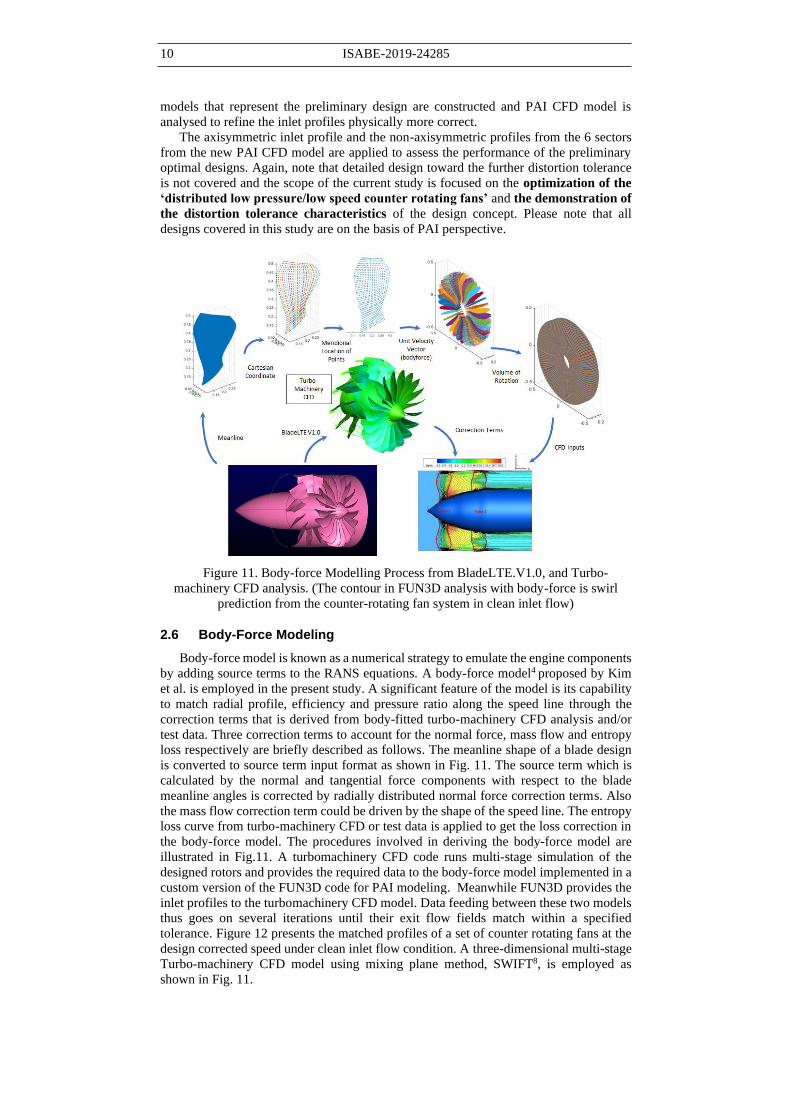
Figure 11. Body-force Modelling Process from BladeLTE.V1.0, and Turbo-
machinery CFD analysis. (The contour in FUN3D analysis with body-force is swirl
prediction from the counter-rotating fan system in clean inlet flow)
2.6 Body-Force Modeling
Body-force model is known as a numerical strategy to emulate the engine components
by adding source terms to the RANS equations. A body-force model4 proposed by Kim
et al. is employed in the present study. A significant feature of the model is its capability
to match radial profile, efficiency and pressure ratio along the speed line through the
correction terms that is derived from body-fitted turbo-machinery CFD analysis and/or
test data. Three correction terms to account for the normal force, mass flow and entropy
loss respectively are briefly described as follows. The meanline shape of a blade design
is converted to source term input format as shown in Fig. 11. The source term which is
calculated by the normal and tangential force components with respect to the blade
meanline angles is corrected by radially distributed normal force correction terms. Also
the mass flow correction term could be driven by the shape of the speed line. The entropy
loss curve from turbo-machinery CFD or test data is applied to get the loss correction in
the body-force model. The procedures involved in deriving the body-force model are
illustrated in Fig.11. A turbomachinery CFD code runs multi-stage simulation of the
designed rotors and provides the required data to the body-force model implemented in a
custom version of the FUN3D code for PAI modeling. Meanwhile FUN3D provides the
inlet profiles to the turbomachinery CFD model. Data feeding between these two models
thus goes on several iterations until their exit flow fields match within a specified
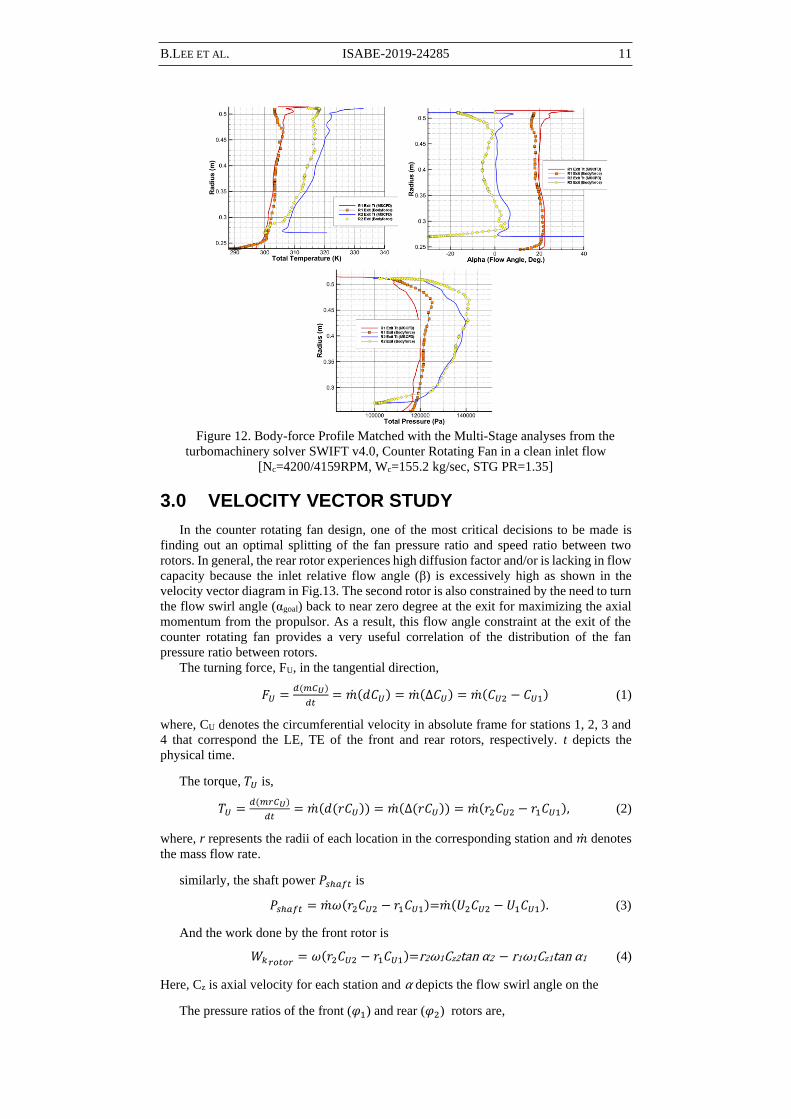
tolerance. Figure 12 presents the matched profiles of a set of counter rotating fans at the
design corrected speed under clean inlet flow condition. A three-dimensional multi-stage
Turbo-machinery CFD model using mixing plane method, SWIFT8, is employed as
shown in Fig. 11.
B.LEE ET AL. ISABE-2019-24285 11
Figure 12. Body-force Profile Matched with the Multi-Stage analyses from the
turbomachinery solver SWIFT v4.0, Counter Rotating Fan in a clean inlet flow
[Nc=4200/4159RPM, Wc=155.2 kg/sec, STG PR=1.35]
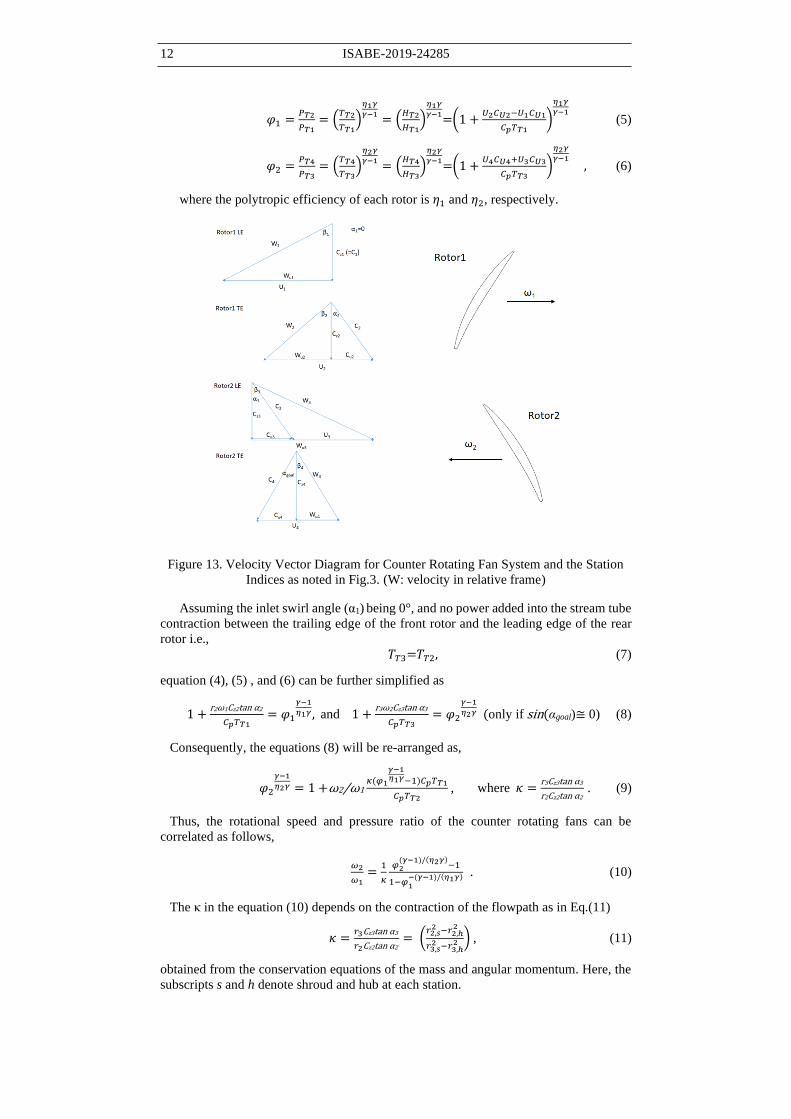
3.0 VELOCITY VECTOR STUDY
In the counter rotating fan design, one of the most critical decisions to be made is
finding out an optimal splitting of the fan pressure ratio and speed ratio between two
rotors. In general, the rear rotor experiences high diffusion factor and/or is lacking in flow
capacity because the inlet relative flow angle (β) is excessively high as shown in the
velocity vector diagram in Fig.13. The second rotor is also constrained by the need to turn
the flow swirl angle (αgoal) back to near zero degree at the exit for maximizing the axial
momentum from the propulsor. As a result, this flow angle constraint at the exit of the
counter rotating fan provides a very useful correlation of the distribution of the fan
pressure ratio between rotors.
The turning force, FU, in the tangential direction,
𝐹𝑈 =𝑑(𝑚𝐶𝑈)
𝑑𝑡= �̇�(𝑑𝐶𝑈) = �̇�(∆𝐶𝑈) = �̇�(𝐶𝑈2 − 𝐶𝑈1) (1)
where, CU denotes the circumferential velocity in absolute frame for stations 1, 2, 3 and
4 that correspond the LE, TE of the front and rear rotors, respectively. t depicts the
physical time.
The torque, 𝑇𝑈 is,
𝑇𝑈 =𝑑(𝑚𝑟𝐶𝑈)
𝑑𝑡= �̇�(𝑑(𝑟𝐶𝑈)) = �̇�(∆(𝑟𝐶𝑈)) = �̇�(𝑟2𝐶𝑈2 − 𝑟1𝐶𝑈1), (2)
where, r represents the radii of each location in the corresponding station and �̇� denotes
the mass flow rate.
similarly, the shaft power 𝑃𝑠ℎ𝑎𝑓𝑡 is
𝑃𝑠ℎ𝑎𝑓𝑡 = �̇�𝜔(𝑟2𝐶𝑈2 − 𝑟1𝐶𝑈1)=�̇�(𝑈2𝐶𝑈2 − 𝑈1𝐶𝑈1). (3)
And the work done by the front rotor is
𝑊𝑘𝑟𝑜𝑡𝑜𝑟= 𝜔(𝑟2𝐶𝑈2 − 𝑟1𝐶𝑈1)=r2ω1Cz2tan α2 − r1ω1Cz1tan α1 (4)
Here, Cz is axial velocity for each station and α depicts the flow swirl angle on the
The pressure ratios of the front (𝜑1) and rear (𝜑2) rotors are,
12 ISABE-2019-24285
𝜑1 =𝑃𝑇2
𝑃𝑇1= (
𝑇𝑇2
𝑇𝑇1)
𝜂1𝛾
𝛾−1= (
𝐻𝑇2
𝐻𝑇1)
𝜂1𝛾
𝛾−1=(1 +
𝑈2𝐶𝑈2−𝑈1𝐶𝑈1
𝐶𝑝𝑇𝑇1)
𝜂1𝛾
𝛾−1 (5)
𝜑2 =𝑃𝑇4
𝑃𝑇3= (
𝑇𝑇4
𝑇𝑇3)
𝜂2𝛾
𝛾−1= (
𝐻𝑇4
𝐻𝑇3)
𝜂2𝛾
𝛾−1=(1 +
𝑈4𝐶𝑈4+𝑈3𝐶𝑈3
𝐶𝑝𝑇𝑇3)
𝜂2𝛾
𝛾−1 , (6)
where the polytropic efficiency of each rotor is 𝜂1 and 𝜂2, respectively.
Figure 13. Velocity Vector Diagram for Counter Rotating Fan System and the Station
Indices as noted in Fig.3. (W: velocity in relative frame)
Assuming the inlet swirl angle (α1) being 0°, and no power added into the stream tube
contraction between the trailing edge of the front rotor and the leading edge of the rear
rotor i.e.,
𝑇𝑇3=𝑇𝑇2, (7)
equation (4), (5) , and (6) can be further simplified as
1 +r2ω1Cz2tan α2
𝐶𝑝𝑇𝑇1= 𝜑1
𝛾−1
𝜂1𝛾, and 1 +r3ω2Cz3tan α3
𝐶𝑝𝑇𝑇3= 𝜑2
𝛾−1
𝜂2𝛾 (only if sin(αgoal)≅ 0) (8)
Consequently, the equations (8) will be re-arranged as,
𝜑2
𝛾−1
𝜂2𝛾 = 1 +ω2/ω1𝜅(𝜑1
𝛾−1𝜂1𝛾−1)𝐶𝑝𝑇𝑇1
𝐶𝑝𝑇𝑇2 , where 𝜅 =
r3Cz3tan α3
r2Cz2tan α2 . (9)
Thus, the rotational speed and pressure ratio of the counter rotating fans can be
correlated as follows,
𝜔2
𝜔1=
1
𝜅
𝜑2(𝛾−1)/(𝜂2𝛾)
−1
1−𝜑1−(𝛾−1)/(𝜂1𝛾) . (10)
The κ in the equation (10) depends on the contraction of the flowpath as in Eq.(11)
𝜅 =𝑟3Cz3tan α3
𝑟2Cz2tan α2 = (
𝑟2,𝑠2 −𝑟2,ℎ
2
𝑟3,𝑠2 −𝑟3,ℎ
2 ) , (11)
obtained from the conservation equations of the mass and angular momentum. Here, the
subscripts s and h denote shroud and hub at each station.
B.LEE ET AL. ISABE-2019-24285 13
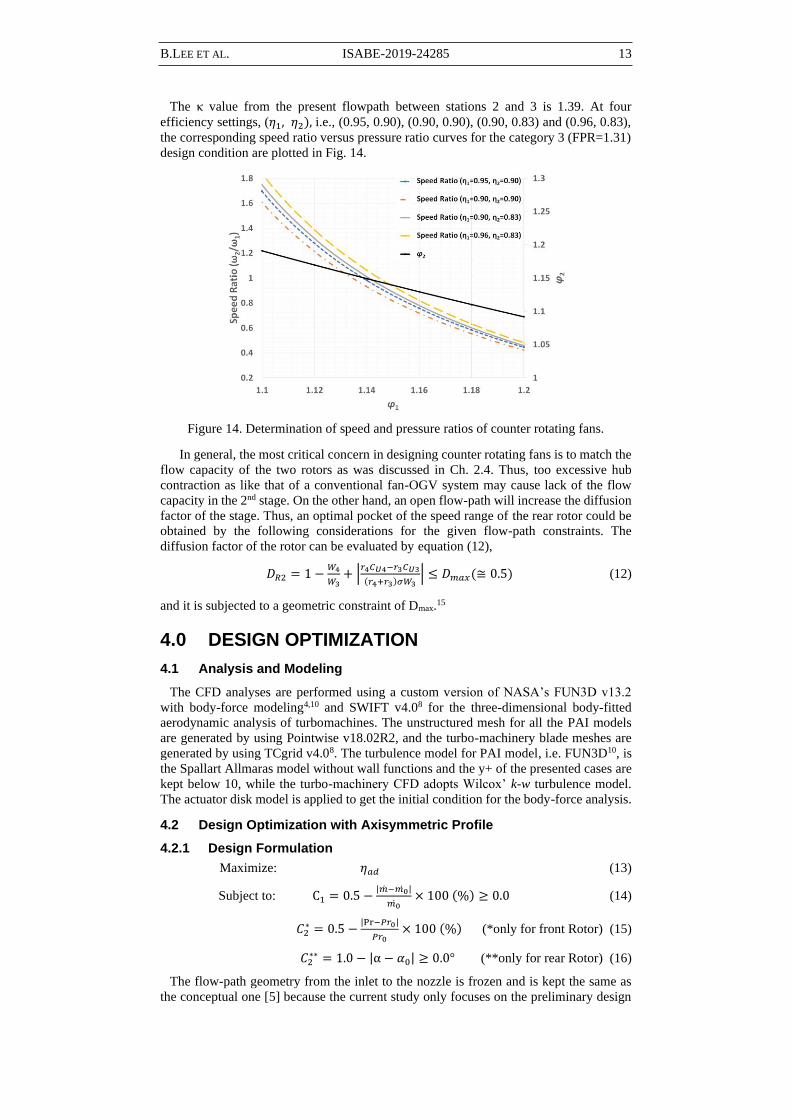
The κ value from the present flowpath between stations 2 and 3 is 1.39. At four
efficiency settings, (𝜂1, 𝜂2), i.e., (0.95, 0.90), (0.90, 0.90), (0.90, 0.83) and (0.96, 0.83),
the corresponding speed ratio versus pressure ratio curves for the category 3 (FPR=1.31)
design condition are plotted in Fig. 14.
Figure 14. Determination of speed and pressure ratios of counter rotating fans.
In general, the most critical concern in designing counter rotating fans is to match the
flow capacity of the two rotors as was discussed in Ch. 2.4. Thus, too excessive hub
contraction as like that of a conventional fan-OGV system may cause lack of the flow
capacity in the 2nd stage. On the other hand, an open flow-path will increase the diffusion
factor of the stage. Thus, an optimal pocket of the speed range of the rear rotor could be
obtained by the following considerations for the given flow-path constraints. The
diffusion factor of the rotor can be evaluated by equation (12),
𝐷𝑅2 = 1 −𝑊4
𝑊3+ |
𝑟4𝐶𝑈4−𝑟3𝐶𝑈3
(𝑟4+𝑟3)𝜎𝑊3| ≤ 𝐷𝑚𝑎𝑥(≅ 0.5) (12)
and it is subjected to a geometric constraint of Dmax.15
4.0 DESIGN OPTIMIZATION
4.1 Analysis and Modeling
The CFD analyses are performed using a custom version of NASA’s FUN3D v13.2
with body-force modeling4,10 and SWIFT v4.08 for the three-dimensional body-fitted
aerodynamic analysis of turbomachines. The unstructured mesh for all the PAI models
are generated by using Pointwise v18.02R2, and the turbo-machinery blade meshes are
generated by using TCgrid v4.08. The turbulence model for PAI model, i.e. FUN3D10, is
the Spallart Allmaras model without wall functions and the y+ of the presented cases are
kept below 10, while the turbo-machinery CFD adopts Wilcox’ k-w turbulence model.
The actuator disk model is applied to get the initial condition for the body-force analysis.
4.2 Design Optimization with Axisymmetric Profile
4.2.1 Design Formulation
Maximize: 𝜂𝑎𝑑 (13)
Subject to: C1 = 0.5 −|�̇�−𝑚0̇ |
𝑚0̇× 100 (%) ≥ 0.0 (14)
𝐶2∗ = 0.5 −
|Pr−𝑃𝑟0|
𝑃𝑟0× 100 (%) (*only for front Rotor) (15)
𝐶2∗∗ = 1.0 − |α − 𝛼0| ≥ 0.0° (**only for rear Rotor) (16)
The flow-path geometry from the inlet to the nozzle is frozen and is kept the same as
the conceptual one [5] because the current study only focuses on the preliminary design

14 ISABE-2019-24285
of the blades. The number of design parameters for each rotor blade is 25 mean-line angle
parameters i.e. 5 sections defined at 0%, 25%, 50%, 75%, 100% span and 5 per each
section. Also, the metal chord lengths for 5 design sections which are evenly distributed
radially from hub to tip. The stacking axis is automatically updated as the blade shape
changes. The objective of the rotor design is to maximize the adiabatic efficiency, 𝜂𝑎𝑑.
The design cost function and constraints on fan pressure ratio, mass flow rate and exit
flow angle are described in Eqs. (13)~(16), respectively. The design fan pressure ratio is
set as the design condition and kept within 0.5% band during the optimization. The target
mass flow rate is 𝑚0̇ and constrained also within 0.5% of variation. As indicated in Eqs.
(14)~(16), the positive constraint values indicate that the design satisfies the imposed
constraint during the optimization.
(a) Planform Design of the Front Rotor (b) Meanline Design of the Front Rotor
(c) Planform Design of the Rear Rotor (d) Meanline Design of the Rear Rotor
Figure 15. Design History of a pair of Counter Rotating Rotors (Examples).
[Front Rotor Design Condition: Wc = 128.7 kg/sec, Nc = 4000 RPM, PR0 = 1.15,
Rear Rotor Design Condition: Wc = 128.7 kg/sec, Nc = 4159 RPM, α4 = 0○]
4.2.2 Optimized Blade Geometry
The shape optimizations of the rotor blades are performed for the axisymmetric inlet
profile on single blade row CFD models. The blades are designed for the target condition
as above-discussed. The inlet profile discussed in section 2.2 is applied to each category
respectively. Figures 15 show examples of the design histories of the front and rear rotors
with NSGA-II. In the history in the figures, the planform design in Figs. 15-(a) and (c)
show the trade-off between the efficiency gains and meeting the constraints of the
corrected flow rate and pressure ratio for (a), or the corrected flow rate and exit flow
angles for (c). The meanline designs in Figs. 15-(b) and (d) show significant improvement
in the efficiency as it starts from the baseline which already satisfies the constraints. The
efficiency gain of the front rotor through the optimization process is about +6.6% from
the baseline to the final blade from the meanline design as the design space includes
enough design space to meet the constraints. On the other hand, the rear rotor design
struggled with meeting the mass flow rate condition as well as exit flow angle at the same
time. Thus, the efficiency gain is not as high as the front rotor could reach. However, still
the adiabatic efficiency of the rear rotor achieves around 93% with fan pressure ratio of
1.14. The overall stage efficiency of the current design presented in Figs.14 is about 95%,
stage pressure ratio is 1.31 at the design mass flow rate condition.
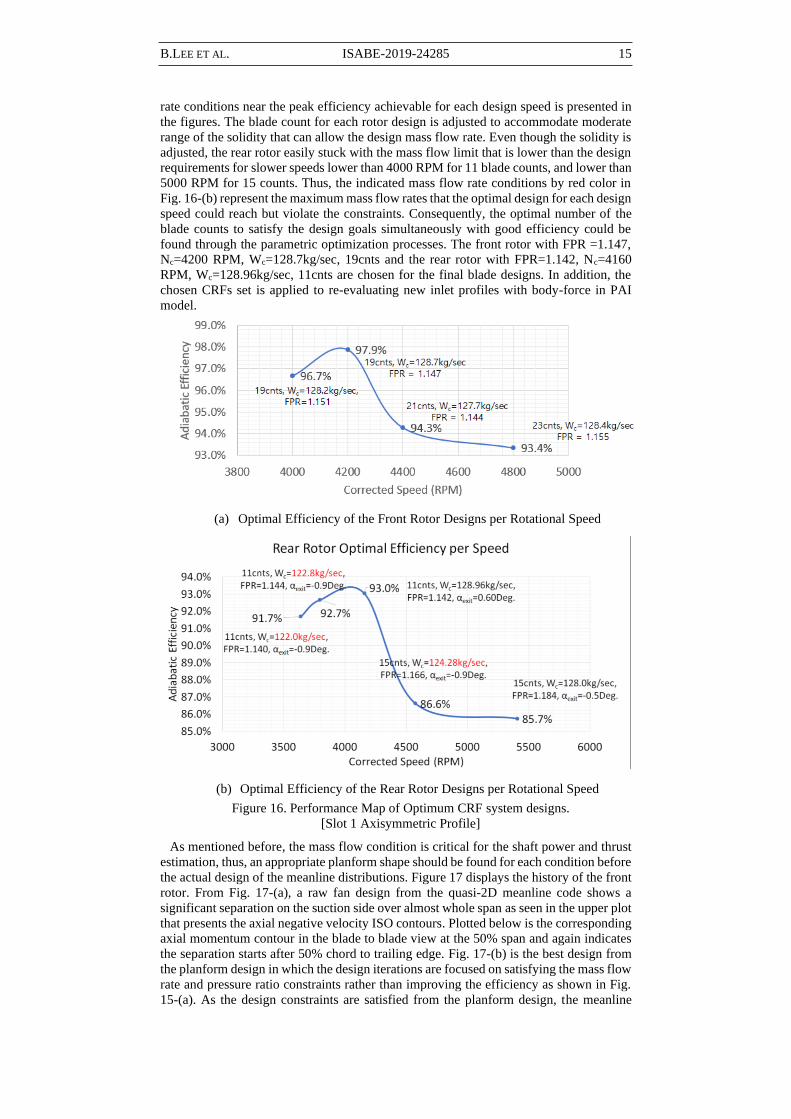
Figure 16 shows maps of the optimum solutions in different operating conditions. The
best results of CRFs optimization at various rotational speed and maximum mass flow
B.LEE ET AL. ISABE-2019-24285 15
rate conditions near the peak efficiency achievable for each design speed is presented in
the figures. The blade count for each rotor design is adjusted to accommodate moderate
range of the solidity that can allow the design mass flow rate. Even though the solidity is
adjusted, the rear rotor easily stuck with the mass flow limit that is lower than the design
requirements for slower speeds lower than 4000 RPM for 11 blade counts, and lower than
5000 RPM for 15 counts. Thus, the indicated mass flow rate conditions by red color in
Fig. 16-(b) represent the maximum mass flow rates that the optimal design for each design
speed could reach but violate the constraints. Consequently, the optimal number of the
blade counts to satisfy the design goals simultaneously with good efficiency could be
found through the parametric optimization processes. The front rotor with FPR =1.147,
Nc=4200 RPM, Wc=128.7kg/sec, 19cnts and the rear rotor with FPR=1.142, Nc=4160
RPM, Wc=128.96kg/sec, 11cnts are chosen for the final blade designs. In addition, the
chosen CRFs set is applied to re-evaluating new inlet profiles with body-force in PAI
model.
(a) Optimal Efficiency of the Front Rotor Designs per Rotational Speed
(b) Optimal Efficiency of the Rear Rotor Designs per Rotational Speed
Figure 16. Performance Map of Optimum CRF system designs.
[Slot 1 Axisymmetric Profile]
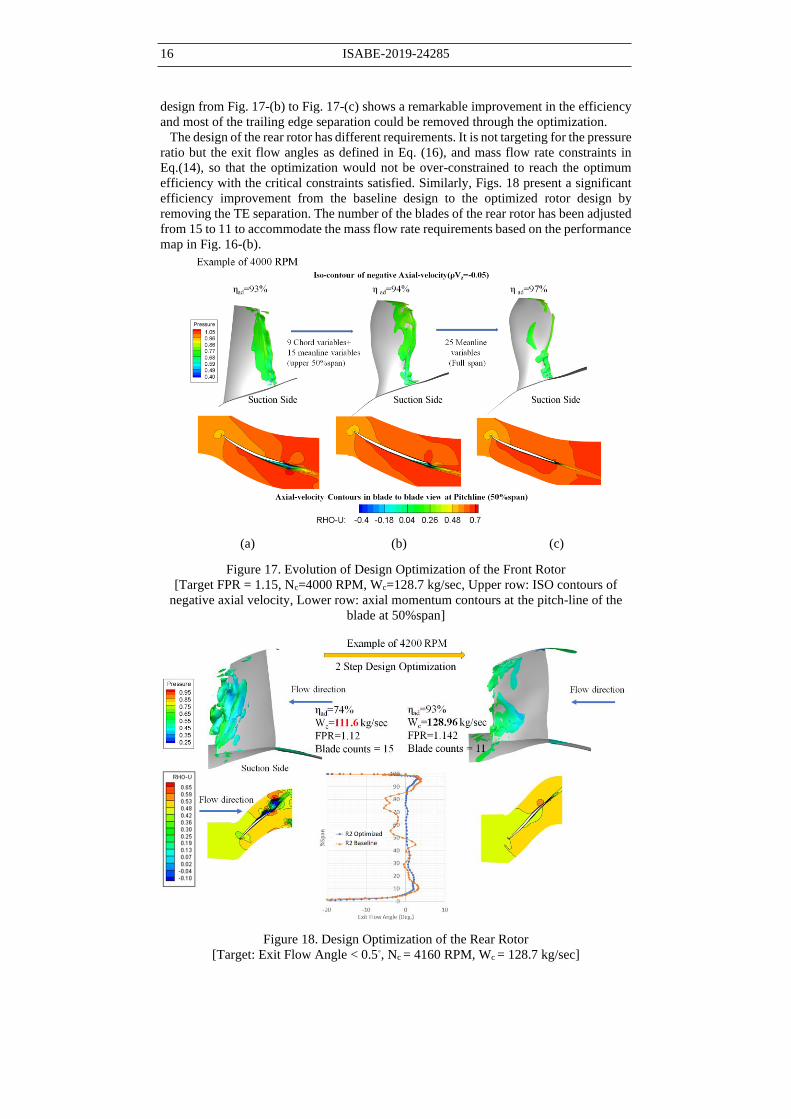
As mentioned before, the mass flow condition is critical for the shaft power and thrust
estimation, thus, an appropriate planform shape should be found for each condition before
the actual design of the meanline distributions. Figure 17 displays the history of the front
rotor. From Fig. 17-(a), a raw fan design from the quasi-2D meanline code shows a
significant separation on the suction side over almost whole span as seen in the upper plot
that presents the axial negative velocity ISO contours. Plotted below is the corresponding
axial momentum contour in the blade to blade view at the 50% span and again indicates
the separation starts after 50% chord to trailing edge. Fig. 17-(b) is the best design from
the planform design in which the design iterations are focused on satisfying the mass flow
rate and pressure ratio constraints rather than improving the efficiency as shown in Fig.
15-(a). As the design constraints are satisfied from the planform design, the meanline
16 ISABE-2019-24285
design from Fig. 17-(b) to Fig. 17-(c) shows a remarkable improvement in the efficiency
and most of the trailing edge separation could be removed through the optimization.
The design of the rear rotor has different requirements. It is not targeting for the pressure
ratio but the exit flow angles as defined in Eq. (16), and mass flow rate constraints in
Eq.(14), so that the optimization would not be over-constrained to reach the optimum
efficiency with the critical constraints satisfied. Similarly, Figs. 18 present a significant
efficiency improvement from the baseline design to the optimized rotor design by
removing the TE separation. The number of the blades of the rear rotor has been adjusted
from 15 to 11 to accommodate the mass flow rate requirements based on the performance
map in Fig. 16-(b).
(a) (b) (c)
Figure 17. Evolution of Design Optimization of the Front Rotor
[Target FPR = 1.15, Nc=4000 RPM, Wc=128.7 kg/sec, Upper row: ISO contours of
negative axial velocity, Lower row: axial momentum contours at the pitch-line of the
blade at 50%span]
Figure 18. Design Optimization of the Rear Rotor
[Target: Exit Flow Angle < 0.5◦, Nc = 4160 RPM, Wc = 128.7 kg/sec]
B.LEE ET AL. ISABE-2019-24285 17
5.0 PERFORMANCE ASSESSMENT
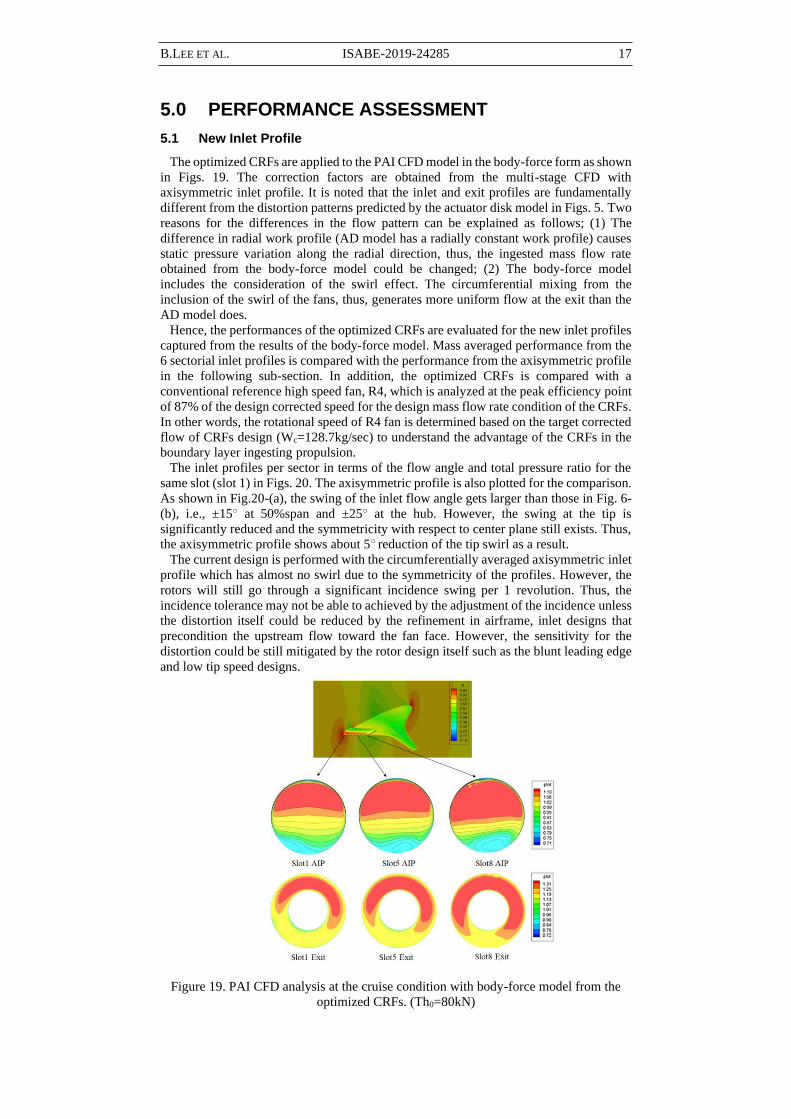
5.1 New Inlet Profile
The optimized CRFs are applied to the PAI CFD model in the body-force form as shown
in Figs. 19. The correction factors are obtained from the multi-stage CFD with
axisymmetric inlet profile. It is noted that the inlet and exit profiles are fundamentally
different from the distortion patterns predicted by the actuator disk model in Figs. 5. Two
reasons for the differences in the flow pattern can be explained as follows; (1) The
difference in radial work profile (AD model has a radially constant work profile) causes
static pressure variation along the radial direction, thus, the ingested mass flow rate
obtained from the body-force model could be changed; (2) The body-force model
includes the consideration of the swirl effect. The circumferential mixing from the
inclusion of the swirl of the fans, thus, generates more uniform flow at the exit than the
AD model does.
Hence, the performances of the optimized CRFs are evaluated for the new inlet profiles
captured from the results of the body-force model. Mass averaged performance from the
6 sectorial inlet profiles is compared with the performance from the axisymmetric profile
in the following sub-section. In addition, the optimized CRFs is compared with a
conventional reference high speed fan, R4, which is analyzed at the peak efficiency point
of 87% of the design corrected speed for the design mass flow rate condition of the CRFs.
In other words, the rotational speed of R4 fan is determined based on the target corrected
flow of CRFs design (Wc=128.7kg/sec) to understand the advantage of the CRFs in the
boundary layer ingesting propulsion.
The inlet profiles per sector in terms of the flow angle and total pressure ratio for the
same slot (slot 1) in Figs. 20. The axisymmetric profile is also plotted for the comparison.
As shown in Fig.20-(a), the swing of the inlet flow angle gets larger than those in Fig. 6-
(b), i.e., ±15○ at 50%span and ±25○ at the hub. However, the swing at the tip is
significantly reduced and the symmetricity with respect to center plane still exists. Thus,
the axisymmetric profile shows about 5○ reduction of the tip swirl as a result.
The current design is performed with the circumferentially averaged axisymmetric inlet
profile which has almost no swirl due to the symmetricity of the profiles. However, the
rotors will still go through a significant incidence swing per 1 revolution. Thus, the
incidence tolerance may not be able to achieved by the adjustment of the incidence unless
the distortion itself could be reduced by the refinement in airframe, inlet designs that
precondition the upstream flow toward the fan face. However, the sensitivity for the
distortion could be still mitigated by the rotor design itself such as the blunt leading edge
and low tip speed designs.
Figure 19. PAI CFD analysis at the cruise condition with body-force model from the
optimized CRFs. (Th0=80kN)
18 ISABE-2019-24285
5.2 Multi-Stage CFD
To demonstrate the distortion tolerant characteristics of the low speed low pressure
CRFs, a multi-stage CFD model for optimized CRFs is applied to 7 inlet profiles which
include 6 sectorial and one axisymmetric inlet profiles. The results from the local sectors
are circumferentially mass-weighted averaged to be compared with the axisymmetric
profile. A conventional high-speed R412 fan, as a reference for the same 7 inlet profiles,
is analyzed to investigate the capability of the designed CRFs in terms of the incidence
tolerance. The exit boundary condition specifies the hub static pressure at the same
pressure level as the axisymmetric profile case with radial equilibrium for each case
instead of specifying the mass flow rate condition.
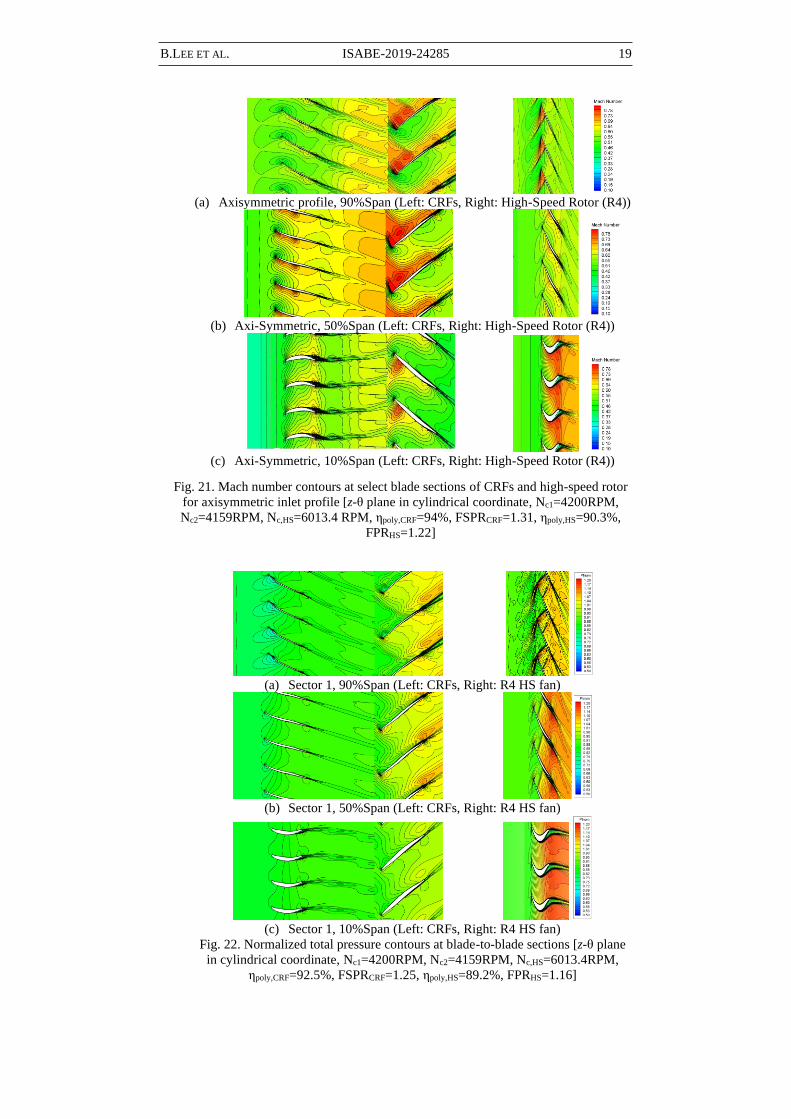
Figures 21 show the Mach number contours at the tip (90%span), pitch-line (50%span)
and hub (10%) for the axisymmetric profile case. Same contours from the R4 fan at 6013
RPM (87%Nc) are compared. The corrected mass flow rate for both cases are set as
Wc=270 (lbm/sec). Note that a corrected speed that pumps the same amount of the design
mass flow rate as the CRFs’ is found as the high-speed fan is not designed (or optimized)
for the boundary layer ingesting profile, thus, the pressure ratio through the high fan
(FPR=1.22) is found lower than that of CRFs (FPR=1.31).
Although the CRFs are designed for the inlet profile from actuator disk model, the
fans are working reasonably well with the new inlet profile. The leading edge of the rear
rotor goes through small shock on the suction side at the tip and the mid-span region but
the loss associated with those is relatively lower and locally confined in a passage
compared with that of the high-speed fan. Overall, both CRFs and high-speed fan operate
in a good working condition. The CRFs achieved 94% adiabatic efficiency for
FSPR=1.31 and R4 reached 90.3% for FPR=1.22 for the given mass flow rate condition.
The hub contour of the high-speed fan indicates that the hub area almost reaches the
choking condition near the trailing-edge region.
A normalized total pressure contours from two extreme inlet conditions, i.e., sector
1(near choking condition) and 5 (largest incidence at the tip, thus, near stall condition)
profiles are compared in Figs. 22 and 23. Since the fan pressure ratio of the two different
fans are not same, the total pressure contours are normalized with respect to the 1-D face
averaged pressure at the fan exit from the axisymmetric profile. Figs. 22 are presenting
the comparison at the sector 1 inlet profile while Figs. 23 are those from sector 5 profile.
(a) Inlet Flow Angle (Upper), (b) Total Pressure Profiles (Lower)
Fig. 20. Inlet Profiles from PAI CFD model with the body-force model4 including
swirling effects. (Slot 1, Th0=80kN)
B.LEE ET AL. ISABE-2019-24285 19
(a) Axisymmetric profile, 90%Span (Left: CRFs, Right: High-Speed Rotor (R4))
(b) Axi-Symmetric, 50%Span (Left: CRFs, Right: High-Speed Rotor (R4))
(c) Axi-Symmetric, 10%Span (Left: CRFs, Right: High-Speed Rotor (R4))
Fig. 21. Mach number contours at select blade sections of CRFs and high-speed rotor
for axisymmetric inlet profile [z-θ plane in cylindrical coordinate, Nc1=4200RPM,
Nc2=4159RPM, Nc,HS=6013.4 RPM, ηpoly,CRF=94%, FSPRCRF=1.31, ηpoly,HS=90.3%,
FPRHS=1.22]
(a) Sector 1, 90%Span (Left: CRFs, Right: R4 HS fan)
(b) Sector 1, 50%Span (Left: CRFs, Right: R4 HS fan)
(c) Sector 1, 10%Span (Left: CRFs, Right: R4 HS fan)
Fig. 22. Normalized total pressure contours at blade-to-blade sections [z-θ plane
in cylindrical coordinate, Nc1=4200RPM, Nc2=4159RPM, Nc,HS=6013.4RPM,
ηpoly,CRF=92.5%, FSPRCRF=1.25, ηpoly,HS=89.2%, FPRHS=1.16]
20 ISABE-2019-24285
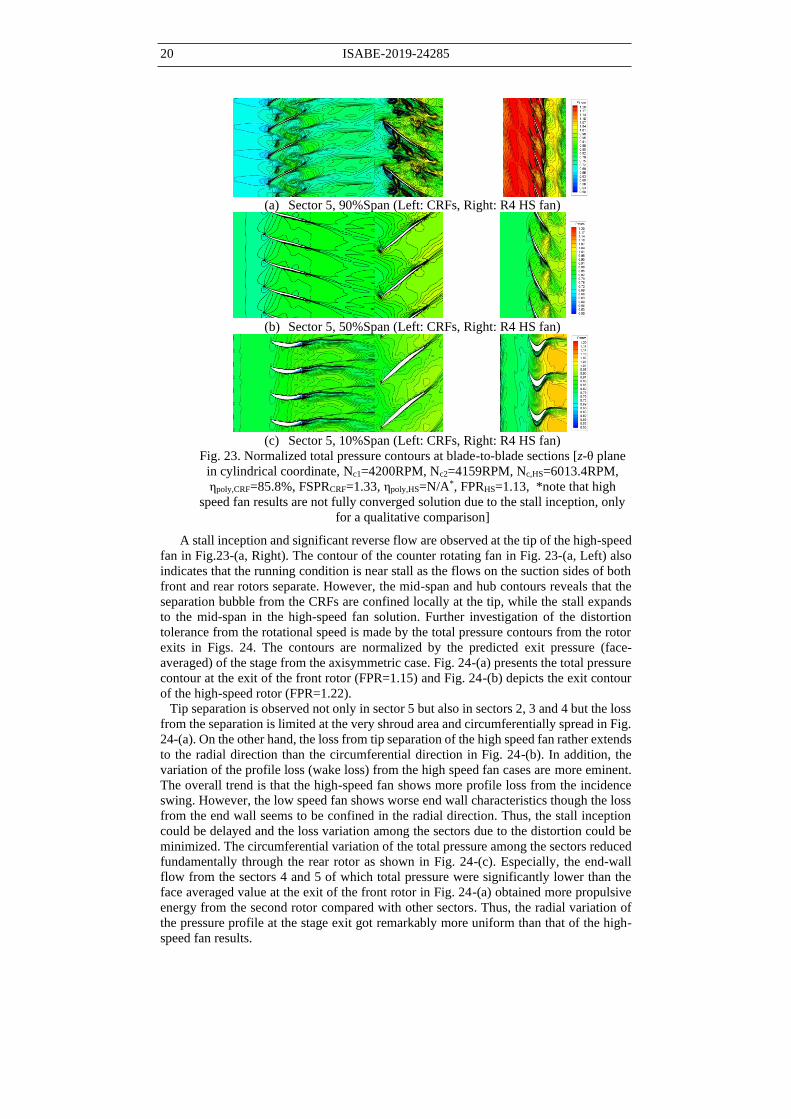
(a) Sector 5, 90%Span (Left: CRFs, Right: R4 HS fan)
(b) Sector 5, 50%Span (Left: CRFs, Right: R4 HS fan)
(c) Sector 5, 10%Span (Left: CRFs, Right: R4 HS fan)
Fig. 23. Normalized total pressure contours at blade-to-blade sections [z-θ plane
in cylindrical coordinate, Nc1=4200RPM, Nc2=4159RPM, Nc,HS=6013.4RPM,
ηpoly,CRF=85.8%, FSPRCRF=1.33, ηpoly,HS=N/A*, FPRHS=1.13, *note that high
speed fan results are not fully converged solution due to the stall inception, only
for a qualitative comparison]
A stall inception and significant reverse flow are observed at the tip of the high-speed
fan in Fig.23-(a, Right). The contour of the counter rotating fan in Fig. 23-(a, Left) also
indicates that the running condition is near stall as the flows on the suction sides of both
front and rear rotors separate. However, the mid-span and hub contours reveals that the
separation bubble from the CRFs are confined locally at the tip, while the stall expands
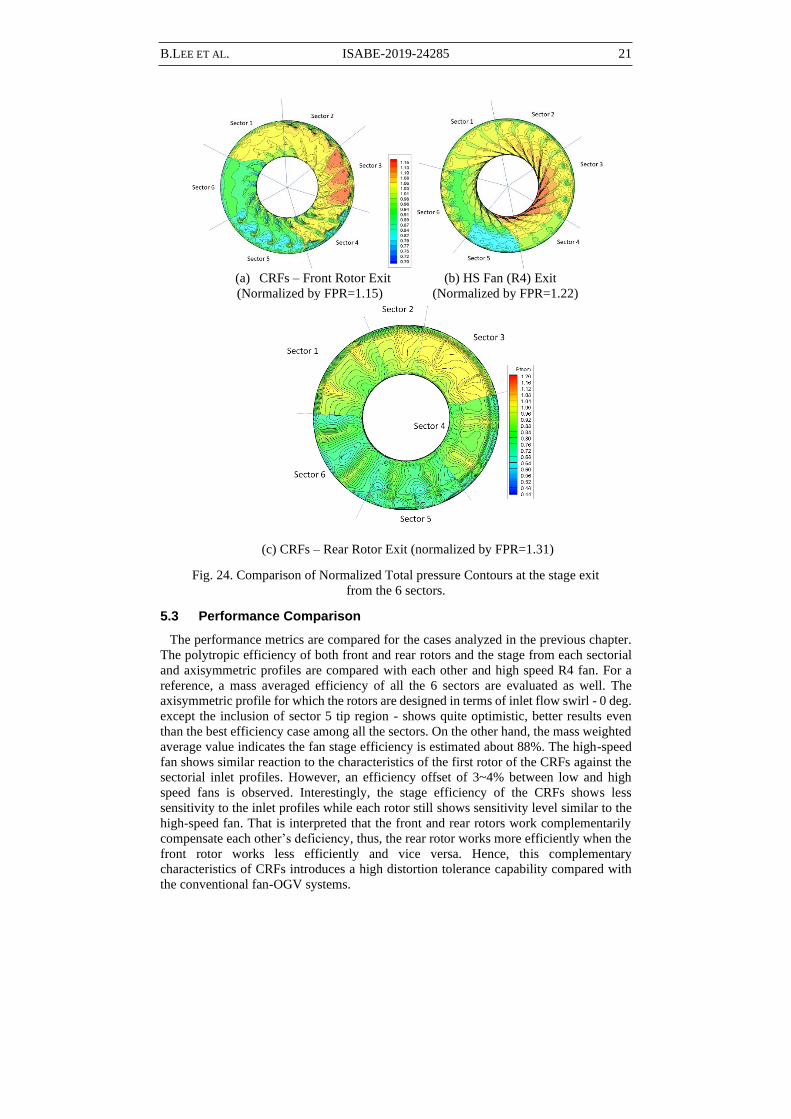
to the mid-span in the high-speed fan solution. Further investigation of the distortion
tolerance from the rotational speed is made by the total pressure contours from the rotor
exits in Figs. 24. The contours are normalized by the predicted exit pressure (face-
averaged) of the stage from the axisymmetric case. Fig. 24-(a) presents the total pressure
contour at the exit of the front rotor (FPR=1.15) and Fig. 24-(b) depicts the exit contour
of the high-speed rotor (FPR=1.22).
Tip separation is observed not only in sector 5 but also in sectors 2, 3 and 4 but the loss
from the separation is limited at the very shroud area and circumferentially spread in Fig.
24-(a). On the other hand, the loss from tip separation of the high speed fan rather extends
to the radial direction than the circumferential direction in Fig. 24-(b). In addition, the
variation of the profile loss (wake loss) from the high speed fan cases are more eminent.
The overall trend is that the high-speed fan shows more profile loss from the incidence
swing. However, the low speed fan shows worse end wall characteristics though the loss
from the end wall seems to be confined in the radial direction. Thus, the stall inception
could be delayed and the loss variation among the sectors due to the distortion could be
minimized. The circumferential variation of the total pressure among the sectors reduced
fundamentally through the rear rotor as shown in Fig. 24-(c). Especially, the end-wall
flow from the sectors 4 and 5 of which total pressure were significantly lower than the
face averaged value at the exit of the front rotor in Fig. 24-(a) obtained more propulsive
energy from the second rotor compared with other sectors. Thus, the radial variation of
the pressure profile at the stage exit got remarkably more uniform than that of the high-
speed fan results.
B.LEE ET AL. ISABE-2019-24285 21
(a) CRFs – Front Rotor Exit (b) HS Fan (R4) Exit
(Normalized by FPR=1.15) (Normalized by FPR=1.22)
(c) CRFs – Rear Rotor Exit (normalized by FPR=1.31)
Fig. 24. Comparison of Normalized Total pressure Contours at the stage exit
from the 6 sectors.
5.3 Performance Comparison
The performance metrics are compared for the cases analyzed in the previous chapter.
The polytropic efficiency of both front and rear rotors and the stage from each sectorial
and axisymmetric profiles are compared with each other and high speed R4 fan. For a
reference, a mass averaged efficiency of all the 6 sectors are evaluated as well. The
axisymmetric profile for which the rotors are designed in terms of inlet flow swirl - 0 deg.
except the inclusion of sector 5 tip region - shows quite optimistic, better results even
than the best efficiency case among all the sectors. On the other hand, the mass weighted
average value indicates the fan stage efficiency is estimated about 88%. The high-speed
fan shows similar reaction to the characteristics of the first rotor of the CRFs against the
sectorial inlet profiles. However, an efficiency offset of 3~4% between low and high
speed fans is observed. Interestingly, the stage efficiency of the CRFs shows less
sensitivity to the inlet profiles while each rotor still shows sensitivity level similar to the
high-speed fan. That is interpreted that the front and rear rotors work complementarily
compensate each other’s deficiency, thus, the rear rotor works more efficiently when the
front rotor works less efficiently and vice versa. Hence, this complementary
characteristics of CRFs introduces a high distortion tolerance capability compared with
the conventional fan-OGV systems.
22 ISABE-2019-24285
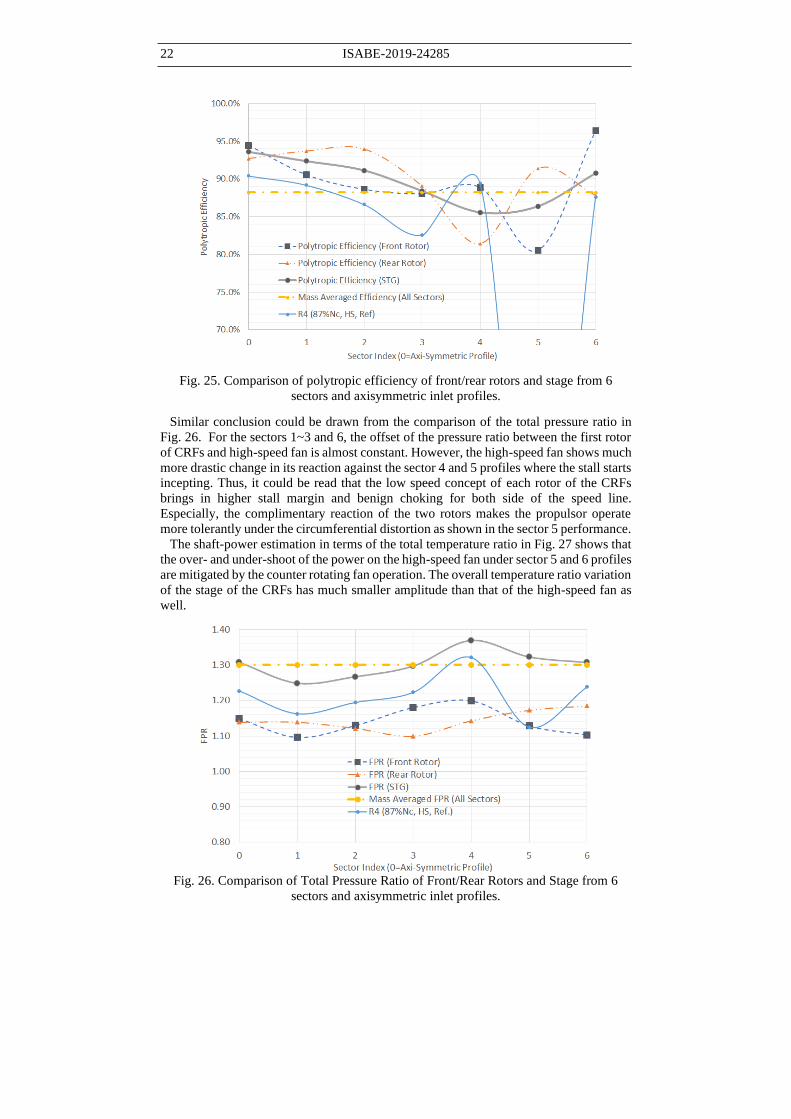
Fig. 25. Comparison of polytropic efficiency of front/rear rotors and stage from 6
sectors and axisymmetric inlet profiles.
Similar conclusion could be drawn from the comparison of the total pressure ratio in
Fig. 26. For the sectors 1~3 and 6, the offset of the pressure ratio between the first rotor
of CRFs and high-speed fan is almost constant. However, the high-speed fan shows much
more drastic change in its reaction against the sector 4 and 5 profiles where the stall starts
incepting. Thus, it could be read that the low speed concept of each rotor of the CRFs
brings in higher stall margin and benign choking for both side of the speed line.
Especially, the complimentary reaction of the two rotors makes the propulsor operate
more tolerantly under the circumferential distortion as shown in the sector 5 performance.
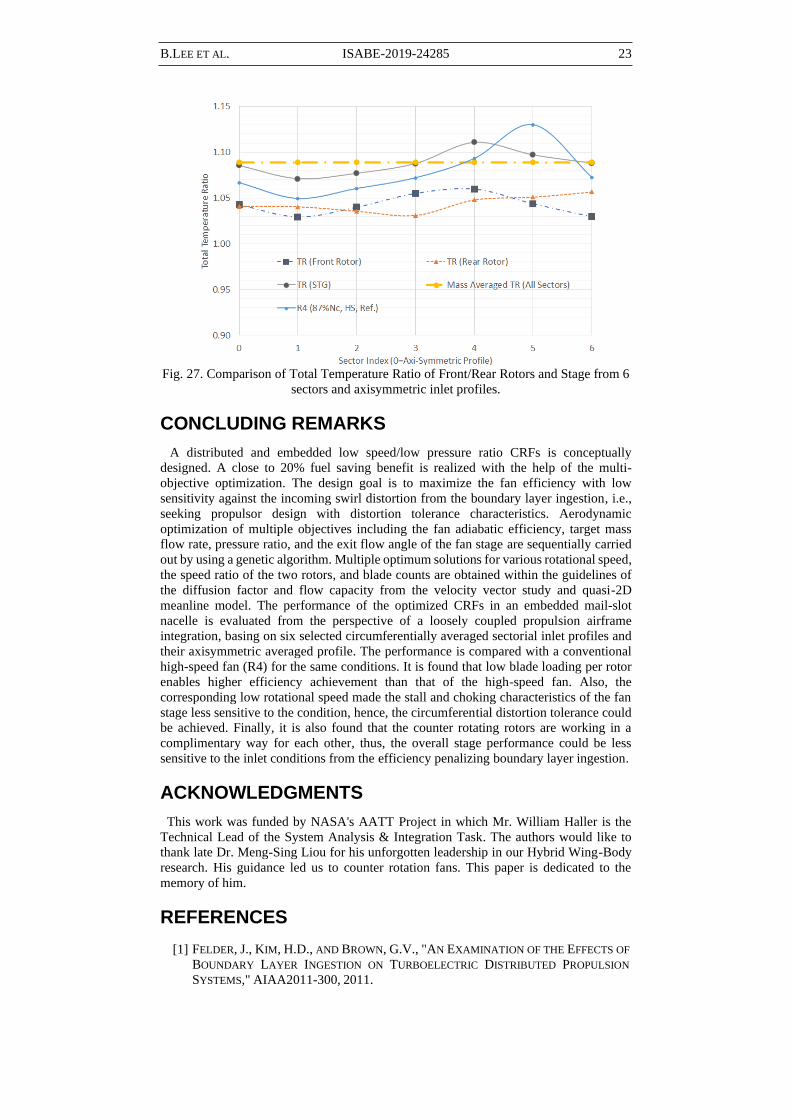
The shaft-power estimation in terms of the total temperature ratio in Fig. 27 shows that
the over- and under-shoot of the power on the high-speed fan under sector 5 and 6 profiles
are mitigated by the counter rotating fan operation. The overall temperature ratio variation
of the stage of the CRFs has much smaller amplitude than that of the high-speed fan as
well.
Fig. 26. Comparison of Total Pressure Ratio of Front/Rear Rotors and Stage from 6
sectors and axisymmetric inlet profiles.
B.LEE ET AL. ISABE-2019-24285 23
Fig. 27. Comparison of Total Temperature Ratio of Front/Rear Rotors and Stage from 6
sectors and axisymmetric inlet profiles.
CONCLUDING REMARKS
A distributed and embedded low speed/low pressure ratio CRFs is conceptually
designed. A close to 20% fuel saving benefit is realized with the help of the multi-
objective optimization. The design goal is to maximize the fan efficiency with low
sensitivity against the incoming swirl distortion from the boundary layer ingestion, i.e.,
seeking propulsor design with distortion tolerance characteristics. Aerodynamic
optimization of multiple objectives including the fan adiabatic efficiency, target mass
flow rate, pressure ratio, and the exit flow angle of the fan stage are sequentially carried
out by using a genetic algorithm. Multiple optimum solutions for various rotational speed,
the speed ratio of the two rotors, and blade counts are obtained within the guidelines of
the diffusion factor and flow capacity from the velocity vector study and quasi-2D
meanline model. The performance of the optimized CRFs in an embedded mail-slot
nacelle is evaluated from the perspective of a loosely coupled propulsion airframe
integration, basing on six selected circumferentially averaged sectorial inlet profiles and
their axisymmetric averaged profile. The performance is compared with a conventional
high-speed fan (R4) for the same conditions. It is found that low blade loading per rotor
enables higher efficiency achievement than that of the high-speed fan. Also, the
corresponding low rotational speed made the stall and choking characteristics of the fan
stage less sensitive to the condition, hence, the circumferential distortion tolerance could
be achieved. Finally, it is also found that the counter rotating rotors are working in a
complimentary way for each other, thus, the overall stage performance could be less
sensitive to the inlet conditions from the efficiency penalizing boundary layer ingestion.
ACKNOWLEDGMENTS
This work was funded by NASA's AATT Project in which Mr. William Haller is the
Technical Lead of the System Analysis & Integration Task. The authors would like to
thank late Dr. Meng-Sing Liou for his unforgotten leadership in our Hybrid Wing-Body
research. His guidance led us to counter rotation fans. This paper is dedicated to the
memory of him.
REFERENCES
[1] FELDER, J., KIM, H.D., AND BROWN, G.V., "AN EXAMINATION OF THE EFFECTS OF
BOUNDARY LAYER INGESTION ON TURBOELECTRIC DISTRIBUTED PROPULSION
SYSTEMS," AIAA2011-300, 2011.
24 ISABE-2019-24285
[2] KIM, H., HARDING, D., GRONSTAL, D. T., LIOU, M.-F., AND LIOU, M.-S.:
AERODYNAMIC DESIGN OF HYBRID WINGBODY WITH NACELLE: N3–X
PROPULSION-AIRFRAME CONFIGURATION. AIAA 2016–3875, 2016.
HTTPS://DOI.ORG/10.2514/6.2016-3875
[3] KIM, H., LIOU, M.-F. AND LIOU, M.-S. “MAIL-SLOT NACELLE SHAPE DESIGN FOR
N3-X HYBRID WING BODY CONFIGURATION,” AIAA 2015-3805, AIAA
PROPULSION & ENERGY FORUM 2015, ORLANDO, FL, 27-29 JULY 2015.
[4] KIM, H., AND LIOU, M.-S. “FLOW SIMULATION AND OPTIMAL SHAPE DESIGN OF N3-
X HYBRID WING BODY CONFIGURATION USING A BODY FORCE METHOD,”
AEROSPACE SCIENCE AND TECHNOLOGY, VOL. 71, PP. 661-674, OCT., 2017.
[5] LEE, B., LIOU, M. AND KIM, H., "AERODYNAMIC CONCEPTUAL DESIGN OF
BOUNDARY LAYER INGESTION PROPULSOR SYSTEMS: HYBRID WINGBODY
AIRCRAFT WITH PROPULSION-AIRFRAME-INTEGRATION," AIAA2018-3954, 2018.
[6] LIOU, M.-F., KIM, H.J., LEE, B.J. AND LIOU, M.-S., “AERODYNAMIC DESIGN OF
INTEGRATED PROPULSION-AIRFRAME CONFIGURATION OF THE HYBRID WINGBODY
AIRCRAFT,” AIAA 2017-3411, 35TH AIAA APPLIED AERODYNAMICS CONFERENCE,
JUNE 05-09, 2017, DENVER, CO, 10.2514/6.2017-3411.
[7] LEE, B., AND LIOU, M.-F.,"AERODYNAMIC DESIGN AND OPTIMIZATION OF FAN
STAGE FOR BOUNDARY LAYER INGESTION PROPULSION SYSEM," ICCFD10-091,
2018.
[8] CHIMA, R. V., "A THREE-DIMENSIONAL UNSTEADY CFD MODEL OF
COMPRESSOR STABILITY," GT2006-90040, 2006.
[9] DEB, K., PRATAP, A. AGARWAL, S. AND MEYARIVAN, T., "A FAST AND ELITIST
MULTIOBJECTIVE GENETIC ALGORITHM: NSGA-II," IEEE TRANSACTIONS ON
EVOLUTIONARY COMPUTATION, VOL.6, NO.2, APR. 2002.
[10] BIEDRON, R., CARLSON, J., DERLAGA, J., GNOFFO, P., HAMMOND, D., JONES, W.,
KLEB, B., LEE-RAUSCH, E., NIELSEN, E., PARK, M., RUMSEY, C., THOMAS, J. AND
WOOD, W., " FUN3D MANUAL: 13.3," NASA/TM-2018-219808.
[11] AREND, D., “EXPERIMENTAL EVALUATION OF EMBEDDED BOUNDARY LAYER
INGESTING PROPULSOR FOR HIGHLY EFFICIENT SUBSONIC CRUISE AIRCRAFT,”
AIAA 2017-5041
[12] SMITH, L. H., “WAKE INGESTION PROPULSION BENEFIT,” J. PROPULSION AND
POWER, VOL. 9, 74-82, 1993.
[13] HUGHES, C. E., “AERODYNAMIC PERFORMANCE OF SCALE-MODEL TURBOFAN
OUTLET GUIDE VANES DESIGNED FOR LOW NOISE,” AIAA-2002-0374, AIAA,
2002. ALSO NASA/TM-2001-211352, 2011.
[14] LEE, B., LIOU, M.-F. AND LIOU, M.-S., "CONCEPTUAL DESIGN OF A TAIL-CONE
THRUSTER SYSTEM UNDER AXI-SYMMETRIC INLET DISTORTION," GT2018-75861,
2018.
[15] RONALD H. AUNGIER, "AXIAL-FLOW COMPRESSORS", ASME EDUCATIONAL
SERIES, PUBLISHED: 2003, DOI:10.1115/1.801926 0