Embed Size (px)
Citation preview

Optoprime Conceptual Designs, LLC. Conceptual Design Review
OP-5-9-08
Conceptual Design Review
Optoprime Conceptual Designs, LLC.
Team 2 AJ Berger
Colby Darlage Joshua Dias
Ahmad Kamaruddin Pete Krupski Josh Mason
Camrand Tucker
Page 1 of 46

Optoprime Conceptual Designs, LLC. Conceptual Design Review
TTAABBLLEE OOFF CCOONNTTEENNTTSS
MISSION STATEMENT ................................................................................................. 4 INTRODUCTION............................................................................................................. 4 USE CASE SCENARIOS................................................................................................. 5
Scenario #1 ..................................................................................................................... 5 Scenario #2 ..................................................................................................................... 6 Scenario #3 ..................................................................................................................... 7
MAJOR DESIGN REQUIREMENTS............................................................................ 7 SIZING STUDY ................................................................................................................ 8
Design Mission................................................................................................................ 8 Sizing Method.................................................................................................................. 8 Carpet Plots .................................................................................................................. 11
AIRCRAFT DESCRIPTION......................................................................................... 12 Aircraft Three View....................................................................................................... 12 Fuselage ........................................................................................................................ 13
DESIGN TRADE-OFFS................................................................................................. 15 Cargo Carrier Function................................................................................................ 15
AERODYNAMICS ......................................................................................................... 16 Airfoil ............................................................................................................................ 16 High Lift Devices .......................................................................................................... 18
0DC ................................................................................................................................ 19 Drag Polar .................................................................................................................... 20 Aerodynamics Conclusion ............................................................................................ 20
PERFORMANCE ........................................................................................................... 20 Flight Envelope ............................................................................................................. 20 V-n Diagram ................................................................................................................. 21 Important Performance Specifications ......................................................................... 22
WEIGHT AND BALANCE ........................................................................................... 22 Component Weights ...................................................................................................... 22 CG Range...................................................................................................................... 23 Fuel ............................................................................................................................... 25 Power Plant .................................................................................................................. 25 Wave Rotor Combustion ............................................................................................... 27 Solar Energy ................................................................................................................. 29 Engine Design ............................................................................................................... 30
STRUCTURAL ANALYSIS.......................................................................................... 30 Fuselage Structure ........................................................................................................ 30 Wing Structure .............................................................................................................. 31 Material Selection ......................................................................................................... 33 Engine Mounting........................................................................................................... 34 Landing Gear Placement .............................................................................................. 35
STABILITY AND CONTROL ...................................................................................... 38 Static Longitudinal Stability ......................................................................................... 38
Page 2 of 46

Optoprime Conceptual Designs, LLC. Conceptual Design Review
Control Surface Sizing .................................................................................................. 38 RELIABILITY STUDY ................................................................................................. 40
Composite Materials ..................................................................................................... 40 Avionics Suite................................................................................................................ 40 Airplane Operators & Redundancy .............................................................................. 40
FINANCIAL ANALYSIS............................................................................................... 41 Assumptions ................................................................................................................. 41 Fixed Costs.................................................................................................................... 42 Variable Costs............................................................................................................... 42 Profits............................................................................................................................ 43
CONCLUSION ............................................................................................................... 44 REFERENCES................................................................................................................ 45
Page 3 of 46

Optoprime Conceptual Designs, LLC. Conceptual Design Review
MISSION STATEMENT To satisfy our customers through the design of an advanced mid-range aircraft capable of relieving congestion at major hubs throughout the world. The aircraft will:
• Operate from lesser-equipped airports throughout the world, • Maintain a high cruise speed while limiting negative impact on the environment, • Satisfy customer needs without sacrificing safety.
INTRODUCTION Having defined the System Requirements and System Definitions Optoprime Conceptual Designs specified the System Definitions for an aircraft that will reduce network congestion within the United States as well as develop growing travel industries worldwide. The voice of the customer was heard through contact with airline management as well as market forecasts from major commercial airframers including Airbus, Boeing and Bombardier Aerospace. The team used a House-of-Quality (HoQ) to determine the importance of the requirements, which would, in turn, guide design.
Page 4 of 46

Optoprime Conceptual Designs, LLC. Conceptual Design Review
USE CASE SCENARIOS In these use case scenarios, we are describing possible missions our aircraft will be able to perform. These city pairs and the distances are representative of mission profiles that could take place between other cities as well. The routes are not limited to these areas of operations, but could possibly include city pairs throughout the world. It is important to note that all of these use cases have a built in fuel reserve and that in Scenario 3 that reserve is specifically used and pointed out. Scenario #1 The world economy is booming and it is not practical to limit one’s economic interests by country borders. Chinese investors, who are a part of the fastest growing economy in the world, have expanded their operations into technologically growing India. They are working closely with their Indian investment and this requires them to take frequent and regular trips from Hong Kong to Madras. From Hong Kong International, they depart using only part of the international runway utilizing simultaneous operations on one runway. They then set a direct course for Madras. The long haul ends when the aircraft lands on the 6000 ft (available) runway at Madras with plenty of room to spare. There is, however, one problem: the passengers seem reluctant to leave. They don’t want to trade the comfortable plane for a cramped limo.
Figure 1: Scenario 1 Mission Profile
Page 5 of 46

Optoprime Conceptual Designs, LLC. Conceptual Design Review
Scenario #2 The school year “Down Under” is just over and it is time for vacation or “holiday.” Many students in Sydney desire to travel across the continent to Perth so they can forget about the rigors of the past school year. They board our aircraft in Sydney and fly the 1800 NM to Perth. In Perth the aircraft is reconfigured and loaded with cargo instead of passengers. The aircraft then travels 1000 NM to the middle of the outback to the small mining town of Coober Pedy where cargo is transferred. Coober Pedy has a short runway and limited facilities but that is what our aircraft is designed for. Unfortunately, Coober Pedy does not have any fuel available, but that does not pose a problem. Our aircraft does not need to refuel to travel the 900 NM back to Sydney where it is converted back to a passenger aircraft. Our aircraft will have the quick change cargo feature which will allow it to maximize revenue by allowing passenger use during peak times and cargo operations during the down times. Passenger seats could be removed and stored at multiple locations or carried onboard in a cargo container and then refitted when the cargo haul was finished.
Figure 2: Scenario 2 Mission Profile
Page 6 of 46

Optoprime Conceptual Designs, LLC. Conceptual Design Review
Scenario #3 Chicago O’Hare International Airport is overly congested. Many patrons on the south side of Chicago choose Gary/Chicago International to relieve some of that congestion. Our aircraft departs on the 3000 ft runway at Gary/Chicago traveling 800 NM to Boulder. Denver International like O’Hare is overly congested so the airport at Boulder is used to relieve some of the congestion at Denver. The pilot is trying to beat a weather system moving into the western United States. Unfortunately, the system picked up speed and the plane is forced into a holding pattern to wait for the weather to clear. Snow begins to fall and the aircraft needs to find a new airport to wait for the snowstorm to clear. The flight is diverted over the mountains to Durango 200 NM away. After the storm clears the plane takes off and flies back to Boulder and easily lands on the 4000 ft (available) runway and turns off approximately midfield without having needed to take on fuel at Durango.
Figure 3: Scenario 3 Mission Profile
MAJOR DESIGN REQUIREMENTS Concept selection is a difficult process and it is necessary to have a good tool for selecting a single concept from a long list of concepts. From the HoQ, we knew what we generally were looking for in a concept. However, the team generated a list of priorities to aid in the concept evaluation and subsequent selection phase. Pugh’s Method is a 10-step design tool created for the purpose of selecting one concept from a list of concepts by eliminating designs, creating new designs, and/or creating hybrid designs. This process is simplified here, for clarity. The first step in Pugh’s Method is to come up with a list of requirements. To start out, we had group members present ideas for requirements and we wrote them on a dry-erase board. Many of these requirements came from our group’s House of Quality. We then wrote each requirement
Page 7 of 46

Optoprime Conceptual Designs, LLC. Conceptual Design Review on a small piece of paper and laid them on a table. Next, we began the process of grouping the pieces of paper in categories. For this process group members did not speak; anyone was allowed to move the papers around the table even if they had already been moved by someone else. If we noticed that a requirement was being moved back and forth between two groups, the team made a copy of that requirement and allowed it to coexist. After the general movement had ceased, the team discussed these categories. Some were eliminated, instead using a single requirement title. We continued this process until everyone was satisfied with the results and we had our list of requirements to use for the concept selection. Table 1 below, lists the resulting requirements from this process.
Table 1: Design Requirements for Pugh’s Method Design Requirements
Passenger Climate/ComfortShort RunwayRangeGate TimeEasy MaintenanceLow NoiseEnergy EfficiencyLimited Terminal ServiceObstacle ClearanceCrew Cost
SIZING STUDY Design Mission The design mission for OP-5-9-08 sizing purposes consists of the following mission schedule:
1. Start (engine start, warm-up, taxi to active runway and departure) 2. Climb (second-segment climb to cruise altitude of FL330 – 33,000 ft MSL) 3. Cruise (1850 NM cruise at FL330) 4. Descent (descent from cruise and approach to final) 5. Full Stop (full-stop with taxi to terminal and shutdown)
This mission has the advantages of being generally representative of the first use case scenario as well as minimizing the complexity of sizing. Sizing Method From the Systems Definitions Review, Optoprime elected to move forward with a joined-wing configuration airplane. The team elected to use FLOPS to size our design. Factors that led us to this sizing method included using standard and existing jet fuels. Research into Green Freedom™ technology allayed the team’s reservations of burning hydrocarbon-based fossil fuels, such as Jet A, Jet A-1 and Jet B, beyond the year 2038. Additionally, FLOPS is capable of giving us great amounts of detail in our studies.
Page 8 of 46

Optoprime Conceptual Designs, LLC. Conceptual Design Review We initially assumed that our aircraft would be comparable in size to existing aircraft in the same category and class. These similar aircraft include:
• Airbus A318/A319/A320*
• Boeing 737-500/600* • Bombardier CRJ-700/705* • Bombardier CRJ-900/900ER/900LR* • Bombardier C1000/C1000ER/C1000LR* • Embraer 170/170AR/170LR* • Embraer 190/190AR/190LR* • Embraer 195/195AR/195LR* • Sukhoi Super Jet 100*
Compiling data for similar vehicles allows designers to understand the size of their airplane design. Additionally, these values can serve as a starting point, or an “average aircraft” to from which to move forward. Beginning with an “average aircraft” allows designers to begin with existing aircraft and improve on key parameters such as T/W and W/S. Table 2, below, presents a summary of the resulting aircraft:
Table 2: "Average Aircraft" Values
Parameter Average Value UnitWe 60,653 lbW0 107,288 lbWe/W0 0.565 nondimEmpty Weight Fraction 0.567 nondimWingspan 92.59 ft
Wing Area 954.8 ft2
Engine Weight 3,383.2 lbBaseline Thrust 18,209 lbTSFC 0.748 lb/hr/lbT/W 0.343 nondimW/S 111.5 psfAspect Ratio 8.98 nondim
Average Values
After verifying these numbers and selecting a concept, Optoprime used this data to begin the detailed sizing process. In the FLOPS model, the team made assumptions as well as design decisions. Design decisions included in the sizing model were:
• 100 single-class passengers, • 34 in seat pitch, • 2 x 2 configuration, • 2000 NM Design Range, • Extensive composites use and • Cruising altitude at FL330 (33,000 ft MSL)
* These aircraft models are registered trademarks of their respective copyright holders.
Page 9 of 46

Optoprime Conceptual Designs, LLC. Conceptual Design Review
. Key assumptions originally included:
• M = 0.78, • Aspect Ratio (AR) = 6, • Thrust-to-Weight (T/W) ratio = 0.3, • Wingloading (W/S) = 100, • Specific Fuel Consumption (SFC) min = 0.3, • Specific Fuel Consumption (SFC) max = 0.5, • Sweep angle of the forward wing quarter chord (Λ0.25c, fore) = 35° and • Jet-A fuel
These assumptions put the OP-5-9-08 in the speed range that most regional aircraft compete in. The low specific fuel consumptions allow the aircraft to achieve a lower gross weight. This, in turn, leads to smaller engines and/or lower power settings, allowing the operator to save money in Direct Operating Costs. The sweep angle allows the aircraft to delay transonic effects. As the design process progressed, these assumptions changed to reflect the design, as shown below:
• T/W = 0.35, • W/S = 100 psf
• SFCmin = 0.1, • SFCmax = 0.2,
• Λ0.25c, fore = 32° FLOPS is somewhat crude in comparison to other aircraft sizing codes such as ACS. As analysis continued, it became increasingly complex to model our joined wing configuration in FLOPS. The problem originated from the fact that FLOPS requires a main wing, upon which it bases its calculations for parameters, most notably W/S. Early FLOPS models of this aircraft treated the aircraft as a traditional aircraft with a large main wing and an enormous horizontal tail. The team soon realized that this method was incorrect as FLOPS would model all the wingloading onto the main wing. Knowing the wingloading from constraint analysis and the weight from sizing, FLOPS would model an excessively large wingspan, based on the Aspect Ratio. This airplane model had little to do with the aft wing. Although it existed, FLOPS did not place any wingloading onto it. Incidentally, FLOPS reinforced the main wing as a result to counteract what the sizing program thought was a down force. In summary, the team wanted the wingloading to be placed upon all the lifting surfaces: total fore aftS S S= + [1]
( )total fore aft
W WWS S S S= =
+ [2]
Page 10 of 46

Optoprime Conceptual Designs, LLC. Conceptual Design Review To alleviate this, Optoprime eliminated the horizontal tail and, instead, modeled the two lifting surfaces as a main wing and canard. In this scenario, a similar problem occurred and FLOPS doubled the induced drag and refused to distribute the wingloading to the canard. After consultation, the team decided to model the airplane as a single surface airplane with a very large reference area and manually included a factor to reduce the induced drag created by winglets with a joined wing. This iteration was successful. We forwarded the output from the weights module to the Weight & Balance group to aid in their analysis. Table 3, below, summarizes key metrics from the FLOPS analysis.
Table 3: Important Aircraft Sizing Outputs
Operating Empty Weight 37,500Takeoff Gross Weight 70,700L/D (cruise) 17Mission Fuel Fraction 21.90%
FLOPS Output
Carpet Plots To understand the region of T/W & W/S that we are operating within, our team used graphically plotted T/W & W/S and analyzed the resulting change in the Takeoff Gross Weight of the OP-5-9-08. Figure 4 shows the carpet plot.
T/W = 0.3
T/W= 0.35
W/S = 90 [lb/ft2]
W/S = 100 [lb/ft2]
W/S = 110 [lb/ft2]
Constant Rate Turn TOC
Constant Rate Turn Cruise
Takeoff Distance
T/W= 0.4
W/S = 120 [lb/ft2]
68000
68500
69000
69500
70000
70500
71000
71500
72000
72500
73000
W0
[lb]
Figure 4: Carpet Plot Trade Study of T/W and W/S
Page 11 of 46

Optoprime Conceptual Designs, LLC. Conceptual Design Review We showed, through our constraint analysis, that takeoff distance, constant rate turn at top of climb, and constant rate turn during cruise were the three constraining factors of the aircraft. Our design point is T/W = .35 and W/S = 100 psf. Our carpet plot shows that we could increase the wingloading or decrease the thrust to weight ratio to move closer to our constraints. We did not decide to change these parameters because that would require us to run our sizing again and the current design has advanced too far for that drastic of a change. AIRCRAFT DESCRIPTION Aircraft Three View Figure 5 shows the overall aircraft dimensions. Also included are the angle of rotation that can be achieved during takeoff and the tip-over angle that would cause a wing strike.
81’
125’
33’ 24.8º 15º
Figure 5: Aircraft Three- View
The angle of rotation during takeoff is important because the airplane must be able to rotate to the appropriate angle of attack to achieve enough lift to takeoff. Note that due to modeling limitations, the modeled angle is slightly less than 15º but we believe that manufacturing methods with the composite fuselage will allow for the angle to be 15º. The tip-over angle is important for multiple reasons. First, the airplane must not tip over while taxiing. This will be discussed further in the landing gear section. Additionally, the aircraft has to be able to land in a cross-wind without the wing striking the ground. Due to our taller landing gear, dihedral angle, and winglets only on the upper surface of the wing, the aircraft can roll to 24.8º with the wheels on the ground before a wing strike occurs. As discussed in the landing gear section, this angle is less than the tip-over angle from a center of gravity shift.
Page 12 of 46

Optoprime Conceptual Designs, LLC. Conceptual Design Review
Fuselage The initial concept was for our aircraft to carry 100 passengers in a single class. Trying to maximize passenger comfort, while still allowing for enough cargo room and keeping a low cross-sectional area were the main goals. The seating arrangement that best met these goals was a “2-aisle-2” arrangement. The size of the seats and seat pitch would be comparable to a business class or lower-first class. Table 4 shows the actual seat size and dimensions. The larger seats will provide the passenger with more comfort and raise their confidence in our aircraft. We believe that larger seats will bring more passengers and more interest to our aircraft.
Table 4: Seat Dimensions1
First Class Optoprime EconomySeat width 18.5 - 21 20 16.5 Arm rest 2.75 2.5 2 Height off ground 7.75 8.5 8.5 Seat Pitch 38 36 30 Overall Height 42 41 39 Two seats 47 43 39
The fuselage itself will be built in sections. This allows the airline to order aircraft with more seating by inserting more passenger sections and making the overall fuselage longer. Necessary fiber-optical wiring and other components would be included in each section. The initial length of the passenger section would be 100 ft. The overall length would be 125 ft. Figure 6 shows the passenger layout. Table 5 shows the overall dimensions.
Figure 6: Fuselage Layout
Table 5: Fuselage Dimensions Outer Diameter 63 in Inner Diameter 61.5 in Length 125ft Passenger Volume (approx.) 4750ft^3 Cargo Volume (approx.) 2100ft^3 Volume per PAX (approx.) 35 ft^3
The cross-section is still small to avoid excess form drag. Also, the slowly curving perimeter will help to avoid separation of the boundary layer. The diameter of the passenger section is 5.25ft. The height of the passenger section from the floor to the ceiling is 7.25 ft and the overhead bins are 5 ft from the floor. Additionally, the aisle width is 2.5 ft to allow for easy passage. Finally, large overhead bins allow for more carry-on storage. Figure 7 shows the section.
Page 13 of 46

Optoprime Conceptual Designs, LLC. Conceptual Design Review
Figure 7: Section View The fuselage is designed for a large cargo area under the passenger cabin. To allow for more room, the shape of the fuselage is not completely circular. Figure 8 shows the resulting section.
Figure 8: Section Cross-Section View
The layout also features 3 lavatories and a galley. The industry standard for an aircraft of this size is 2 lavatories and no galley. The layout also includes the possibility of an aft door that would contain stairs if the aircraft where to land at an airport/runway without a jet-way. For cargo loading, the large front section could be made into a 10 ft wide cargo door. Another possibility would be to allow the entire nose cone to hinge open (similar to a Boeing 747). Since there is no flight deck, it would be relatively easy to create.
Page 14 of 46

Optoprime Conceptual Designs, LLC. Conceptual Design Review
DESIGN TRADE-OFFS Cargo Carrier Function In addition to be used as a passenger aircraft, we considered the option of a conversion to a freighter (Combi), as described in use case two. We will determine whether this conversion is completed only at night during low passenger volume or a full freighter conversion after further analysis. This includes the use of a nose that could open completely for easy loading of shipping containers, as described above. In a conversion design, the floor would be reinforced to carry a cargo load, while the seats and overhead bins would be easily removable. We investigated current air freight container dimensions and current aircraft using the IBA Freight Services website2 and determined that with the seats and overhead bins removed, the following containers can fit in our current design:
Table 6: Air Freight Containers the Fit in our Current Design Air Freight Container Currently Suitable For: LD-1 B747, B767, B777, MD-11 LD-2 B7673
LD-3 (and LD-3 Insulated) A300, A310, A330, A340, B747, B767, B777, DC-10, MD-11, L1011
LD-9 A300, A310, A330, A340, B747, B767, DC-10, MD-11, L1011
LD-11 A300, A310, A330, A340, B747, B777, DC-10, MD-11, L1011
88” Pallet B747, B767, B777, DC-10 96” Pallet A300, A310, A330, A340, B747, B767,
B777, DC-10, MD-11, L1011 LD-26 B747, B777, DC-10 LD-29 B747
By being able to use existing-sized cargo containers, our aircraft will be able to be used in combination with older aircraft (today’s current models). This is especially true as aircraft entering service today will most likely be in service, at least as converted freighters, when our aircraft enters the market in 30 years. Shown below in Figure 9 are the LD-1 (left) and LD-3 (right) containers in our fuselage. We showed them inverted as well to show that if the containers were able to be inverted, they could still fit.
Figure 9: Current Cargo Containers in our Fuselage
Yet another possibility for using our aircraft as a cargo transport is the fact that if the radius was increased by only 9 inches, we could carry an LD-8 shipping container, which
Page 15 of 46

Optoprime Conceptual Designs, LLC. Conceptual Design Review is equivalent to two LD-2s back to back. This is similar to the container used by Alaska Airlines on their 737-400 combination aircraft4. Finally, the option exists to design a new cargo container specifically for our aircraft. While this is a possibility, we’ve decided to ensure that existing containers can fit as well to continue to minimize the dependency on ground crew and fleet specialization. AERODYNAMICS Airfoil The airfoil we chose was a NASA SC (2) – 0612 supercritical airfoil. We chose a supercritical airfoil because they are designed to operate at the transonic speeds, which is where our aircraft will spend the majority of its cruise time. Figure 10 shows the airfoil geometry.
Figure 10: NASA SC (2) - 0612 Super Critical Airfoil Geometry We chose the airfoil cross section to ensure that 75,000 lbs of lift was generated in 3 dimensions. Using the lift equation seen below, the 3D CL required was 0.43. [3] L = qSCL Then using Equation [4] below, we found the 2-D Cl that is used to determine our airfoil. The Cl required was 0.55. 0.250.9 cosL lC C c= Λ [4] We found the Cl vs. α curve using the Potential Flow Simulator in MATLAB® using the data from the UIUC Airfoil Database.5 Figure 11 below shows the airfoil has a Cl of 0.55 at α = 0.5 degrees.
Page 16 of 46

Optoprime Conceptual Designs, LLC. Conceptual Design Review
Figure 11: Cl vs Alpha for NASA SC (2) - 0612
Using the data collected from the Potential Flow Simulator and Excel we plotted the lift curve. Next, we analyzed a NACA 0612 airfoil using Xfoil at similar a similar Reynolds Number. We plotted the data from the NACA 0612 airfoil with the NASA SC (2)-0612 airfoil and found the Clmax. Figure 12 shows these curves plotted together.
Cl vs. Alpha
-1
-0.5
0
0.5
1
1.5
2
2.5
3
-10 -5 0 5 10 15 20 25
Alpha (deg)
Cl
Naca 0612
NASA SC 0612
Shifted NACA
Figure 12: Cl vs Alpha for NACA 0612 and NASA SC (2)-0612
Page 17 of 46

Optoprime Conceptual Designs, LLC. Conceptual Design Review Figure 12 shows that the NACA 0612 airfoil and the NASA SC (2)-0612 airfoil have similar slopes. Using the figure, we estimated the NASA SC (2)-0612 airfoil to have a clean CLmax = 1.7 and a Clmax = 2.2. High Lift Devices As part of the project requirements the aircraft had to take off within 3000 ft. We used Equation [5] from Raymer6 Chapter 5 to determine the CL required for Take off. We determined TOP from Figure 5.4 of Raymer Chapter 5.
( )TOL
W TOP CS W
σ⎛ ⎞ ⎛ ⎞=⎜ ⎟ ⎜ ⎟⎝ ⎠ ⎝ ⎠
T [5]
The required CL for a Balanced Field Length of 2500 ft. is 4.55. Examining today’s heavy lift aircraft such as the Lockheed C-5 Galaxy, with a CL of 3.8, we believe our maximum lift coefficient is attainable. The C-5 has a clean CLmax of 1.4, while we have a CLmax of 1.7. Scaling the CLmax with high lift devices the same amount as the clean configuration, we achieve a CLmax with High Lift Devices of 4.7. We used the equations from Raymer Chapter 12 and got varying ΔCL for Triple Slotted flaps, and slats. We used Equations [6] and [7], where c’ is the chord length when flaps or slats are deployed, and c is the normal chord. Triple Slotted Flaps:
'1.9 1.9*1.3 2.47lcCc
Δ = = = [6]
Slat:
'0.4 .4*1.1 .44lcCc
Δ = = = [7]
We converted the Cl to CL using Equation [4]. The aircraft, with 30% of the lower wing flapped and 70% with slats, can get a CLmax of 3.65. Then applying a technology factor along with the addition the joined wing configuration of 30%, the CLmax could be 4.74. Either determination of theoretical CLmax is enough to obtain our takeoff CL. Figure 13 shows a similar slats and flaps configuration. However since our aircraft uses composites and a joined wing design, our aircraft reduces the support structures found in the picture. This will decrease our drag and improve lift.
Page 18 of 46

Optoprime Conceptual Designs, LLC. Conceptual Design Review
Figure 13: Flaps and Slats Configuration7
0DC We created our drag estimates using Raymer again. We used the component build up in Chapter 12. We estimated the areas of each part of the aircraft from our CATIA model. We used the component build up equation, Equation [8] to get an estimate of
0DC . The resulting
0DC s for each part are seen in
0
c cf c c wetD
ref
C FF Q SC
S= ∑ [8]
Table 7:
0DC Breakdown
Swet CD0 fuse 3482.1 0.01379nose 300 0.001188wing 2471 0.009786engine 1428 0.005655 Total 0.03042
The total drag is a combination of:
0DC , iDC , and
wDC . The total Drag build-up is located in Table 8.
Table 8: Complete Drag Build up 0.04210.015
0.0028Total 0.0599
0DCiDCwDC
Page 19 of 46

Optoprime Conceptual Designs, LLC. Conceptual Design Review
Drag Polar We created the drag polar plots from the drag build-ups and other estimated drags in Raymer Chapter 12. Figure 14 shows the different drag polar plots for various configurations, Clean Cruise, Takeoff, and Landing.
0 0.2 0.4 0.6 0.8 1 1.2 1.40
0.5
1
1.5
2
2.5
3Drag Polar
CD
CL
Clean ConfigurationTakeoff ConfigurationLanding Configuration
Figure 14: Drag Polar
Drawing a tangent line to the drag polar curve, we find that the L/Dmax is 12. The L/Dcruise required for our A/C is 17. The error comes from the MATLAB® estimates of the drag. We will only be able to do more detailed analysis with highly advanced CFD codes. Aerodynamics Conclusion Note that these values are estimates. Any drag predictions are rough estimates and can be refined further using Fluent or another CFD program. For the scope of this project, with considerations for time, these rough estimates are sufficient. Also, more analysis is needed to determine the optimum twist of the wings to minimize the downwash on the aft wing. Another concern that would be addressed with further analysis is refining the airfoil shape along the span of the wing to optimize the lift generated near the tips and to further reduce the induced drag. PERFORMANCE Flight Envelope As described by Raymer, the absolute ceiling was calculated for a specific excess power of 0 ft/min while the service ceiling was calculated for a specific excess power of 500 ft/min. This excess power allows especially for any unexpected climbs or altitude changes. The flight envelope was calculated using Equation [3] shown below.
Page 20 of 46

Optoprime Conceptual Designs, LLC. Conceptual Design Review
0 2Ds
qCTP V nWW qS
K WS
⎡ ⎤⎢ ⎥= − −⎢ ⎥⎣ ⎦
[3]
where 1
ReK Aπ= , W = MTOW, and n = 1 to represent steady level flight. The resulting
flight envelope is shown below in Figure 15 where the green line represents Vmax at each altitude. This condition was modeled for when the thrust available equaled drag.
100 200 300 400 500 600 7000
0.5
1
1.5
2
2.5
3
3.5
4
4.5
5x 10
4
Velocity (ft/sec)
Alti
tude
(ft)
Flight Envelope
Absolute Ceiling (Ps = 0 ft/min)Service Ceiling (Ps = 500 ft/min)V__max
Figure 15: Flight Envelope
V-n Diagram The V-n diagram provides us with important information about the characteristics of our aircraft. We decided that our aircraft should be able to withstand a positive load of 3.75 times the force of gravity and a negative load of -1.5 times the force of gravity. These values are based on the high end of current values used for passenger transports. Figure 16 shows the V-n diagram for our aircraft. We plotted the positive and negative stall limits by using the standard lift equation and setting lift equal to weight. We plotted these curves to the positive and negative load limits. We plotted the load limits to the maximum velocity of 707 ft/s which we took from the flight envelope. Typically, a V-n diagram has the upper and lower right corners of the plot cut-off due to some external factor. These factors can be due to a cap on engine inlet temperature, reaching the critical Mach number for the aircraft, etc. We did not have any factor in our design which would decrease the magnitude of our load limit at these two points in this stage of our design.
Page 21 of 46

Optoprime Conceptual Designs, LLC. Conceptual Design Review
V-n Diagram
-2
-1
0
1
2
3
4
5
0 200 400 600 800
Velocity (ft/s)
Load
Fac
tor,
n Positive Stall Limit
Maximum Velocity
Positive Structural Limit
Negative Stall Limit
Negative Structural Limit
Figure 16: V-n Diagram
Important Performance Specifications Table 9 shows the important performance values for our aircraft. We calculated the best range and best endurance values using the Breguet Range and Breguet Endurance equations. It is of note that our best range is greater than our threshold value of 2000 nm. We took the stall speed from the V-n diagram at the point where the +1 g load limit line intersects the positive stall limit line. The approach speed then is 20% higher than the stall speed. We based the takeoff distance on our aerodynamic analysis using our maximum coefficient of lift.
Table 9: Important Performance Values Value Unit Best Range 2200 nm Best Endurance 4 hrs Stall Speed 123 ft/s Approach Speed 148 ft/s Takeoff Speed 127 ft/s Takeoff Distance 2500 ft Cruise Speed 0.78 Mach Maximum Speed 707 ft/s
WEIGHT AND BALANCE Component Weights To best estimate the weights of each of the major components, we decided to use a combination of estimation methods from books by Raymer6 and Roskam8, as well as the FLOPS9 code. While technology factors were already incorporated into the FLOPS estimator from previous sizing runs, the same factors were applied to the estimates
Page 22 of 46

Optoprime Conceptual Designs, LLC. Conceptual Design Review calculated from equations in Chapter 15 of Raymer’s textbook, and the component weights book by Roskam. These factors included weight savings from the material selections as well as other considerations such as structural weight savings from the joined wing configuration. The resulting estimates are shown below in Table 10.
Table 10: Component Weight Estimates
Component FLOPS Raymer Roskam Corrected Weight
Fuselage 5847 8628 3400 4900
Forward Wing 5200 4800 3200 3600
Aft Wing 1063 1500 900 1100 Vertical Tail 1500 700 300 700
Engine / Nacelle 4862 5500 2600 4200 Fuel System (Including Plumbing) 1500 800 3600 1700
Landing Gear 2300 500 2200 1600 Luggage 4000
APU 150 Battery 1500
Furnishings, Seats, Other Misc. 1000 CG Range Once the estimated component weights were calculated, the center of gravity of the aircraft could be determined with a simple point-mass estimation technique. We used the model in CATIA V5 to determine each component’s center of gravity, and then combined all of the major components into an estimate for the location of the center of gravity for the aircraft. This is shown below in Figure 17 with both the most forward and aft center of gravity locations shown.
Page 23 of 46

Optoprime Conceptual Designs, LLC. Conceptual Design Review
Figure 17: Component Centers of Gravity
Next, we varied the component weights of certain components such as passengers and fuel to simulate various configurations. Some of these configurations included Manufacturer’s Empty Weight (MEW) and Maximum Takeoff Weight (MTOW). As expected, the aircraft center of gravity moved for the various configurations. This range is shown below in Figure 18. The resulting most forward location of the aircraft center of gravity was 65.3 ft from the nose while the most aft position was 70.9 ft. These configurations include both ground and in-flight configurations.
62 64 66 68 70 72 741
2
3
4
5
6
7
8
9
10x 104 C.G. Travel Diagram
C.G. Position From Nose (ft)
Airc
raft
Wei
ght (
lbs)
Manufacturer’s Empty Weight (MEW): 35,500 lbs (add trapped fuel and oil)
Max Zero Fuel Weight (MZFW): 60,000 lbs (add crew)
Max Takeoff Weight (MTOW): 70,700 lbs (add max fuel)
Max Flight Weight (MFW): 65,1000 lbs (add PAX, cargo, and fuel reserves)
Operating Empty Weight: 36,000 lbs
No PAX, 100% Fuel: 46,700 lbs
No PAX, 25% fuel: 40,000 lbs
Figure 18: CG Travel Diagram
Page 24 of 46

Optoprime Conceptual Designs, LLC. Conceptual Design Review
Fuel The fuel that is to power the aircraft is a synthetic fuel. It is synthesized through the Fischer-Tropsch process which is a process used to extract the hydrogen, carbon, and oxygen needed to produce hydrocarbon fuels from other sources. The extracted materials are then combined to produce liquid hydrocarbon fuels. To address environmental issues we will use a new process called Green Freedom which has been developed by Los Alamos Laboratories.10 This process uses the fact that the only emission from nuclear power plants is steam. Water can be extracted from the steam and carbon dioxide can be extracted from the air and the water and carbon dioxide are then dissociated into their individual elements. These elements are then used as the building blocks to make liquid hydrocarbon fuels using the Fischer-Tropsch process. A fuel can be produced that has characteristics that are very similar to those of Jet-A fuel. This means that a fuel can be synthesized with negligible performance losses compared to Jet-A fuel. The synthesized fuel will have a weight and heating value similar to that of Jet-A fuel. However, the opportunity does exist to tailor the fuel to our use. Although Optoprime does not anticipate being directly involved in chemical fuel engineering, we will work closely with Los Alamos National Labs and industry partners to develop a fuel with high energy densities and heating values that are able to withstand our flight conditions. The fuel, synthesized by the combination of the Fischer-Tropsch process and the Green Freedom process, is a carbon neutral fuel. Burning the fuel does produce carbon dioxide as a by-product but the carbon that is produced due to burning equals the amount of carbon that was used to synthesize the fuel. Since the carbon used by the Fischer-Tropsch process to make the fuel was extracted from the air using the Green Freedom process, no additional carbon emissions are put into the atmosphere when the fuel is burned. Also the power used to make the fuel comes from the nuclear power-plant; therefore the fuel is virtually free of harmful emissions.10 Power Plant The engine used to power the aircraft is an Ultra High Bypass Propfan11 engine shown below in Figure 19. The reason for this choice of engine is because of its high efficiency and thrust capabilities. Compared to traditional turbofan engines currently used to power aircraft, the Ultra High Bypass Propfan engine can achieve thirty to forty percent lower specific fuel consumption than a traditional turbofan.12 The propfan engine suffers negligible losses in power with this increased efficiency. It can still achieve speeds comparable to turbofans. The top speed of the engine can be increased by using variable pitch external rotor blades. This allows the flow over the external rotors to be controlled to maximize flow velocity.
Page 25 of 46

Optoprime Conceptual Designs, LLC. Conceptual Design Review
Figure 19: Ultra High Bypass Propfan13
One of the considerations that have to be accounted for is the large volume of noise produced by the open rotor of the engine. The use of composites in the construction of the aircraft fuselage will help to dampen the noise transmitted into the cabin. The location of the engines will also help to minimize the amount of noise transmitted to the cabin. The open rotor of the engine is positioned towards the aft portion of the fuselage. This will allow a large portion of the noise to be transmitted into the atmosphere behind the aircraft instead of into the cabin. The combination of composite materials and engine location will reduce the level of cabin noise from the open rotors of the engine. The noise produced by Ultra High Bypass Propfan engines currently exceeds the United States limit for a Stage IV engine of 106 dB26. In the last twenty years the noise produced by Ultra High Bypass Propfans has been reduced by 10 dB25. As Figure 20 shows, if this trend continues over the next fifty years the noise produced by an engine of this type will be below the United States limit.
Page 26 of 46

Optoprime Conceptual Designs, LLC. Conceptual Design Review
Noise Level
90
95
100
105
110
115
120
125
130
135
140
1988 1998 2008 2018 2028 2038 2048 2058
Year
Noi
se L
evel
(dB
)
Bottom of NoiseLevel Range
Top of NoiseLevel Range
Figure 20: Predicted Noise Reduction Plot24
Although the FAA does not regulate specifically against rotor-burst, Optoprime Conceptual Designs takes the safety of its passengers extremely seriously. With an open rotor design, special consideration must be given to the chance of a rotor-burst. With the engines located aft of the fuselage, if a blade-out occurs the blade will be ejected behind the aircraft. This eliminates the possibility that a blade enters into the fuselage causing direct injuries. The engine that will be used will have a counter-rotating open rotor configuration. The efficiency of the engine is increased by an additional six to ten percent when compared to a single rotor configuration.10 The dual rotor configuration also increases the reverse thrust capability up to sixty percent of that of the takeoff thrust.10 The traditional combustion chamber will also be replaced by a Wave Rotor Combustion System. Wave Rotor Combustion A trade study on the wave rotor constant volume combustion (CVC) concept revealed several advantages that can be incorporated by our team into the propulsion concept. In a conventional gas turbine engine combustor, the combustion takes place at essentially constant pressure while the temperature rises. However, according to Won and Waters14 the CVC creates a pressure rise in addition to the temperature rise, which results in the potential for greater work extraction by the turbine or higher pressure available at the exhaust nozzle to produce thrust. Figure 21 shows an exploded view of the CVC concept.
Page 27 of 46

Optoprime Conceptual Designs, LLC. Conceptual Design Review
Figure 21: CVC Exploded View
To obtain constant volume combustion, a rotor with many individual chambers is used. The rotor revolves while the two endplates remain stationary. In the figure above, air flows from left to right and the rotor is shown in blue. Air and fuel fill a chamber and is compressed by the upstream flow as it passes by an opening in the inlet endplate. As the rotor revolves, the chamber passes the opening and is then a sealed container. The air-fuel mixture is then ignited, and the combustion increases the pressure and temperature in the chamber. As the rotor then rotates past an opening in the exit endplate, the combusted gas exhausts out of the chamber. A large advantage of combusting at constant volume is decreased SFC. In a simulation run by Won and Waters where a CVC was theoretically used aboard a 50 passenger Embraer CRJ-145 powered by twin Rolls-Royce AE3007 high bypass turbofan engines for an 800 nm mission, a 10% benefit in mission fuel burn is seen which in turn drives a 3% reduction in DOC.14 This not only would benefit the customer, but also benefit the environment by reducing the NOx and CO2 emissions from the lower fuel burn. Another advantage of using CVC is its impact on the compression system. By allowing a pressure rise in the combustor, less compression can be required out of the compressor. This could mean less complexity and fewer stages, which means a lower weight and less maintenance. The engine specifications were calculated using the upper limit of the projected improvement percentages under the assumption that by 2058 the improvement in engine efficiency will be such that it approaches the maximum projected improvements. Then engines of similar size as ours were used to find the specifications of an average engine today. The projected percentage improvement in performance was then applied to these values. Using this method of calculation, the engine specifications were determined to be as follows:
Table 11: Engine Specifications
T/O Thrust (lb) T/O SFC (lb/hr/lb) Bypass Ratio Pressure Ratio
Engine Weight (lb)
13212 0.20 35 30 2144
Page 28 of 46

Optoprime Conceptual Designs, LLC. Conceptual Design Review The following plots show the technology factor used to calculate the SFC and the specifications of the engine designed for our aircraft compared to those of present day traditional turbofan engines of similar size to the engine designed for our aircraft.
Technology Factor
0
0.1
0.2
0.3
0.4
0.5
0.6
0.7
2008 2013 2018 2023 2028 2033 2038 2043 2048 2053 2058
Year
SFC
Max SFC (Takeoff) Comparison
0
0.1
0.2
0.3
0.4
0.5
0.6
0.7
0.8
Engine TypeSF
C
CF34-8ClSpey Mk 250Tay 611Our Engine
Pressure Ratio Comparison
0
5
10
15
20
25
30
35
Engine Type
Pres
sure
Rat
io V
alue
CF34-8ClSpey Mk 250Tay 611Our Engine
Bypass Ratio Comparison
0
5
10
15
20
25
30
35
40
Engine Type
Byp
ass
Rat
io CF34-8ClSpey Mk 250Tay 611Our Engine
Figure 22: Engine Comparison
Solar Energy The power that is diverted from the engine to supply the cabin and cockpit with electricity decreases the power supplied to propel the aircraft forward. To eliminate the need to divert power from the engine, the cabin and cockpit energy needs will be powered largely by solar power. This will eliminate the need to carry extra fuel to help power the avionics and environmental control systems of the aircraft. The sun supplies an unlimited supply of power with no harmful emissions. Since no extra fuel is needed to power the electrical needs of the aircraft, the operating cost of the aircraft will be decreased compared to an aircraft without solar power. This will also allow the aircraft to fly a longer distance on the same amount of fuel. In 50 years, we are convinced that solar cell technology will become more efficient. Currently, Toyota, the Internation Air Transport Association (IATA) and the European Commision are all supporting ongoing research on the Solar Impulse, a solar-powered airplane.15
Page 29 of 46

Optoprime Conceptual Designs, LLC. Conceptual Design Review
Engine Design To summarize our propulsion concept, the design consists of an Ultra High Bypass Propfan engine to increase the fuel efficiency of the engine. This engine will have a counter-rotating blade configuration to help further increase the efficiency of the engine. The combustion chamber will be the Wave Rotor combustion system. The fuel that the engine will use will be a fuel synthesized by the Fischer-Tropsch type process. The materials needed to make the fuel by this process will be obtained by the Green Freedom process to make the fuel carbon neutral. To further increase the efficiency of the engine, solar power will provide much of the power needed for the electrical system of the aircraft. STRUCTURAL ANALYSIS Fuselage Structure
Figure 23: "OP 5-9-08" Aircraft Fuselage Cross-Section
Our aircraft utilizes load paths to transfer the loads experienced during flight to the carry through box. We use the wing box carry through as our main load path which is standard for high-speed transports and general-aviation aircraft. The box carry through simply continues the wing box through the fuselage. The fuselage itself is not subjected to any of the bending moment of the wing, which minimizes fuselage weight. The purpose of longerons is to prevent the fuselage from bending. Our analysis showed that we need only four longerons as our main structural support for the fuselage. Two of them are just below the cabin floor and two are tucked away behind the overhead storage bins. Composite skins are able to carry much of the loads and stresses requiring less additional structure. The use of composites allows for a reduction of weight while
Page 30 of 46

Optoprime Conceptual Designs, LLC. Conceptual Design Review maintaining high strength in the structure. More details regarding the composite skin will be discussed later in the “material selection” section. We have decided to use I-beams for the longerons which are bonded to the composite skin. Please refer to Figure 23 for more details regarding the longerons’ position in the fuselage. At this design phase there are many questions such as skin thickness, longeron size, vibrations, and loads which need further consideration. Our lower longerons are high enough that they pass over the wing carry through box and they run the length of the fuselage without cutouts. The upper longerons also run the length of the fuselage with no cutouts since the aft wing carry through is at the rear of the plane. We decided to use longerons instead of stringers because the composite material that we used for the longerons are a lot stronger than the aluminum that is currently used. Figure 23 also shows that the main landing gear attach to the main fuselage structure. This is a simplified representation as we know that the interaction will be much more complicated. More detail regarding the landing gear is discussed in the “landing gear” section. Wing Structure
Figure 24: "OP 5-9-08" Aircraft Wings Structure Layout
From the aerodynamic analysis, the total lift generated by the forward and aft wing is about 71,000 lbs. Based on our V-n diagram, our limit load factor is 3.75 and our aircraft structure is sized for an ultimate load factor which is 1.5 times the limit load factor. This was done to increase survivability of the aircraft in a worst case scenario. Based on this
Page 31 of 46
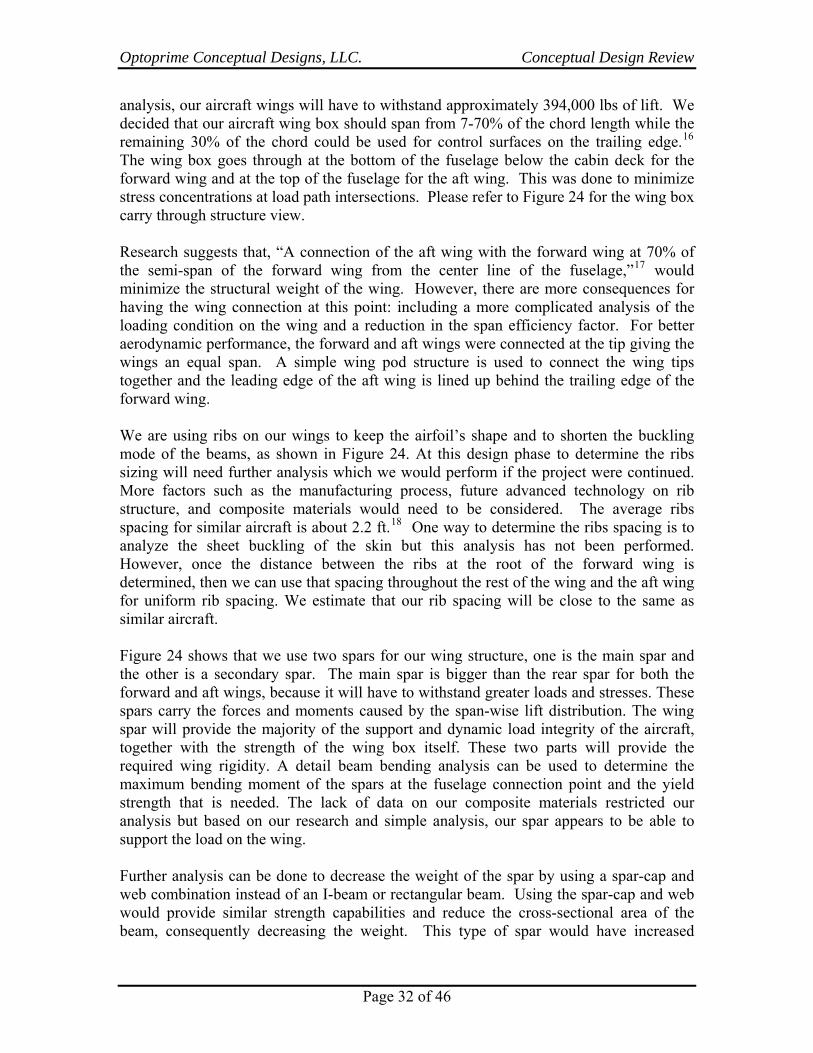
Optoprime Conceptual Designs, LLC. Conceptual Design Review analysis, our aircraft wings will have to withstand approximately 394,000 lbs of lift. We decided that our aircraft wing box should span from 7-70% of the chord length while the remaining 30% of the chord could be used for control surfaces on the trailing edge.16 The wing box goes through at the bottom of the fuselage below the cabin deck for the forward wing and at the top of the fuselage for the aft wing. This was done to minimize stress concentrations at load path intersections. Please refer to Figure 24 for the wing box carry through structure view. Research suggests that, “A connection of the aft wing with the forward wing at 70% of the semi-span of the forward wing from the center line of the fuselage,”17 would minimize the structural weight of the wing. However, there are more consequences for having the wing connection at this point: including a more complicated analysis of the loading condition on the wing and a reduction in the span efficiency factor. For better aerodynamic performance, the forward and aft wings were connected at the tip giving the wings an equal span. A simple wing pod structure is used to connect the wing tips together and the leading edge of the aft wing is lined up behind the trailing edge of the forward wing. We are using ribs on our wings to keep the airfoil’s shape and to shorten the buckling mode of the beams, as shown in Figure 24. At this design phase to determine the ribs sizing will need further analysis which we would perform if the project were continued. More factors such as the manufacturing process, future advanced technology on rib structure, and composite materials would need to be considered. The average ribs spacing for similar aircraft is about 2.2 ft.18 One way to determine the ribs spacing is to analyze the sheet buckling of the skin but this analysis has not been performed. However, once the distance between the ribs at the root of the forward wing is determined, then we can use that spacing throughout the rest of the wing and the aft wing for uniform rib spacing. We estimate that our rib spacing will be close to the same as similar aircraft. Figure 24 shows that we use two spars for our wing structure, one is the main spar and the other is a secondary spar. The main spar is bigger than the rear spar for both the forward and aft wings, because it will have to withstand greater loads and stresses. These spars carry the forces and moments caused by the span-wise lift distribution. The wing spar will provide the majority of the support and dynamic load integrity of the aircraft, together with the strength of the wing box itself. These two parts will provide the required wing rigidity. A detail beam bending analysis can be used to determine the maximum bending moment of the spars at the fuselage connection point and the yield strength that is needed. The lack of data on our composite materials restricted our analysis but based on our research and simple analysis, our spar appears to be able to support the load on the wing. Further analysis can be done to decrease the weight of the spar by using a spar-cap and web combination instead of an I-beam or rectangular beam. Using the spar-cap and web would provide similar strength capabilities and reduce the cross-sectional area of the beam, consequently decreasing the weight. This type of spar would have increased
Page 32 of 46

Optoprime Conceptual Designs, LLC. Conceptual Design Review manufacturing time and cost due to the need to drill and fasten rivets. There is the possibility than in 30 years, rivets would be a thing of the past. The large number of holes would also introduce stress concentrations, requiring the components of the spar to be thicker. So, we decided to use the I-beam cross-section. This will allow for simple production and manufacturing. An I-beam is extruded and milled down to the desired dimensions. The milling will also enable cutouts in the spar web to be surrounded by regions of increased thickness to reduce stress concentrations. We are using composite material for our spar structure so there is a good potential to reduce the spar thickness and weight as the composite material is a lot stronger and lighter than aluminum. More detail regarding the spar’s composite makeup will be discussed in the “material selection” section. To summarize, there are still many aspects and factors that we need to consider when designing the structure part in the wings. We are designing an aircraft 50 years in the future which is not easy to analyze because the advanced technology information that we have at this design stage is not sufficient. Moreover, the technology itself keeps evolving so more considerations are needed when conducting detailed analysis. Based on the wing and fuselage structural analysis, we believe that our aircraft will not present any significant structural problems. Material Selection The material selection is a very important part of the structural design process. Proper material selections can reduce the weight and increase the safety of our aircraft. The critical sections that we need to seriously consider are the fuselage and wings skins, landing gear, ribs, spars, longerons and stringers. For the internal wing box and ribs, we choose Carbon Fiber Reinforced Plastic (CFRP) as the main composite material. Based on our research, CFRP is already in consideration for the future composite material in making ribs. This is because CFRP is very strong, lighter and more durable compared to aluminum. CFRP has a higher crack and fracture resistance than aluminum which will reduce the maintenance costs. We also decided to use CFRP as our spar’s main composite material for the same reasons. Furthermore, using the same composite for both spar and rib can make the manufacturing and production for the wing structure less complicated. The landing gear must support the entire weight of the aircraft in addition to stresses from landing, which is one of the reasons that we decided to use titanium alloy for our landing gear material. Most of commercial aircraft in the market use 300M steel for their landing gear but in recent years, using titanium alloy has proved to be a better choice. Research shows that even though titanium alloy is more expensive it has higher corrosion resistance and component reliability than steel. This can lead in reducing the maintenance costs and time, which was one of our design criteria. Moreover, titanium alloy has already been used on the Airbus A380 landing gear and proven to have better performance compared to steel. We believe that in the future, titanium alloy will be the main material for landing gear and replace steel completely.
Page 33 of 46

Optoprime Conceptual Designs, LLC. Conceptual Design Review Central Reinforced Aluminum (CentrAL) was selected as the main composite material for the wings and fuselage skins. We chose CentrAL to reduce the weight and increase the strength of the skin. By using CentrAL as the wing skins, the weight could be reduced by 20% compared to a CFRP wing construction which was recently applied to the wings of the Boeing 787. Application of CentrAL for the skins will also enable simpler repairs when compared to aluminum. Studies on CentrAL are still in early stages but we believe that CentrAL will be the main composite material for aircraft skins in the next 30 years. Table 12 summarizes the materials used to construct each section of the aircraft.
Table 12: Material Selection for Critical Sections
SECTION MATERIAL RIBS Carbon Fiber Reinforced Plastic (CFRP)
STRINGERS/LONGERONS Carbon Fiber Reinforced Plastic (CFRP)
WING SPARS Carbon Fiber Reinforced Plastic (CFRP) WING/FUSELAGE SKINS Central Reinforced Aluminum (CentrAL)
LANDING GEAR Titanium Alloy
Engine Mounting We chose to incorporate our engines into the aft wing. We believe that we would benefit from a large drag reduction by removing the full nacelles. By incorporating the engines into the wing, the cross section of the nacelle that impedes on the flow causing profile drag is essentially only the area above and below the wing. The rest of the nacelle cross section would interfere no more than the wing cross-section, itself. This idea is shown below in Figure 25.
Engine Imbedded in Wing
Engine Below Wing
Figure 25: Aerodynamic Advantage of Imbedded Engine We also considered how to mount the engines in this configuration while still allowing for easy maintenance and removal. We decided to create a unique spar shape to mount the engine to, with removable spar sections for easy removal. Similar to the access doors on the bottom of current nacelles, we would also include access doors on the under side of the wing for the engines. Shown below in Figure 26 is a concept of this mounting system. The lower joint can be easily unbolted to allow for the engine to be lowered from the upper spar.
Page 34 of 46

Optoprime Conceptual Designs, LLC. Conceptual Design Review
Figure 26: Engine Mounting Concept
While this adds complexity to the design, we believe that the savings in drag will outweigh the disadvantages of a complex system. We have still focused on allowing for fast and easy access to the engines to minimize the negative impacts of the additional parts. We also believe we will be able to create a spar of this unique shape with the advanced materials and manufacturing methods that we have chosen to use and believe that the new materials will allow for this design. Landing Gear Placement Landing gear placement is an important feature of our airplane design that can be easily overlooked. The placement of the landing gear has an impact on stability, structures, ground control, takeoff, and landing. These are all things that we took into consideration when deciding the position of the landing gear. From a stability standpoint, the placement of the gear affects our center of gravity and thus the static margin of the airplane. The landing gear are primarily made from steel or titanium which has a higher density than the majority of airplane structures such as aluminum or composites. Therefore a small volume can have a large weight relative to a similar volume of the fuselage or wing structure. It is also necessary to “beef up” the structure near the gear location to handle the higher stresses. We dealt with these factors during stability analysis and gear placement. The landing gear introduces a large stress to the airplanes structure where they are attached. When our aircraft is sitting on the ground the entire weight of the plane is supported by the gear instead of the wing as during flight. This means that the interface between the gear and the plane must be strong enough to resist these forces. The main gear should support between 80-90 % of the weight19. This means that there are essentially point loads on the airplane at the main gear attachment points. Since all the loads need to be carried to the wing box the farther the main gear are from the wing the greater the moment arm and the heavier the structure required. The greatest load that the main gear sees is the impact during a “hard landing”.
Page 35 of 46

Optoprime Conceptual Designs, LLC. Conceptual Design Review Ground control is a secondary function of an airplane but it is a necessary function. If our plane cannot maneuver to the terminal or is unstable in a crosswind its usefulness is limited. The turning radius must be small enough to maneuver to a terminal and it must not tip sideways. The steering is affected by two things: the amount of weight carried by the nose gear, and the width of the main gear. If the nose does not support more than 5% of the weight the nose wheel may not have enough traction rendering it useless. If it supports more than 10-20% it would need to be stronger and bulkier increasing the weight and rotation for takeoff would be difficult. The main gear width also affects the steering. If the main gear is too narrow our plane would tip sideways during a “wide” turn. If the main gear is too wide it becomes difficult to make “narrow” turns. The landing gear position also has an influence on takeoff and landing. During takeoff and landing our airplane will have a high angle of attack. During these flight phases our plane will pivot about the main gear and we have to place the gear in a location that will allow us to achieve the necessary angle of attack without having a tail strike. The main gear must also not be too far behind the center of gravity or the plane will not be able to rotate on takeoff. Furthermore it cannot be too close to the center of gravity or when it rotates for takeoff the center of gravity will move behind the main gear and fall back on its tail, please see Figure 27.
Figure 27: Geometric constraints on main gear placement
We have talked about the challenges of positioning the landing gear and now we will talk about how we positioned ours. We used Excel spreadsheets that allowed us to quickly determine the position of the gear along with the height. We did this by analyzing the geometry found in Figure 27 and using Newton’s second law. The geometry constraints helped to determine the height of the gear primarily and the balance of forces and moments determined the axial location of both the nose and main gear. As stated earlier we need to have the main gear supporting between 80-90% of the weight and the nose gear no less than 5%. This became quite a challenge because of our aircrafts configuration our main gear needed to be located between the fore and aft wings. Structurally they need to be close to the forward wing box and to achieve the necessary rotation angle they need to be either fairly long or far back on the fuselage. If we placed the gear too far behind the center of gravity, it would not be possible to rotate for takeoff.
Page 36 of 46

Optoprime Conceptual Designs, LLC. Conceptual Design Review Our analysis showed that we would need to have long landing gear to satisfy all the constraints. The positioning of the nose gear is reliant almost entirely on the position of the main gear. For our airplane if the main gear supports the recommended 90% of the weight the nose gear would have to be positioned in front of the nose, this is not possible. Using the sum of moments about the center of gravity the most feasible solution was to have the main gear support 93% and the nose gear 7%. 7% of the weight is still above the minimum value of 5% but it is very close, and if the design was continued it would have to be monitored and the gear possibly redesigned. The next design concern is the width of the main gear. The width must be wide enough to provide lateral stability and prevention of wing strikes, but not too wide to hinder maneuverability. This analysis was also performed in excel using the geometry found in Figure 28. The height of our gear is known so the only variable to solve for is the angle.
Figure 28:Geometry for tip over
The primary dimensions of our landing gear can be found in Table 13. The storage of our gear presents another concern that we had to address. Our landing gear is longer than the ones found on similarly sized aircraft but they have to be. We have determined that our unique fuselage shape allows for proper stowage of the landing gear.
Table 13: Primary Landing Gear Dimensions Height above ground 6 ft Allowable Rotation Angle 15 deg Distance behind CG 3 ft Wing strike angle 24.8 deg Nose gear positions from CG 42 ft
Page 37 of 46

Optoprime Conceptual Designs, LLC. Conceptual Design Review
STABILITY AND CONTROL Static Longitudinal Stability Positive longitudinal stability of an aircraft is achieved when the center of gravity of the aircraft is more forward than the neutral point (also known as the aerodynamic center) of the whole aircraft. Our joined wing design presented several problems in making a stable aircraft. The main problem is that for a joined wing aircraft to be in balance, the center of gravity (CG) needs to lie in between the aerodynamic centers of each wing, but it must still lie forward of the whole aircraft aerodynamic center. This means that we need to size the wings so the resulting moments due to lift from each wing is balanced with the weight of the aircraft. Also, the inherent problem with this CG position is that the main landing gear of the aircraft needs to be behind the CG. Since the CG is toward the trailing edge of the forward wing or behind the forward wing all together, it is impossible to attach the main gear to the forward wing spar. Attaching the main gear to the aft wing spar makes the main gear too far from the CG which would not allow our aircraft to rotate on takeoff. This leaves the only option of attaching the main gear to the fuselage which requires extra structure for support. We determined the CG of the aircraft using component weights and locations as previously discussed. We calculated the aerodynamic center of the whole aircraft using the method defined in section 3.1.4 of reference20. We deviated from this method in that we only considered the wings when we found the aerodynamic center. The resulting location for the aerodynamic center is 71.7 ft from the nose of the aircraft. The forward most CG position is 65.27 ft corresponding to maximum takeoff weight and the aft most CG position is 69.8 ft for no passengers with only 25% of the maximum fuel aboard. This means our static margin ranges from 1.9 ft to 6.43 ft. These values alone do not tell us much except that we have positive longitudinal static stability for any flight configuration. Static margin is usually listed as a fraction of the mean geometric chord of the aircraft. Since our design has multiple wings it is necessary to come up an effective mean geometric chord. To do this we created an aerodynamically equivalent monoplane and found the mean geometric chord of this single wing which was 12.8 ft. This then yields a static margin that ranges from .149 to .500 times the mean geometric chord. NASA created the Joined Wing Research Aircraft and tested three different wing configurations; one of which was similar to our configuration21. Smith and Stonum found that the static margin of their JW-3 configuration (similar to our configuration) ranged from about .2 to .4 times their mean geometric chord. This confirms that our findings are within a reasonable range stability and controllability. Control Surface Sizing One of the advantages of a joined wing configuration is the ability to have direct lift and side force capability because we can have control surfaces on both the forward and aft wings. Figure 29 shows the control surface configuration of our design. We determined that there are no advantages to having a direct lift capability because much more lift
Page 38 of 46

Optoprime Conceptual Designs, LLC. Conceptual Design Review could be produced by pitching the aircraft instead of translating the aircraft up by the use of elevators on both the forward and aft wings. We determined that having a direct side force capability is extremely advantageous when landing in a crosswind because instead of using the rudder to point the nose of the aircraft into the wind and using the ailerons to correct for the yawing moment due to sideslip we can deflect 4 ailerons (2 on each wing) to create a net side force with no net rolling moment. For example, to create a side force to the right: deflect the aileron on the right main wing up, the elevon on the aft right wing down, the aileron on the left main wing down, and the elevon on the aft left wing up (See Figure 30). This way the vertical components of lift are canceled out on the right and left side of the aircraft and there is only a resultant side force.
Flaps
Ailerons
Elevons
Elevators
Rudder
Figure 29: Control Surfaces
Figure 30: Direct Side Force Capability22
We determined that the most influential factor in elevator size is the ability to rotate during takeoff because of the large moment required and the low dynamic pressure present. With the moment arm being the distance from the elevators to the landing gear, with the elevators being 30% span and 30% chord of the aft wing, and the elevons being 30% span and 50% chord of the aft wing; we would be able to produce a moment of 100,000 lb*ft about the main landing gear. We determined that this moment would be sufficient to rotate at takeoff and would give us plenty of control for maneuvering at altitude. Since we have a direct side force capability, landing in a crosswind requires no rudder, and so, has no bearing on rudder sizing. We determined that one engine inoperative at landing would size our vertical stabilizer and rudder. To size the rudder we determined how much moment is produced about the CG by the one operating engine. We then
Page 39 of 46

Optoprime Conceptual Designs, LLC. Conceptual Design Review figured out how large of a rudder and vertical tail would be needed in order to counteract this moment. We used the method described in section 2.6 of reference. We decided on a root chord which would fit onto our 3-D model and would look to be about the right size. We then the worked backwards from knowing the amount lift the vertical tail would need to produce with a rudder deflection. We iterated this process until we found a rudder size (percent chord of the vertical tail) and a span which would give us enough moment to counteract the single operating engine. Once we knew how large our tail and rudder needed to be, we needed to determine some dimensions in order to make the vertical tail look like a normal aircraft’s tail. We took the dimensions from the vertical stabilizer of a Boeing 737-700 and scaled it to the size we had just determined. In order to size the ailerons we used historical sizes for percent chord, taking into consideration the location of our wing fuel tank. We also had to consider the fact that we would be using the ailerons for our direct side force capability which there are no values to reference (because there are no operating aircraft that have this capability). The percent chord values were roughly based off of the Boeing 737 and the MD-80 and are 30% of the chord of our wing (in order to avoid the wing fuel tank). Since our wing span is shorter than these aircraft we needed to have larger ailerons to produce the same rolling moment. Most importantly, we would need our ailerons to have about the same effectiveness as our elevons in order to utilize our direct side force capability so our ailerons are 30% of the span of our wing. RELIABILITY STUDY Composite Materials Composite skins add tremendous reliability to our product. Most composite materials do not exhibit traditional crack nucleation and propagation behaviors. In many instances, composites (especially CFRP) tend to fracture instead of following Hooke’s Law. In terms of aircraft maintenance and reliability, if a ground crew member performs a preflight walk-around and notices a crack, that crew member notices an immediate warning to ground the airplane and fix the crack. Since the stop-drilling of cracks is insufficient for composite materials, maintenance crews will need to apply a full patch to the aircraft skin. This is ideal because it provides immediate GO/NO-GO feedback. Avionics Suite The OP-5-9-08 will have a Satelite-Based Navigation System (SATNAV), TCAS system as well as a terrain monitoring system. With the rising popularity of Automated Dependent Surveillance-Broadcast (ADS-B), aircraft computers will be able to communicate with each other, calculate and then fly an ideal descent profile. They will also be able to maintain minimum separation from each other. Optoprime believes that with NextGen ATC, the current minimums will be reduced as the reliability of these systems are verified. Airplane Operators & Redundancy The airplane will not have an on-board flight deck crew; however, there will be a remote operator to ensure that the flight computer is operating properly. The remote operator will manage multiple aircraft simultaneously. As aircraft near the boundaries of an
Page 40 of 46

Optoprime Conceptual Designs, LLC. Conceptual Design Review operators control, he will be able to pass them off to an operator in different sectors, similar to the process that occurs today in Air Route Traffic Control Centers (ARTCCs). This vision is depicted below in FIGURE.
Figure 31 – Vision for Remote Operations23,24
In the event of a communication failure, the system envisioned consists of a bare-bones communications transmitter and receiver that is monitoring the primary system activity on a completely independent power loop from an isolated power source, such as the solar panels or battery back-ups. If the primary system is inoperable, the backup system will sense the failure and begin to broadcast and receive on an emergency frequency, alerting the remote operator that the aircraft has a fault. The backup system would transmit and receive on independent antennae. Since it is a bare-bones system, designed to maintain positive control of the aircraft, the full aircraft control laws will not be loaded onto this minimum system beyond what is minimally required for stability. This system would attempt to manipulate flight control surfaces through trim deflections instead of primary surface deflection. If there is a complete interruption of ground communication, the system will have access to terrain monitoring systems. R&D teams are already developing these systems and many aircraft have Ground Proximity Warning Systems (GPWS’s). The OP-5-9-08 will fly its mission and in the absence of human control attempt to successfully land the aircraft in a safe mode. Most emergency procedures will be automatically programmed into the flight control system and it will react as required. The operator will be there primarily to verify that emergency operations are being properly implemented and/or rectify any potential situations that the computer is unaware of, possibly due to any subsystem failures. FINANCIAL ANALYSIS Assumptions 1
For its purposes, Optoprime Conceptual Designs, LLC., does not consider itself to be a startup company. As such, it does not anticipate acquisitions or leasing of land, space or
1 Unless otherwise noted, all quotes of monetary values have been adjusted to 2008 USD. Excluding assumptions, financial analyses are conducted in accordance with 2008 US GAAP (Generally Accepted Accounting Principles).
Page 41 of 46

Optoprime Conceptual Designs, LLC. Conceptual Design Review buildings due to this project. Instead, existing space will be converted for new program use. Although OCD foresees working very closely with engine manufacturers, Optoprime realizes that many customers have existing contracts with engine manufacturers. Optoprime will make every effort to certify as many new projects that engine manufacturers design for the OP-5-9-08 as possible. However, Optoprime realizes that it is primarily an airframer. Excepting reciprocal “goodwill” costs associated with working with another firm, engine costs (incl. RDT&E, Production, Sales and Warranty) are borne entirely by the engine manufacturers. Optoprime conducted a study of the long term Consumer Price Index25 (CPI – the metric used to define “inflation”). Over a period of 25 years, the CPI increased prices by a factor of 215%. Optoprime assumed that this trend would continue into the foreseeable future. OCD analyzed the Federal Reserve Bank of the United States of America’s Prime Rate over a similar time period. Such behavior is often unpredictable in the long term due to circumstances like market bubbles and panics. Although the Prime Rate, as well as the CPI, will vary from month to month, studying market behavior and modeling probabilistic models are beyond the scope of this project. Optoprime extrapolated an average Prime Rate of 4%. Fixed Costs Optoprime Conceptual Designs, LLC., anticipates that RDT&E costs will be fixed at approximately $8 B. This value comes from prior experience with the Boeing 777 program and accounts for an aircraft design of increased complexity, monetary inflation and the time value of money. The cost of production tooling is estimated to cost $250 M and is amortized over the period of production. This value comes from estimates given to us from a former Director of New Programs at Bombardier Aerospace for an aircraft of our size. This cost includes production tooling of composite materials in addition to assembly tooling. Variable Costs Variable costs primarily include direct manufacturing costs and billable labor hours. Direct manufacturing costs include parts, materials and subassemblies. The manufacturing costs also include the Cost of Poor Quality (also known as manufacturing rework). This is the cost that an airframer must pay in order to fix errors in production, such as misdrilled holes and improper forming. As production and support staff will potentially need to work out kinks in the supply chain, the COPQ will be initially high and then diminish as the number of units produced increases. This will be due to the increasing knowledge base and is known as the “Learning Curve.” As it is difficult to estimate the COPQ, the variable cost per unit was adjusted to reflect rework. Our learning curve has a downward trend that levels off.
Page 42 of 46

Optoprime Conceptual Designs, LLC. Conceptual Design Review Initially, variable expenses per unit are expected to cost $50 M and decrease steadily to $35 M. Profits Due to the initial high cost of production, early sales will not be profitable. Subtracting out the variable cost from the price per unit leaves the contribution toward fixed costs, which include the RDT&E costs (which will be realized before the first unit is sold) as well as the amortized cost of tooling. The OP-5-9-08 program will break even in 2043 (at the end of year six) after selling approximately 470 airplanes. Beginning in year six, the net contribution will go toward operating profits. The 2008 net present value of future operating profits is $64 B (USD).
Page 43 of 46

Optoprime Conceptual Designs, LLC. Conceptual Design Review
CONCLUSION Simplified, the RFP requested a solution to the problem of growing air traffic congestion by the year 2058. Optoprime Conceptual Designs, LLC., has found a solution to this emerging problem through the OP-5-9-08. Passengers in the Chicago area don’t especially care about going through Chicago O’Hare International Airport. These days, with one in four aircraft operating through O’Hare being delayed by more than 30 mins26, most passengers probably wouldn’t. Similarly, not everyone in the Chicago area can easily get to O’Hare. They may be located on the south side, closer to Gary/Chicago International Airport or further north, closer to Chicago Executive Airport (formerly Palwaukee). The OP-5-9-08 will be able to operate out shorter runways and therefore out of smaller airports. By using smaller airports, we allow airlines to take advantage of local markets and fly passengers direct. Beyond congestion concerns, Optoprime Conceptual Designs, in a demonstration of corporate citizenship through the preservation of our planet and its precious resources, has committed itself to making carbon-neutral aviation, to be implemented by the time our aircraft goes into service. There will be no environmental impact by flying our planes. Airline marketing possibilities are endless and we anticipate strong success and growth through our superior product, backed by our upstanding business model.
Page 44 of 46

Optoprime Conceptual Designs, LLC. Conceptual Design Review
REFERENCES 1 Roskam, Jan “Airplane Design Part III: Layout Design of Cockpit, Fuselage, Wing and Empennage:
Cutaaways and Inboard Profiles” DARcorporation, Lawrence KA 2002. 2 I.B.A. Freight Services, Cairo, Egypt. 4/23/2008.
<http://www.ibafreightservices.com/aircontainers.shtml> 3 Wikipedia.org, Unit Load Device, 4/23/2008, <http://en.wikipedia.org/wiki/Unit_Load_Device> 4 Alaska Airlines, Cargo Container Service, 4/23/2008.
<http://www.alaskaair.com/as/www2/cargo/Container-Service.asp> 5 UIUC Website, http://www.ae.uiuc.edu/m-selig/ads/coord_database.html [CITED 15 April 2008] 6 Raymer, D., “Aircraft Design: A Conceptual Approach Fourth Addition” AIAA 7 Flaps and Slats picture www.answers.com/tpoic/slats.htm, [CITED 14 April 2008] 8 Roskam, J., “Airplane Design Airplane Design Part V: Component Weight Estimation” DARCorporation,
Lawrence, KS, 2003 9 FLOPS 10 Martin, F. et al., A Concept for Producing Carbon-Neutral Synthetic Fuels and Chemicals, Los Alamos
National Laboratory, 2007. 11 Raymond Scott Ciszek, Technology Review, Design Methodology, State-of-the-Art Deigns and Future
Outlook, University of Virginia Department of Mechanical and Aerospace Engineering, 2002. 12 Ciszek, R., “Prop Fan Propulsion Concepts: Technology Review, Design Methodology, State-of-the-Art
Designs and Future Outlook”, University of Virginia Thesis, 2002. 13 http://www.flug-revue.rotor.com/ 14 Won, H. & Waters, M., Constant Volume Combustor implementation on a 50 passenger Commercial
Regional Transport Mission Simulation, AIAA, 2003. 15 Solar Impulse, News, http://www.solarimpulse.com/en/news/index.php 16Samuels, M., Structural Weight Comparison of a Joined Wing and a Conventional Wing. AIAA-81-
0366R, Journal of Aircraft. Vol. 19 17 Kroo I., Gallman J., “Aerodynamic and Structural Studies of Joined-Wing Aircraft,” Journal of Aircraft,
Vol. 28 18 Sensmeier, Mark D., “A Study of Vehicle Structural Layouts in Post-WWII Aircraft”
AIAA/ASME/ASCE/AHS/ASC Structures, Structural Dynamics & Materials Conference; 19 – 22 April 2004
19 Brandt A.S., Stiles R. J., Introduction to Aeronautics: A Design Perspective 2nd Edition, p.351 20 Roskam, J., “Airplane Flight Dynamics and Automatic Flight Controls”. DARCorporation, Lawrence,
KS, 2007. 21 Smith, Stephen C., Stonum, Ronald K. Experimental Aerodynamic Characteristics of a Joined-Wing
Research Aircraft Configuration. NASA Technical Memorandum 101083. April 1989. 22 Wolkovitch, Julian. The Joined Wing: An Overview. AIAA 23rd Aerospace Sciences Meeting, Reno
Nevada. Paper No. 85-0274. January 1985. 23 Google, http://www.google.com/maps 24 United States Air Force, http://www.af.mil 25 United States of America Bureau of Labor Statistics, http://www.bls.gov 26 United States Bureau of Transportation Statistics, http://www.bts.gov27 Aviationweek.com, Unducted Fan,
<http://aviationweek.com/aw/generic/story_generic.jsp?channel=awst&id=news/aw102207p2.xml&headline=Open%20Rotor%20Poses%20Maturity%20Dilemma%20for%20Next-gen%20Narrow%20Body>
28 http://www.san.org/documents/airport_noise/Noise_101_Part_6_web.ppt#279,7,Maximum Noise Limit Range
29 AviationWeek & Space Technology, Aerospace SourceBook 2007
30 AviationWeek & Space Technology, Aerospace SourceBook 2008
31 Airliners.net, <http://www.airliners.net/aviation-forums/tech_ops/read.main/163447/> 32http://www.prism.gatech.edu/~gtg365v/AE/IntroToAE/Design_Project/Miscellaneous/AE1350DesignPro
jectReport.pdf
Page 45 of 46
Optoprime Conceptual Designs, LLC. Conceptual Design Review 33 http://rht.bme.hu/~veress/dir/Oktatott_T%E1rgyak/Rep%FCl%F5g%E9p%20Hajt%F3m%FBvek/ Engines%20data%20and%20conversion%20tables.doc
Page 46 of 46