Embed Size (px)
Citation preview
Conceptualizing and Planning Conservation Projects and Programs
A Training Manual
Based on the Conservation Measures Partnership’s Open Standards for the Practice of Conservation
November 2009
Foundations of Success
Improving the Practice of Conservation
www.FOSonline.org [email protected]
Please register at
http://www.fosonline.org/resources/all/training-manual to let us know you are using this manual
and to receive updates about future products
© Foundations of Success 2009
Contents Overview of This Manual ........................................................................................................ 1
Learning Objectives ............................................................................................................. 1 What Is Different about This Planning Process? ................................................................. 2 Outline of the Module .......................................................................................................... 4 Structure ............................................................................................................................... 5
Overview of Open Standards (Week 1) ................................................................................... 7 Introduction to Adaptive Management ................................................................................ 7 Overview of the Open Standards ......................................................................................... 8 Steps in the Open Standards ................................................................................................ 9 Some References ................................................................................................................ 11 Assignment 1.1: Describe what you want to achieve in this course .................................. 11
Step 1A: Define Initial Project Team (Week 1) .................................................................. 12 Introduction to Initial Project Team ................................................................................... 12 How to Define Your Initial Project Team.......................................................................... 14 Some References ................................................................................................................ 16 Assignment 1.2 – Define Your Initial Project Team ......................................................... 16
Step 1B. Define Scope, Vision, and Targets (Week 2) ....................................................... 17 Introduction to Project Scope and Vision .......................................................................... 17 How to Define Project Scope and Vision .......................................................................... 18 Examples of Project Scope and Vision .............................................................................. 22 Some References ................................................................................................................ 23 Assignment 2 – Define Project Scope and Vision ............................................................. 24
Step 1B. Define Scope, Vision, and Targets (Week 3) ....................................................... 25 Introduction to Conservation Targets ................................................................................ 25 How to Develop and Use Conservation Targets ................................................................ 26 Examples of Conservation targets ..................................................................................... 29 Practice Exercise ................................................................................................................ 30 Some References ................................................................................................................ 30 Assignment 3 - Select Conservation Targets ..................................................................... 31
Step 1B. Define Scope, Vision, and Targets (Week 4) ....................................................... 32 Introduction to Viability Assessment................................................................................. 32 How to Do a Viability Assessment .................................................................................... 35 Examples of Viability Assessment .................................................................................... 41 Some References ................................................................................................................ 42 Assignment 4 – Describe the Status of Your Conservation Targets .................................. 42
Step 1C. Identify Critical Threats (Week 5) ....................................................................... 44 Introduction to Threat Rating............................................................................................. 44 How to Do an Absolute Target-by-Target Threat Rating .................................................. 44 Other Methods for Threat Rating ....................................................................................... 51 Example Threat Rating ...................................................................................................... 52 Practice Exercise ................................................................................................................ 53 Some References ................................................................................................................ 54
© Foundations of Success 2009
Assignment 5 – Identify and Rate Your Critical Threats .................................................. 55
Step 1D. Complete Situation Analysis (Week 6) ................................................................ 56 Introduction to Situation Analysis ..................................................................................... 56 How to Complete a Situation Analysis and Document the Results ................................... 56 Examples ............................................................................................................................ 62 Practice Exercise ................................................................................................................ 63 Some References ................................................................................................................ 64 Assignment 6 – Develop a Conceptual Model and Complete a Course Evaluation Form 64
Step 2A. Develop a Formal Action Plan: Goals, Strategies, Assumptions, & Objectives (Week 7) ............................................................................................................................ 66 Overview of Step 2: Plan Actions and Monitoring ............................................................ 66 Introduction to Goals ......................................................................................................... 67 How to Develop Goals ....................................................................................................... 67 Examples of Goals ............................................................................................................. 71 Some References ................................................................................................................ 71 Assignment 7 – Develop Goals for Conservation Targets That Meet Criteria for “Good”
Goals ............................................................................................................................ 72
Step 2A. Develop a Formal Action Plan: Goals, Strategies, Assumptions, & Objectives (Week 8) ............................................................................................................................ 73 Introduction to Determining Strategies .............................................................................. 73 How to Determine Strategies ............................................................................................. 74 Examples of Strategies ....................................................................................................... 81 Some References ................................................................................................................ 82 Assignment 8 – Brainstorm, Narrow Down, and Rank Strategies .................................... 83
Step 2A. Develop a Formal Action Plan: Goals, Strategies, Assumptions, & Objectives (Week 9) ............................................................................................................................ 84 Introduction to Results Chains ........................................................................................... 84 How to Develop Results Chains ........................................................................................ 87 Examples of Results Chains ............................................................................................... 91 Some References ................................................................................................................ 92 Assignment 9 – Assemble Results Chains ......................................................................... 93
Step 2A. Develop a Formal Action Plan: Goals, Strategies, Assumptions, & Objectives (Week 10) .......................................................................................................................... 94 Introduction to Objectives.................................................................................................. 94 How to Develop Objectives ............................................................................................... 96 Examples of Objectives ..................................................................................................... 98 Some References ................................................................................................................ 99 Assignment 10– Develop Objectives along Results Chain That Meet Criteria for “Good”
Objectives .................................................................................................................... 99
Step 2A. Develop a Formal Action Plan: Goals, Strategies, Assumptions, & Objectives (Week 11) ........................................................................................................................ 101 Introduction to Activities ................................................................................................. 101 How to Develop Activities............................................................................................... 101 Examples of Activities ..................................................................................................... 104 Some References .............................................................................................................. 104
© Foundations of Success 2009
Assignment 11 – Specify Activities for Strategies and Compile Draft Action Plan ....... 104
Step 2B. Develop a Formal Monitoring Plan (Week 12) .................................................. 105 Introduction to Monitoring Plans ..................................................................................... 105 How To Develop a Monitoring Plan ................................................................................ 106 Example of a Monitoring Plan ......................................................................................... 116 Assignment 12 – Define Audiences and Indicators, Develop Draft Monitoring Plan, and
Complete a Course Evaluation ................................................................................... 119
Appendix A. Glossary and Criteria ................................................................................... A-1 Criteria for Key Terms ..................................................................................................... A-5
Appendix B. How Miradi Calculates Summary Threat Ratings .................................... B-1 Calculating Individual Threat Ratings Based on Scope, Severity and Irreversibility ..... B-1 Rolling Up Ratings .......................................................................................................... B-1
Appendix C. How to Conduct a Relative Threat Ranking.............................................. C-1 What Is a Relative Threat Ranking and Why Is It Useful? .............................................. C-1 How to Do a Relative Threat Ranking ............................................................................. C-2
Appendix D. WWF Wetlands Teaching Example ........................................................... D-1 Brief Project Description ................................................................................................. D-1 Step 1: Conceptualize ...................................................................................................... D-2 Step 1A: Initial Project Team .......................................................................................... D-2 Step 1B: Project Scope, Vision and Targets .................................................................... D-4 Step 1C: Threat Rating..................................................................................................... D-6 Step 1D: Conceptual Model ............................................................................................. D-8 Step 2: Plan Actions and Monitoring ............................................................................... D-9 Step 2A: Develop a Formal Action Plan: Goals, Strategies, Assumptions, & ObjectivesD-9 Step 2B: Develop a Monitoring Plan ............................................................................. D-18
© Foundations of Success 2009
This guide provides detailed guidance on conceptualizing and planning conservation projects and
programs. It is based on the Adaptive Management principles and practices in the Conservation Measure
Partnership’s Open Standards for the Practice of Conservation. Materials in this guide have been
adapted from previous works produced by Foundations of Success and members of the Conservation
Measures Partnership.
FOS strongly recommends that project teams new to the Open Standards and the tools presented
in this manual secure the guidance of a trained facilitator to apply the Open Standards to their
projects.
Please register here to let us know you are using this guide:
http://www.fosonline.org/resources/all/training-manual
To provide feedback or comments, you can contact Foundations of Success at [email protected].
Visit our website at www.FOSonline.org to download the most recent version of this guide. Please cite
this work as:
Foundations of Success. 2009. Conceptualizing and Planning Conservation Projects and Programs: A
Training Manual. Foundations of Success, Bethesda, Maryland, USA.
This work is licensed under the Creative Commons Attribution-Noncommercial-
Share Alike 3.0 License. To view a copy of this license, visit
http://creativecommons.org/licenses/by-nc-sa/3.0/ or send a letter to Creative
Commons, 171 Second Street, Suite 300, San Francisco, CA 94105, USA.
Under this license, you are free to share this manual and adapt it for your use under the following
conditions:
You must attribute the work in the manner specified by the author or licensor (but not in any way
that suggests that they endorse you or your use of the work).
You may not use this work for commercial purposes.
If you alter, transform, or build upon this work, you must remove the FOS logo, and you may
distribute the resulting work only under the same or similar license to this one.

Conceptualizing and Planning Conservation Projects and Programs 1
© Foundations of Success 2009
Overview of This Manual
This manual provides users with an overview of the Conservation Measures Partnership’s (CMP) Open Standards for the Practice of Conservation1 (referred to as the Open Standards or the Standards throughout this manual) and detailed guidance for the first two steps in CMP’s project management cycle. These two steps cover the best practices for conceptualizing and planning a conservation project2 or program. The Conservation Measures Partnership developed the Open Standards for the Practice of Conservation in order to provide conservation practitioners with the steps and general guidance necessary for the successful implementation of conservation projects. The five steps that comprise the project management cycle are: 1) Conceptualizing the project vision and context; 2) Planning actions and planning monitoring; 3) Implementing actions and implementing monitoring; 4) Analyzing data, using the results, and adapting the project; and 5) Capturing and sharing learning. Foundations of Success (FOS) developed this manual for its online and distance learning training courses. As such, it introduces topics and then provides step-by-step guidance. Any practitioner or team can learn about tools and methods to implement the Standards simply by reading this manual. To develop full capacity for implementing the Standards, however, we strongly recommend that you use this manual as part of a course in which FOS or another qualified individual or institution can provide you detailed and substantive feedback on your work.
Learning Objectives
The learning objectives for this manual are tied directly to the expected outputs for each standard of practice included in Step 1 (Conceptualizing the project vision and context) and Step 2 (Planning actions and planning monitoring) of the Open Standards. After completing the training course associated with this manual, participants should be able to demonstrate their ability to apply the Standards to a real project by producing the following outputs: Step 1: Conceptualize the project vision and context
Selection of initial project team, including project leader, core members, and advisory members.
Identification of key skills each team member brings.
Designation of roles and responsibilities.
A brief description of the project’s scope
If appropriate, a map of the project area
A vision statement for the project
1 See http://www.conservationmeasures.org for more information on CMP and the latest version of the Open Standards. 2 We use the term “project” broadly to include any set of actions undertaken by a group of actors to achieve some defined end. A project may thus be a single discrete set of actions carried out by a single team in a particular site, or a group of related actions carried out by multiple actors across multiple sites (program or portfolio).
2 Foundations of Success
© Foundations of Success 2009
Selection of conservation targets
Description of the status of each priority conservation target
Identification of direct threats.
Rating or ranking of direct threats to identify critical threats.
Identification and analysis of indirect threats and opportunities.
Assessment of stakeholders.
Initial conceptual model that illustrates cause and effect relationships among factors operating at the site.
Step 2: Planning your project and planning your monitoring
A partially-developed action plan that includes:
o Well-defined goals for all of your conservation targets
o Identification of key factors you will try to influence and draft strategies for doing so
o Ranking of draft strategies
o Results chains that specify assumptions for key strategies
o Well-defined objectives for at least a few critical threats and other factors that your project will address
A partially-developed monitoring plan that includes:
o The identification of your audiences and their information needs
o A list of the indicators you will measure to track the effectiveness of each conservation strategy
o Brief descriptions of the methods for collecting data for each indicator
o When and by whom each kind of data will be collected
A partially developed operational plan (Note: This is part of Step 2 in the CMP Open Standards, but it is a step that is best completed once you have a fully developed and finalized action and monitoring plan. Thus, this training module will not cover this step.)
What Is Different about This Planning Process?
The Open Standards propose an adaptive management approach that helps project teams systematically plan their projects, determine if their projects are on track, why they are on track or not, and what adjustments they need to make. To be successful, a project must be based on both sound project assumptions (theory) and good implementation. Often, however, project teams are not explicit about the assumptions behind the
Conceptualizing and Planning Conservation Projects and Programs 3
© Foundations of Success 2009
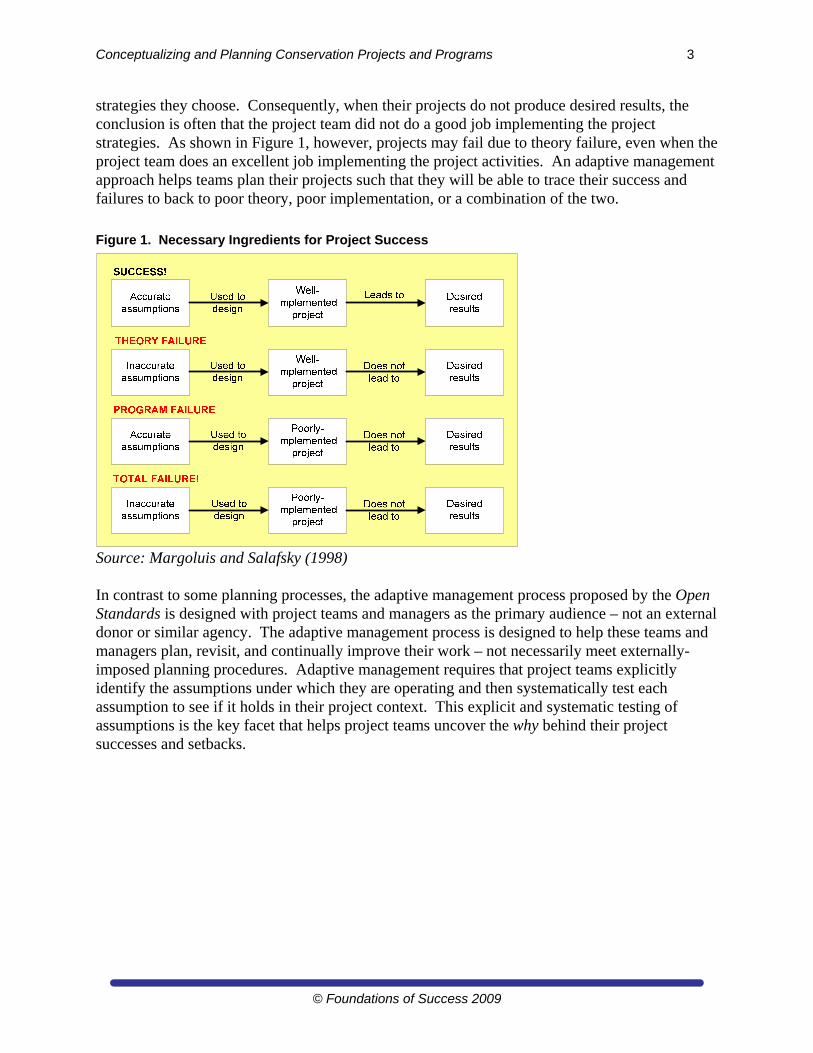
strategies they choose. Consequently, when their projects do not produce desired results, the conclusion is often that the project team did not do a good job implementing the project strategies. As shown in Figure 1, however, projects may fail due to theory failure, even when the project team does an excellent job implementing the project activities. An adaptive management approach helps teams plan their projects such that they will be able to trace their success and failures to back to poor theory, poor implementation, or a combination of the two.
Figure 1. Necessary Ingredients for Project Success
Source: Margoluis and Salafsky (1998) In contrast to some planning processes, the adaptive management process proposed by the Open Standards is designed with project teams and managers as the primary audience – not an external donor or similar agency. The adaptive management process is designed to help these teams and managers plan, revisit, and continually improve their work – not necessarily meet externally-imposed planning procedures. Adaptive management requires that project teams explicitly identify the assumptions under which they are operating and then systematically test each assumption to see if it holds in their project context. This explicit and systematic testing of assumptions is the key facet that helps project teams uncover the why behind their project successes and setbacks.
4 Foundations of Success
© Foundations of Success 2009
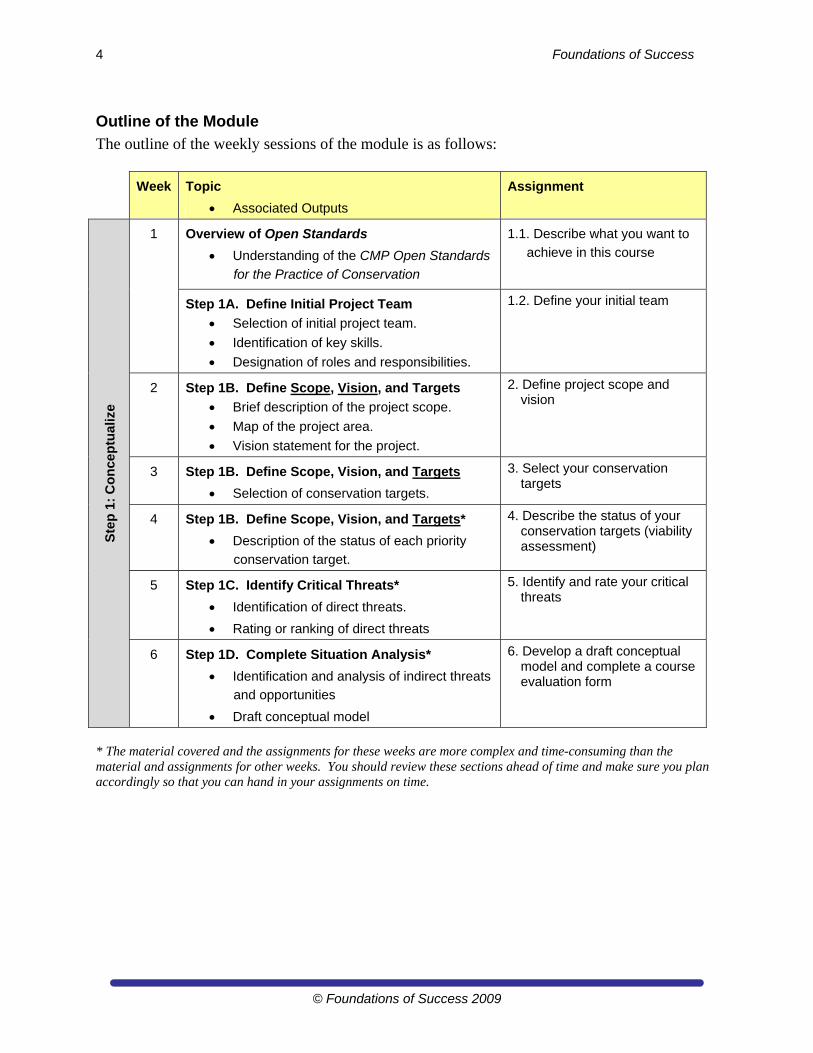
Outline of the Module
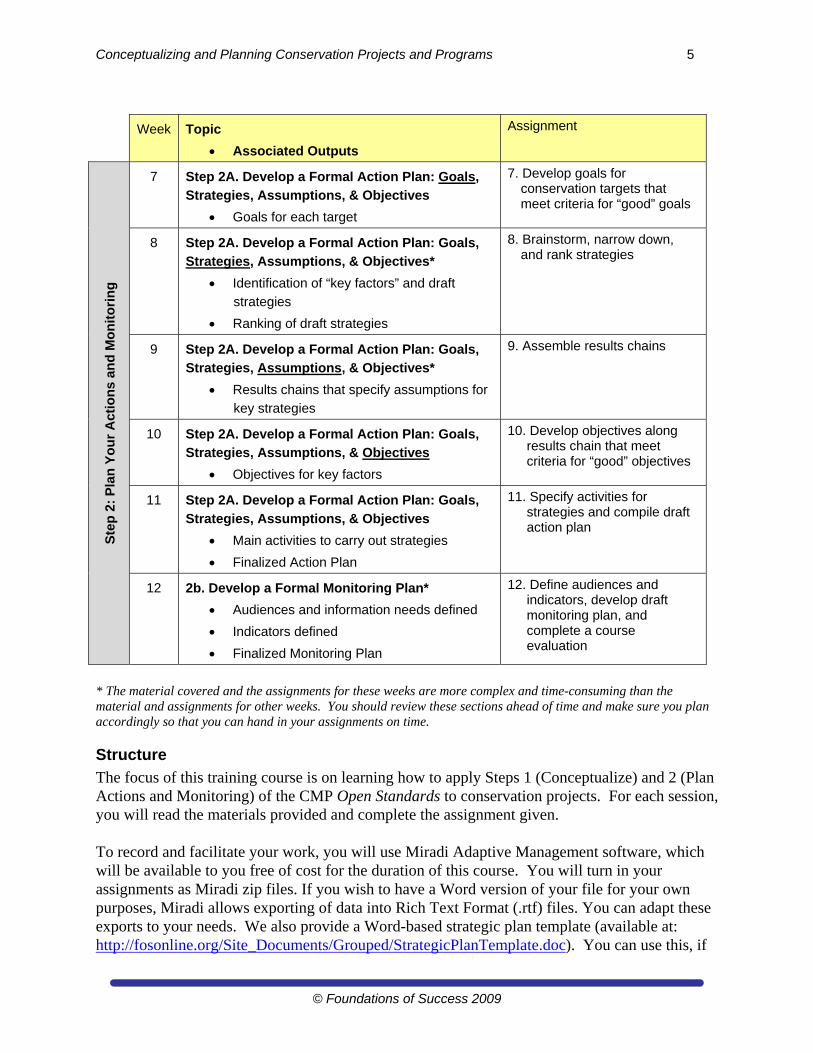
The outline of the weekly sessions of the module is as follows:
Week Topic
Associated Outputs
Assignment
Ste
p 1
: C
on
cep
tual
ize
1 Overview of Open Standards
Understanding of the CMP Open Standards
for the Practice of Conservation
1.1. Describe what you want to
achieve in this course
Step 1A. Define Initial Project Team
Selection of initial project team.
Identification of key skills.
Designation of roles and responsibilities.
1.2. Define your initial team
2 Step 1B. Define Scope, Vision, and Targets
Brief description of the project scope.
Map of the project area.
Vision statement for the project.
2. Define project scope and vision
3 Step 1B. Define Scope, Vision, and Targets
Selection of conservation targets.
3. Select your conservation targets
4 Step 1B. Define Scope, Vision, and Targets*
Description of the status of each priority
conservation target.
4. Describe the status of your conservation targets (viability assessment)
5 Step 1C. Identify Critical Threats*
Identification of direct threats.
Rating or ranking of direct threats
5. Identify and rate your critical threats
6 Step 1D. Complete Situation Analysis*
Identification and analysis of indirect threats
and opportunities
Draft conceptual model
6. Develop a draft conceptual model and complete a course evaluation form
* The material covered and the assignments for these weeks are more complex and time-consuming than the material and assignments for other weeks. You should review these sections ahead of time and make sure you plan accordingly so that you can hand in your assignments on time.
Conceptualizing and Planning Conservation Projects and Programs 5
© Foundations of Success 2009
Week Topic
Associated Outputs
Assignment S
tep
2:
Pla
n Y
ou
r A
ctio
ns
and
Mo
nit
ori
ng
7 Step 2A. Develop a Formal Action Plan: Goals,
Strategies, Assumptions, & Objectives
Goals for each target
7. Develop goals for conservation targets that meet criteria for “good” goals
8 Step 2A. Develop a Formal Action Plan: Goals,
Strategies, Assumptions, & Objectives*
Identification of “key factors” and draft
strategies
Ranking of draft strategies
8. Brainstorm, narrow down, and rank strategies
9 Step 2A. Develop a Formal Action Plan: Goals,
Strategies, Assumptions, & Objectives*
Results chains that specify assumptions for
key strategies
9. Assemble results chains
10 Step 2A. Develop a Formal Action Plan: Goals,
Strategies, Assumptions, & Objectives
Objectives for key factors
10. Develop objectives along results chain that meet criteria for “good” objectives
11 Step 2A. Develop a Formal Action Plan: Goals,
Strategies, Assumptions, & Objectives
Main activities to carry out strategies
Finalized Action Plan
11. Specify activities for strategies and compile draft action plan
12 2b. Develop a Formal Monitoring Plan*
Audiences and information needs defined
Indicators defined
Finalized Monitoring Plan
12. Define audiences and indicators, develop draft monitoring plan, and complete a course evaluation
* The material covered and the assignments for these weeks are more complex and time-consuming than the material and assignments for other weeks. You should review these sections ahead of time and make sure you plan accordingly so that you can hand in your assignments on time.
Structure
The focus of this training course is on learning how to apply Steps 1 (Conceptualize) and 2 (Plan Actions and Monitoring) of the CMP Open Standards to conservation projects. For each session, you will read the materials provided and complete the assignment given. To record and facilitate your work, you will use Miradi Adaptive Management software, which will be available to you free of cost for the duration of this course. You will turn in your assignments as Miradi zip files. If you wish to have a Word version of your file for your own purposes, Miradi allows exporting of data into Rich Text Format (.rtf) files. You can adapt these exports to your needs. We also provide a Word-based strategic plan template (available at: http://fosonline.org/Site_Documents/Grouped/StrategicPlanTemplate.doc). You can use this, if

6 Foundations of Success
© Foundations of Success 2009
you wish, to help you format the exported information from Miradi, but you will not be required to do so as part of this course. Your facilitator should have already provided you with access information for using Miradi. If you have any questions, please refer them directly to your facilitator.
Conceptualizing and Planning Conservation Projects and Programs 7
© Foundations of Success 2009
Overview of Open Standards (Week 1)
Structure for Week 1. In this week you will: Read Introduction to Adaptive Management and Overview of the Open Standards
Read Introduction to Team Composition and Operations and How to Define Team Composition and Operations
Hand in Assignments 1a and 1b
Introduction to Adaptive Management3 Conservation takes place in complex systems influenced by biological, political, social, economic, and cultural factors. Project managers and practitioners operating within these complex systems must make important conservation decisions. Yet these managers and practitioners often have limited information and operate in the face of uncertainty. Adaptive management provides a method for making more informed decisions about strategies, testing the effectiveness of strategies used, and learning and adapting to improve strategies. Adaptive management is one of those “buzz words” – a lot of people are talking about it, but few clearly define what adaptive management is or why it is important. Some people believe adaptive management is synonymous with good management and that it merely involves trying something and then if it does not work, using common sense to adapt and try something else. Adaptive management is indeed good management, but not all good management is adaptive management. Likewise, adaptive management requires common sense, but it is not a license to just try whatever you want. Instead, adaptive management requires an explicitly experimental – or "scientific" – approach to managing conservation projects. With this understanding, we can define adaptive management as: the integration of design, management, and monitoring to systematically test assumptions in order to adapt and learn. This definition can be expanded by looking at its 3 components: Testing Assumptions is about systematically trying different actions to achieve a desired outcome. It is not, however, a random trial-and-error process. Rather, it involves thinking about the situation at your project site, identifying what is occurring at your site and what actions might be used to reduce threats or take advantage of opportunities, and then outlining the assumptions about how you believe your actions will help you achieve your conservation goals and objectives. You then implement these actions and monitor the actual results to see how they compare to the ones predicted by your assumptions. The key here is to develop an understanding of not only which actions work and do not work, but also why they work or do not work. Adaptation is about taking action to improve your project based on the results of your monitoring. If your project actions did not achieve the expected results, it is because your assumptions were wrong, your actions were poorly executed, the conditions at the project site have changed, your monitoring was faulty, or some combination of these problems. Adaptation
3 The Introduction to Adaptive Management is directly derived from Adaptive Management: A Tool for Conservation Practitioners (Salafsky et al. 2001).
8 Foundations of Success
© Foundations of Success 2009
involves changing your assumptions and your interventions to respond to the new information obtained through monitoring efforts. Learning is about systematically documenting your team’s planning and implementation processes and the results you have achieved. This documentation will help your team avoid making the same mistakes in the future. Furthermore, sharing these lessons will enable those in the broader conservation community to benefit from your experiences. Other practitioners are eager to learn from your successes and failures so that they can design and manage better projects and avoid some of the perils you may have encountered.
Overview of the Open Standards4 Making the most of the extensive experience gained by conservation organizations while designing, implementing and appraising their conservation projects, the Conservation Measures Partnership (CMP) has developed a set of project cycle or adaptive management Open Standards. These standards are less a recipe that must be followed exactly and more a framework and guidance for conservation action. The goal in developing the Open Standards for the Practice of Conservation was to bring together common concepts, approaches, and terminology in conservation project design, management, and monitoring in order to help practitioners improve the practice of conservation. In particular, these standards are meant to provide the steps and general guidance necessary for the successful implementation of conservation projects. CMP members borrowed and adapted the term “open standards” from the information technology field to mean standards that are developed through public collaboration, freely
available to anyone, and not the property of anyone or any organization. For the conservation community, this means that these proposed standards are common property, constantly evolving and improving through the input of a wide variety of practitioners, and adaptable to individual organizations’ needs. CMP members developed the Open Standards with the hope of providing colleagues across the conservation landscape with a clear roadmap to assist them in improving conservation project effectiveness and efficiency. The Open Standards clearly outline what is expected to achieve quality project management,
thus providing a transparent basis for a consistent and standardized approach to external evaluation of conservation actions. The Conservation Measures Partnership published the first version (1.0) of the Open Standards in June 2004. Since then, several initiatives have emerged to help the Standards become the common and accepted practice within the conservation community. For example, several member organizations within CMP have worked especially hard to operationalize the Standards within their institutions– including The Nature Conservancy (TNC), Wildlife Conservation
4 The text for the Overview of the Open Standards borrows heavily from introductory text to the Open Standards for Conservation, Version 2.0, available at www.conservationmeasures.org.
Tip! The process outlined here is not specifically for strict biodiversity conservation or preservation projects. It also applies for resource management projects – or really any type of project, be it development, public health, literacy, or some other focus.
Conceptualizing and Planning Conservation Projects and Programs 9
© Foundations of Success 2009
Box 1. Miradi Adaptive Management Software
Miradi, which means "project" in the East African
language of Swahili, is a quickly evolving software
program that helps conservation project teams
implement an adaptive management process such as
that put forth by the Conservation Measures
Partnership’s Open Standards for the Practice of
Conservation, Miradi guides conservation practitioners
through a series of step-by-step interview wizards. As
practitioners go through these steps, Miradi helps them
to define their project scope, and design conceptual
models and spatial maps of their project site. The
software also helps teams to prioritize threats, develop
objectives and actions, and select monitoring indicators
to assess the effectiveness of their strategies. Miradi is
being developed by the Conservation Measures
Partnership, a consortium of leading nature conservation
organizations, and Benetech, a nonprofit technology
development organization.
Miradi is available at www.Miradi.org. Please see your
facilitator if you have not received download instructions
Society (WCS), World Wildlife Fund (WWF), and Foundations of Success (FOS). This is an ongoing, dynamic process that has included the development of organization-specific standards that draw heavily on the CMP Open Standards, development of more detailed guidance materials for each step, training of various project teams across the globe in parts of the Standards, and implementation of the Standards by these teams. This wide-scale application of the Standards has provided CMP with helpful feedback and suggestions for improvement. The Open Standards have also served as the framework for the development of the Miradi Adaptive Management Software Program (Box 1). The current version of the software walks practitioners through the conceptualization and planning steps (Steps 1 and 2) in the adaptive management cycle. Later versions will incorporate the other steps in the adaptive management cycle. You will use Miradi for the assignments in this manual. The manual and assignments will cover most of the functions Miradi supports for Steps 1 and 2 of the Open Standards. Because of time constraints, we will not be able to explore all of these functions, but we encourage those of you who are interested to explore them on your own and consult with your facilitator if you have any questions.
Steps in the Open Standards
It is probably safe to say that all conservation organizations and practitioners want to improve the quality of their work. To this end, three questions drive their quest:
Are we achieving an impact? – To what extent are their actions directly or indirectly leading to the conservation of biodiversity or more sustainable resource management?
Are we doing the right things? – How do they know that they have chosen the most effective and efficient strategies to achieve their conservation goals?
Are we doing things well? – Are they using their human and financial resources efficiently in order to implement actions in the most effective fashion?
Answering these questions is no simple task, but doing so is essential if conservation organizations and practitioners are to successfully adapt and change over time, learn about the conditions under which their actions are most effective, and convince their supporters and society that conservation is a worthy investment.
10 Foundations of Success
© Foundations of Success 2009
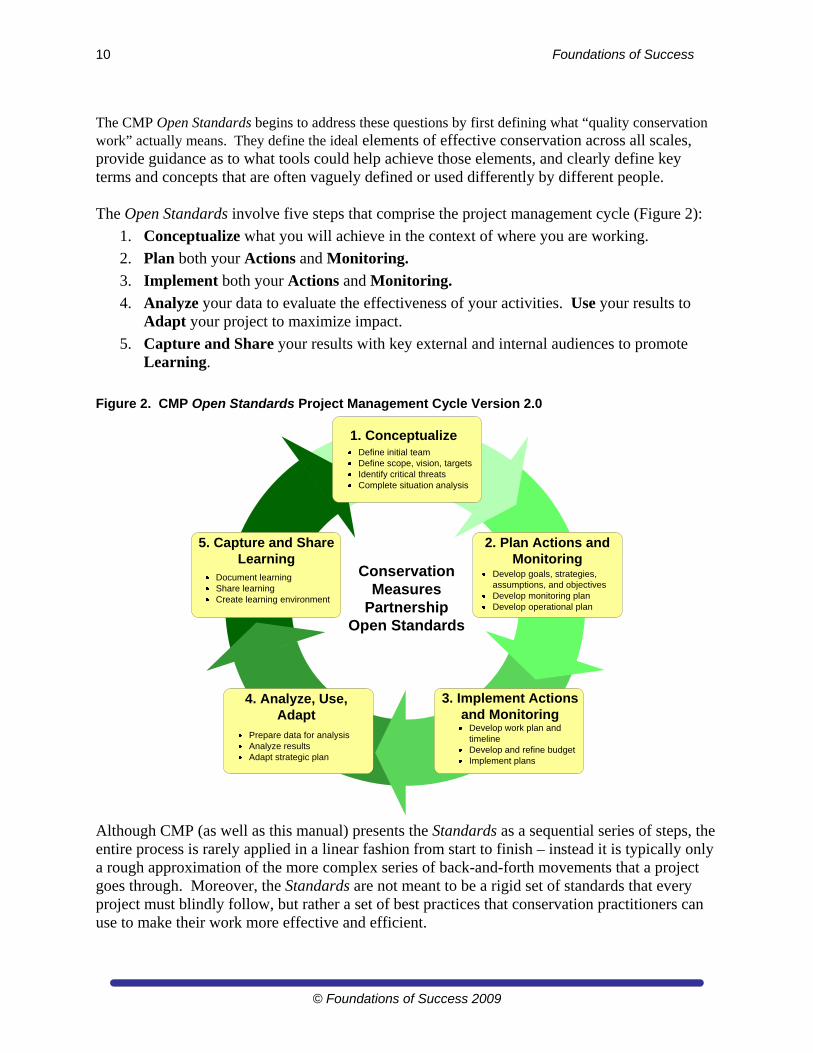
The CMP Open Standards begins to address these questions by first defining what “quality conservation work” actually means. They define the ideal elements of effective conservation across all scales, provide guidance as to what tools could help achieve those elements, and clearly define key terms and concepts that are often vaguely defined or used differently by different people. The Open Standards involve five steps that comprise the project management cycle (Figure 2):
1. Conceptualize what you will achieve in the context of where you are working.
2. Plan both your Actions and Monitoring.
3. Implement both your Actions and Monitoring.
4. Analyze your data to evaluate the effectiveness of your activities. Use your results to Adapt your project to maximize impact.
5. Capture and Share your results with key external and internal audiences to promote Learning.
Figure 2. CMP Open Standards Project Management Cycle Version 2.0
Conservation Measures
PartnershipOpen Standards
Develop work plan and timelineDevelop and refine budgetImplement plans
3. Implement Actions and Monitoring
Document learningShare learningCreate learning environment
5. Capture and Share Learning
Define initial teamDefine scope, vision, targetsIdentify critical threatsComplete situation analysis
1. Conceptualize
2. Plan Actions and Monitoring
Develop goals, strategies, assumptions, and objectivesDevelop monitoring planDevelop operational plan
Prepare data for analysisAnalyze resultsAdapt strategic plan
4. Analyze, Use, Adapt
Although CMP (as well as this manual) presents the Standards as a sequential series of steps, the entire process is rarely applied in a linear fashion from start to finish – instead it is typically only a rough approximation of the more complex series of back-and-forth movements that a project goes through. Moreover, the Standards are not meant to be a rigid set of standards that every project must blindly follow, but rather a set of best practices that conservation practitioners can use to make their work more effective and efficient.
Conceptualizing and Planning Conservation Projects and Programs 11
© Foundations of Success 2009
By applying the Open Standards for the Practice of Conservation, managers and practitioners of all levels will have greater confidence in the content of the work, their ability to adaptively manage and their ability to share with others what works and what does not work. The use of these standards should also help increase the confidence of investors and constituents that conservation teams are improving the way they manage projects and applying what they learn within their teams, as well as what they learn from others.
Some References
Conservation Measures Partnership. 2007. Open Standards for the Practice of Conservation. Version 2.0. Available through http://www.conservationmeasures.org.
Margoluis, Richard, and Nick Salafsky. 1998. Measures of Success: Designing, Managing, and Monitoring Conservation and Development Projects. Island Press, Washington, D.C.
Salafsky, Nick, Richard Margoluis, and Kent Redford. 2001. Adaptive Management: A Tool for Conservation Practitioners. Biodiversity Support Program, Washington, D.C. Available through: http://www.fosonline.org/Site_Docs/AdaptiveManagementTool.pdf.
Assignment 1.1: Describe what you want to achieve in this course The training modules for implementing the Open Standards are designed to facilitate learning and positively impact your work. To get the most out of these modules, you should think about how you will apply new knowledge and skills in your job. We also strongly encourage you to do the steps in this module with your colleagues so that your entire team participates in the planning process, making it more likely that the products from this module will be used by your team.
Please answer the following questions:
1. Why do you need this module (for current or future position)?
2. What knowledge and skills do you hope to acquire to help you to take action?
3. In what situations do you plan to apply what you have learned?
4. What results do you expect from doing so?
For participants working in teams, please answer the following three additional questions:
5. Who is the leader for the team enrolled in this online module?
6. How will your team share responsibility for completing the assignments?
7. What steps will you take to ensure that all team members are able to participate equally and achieve maximum benefit from their participation?
Hand in Assignment 1.1 Note: Week 1 requires reading and assignments for two sections. Please continue to the next section and complete Assignment 1.2.
Conceptualizing and Planning Conservation Projects and Programs 12
© Foundations of Success 2009
Step 1A: Define Initial Project Team (Week 1)
Introduction to Initial Project Team Conservation does not happen on its own. Individuals and groups of individuals are the engines behind any conservation project or program. The most important resources for any conservation project are the people who will be involved in designing and implementing it. Their commitment and skills will influence how effective the project can be. As such, it is important to choose your project team members carefully. Defining the initial project team is a step that some organizations overlook or do not consider carefully. For example, organizations often hire project personnel as a project develops, rather than from the outset determining what skills are needed and the necessity of going outside the team to obtain those skills versus identifying and/or building the skills within the team. In some cases, tight budgets or poor management may mean that one person or a small group of people is hired and then charged with the daunting task of coordinating the project, as well as doing much of the technical work for the project. Despite these realities, it is important to give careful consideration to your project team composition and, where possible, push your organization to recognize the importance of this step. Project team members should include representatives from the implementing organization, but, they should not necessarily be confined to the organization. There may be individuals from other organizations, interest groups, or communities who should be part of the team. Being outside of the organization might mean these individuals play a different role on the team, but they may still be key to the implementation of your project. Your team will likely evolve over time, but typical configurations include: Initial Project Team – The specific people who initially conceive of and initiate the project.
They may or may not go on to form the core project team.
Core Project Team – A small group of people (typically 3-8 people) who are ultimately responsible for designing and managing a project. Often, there is much, if not complete, overlap with the initial project team.
Full Project Team – The complete group of people involved in designing, implementing, monitoring, and learning from a project. This group can include managers, stakeholders, researchers, and other key implementers. You need a wide range of skills on your project team.
Standard roles for team members include:
Project Leader/Manager – Although leadership responsibilities are often shared between team members, one individual is usually appointed as the overall project leader. Specific roles that leader often plays include managing the performance of other team members, relations with key stakeholders, and the process of going through the project cycle.
Team Contact – This might be the same person as the leader or manager, or it may be an
Conceptualizing and Planning Conservation Projects and Programs 13
© Foundations of Success 2009
individual with administrative or communications functions who coordinates with the broader team and those outside of the team.
Project Advisors – People who are not on the project team, but to whom the team members can turn for honest feedback and counsel and who can champion your cause.
Project Stakeholders – Individuals, groups, or institutions who have a vested interest in the natural resources of the project area and/or who potentially will be affected by project activities and have something to gain or lose if conditions change or stay the same. Just because someone is a stakeholder does not mean that you will want them on your project team. But if they are a key stakeholder, you also cannot ignore them in your analyses of the situation. Cultivation of relationships with key stakeholders can be a long process itself that may have to begin well before your project gets underway.
Process Facilitator – A person who can help the project team through the planning process. A process facilitator is typically part of the initial and/or the core team. A good facilitator understands the key elements of the process, has good facilitation skills, and can keep your team from getting too bogged down in any one part of the process. This person does not need to be a “professional” facilitator, but should be someone who is intimately familiar with applying the planning process to “real-world” conservation problems.
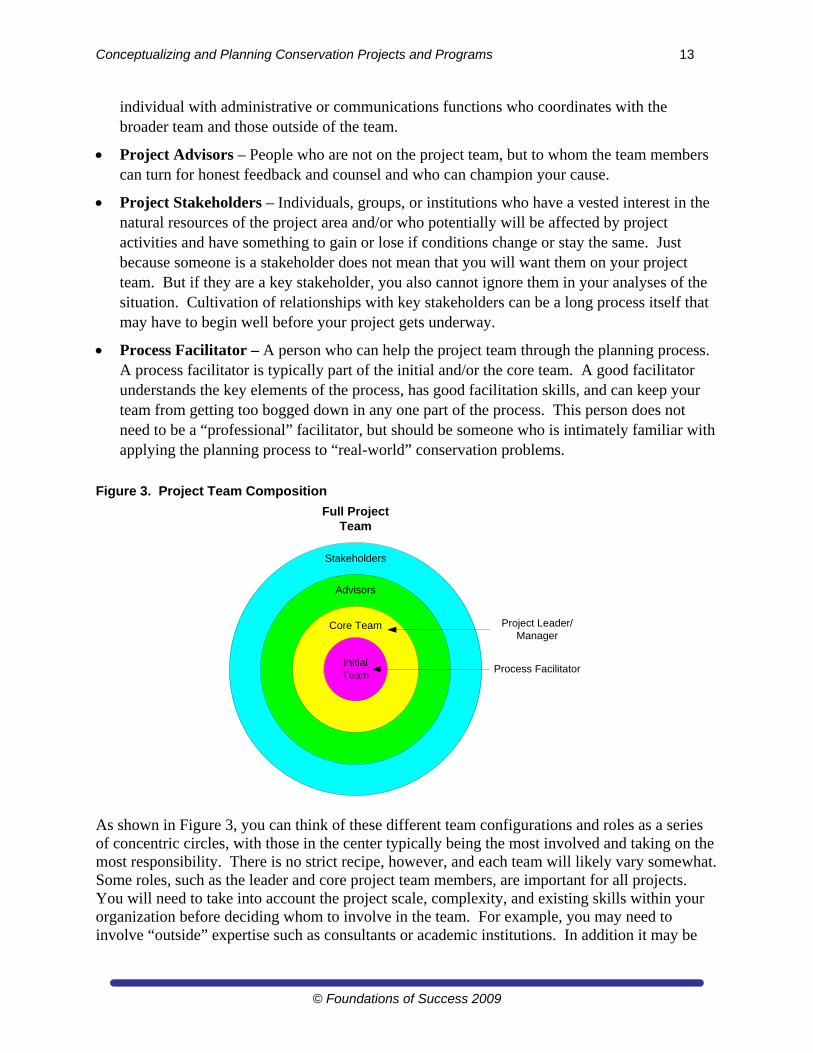
Figure 3. Project Team Composition
Initial Team
Core Team
Advisors
Stakeholders
Full Project Team
Project Leader/Manager
Process Facilitator
As shown in Figure 3, you can think of these different team configurations and roles as a series of concentric circles, with those in the center typically being the most involved and taking on the most responsibility. There is no strict recipe, however, and each team will likely vary somewhat. Some roles, such as the leader and core project team members, are important for all projects. You will need to take into account the project scale, complexity, and existing skills within your organization before deciding whom to involve in the team. For example, you may need to involve “outside” expertise such as consultants or academic institutions. In addition it may be
14 Foundations of Success
© Foundations of Success 2009
important to involve key partners with whom you may expect to collaborate in the future. This can help you to build ownership or buy-in for the project. It is worth taking into account that such partners (especially external partners) may have different priority issues in mind and you may need to take extra time to conceptualize and plan the project with them. As with many steps in the planning phase, there is no right decision regarding whom to include in your project team, but the decisions that you do make will ultimately affect what your project will do.
How to Define Your Initial Project Team You should define your initial project team at the start of the project. This team should then quickly identify the core and/or full project teams. The composition of the project team may change as you move through the management cycle, although it is usually helpful to maintain continuity of some key members. The following steps are described sequentially, but in practice they are interdependent and are often developed in parallel or iteratively. 1. Appoint a Leader and the Initial Team and Sketch Out Project
Bring together the people who are charged with initiating the project. Have the team quickly (in an hour or two at the most) sketch out the scope of the project and generally what you are interested in conserving, how you think you might do that, and who are likely to be your key stakeholders. You should also keep in mind your timeline and the required and available resources. As you finalize your strategic plan and develop your workplan, you will address these matters in greater detail. For now, you just need to have a rough sketch of your project to give you an idea of what skills your project team needs and which individuals and organizations might need to be on the project team. 2. Select Project Team Members
Based on this initial analysis, think about who would be good to have on your core project team, who might be good as an advisor, and who you should avoid having directly involved in your project. Ideally, you want your team to have a mix of different knowledge, skills, and experience that include:
Knowledge of biodiversity and threats to the biodiversity
Knowledge of and experience with the political, social and economic context
Knowledge of and experience with stakeholders and their concerns
Skills and experience in developing strategies
Skills and experience in implementing strategies
Skills and experience in project monitoring and evaluation
Skills and experience in communications and fundraising
Skills and experience in budgeting and risk assessment
Again, reality may limit the extent to which you will be able to cover all of these skills within your project team. The list above represents an ideal – you and your project team may have to
Conceptualizing and Planning Conservation Projects and Programs 15
© Foundations of Success 2009
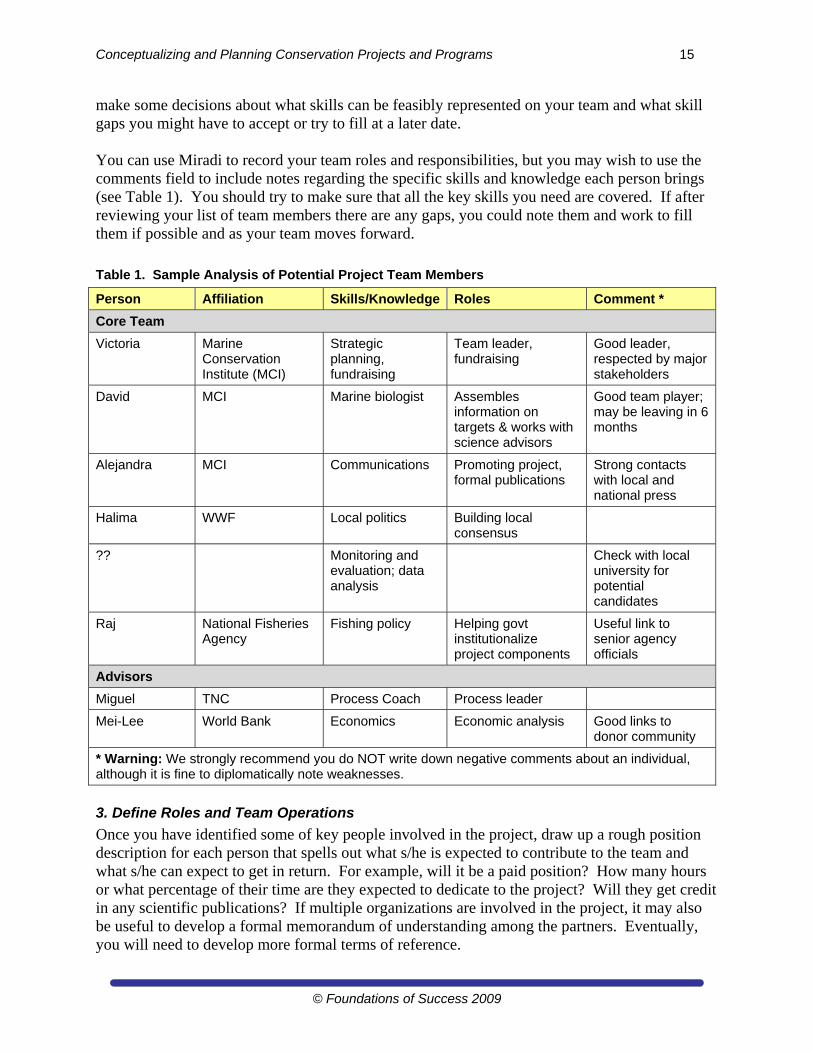
make some decisions about what skills can be feasibly represented on your team and what skill gaps you might have to accept or try to fill at a later date. You can use Miradi to record your team roles and responsibilities, but you may wish to use the comments field to include notes regarding the specific skills and knowledge each person brings (see Table 1). You should try to make sure that all the key skills you need are covered. If after reviewing your list of team members there are any gaps, you could note them and work to fill them if possible and as your team moves forward.
Table 1. Sample Analysis of Potential Project Team Members
Person Affiliation Skills/Knowledge Roles Comment *
Core Team
Victoria Marine Conservation Institute (MCI)
Strategic planning, fundraising
Team leader, fundraising
Good leader, respected by major stakeholders
David MCI Marine biologist Assembles information on targets & works with science advisors
Good team player; may be leaving in 6 months
Alejandra MCI Communications Promoting project, formal publications
Strong contacts with local and national press
Halima WWF Local politics Building local consensus
?? Monitoring and evaluation; data analysis
Check with local university for potential candidates
Raj National Fisheries Agency
Fishing policy Helping govt institutionalize project components
Useful link to senior agency officials
Advisors
Miguel TNC Process Coach Process leader
Mei-Lee World Bank Economics Economic analysis Good links to donor community
* Warning: We strongly recommend you do NOT write down negative comments about an individual, although it is fine to diplomatically note weaknesses.
3. Define Roles and Team Operations
Once you have identified some of key people involved in the project, draw up a rough position description for each person that spells out what s/he is expected to contribute to the team and what s/he can expect to get in return. For example, will it be a paid position? How many hours or what percentage of their time are they expected to dedicate to the project? Will they get credit in any scientific publications? If multiple organizations are involved in the project, it may also be useful to develop a formal memorandum of understanding among the partners. Eventually, you will need to develop more formal terms of reference.
16 Foundations of Success
© Foundations of Success 2009
It is also helpful to decide how your team will operate. Team operations will include everything from how you will communicate and how often you will meet to how you will make decisions. It also includes how you will move through each step in the project management cycle. For projects to have a lasting impact, it is usually necessary to produce a robust strategic plan. If you already have (or think you have) a good idea of what needs to be done, you may decide to take a “fast project management” approach and move quickly through the early project cycle steps and into implementation. This does not mean abandoning processes, but it does mean working through the project cycle quickly and efficiently. On the other hand you may decide (or need) to work through each step of the project cycle systematically and in detail. Alternatively you may use a combination of these approaches to achieve a balance between process and action – for example you move forward quickly on implementing some tasks that are very clear while developing a robust design and plan for the wider project. 4. Get Institutional Buy-In or Approval Before Moving Forward
Hopefully, you are doing all the steps in the Open Standards with your project team. This is critical to ensuring your team’s buy-in to the process and the plan that you will design. It is also important to get buy-in at higher levels as well. Your team may be convinced it has the best project to address a particular threat, but if no one else in your office or higher level offices agrees, the project is unlikely to progress. It is particularly important to get this buy-in early on to help guarantee that the time and resources you spend on planning your project will not go to waste.
Some References
TNC. 2007. Identify People Involved. Conservation Action Planning: Basic Practice 1. Available from: http://conserveonline.org/workspaces/cbdgateway/cap/practices/index_html.
WWF. 2006. Step 1.1 Define Project/Programme Team Composition and Operations. Resources for Implementing the WWF Project & Programme Standards. Available from: http://www.panda.org/what_we_do/how_we_work/conservation/programme_standards.
Assignment 1.2 – Define Your Initial Project Team
For your project, identify your team leader, your core project team, their roles, and the knowledge and skills that each person brings. Use Miradi, including the comments field, to record this information.
Note if there are any key skill sets missing and how you will try to fill those gaps. If you do not have individuals with the required skills, you can use a dummy entry in Miradi (e.g., “To be determined”) to create a space for a future individual.
In a separate Word document, briefly reflect on the process of identifying your project team and any challenges you see going forward (1 paragraph, maximum).
Export your Miradi file as aMiradi zip (.mpz) file. Hand in your assignment (Word document + mpz file) as Assignment 1.2.
Conceptualizing and Planning Conservation Projects and Programs 17
© Foundations of Success 2009
Step 1B. Define Scope, Vision, and Targets (Week 2) Structure for Week 2. In this week you will:
Read the Introduction to Project Scope and Vision, How to Define Project Scope and Vision and Examples of Project Scope and Vision.
Hand in Assignment 2.
Introduction to Project Scope and Vision A project’s scope defines the broad parameters of the project – whether that project is an ecoregional program, an effort to conserve a priority area, an initiative to combat a particular threat, or actions to protect a species. Efforts to conserve or effectively manage ecoregions, priority areas, or protected areas typically have a geographic scope or project area. Efforts to address threats, enabling conditions, or species have a thematic scope, although one could argue that projects with a thematic scope also operate under some broad geographic boundary (Box 2). A clear scope sets the rough boundaries for what the project will attempt to do. For example, in a project with a geographic scope that encompasses a specific protected area and its legally designated buffer zone, the project scope makes it clear that the team is focusing only on that area and the biodiversity it encompasses. Wildlife or natural areas that fall outside of that protected area and buffer zone – no matter how important – would not be part of that project’s scope. Likewise, a project with a thematic scope to decrease the threat of elephant poaching for tusks makes it clear that the project team will focus only on elephants (not rhinos or other horned or threatened species) and that it is concerned about the poaching of elephant for tusks. Thus, it should not focus on other threats like revenge killing for crop damage. In reality, there may be some fuzzy boundaries, but a project scope should help a team focus its efforts.
Box 2. Do You Have a Geographic or Thematic Scope?
Geographic scopes encompass efforts to conserve or
manage ecoregions, priority areas, or protected areas (i.e.,
specific geographic areas).
Thematic scopes include efforts to address specific threats,
enabling conditions, or species, generally over a broad
geographic region.
Some teams can become confused about whether they have
a geographic or a thematic scope. A team working in a
specific watershed might reason that they have a thematic
scope because they want to address the threat of urban
development in the watershed. In reality, the scope is
geographic. The watershed is the scope, and the team has
chosen to work on one threat (and presumably others)
affecting that watershed.
There, however, may be a project team that is working to
protect wetlands across Europe. Their sole focus is on
wetlands, and they cover a geographically broad area. In
this case, the team has a thematic scope – wetlands in
Europe. One could also reason that their scope is
geographic – Europe. In this case, however, they have only
identified one element of biodiversity they are interested in
conserving. They are not interested in all biodiversity
throughout Europe, but rather only wetlands.
Whether your scope is technically geographic or thematic is
less important than being clear and specific about how you will bound your project.
18 Foundations of Success
© Foundations of Success 2009
A project’s vision is the desired state or ultimate condition that the project is working to achieve. It is typically expressed in a vision statement, which is a clear and brief summary of what the project team members and their partners would like to achieve. For most conservation projects, the vision will describe the desired state of the biodiversity or resources in the project area, although it will often reference stakeholder interests as well. Your project’s vision should guide your project team and also help you communicate what you are trying to accomplish to outside stakeholders. Defining a vision enables the core project team members to discuss and agree on what the broad purpose of their project will be. Although this should be a relatively easy task in many conservation projects, it becomes particularly important in multi-stakeholder efforts in which the different partners may have radically different ideas of what they would like to accomplish. If some of the stakeholders are interested in conservation and others are primarily interested in
using natural resources to promote rapid economic development, then at the very least, the team needs to negotiate how it will work together. Without clear boundaries, there may be considerable confusion among staff and stakeholders as to where the project ends, and there is a risk of being drawn into an ever-widening circle of interventions. A well-crafted vision statement grabs and directs the project team’s attention, sets their agenda, and energizes their work. This statement becomes the common starting point for discussion about more specific activities and outcomes.
How to Define Project Scope and Vision Defining your project’s scope involves agreeing as a team on the basic parameters of your project: 1. Discuss with Your Team the Basic Scope of Your Project
If your project has a geographic scope, then it is necessary to define your project area – the place where the biodiversity of interest to the project is located. This may be a national park, a landscape or ecoregion, or some other operating unit your organization might use. Often the project area is defined by natural landscape boundaries (a watershed or an estuary), political boundaries (a province, state or country) or the boundaries of one or more protected areas (a marine reserve or a national park and adjacent forest reserve). In some cases, you may need to define your conservation targets (see Week 3 of this module) before coming to a final decision about the geographic boundaries of your project. If you are working in a watershed, for example, you may be interested in conserving a forested area that stretches from your watershed into a neighboring basin. Thus, you may define your project scope as the watershed and the
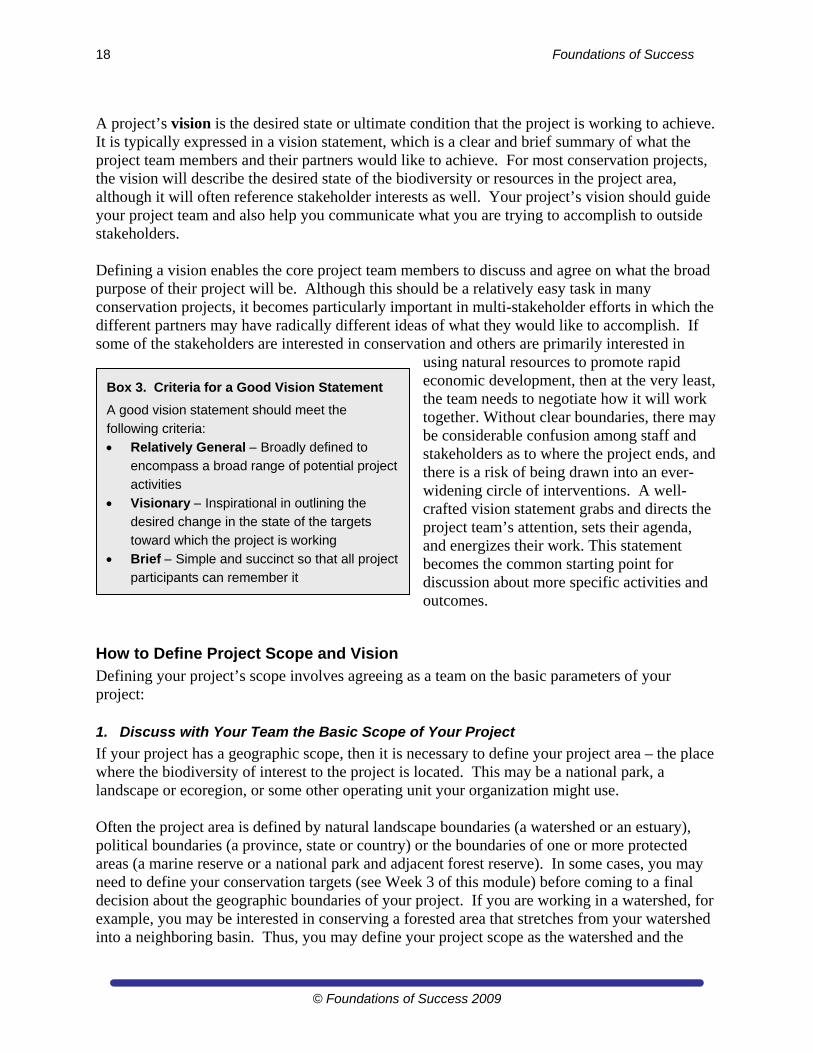
Box 3. Criteria for a Good Vision Statement
A good vision statement should meet the
following criteria:
Relatively General Broadly defined to
encompass a broad range of potential project
activities
Visionary Inspirational in outlining the
desired change in the state of the targets
toward which the project is working
Brief Simple and succinct so that all project
participants can remember it
Conceptualizing and Planning Conservation Projects and Programs 19
© Foundations of Success 2009
portion of the neighboring watershed encompassing the forest. In this case, the definition of your targets would cause you to extend the geographic boundaries of your project scope beyond the watershed. Projects with a thematic scope may not focus on a specific or narrowly-defined geographic area. Instead, they may focus on a population of wide-ranging animals, such as migratory birds, mammals or sea turtles. WWF’s Asian Rhino and Elephant Action Strategy Programme (AREAS) is an example of a project with a thematic scope. Thematic projects may also focus on certain ecological systems, such as forests, or issues such as illegal trade of rare and endangered species. Examples of thematic projects include TNC’s Global Fire Initiative and TRAFFIC. Although defining your project scope is a very important step, you should not overcomplicate it. It is a relatively straightforward process of simply specifying where you are going to work (your geographic scope). Or, if you are dealing with an issue, species, or ecosystem-based project that transcends broad geographic boundaries, then you should define your scope by that issue, species, or ecosystem (thematic scope). If there is any doubt about the basic scope of your project, then discuss the options with the members of your project team and see if you have at least a general consensus. If you cannot arrive at some basic consensus, then you need to seriously reconsider whether you should split into multiple projects. 2. If Appropriate, Develop a Map of Your Project Area
Most place-based conservation projects will typically focus on biodiversity and resources in a defined project area and have a geographic scope. In these cases, you should map out the area
and include any relevant features (e.g., different ecosystems or habitats, corridors, villages). You can use something as sophisticated as mapping software or as simple as a rough hand-drawn sketch. As shown in Box 4, it is not always obvious where the team should draw the project boundaries, but the choice that the project team makes will have profound consequences for the ongoing structure and functioning of the project. Indeed, you define your project by the project area you select, rather than
vice versa. Note that in many cases, project actions may take place outside of the defined project area – for example, political action designed to affect a protected area in a remote province would take place in a national capital. Projects with a thematic scope may also find it useful to develop a project map. For example, a project focusing on conserving wide-ranging species (e.g., Sumatran tiger or Siberian crane) may be able to identify specific locations on a map where they have critical breeding or feeding sites. Likewise, a thematic project on wetlands may be able to define the highest priority wetlands in a country or region.
Tip! You can use Google Maps to develop a rough sketch of your project area. See http://maps.google.com (select My Maps, and then Create New Map). Even a very rough map will serve as a powerful visual tool.
20 Foundations of Success
© Foundations of Success 2009
3. Develop A Draft Vision Statement For Your Project.
A vision is a general summary of the desired state or ultimate condition of the project area or scope that a project is working to achieve. If all the members of your project team agree that the project is focused on biodiversity conservation, drafting a vision should be relatively easy. Depending on the size and makeup of your project team, you might want to have the whole team work on drafting the vision or designate a subcommittee to create a draft statement. If your project area were the Mesoamerican Caribbean Reef (see Box 4), then your initial draft might be:
Diverse ecosystems of the Mesoamerican Reef conserved
If you are part of a multi-sectoral team, then you may find it challenging to draft a shared vision statement. For example, if there are members of your project team (including partners) who believe that the ultimate vision of the project should not be biodiversity conservation, but instead other aims such as “improving human welfare” or “conserving open space,” then crafting a vision statement becomes a much more difficult exercise. This is especially so if realizing
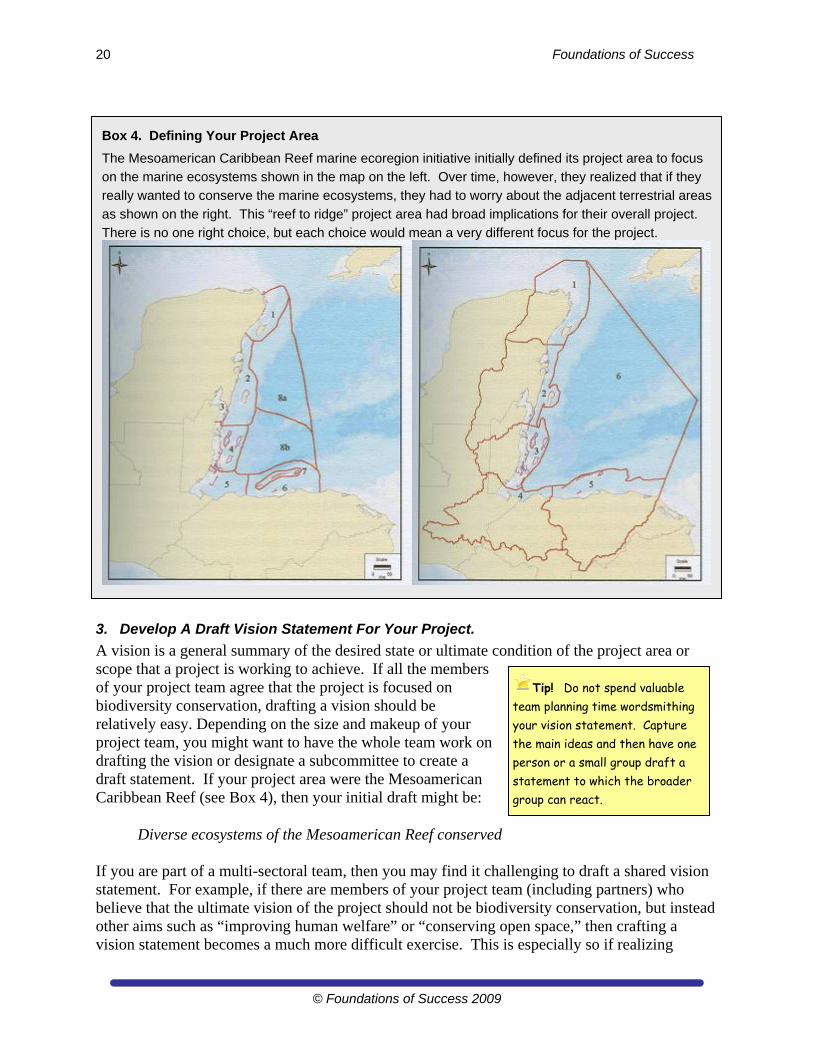
Box 4. Defining Your Project Area
The Mesoamerican Caribbean Reef marine ecoregion initiative initially defined its project area to focus
on the marine ecosystems shown in the map on the left. Over time, however, they realized that if they
really wanted to conserve the marine ecosystems, they had to worry about the adjacent terrestrial areas
as shown on the right. This “reef to ridge” project area had broad implications for their overall project.
There is no one right choice, but each choice would mean a very different focus for the project.
Tip! Do not spend valuable team planning time wordsmithing your vision statement. Capture the main ideas and then have one person or a small group draft a statement to which the broader group can react.
Conceptualizing and Planning Conservation Projects and Programs 21
© Foundations of Success 2009
different visions ultimately requires implementing different (and potentially conflicting) strategies. As an extreme example, consider a project in which some team members want to conserve a forest for its biodiversity values and others want to “sustainably” log it for its economic values. The project team here will either have to figure out how to reconcile these two visions or split their work into two separate projects. In this case, you may have to go through a much more formal process of developing a vision statement that might include:
Soliciting unique submissions from individuals on paper;
Crafting a draft proposal based on the submissions, attempting to include elements of the major ideas in the submissions;
Vetting the draft with the larger group;
Redrafting the vision statement; and
Securing final approval by the group.
4. Review the Criteria for a Good Vision Statement and Determine Whether Your Vision Statement Meets the Criteria
Take your draft statement and go through your criteria, one by one. Working off of the example above, your project team should ask itself:
Is it relatively general? Yes, it is general enough to encompass a broad range of current and potential activities.
Is it brief? Yes, it is certainly brief.
Is it visionary? No, it is not really inspirational. This criterion is subjective - what is visionary to one group may not seem at all inspirational to another. Nevertheless, it seems that the vision statement needs more work to meet this criterion.
5. Modify Your Draft Vision Statement As Needed To Make Sure It Complies With The
Criteria For A Good Vision Statement
For this example, you would need to work on making it more visionary. Your second draft might read:
Diverse ecosystems of the Mesoamerican Reef conserved, thus providing sustainable livelihoods for local people, while preserving one of the world’s great natural treasures.
This revised vision is more inspirational and captures the reasons why your team is working to conserve the diverse ecosystems of this marine site. The extent to which biological and social values dominate or share space in the vision statement will have implications for what strategies are prioritized.
6. Revisit Your Vision Statement As Your Project Evolves
Finally, it is important to remember that vision statements may evolve as new information becomes available, stakeholders change, or aspriations change. Vision statements should be viewed as living statements that can change iteratively as planning and implementation proceed.
22 Foundations of Success
© Foundations of Success 2009
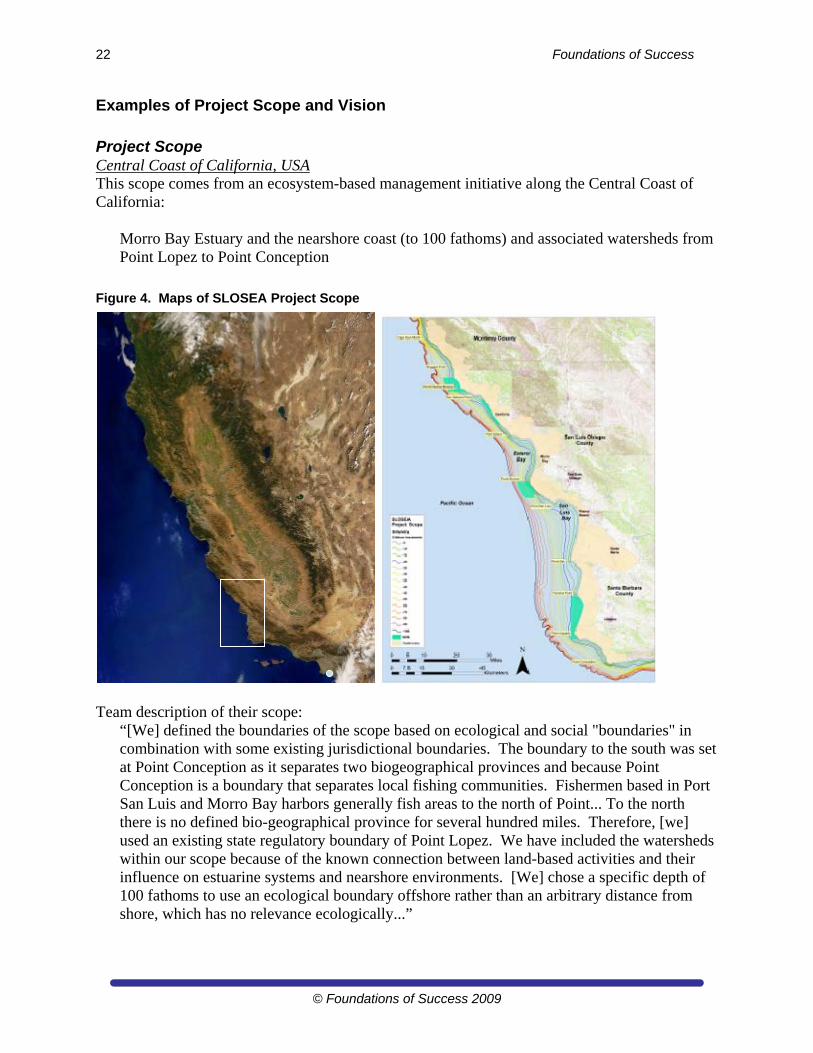
Examples of Project Scope and Vision
Project Scope Central Coast of California, USA This scope comes from an ecosystem-based management initiative along the Central Coast of California:
Morro Bay Estuary and the nearshore coast (to 100 fathoms) and associated watersheds from Point Lopez to Point Conception
Figure 4. Maps of SLOSEA Project Scope
Team description of their scope:
“[We] defined the boundaries of the scope based on ecological and social "boundaries" in combination with some existing jurisdictional boundaries. The boundary to the south was set at Point Conception as it separates two biogeographical provinces and because Point Conception is a boundary that separates local fishing communities. Fishermen based in Port San Luis and Morro Bay harbors generally fish areas to the north of Point... To the north there is no defined bio-geographical province for several hundred miles. Therefore, [we] used an existing state regulatory boundary of Point Lopez. We have included the watersheds within our scope because of the known connection between land-based activities and their influence on estuarine systems and nearshore environments. [We] chose a specific depth of 100 fathoms to use an ecological boundary offshore rather than an arbitrary distance from shore, which has no relevance ecologically...”
Conceptualizing and Planning Conservation Projects and Programs 23
© Foundations of Success 2009
Vision Statements Examples of inspirational vision statements, developed in workshop settings include the following: Central Coast of California, USA
“A healthy, resilient coastal ecosystem that provides for thriving and interacting populations of plant, animal and human communities.”
Yangtze Basin
“A region where a living river links the Tibetan Plateau and the Pacific; where people thrive in harmony with nature, pandas play in the forests, children swim with dolphins and fish in the clear water, pheasants dance among the rhododendrons, and the cranes sing at sunrise. A region where natural cycles sustain a rich and ancient culture.”
Bering Sea This vision is much longer than we would recommend, but the essence of the vision statement is in the first one or two sentences and it is certainly inspirational:
“Our vision of the Bering Sea is to ensure that species assemblages and abundances, community structure and ecological phenomena are maintained or restored within their natural ranges of variation. Within this long-term vision, the cultural diversity of indigenous peoples is a vital part of Bering Sea biodiversity. People locally and globally recognize the unique value of the Bering Sea and are committed to conserving it. This also requires working together to minimize or eliminate the impacts of alien species and ensure there are no further human caused global or local extinctions.”
Javan Rhino Project
“The long-term survival of Javan Rhinos in and around Rhino National Park ensured for future generations.”
Some References
Margoluis, Richard, and Nick Salafsky. 1998. Measures of Success: Designing, Managing, and Monitoring Conservation and Development Projects. Chapter 2. Island Press, Washington, D.C.
TNC, 2007. Guidance for Step 2: Define Project Scope & Focal Conservation Targets. In Conservation Action Planning Handbook: Developing Strategies, Taking Action and Measuring Success at Any Scale. The Nature Conservancy, Arlington, VA. Available from: http://conserveonline.org/workspaces/cbdgateway/cap/resources/2/1/handbook
WWF. 2006. Step 1.2. Define Project Scope and Vision. Resources for Implementing the WWF Project & Programme Standards. Available from: http://www.panda.org/what_we_do/how_we_work/conservation/programme_standards.
24 Foundations of Success
© Foundations of Success 2009
Assignment 2 – Define Project Scope and Vision
For your project, please define the geographic or thematic project scope. Remember, this is an important step, but you should not make it unnecessarily complicated.
Record this and the rest of the information for this assignment in the Scope tab in Summary view within Miradi.
If you wish, you can also fill out other fields in this tab, as well as fields in the location tab. This is optional.
Develop or provide a map of your project area. This could be GIS-generated, a rough sketch in Google Maps, or a hand-drawn map. If you have a hyperlink to an existing map with well-defined boundaries, you can simply record that information in Miradi. Otherwise, please provide your facilitator with a copy of a map.
Develop a vision statement for your project, ensuring it complies with the criteria for a good vision.
In a separate Word document, briefly reflect on the process of defining your project scope and vision. What decisions did you need to make? Did you expand or contract your scope based on those decisions? Do you see any value to being specific about your scope and vision? Any drawbacks? (1-2 paragraphs, maximum)
Export your Miradi file as an mpz file.
Hand in your assignment (Word document + map + mpz file) as Assignment 2.
Conceptualizing and Planning Conservation Projects and Programs 25
© Foundations of Success 2009
Step 1B. Define Scope, Vision, and Targets (Week 3)
Structure for Week 3. In this week you will:
Read Introduction to Conservation Targets, How To Develop and Use Conservation Targets and Examples of Conservation Targets.
Hand in Assignment 3
Introduction to Conservation Targets The biodiversity at all conservation sites is a complex combination of genes, species, and ecological systems. Although most conservation teams want to conserve this entire complex system, they typically lack the staff, financial, and time resources to explicitly focus on all elements of biodiversity within the system. For this reason, when planning and monitoring conservation projects, it is useful to select a handful of “conservation targets” that can represent the overall biodiversity at your site. Doing so helps teams focus their efforts and resources and more easily assess whether their conservation efforts are effective over the long term. Choosing targets is a valuable step for all projects, irrespective of scale. Defining conservation targets sets the groundwork for subsequent steps, such as a practical and focused threats analysis, strategy development, and long-term monitoring. In addition, targets will help teams set goals for their project, as each target should have a goal associated with it (as well as multiple objectives and strategies that feed into it). Targets can be ecosystems or species. Project teams generally select a limited number of ecosystem and species targets to collectively represent the full suite of biodiversity in the project area.
Ecosystems – These targets include habitats or ecological systems that characterize or support the terrestrial, aquatic, and marine biodiversity of the project site. Examples include native grasslands, highland paramo, riparian forest, and coral reef. A small site may have only a few ecosystem types, in which case they can all be included as targets. A large complex site might have many different ecosystem types, in which case a subset will have to be selected as targets to represent the whole.
Species – This category could include species endemic to an ecoregion, area-sensitive species (including umbrella species), commercially exploited species, flagship species, keystone species, or imperilled species.5 Thus, mountain gorillas, humphead wrasse, tigers, snow leopards, Mekong catfish, minke whales, or Himalayan poppies are all examples of species whose population structure and trajectories could be used to help measure a project’s success (or lack thereof). Species selected as targets are typically those that are not represented by the key ecosystems because they require multiple ecosystems, have special conservation requirements, or are subject to threats that affect the larger ecosystem less directly (e.g., hunting). In many cases, it may be useful to group individual species into broader communities or ecological guilds
5 Note: An “indicator species” should not be a conservation target per se. Indicators species may be used to monitor the health of other ecosystems or species that are conservation targets.
26 Foundations of Success
© Foundations of Success 2009
The target selection process is based on the coarse filter/fine filter strategy. Coarse filter targets are those key ecosystems that, when conserved, also conserve the majority of species within the project area. The fine filter is composed of species and communities that are not well captured by coarse filter targets, and require individual attention. These targets may be rare, face unique threats, or require unique strategies. In theory – and hopefully in practice – conservation of the targets will ensure the conservation of all native biodiversity and key natural resources within the project site. Selection of conservation targets typically requires input from experts and analysis of spatial data.
How to Develop and Use Conservation Targets Developing and using conservation targets involves identifying a representative suite of ecosystems and/or species your project will follow over the long term to gauge the status of biodiversity and resources at your site and the impact your actions are having. 1. List Potential Targets There is no prescribed way to develop a list of conservation targets that are representative of the biodiversity or natural resources at your site. How many targets to identify depends on the size of your project site, its ecological complexity, and whether you are engaged in spatial planning and priority setting or strategy and monitoring plan development (the latter of which requires you to get more specific). When trying to conserve the full expression of biodiversity of an ecoregion, there is a tendency to include too many conservation targets to realistically measure. Since most conservation programs lack the resources to measure so many indicators, it is important to keep the overall number of targets to a manageable level. Begin by listing any ecosystems you would like to include as targets, since these target types tend to include the majority of biodiversity in a given site. Next add any species or groups of species that are subject to threats that would continue even if the ecosystems you identified were not conserved (e.g., hunting, fishing, disease; See Step 2 below for additional details). Regardless of the size of your site, it is almost always possible to select a focused list of up to 8 targets that best capture both the biodiversity of the project site, as well as important threats and key conditions for success.6 For large ecoregions, you may find it helpful to have one or two additional targets, but we strongly recommend you do not identify greater than 10. Typically, these targets, be they keystone species or representative ecosystem types are vital to your efforts because they also have a considerable umbrella effect in determining conservation success; conserving or restoring these targets will allow you to conserve many other targets not explicitly selected.
6 This seemingly magical number of 8comes from years of experience The Nature Conservancy has had planning and designing conservation projects over thousands of sites.
Conceptualizing and Planning Conservation Projects and Programs 27
© Foundations of Success 2009
2. Review Your Initial List of Targets and “Lump” or “Split” Targets As Necessary As a general rule, you will want to lump several targets into one if they:
Co-occur on the landscape,
Share common ecological processes,
Share similar critical threats, and therefore
Require similar conservation strategies.
Box 5. When to Lump and When to Split?
Deciding whether to lump or split targets can seem somewhat confusing. The decision is not always
clear-cut, but you should use the guidance in this document to help you determine what makes the most
sense for your site.
Some common examples of targets that could be split include:
Animal or plant species that are directly subject to hunting, fishing, or any other type of
harvesting. In such cases, conserving their habitat will likely not be sufficient to guarantee their
survival.
Plant or animal species that are threatened by disease or competition from non-native invasive
species. In this case, even if the surrounding habitat or ecosystem remain mostly intact, the
affected plant or animal species are likely to die out.
Specific wide-ranging or migrating species that might be subject to threats that fall outside of
your project area.
Politically important species or ecosystems that your team could use to generate public support
for your project (e.g., a charismatic animal such as a panda bear, a historically important or
symbolic species such as redwood trees).
Some common examples of targets that could be lumped include:
A forest block and its associated plant and animal species if the only factors that are affecting
the survival of the associated species are the health and area coverage of the forest. For
example, a target of “Andean paramo” might incorporate all the paramo grass and rodent
species because the species co-occur with the Andean paramo target, they require the same
ecological processes supported by a healthy Andean paramo system, and the threats to the
paramo itself (e.g., urban encroachment, agriculture) are the same as those affecting the grass
and rodent species. Thus, if the Andean paramo is conserved, then the team can be fairly
confident the associated grass and rodent species will also be conserved.
Groupings of animals or plants that share a common ecological process or behaviour. For
example, a team could lump the targets of mountain lions, wolves, and bears into one target –
“top predators.” Or a team might lump the Ferruginous Hawk, Long-billed Curlew, Cassin's
Sparrow, and other threatened migratory birds into one target – “Migratory prairie birds.”
Similarly, any species or ecosystem that falls under an umbrella species could be lumped with
that umbrella species. For example, if a team in Central Asia chooses snow leopards as their
conservation target, they might assume that they will also ensure the survival of the blue sheep
and the Asiatic ibex – two important species for snow leopard survival.
28 Foundations of Success
© Foundations of Success 2009
On the other hand, if a target contains species or ecosystems that do not meet the above criteria, you may want to think about splitting it. Target lumping and splitting may be refined later in the planning process as you rank your threats and develop strategies. See Box 5 for some examples of when to lump and split and TNC (2006) for a useful decision tree on lumping and splitting targets. 7 3. Select a Limited Number (8-10) of Targets Of the conservation targets identified through the above steps, select a limited number (preferably up to 8, but no more than 10) that have the following characteristics:
Represent the biodiversity at the site. The conservation targets should collectively represent or capture the array of ecological systems, communities, and species at the project area, and the multiple spatial scales at which they occur.
Reflect ecoregional or landscape-level conservation goals. Project teams working in larger organizations that support landscape or ecoregional portfolios should try to ground their target selection in priorities expressed in those larger portfolios.
Are viable or at least feasibly restorable. Viability (or integrity) indicates the ability of a conservation target to persist for many generations. If a target is on the threshold of collapse, or conserving a proposed target requires extraordinary human intervention, it may not represent the best use of limited conservation resources.
Are highly threatened. All else being equal, focusing on highly threatened targets will help ensure that critical threats are identified and addressed through conservation actions.
Note: An additional consideration for conservation target selection is the strategic value of a target. If the target could leverage other conservation actions or generate synergies among partner organizations, then it may be an important target to include.
Selecting conservation targets is almost always a group effort. One person is rarely knowledgeable enough to develop a robust list of representative targets on his/her own. A group of people with broad ecological knowledge of the region should discuss and reach agreement on some limited combination of conservation targets that are representative of the region as a whole. It is often useful to have a facilitator for this process. As you can see, we have stressed that your targets should be biodiversity-related. This does not mean that you will not or should not be using socio-economic actions to achieve the goals associated with your conservation targets. In fact, threats are generally caused by some social, economic, political, or cultural occurrence or situation. In order to counter the threats, your project will often need to use strategies to address the human element. For example, if you are trying to protect a particular species of monkey, you might identify small-scale hunting for commercial purposes as one of the direct threats to the monkey. This hunting may be driven, in part, by a need for income. Thus, your team may use an alternative income strategy to provide small scale commercial hunters with an alternative source of income. In this case, your intervention is a social one (alternative livelihood strategy), but your end goal is a biodiversity
7 Sometimes teams wish to highlight a specific component of a target and will “nest” that component within the broader target. This “nested” target is an ecosystem, species, or ecological process that is also conserved if the broader target within which it is found is conserved. See Annex 2 for an example and a more detailed explanation of nested targets.
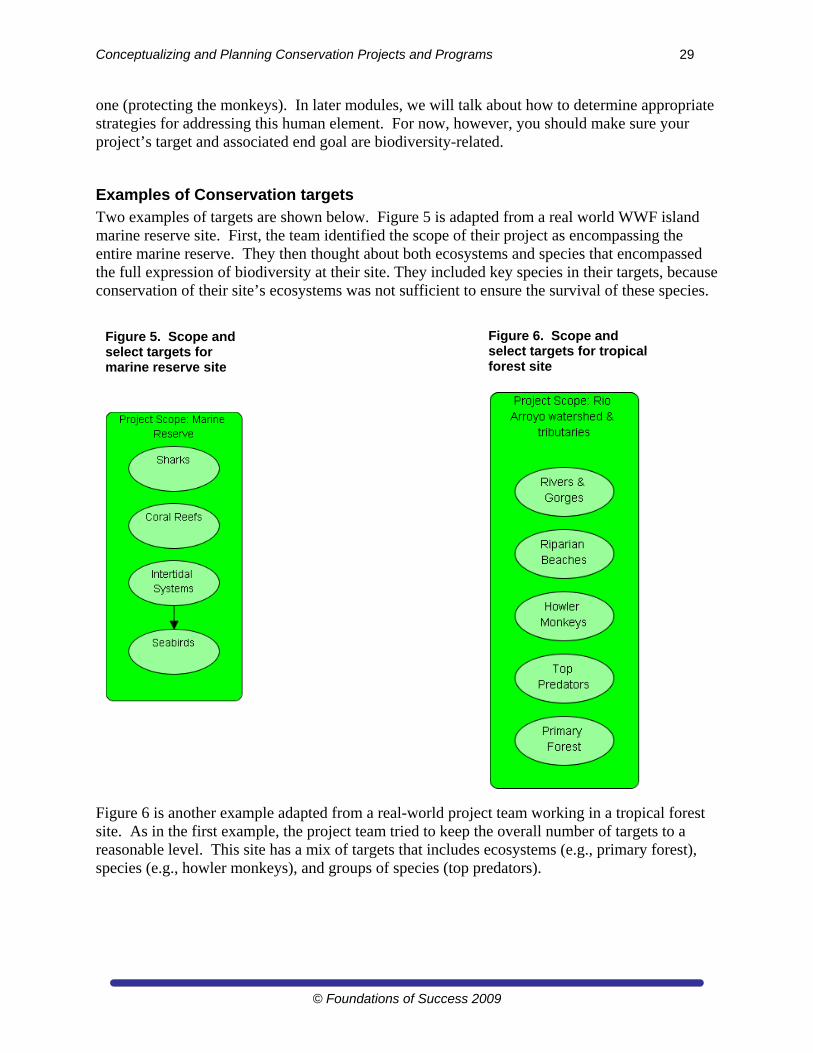
Conceptualizing and Planning Conservation Projects and Programs 29
© Foundations of Success 2009
one (protecting the monkeys). In later modules, we will talk about how to determine appropriate strategies for addressing this human element. For now, however, you should make sure your project’s target and associated end goal are biodiversity-related.
Examples of Conservation targets Two examples of targets are shown below. Figure 5 is adapted from a real world WWF island marine reserve site. First, the team identified the scope of their project as encompassing the entire marine reserve. They then thought about both ecosystems and species that encompassed the full expression of biodiversity at their site. They included key species in their targets, because conservation of their site’s ecosystems was not sufficient to ensure the survival of these species.
Figure 6 is another example adapted from a real-world project team working in a tropical forest site. As in the first example, the project team tried to keep the overall number of targets to a reasonable level. This site has a mix of targets that includes ecosystems (e.g., primary forest), species (e.g., howler monkeys), and groups of species (top predators).
Figure 6. Scope and select targets for tropical forest site
Figure 5. Scope and select targets for marine reserve site
30 Foundations of Success
© Foundations of Success 2009
Practice Exercise As a practice exercise, examine the following and determine which are conservation targets and which are not. Before looking at the footnote for answers, think about why they are or are not conservation targets. Scope: Amazon ecoregion Targets: a) Pink dolphins; b) Deforestation; c) Mamoré River and its tributaries; d) Flooding; e) Water pollution8 Scope: Gulf of California Targets: a) Sea lions’ breeding capacity; b) Sea turtle; c) Over fishing; d) Tourism; e) International markets9
Some References
The most extensive work about target selection comes from The Nature Conservancy. Key resources include:
Parrish, Jeffrey D., David P. Braun, and Robert S. Unnasch. 2003. Are We Conserving What We Say We Are? Measuring Ecological Integrity within Protected Areas. Bioscience 53: 851-860. http://sites-conserveonline.org/gpg/files/parrish_etal_bioscience_sep2003.pdf .
TNC, 2007. Guidance for Step 2: Define Project Scope & Focal Conservation Targets. In Conservation Action Planning Handbook: Developing Strategies, Taking Action and Measuring Success at Any Scale. The Nature Conservancy, Arlington, VA. Available from: http://conserveonline.org/workspaces/cbdgateway/cap/resources/2/1/handbook
TNC. 2006. Target Selection Tool. Available at http://conserveonline.org/workspaces/cbdgateway/cbdmain/cap/resources/further_guidance.
TNC. 2003. The 5S Framework for Site Conservation: A Practitioner's Handbook for Site Conservation Planning, Chapter 4. http://conserveonline.org/docs/2000/11/5-SVOL1.pdf.
For a description of a process for selecting targets across a large region and in conjunction with a wide group of stakeholders, see pages 8-9 in particular in: TNC and FOS. 2007. Conservation of Biodiversity in the Hudson River Estuary – The Process.
A Report on a Multi-Stakeholder Workshop Series Using a Modified Version of TNC’s CAP Process. Available at: http://fosonline.org/Site_Documents/Grouped/HREW%20process%20report.pdf.
8 The conservation targets would be pink dolphins and the Mamoré River and its tributaries. Deforestation, flooding, and water pollution are all direct threats. 9 There is only one conservation target in this group: sea turtle. Sea lions’ breeding capacity is an indicator of sea lion health – the target should be sea lions, not their breeding capacity. Over fishing and tourism are direct threats. International markets are an indirect threat that might drive direct threats, such as over fishing.
Conceptualizing and Planning Conservation Projects and Programs 31
© Foundations of Success 2009
Good presentations and other articles about target selection and viability assessment are also available from TNC at:
http://conserveonline.org/workspaces/cbdgateway/cbdmain/cap/resources/further_guidance
Assignment 3 - Select Conservation Targets
For your project, please select a limited number of targets using the steps described in more detail above:
1. List potential targets
2. Lump or split targets, as necessary
3. Select eight or fewer targets that meet the criteria described above
Record your targets in Miradi. Be sure to capture any more detailed descriptive information in the details box and important discussions or clarification in the comments box (both are located in the factor properties dialog, when you double click on your target).
Write a short (1-2 pages) description of the final targets and justify their selection.
Write a short paragraph about your impression of the process of selecting conservation targets. Include any challenges you had or anything you found to be useful.
Hand in your assignment (Word document + mpz file) as Assignment 3
32 Foundations of Success
© Foundations of Success 2009
Step 1B. Define Scope, Vision, and Targets (Week 4)10
Structure for Week 4. In this week you will:
Read Introduction to Viability Assessment, How To Conduct a Viability Assessment, and Examples of Viability Assessments.
Hand in Assignment 4
Introduction to Viability Assessment A key step in managing any system is to be clear about what you are trying to accomplish. In particular, you need to be able to define specific future goals, assess the current status of the system today, and measure your progress as you move towards these goals. A useful analogy can be found in the medical field, where doctors define healthy individuals as having, among other things, a pulse rate and blood pressure within an appropriate range for their age and condition. If a patient is outside of the normal range, then the doctor can prescribe therapy and monitor the patient’s condition over time as they hopefully move towards a desired goal in the normal range. This process of setting measurable goals is particularly challenging for conservation targets. Most targets are very complex systems that vary naturally over time, making it difficult to define or measure their health in a systematic and repeatable fashion. Viability Assessment is a flexible and powerful methodology based on sound ecological principles that helps address the challenges of defining healthy targets and setting appropriate and measurable goals. The general purpose of conducting a viability assessment is to determine how you will measure the health of your conservation targets over time. It helps you determine how your target is doing today, what a healthy target would look like, and what status you would like to see in the future as a result of your project actions. Viability assessment relies on established principles of ecology and conservation science. It uses the best available information on the target’s biology and ecology in an explicit, objective, consistent, and credible manner. Viability assessment does not, however, require “perfect” information. Instead it provides a way for your project team to specify – to the best of your knowledge – what you think healthy targets will look like. Often times, teams will not go through a formal viability assessment process. The process, however, can be very useful for helping you think about where your targets need to be in order for the overall biodiversity or resources at your site to be in good shape. We encourage you to go through at least an initial iteration of a viability assessment. This may require bringing in scientific experts who can help guide you toward defining the impact you need to achieve. Viability assessment involves identifying key ecological attributes (KEAs) for each conservation target (see Box 6 for a list of viability assessment-related terms). These key ecological attributes are aspects of a target’s biology or ecology that if present, define a healthy target and if missing or altered, would lead to the outright loss or extreme degradation of that target over time. For 10 The text for Viability assessment borrows heavily from The Nature Conservancy’s explanation of Conservation Action Planning Basic Practice 3 (Viability assessment), available at http://conserveonline.org/workspaces/cbdgateway/cap/practices/bp_3.
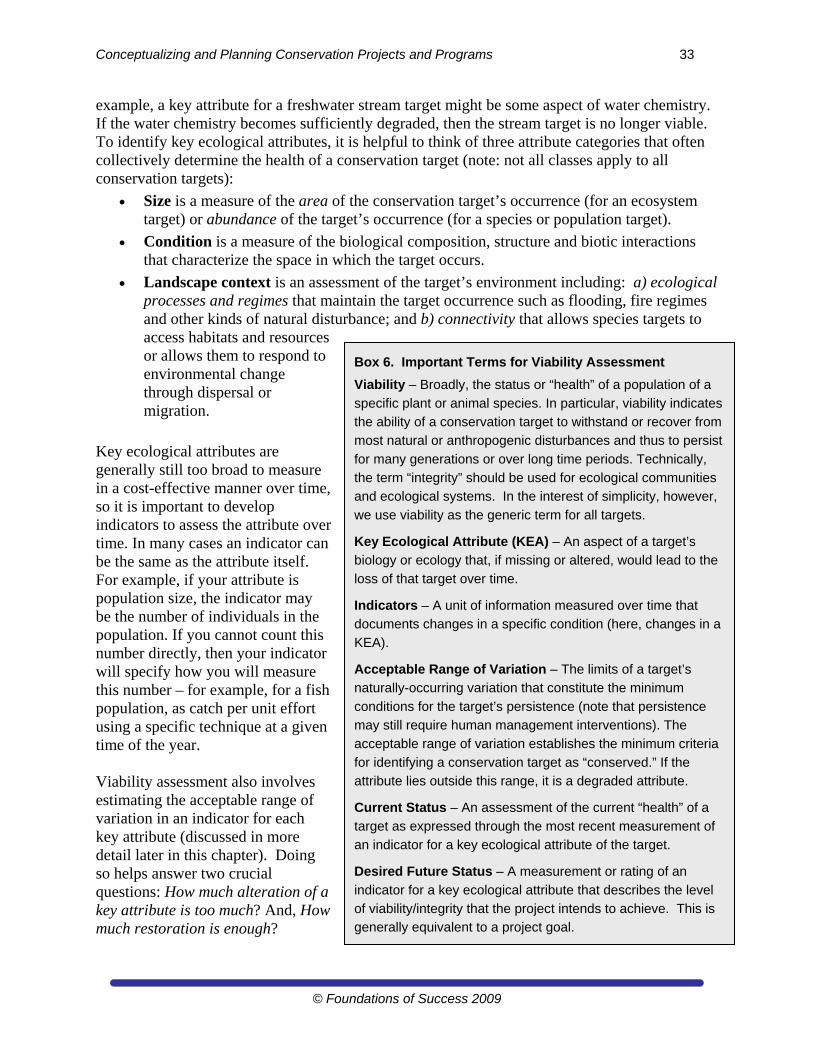
Conceptualizing and Planning Conservation Projects and Programs 33
© Foundations of Success 2009
example, a key attribute for a freshwater stream target might be some aspect of water chemistry. If the water chemistry becomes sufficiently degraded, then the stream target is no longer viable. To identify key ecological attributes, it is helpful to think of three attribute categories that often collectively determine the health of a conservation target (note: not all classes apply to all conservation targets):
Size is a measure of the area of the conservation target’s occurrence (for an ecosystem target) or abundance of the target’s occurrence (for a species or population target).
Condition is a measure of the biological composition, structure and biotic interactions that characterize the space in which the target occurs.
Landscape context is an assessment of the target’s environment including: a) ecological processes and regimes that maintain the target occurrence such as flooding, fire regimes and other kinds of natural disturbance; and b) connectivity that allows species targets to access habitats and resources or allows them to respond to environmental change through dispersal or migration.
Key ecological attributes are generally still too broad to measure in a cost-effective manner over time, so it is important to develop indicators to assess the attribute over time. In many cases an indicator can be the same as the attribute itself. For example, if your attribute is population size, the indicator may be the number of individuals in the population. If you cannot count this number directly, then your indicator will specify how you will measure this number – for example, for a fish population, as catch per unit effort using a specific technique at a given time of the year. Viability assessment also involves estimating the acceptable range of variation in an indicator for each key attribute (discussed in more detail later in this chapter). Doing so helps answer two crucial questions: How much alteration of a key attribute is too much? And, How much restoration is enough?
Box 6. Important Terms for Viability Assessment
Viability – Broadly, the status or “health” of a population of a
specific plant or animal species. In particular, viability indicates
the ability of a conservation target to withstand or recover from
most natural or anthropogenic disturbances and thus to persist
for many generations or over long time periods. Technically,
the term “integrity” should be used for ecological communities
and ecological systems. In the interest of simplicity, however,
we use viability as the generic term for all targets.
Key Ecological Attribute (KEA) – An aspect of a target’s
biology or ecology that, if missing or altered, would lead to the
loss of that target over time.
Indicators – A unit of information measured over time that
documents changes in a specific condition (here, changes in a
KEA).
Acceptable Range of Variation – The limits of a target’s
naturally-occurring variation that constitute the minimum
conditions for the target’s persistence (note that persistence
may still require human management interventions). The
acceptable range of variation establishes the minimum criteria
for identifying a conservation target as “conserved.” If the
attribute lies outside this range, it is a degraded attribute.
Current Status – An assessment of the current “health” of a
target as expressed through the most recent measurement of
an indicator for a key ecological attribute of the target.
Desired Future Status – A measurement or rating of an
indicator for a key ecological attribute that describes the level
of viability/integrity that the project intends to achieve. This is generally equivalent to a project goal.
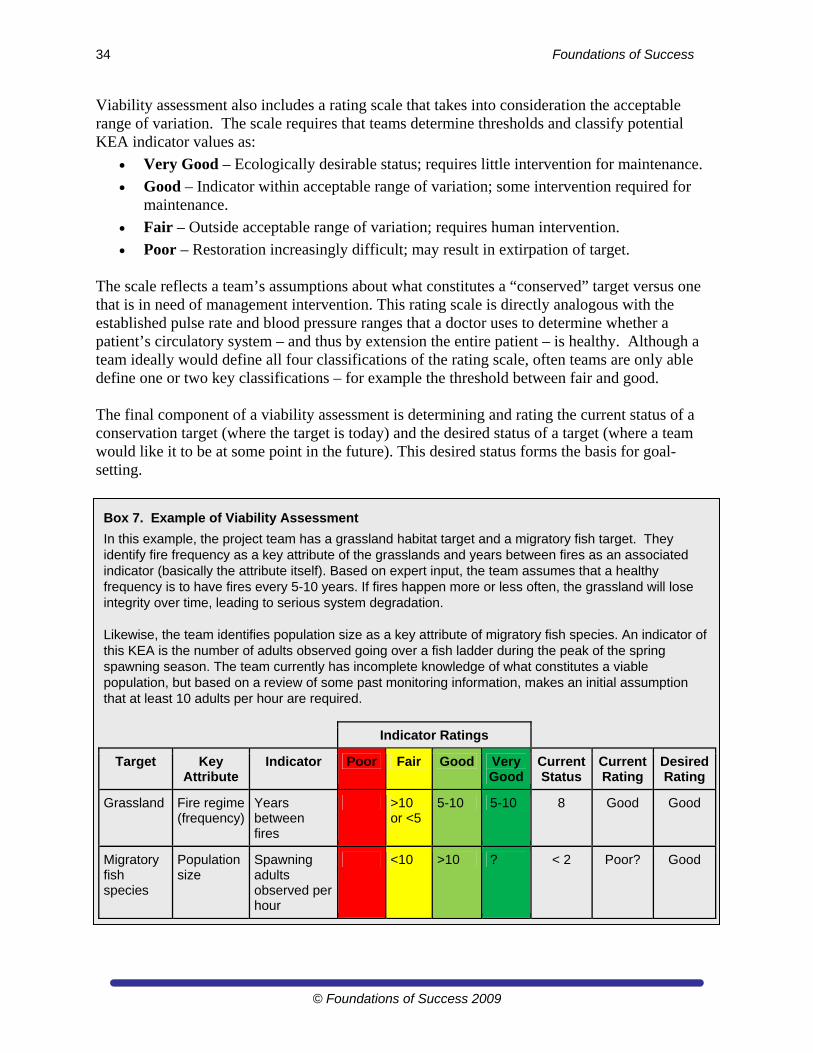
34 Foundations of Success
© Foundations of Success 2009
Viability assessment also includes a rating scale that takes into consideration the acceptable range of variation. The scale requires that teams determine thresholds and classify potential KEA indicator values as:
Very Good – Ecologically desirable status; requires little intervention for maintenance.
Good – Indicator within acceptable range of variation; some intervention required for maintenance.
Fair – Outside acceptable range of variation; requires human intervention.
Poor – Restoration increasingly difficult; may result in extirpation of target. The scale reflects a team’s assumptions about what constitutes a “conserved” target versus one that is in need of management intervention. This rating scale is directly analogous with the established pulse rate and blood pressure ranges that a doctor uses to determine whether a patient’s circulatory system – and thus by extension the entire patient – is healthy. Although a team ideally would define all four classifications of the rating scale, often teams are only able define one or two key classifications – for example the threshold between fair and good. The final component of a viability assessment is determining and rating the current status of a conservation target (where the target is today) and the desired status of a target (where a team would like it to be at some point in the future). This desired status forms the basis for goal-setting.
Box 7. Example of Viability Assessment
In this example, the project team has a grassland habitat target and a migratory fish target. They identify fire frequency as a key attribute of the grasslands and years between fires as an associated indicator (basically the attribute itself). Based on expert input, the team assumes that a healthy frequency is to have fires every 5-10 years. If fires happen more or less often, the grassland will lose integrity over time, leading to serious system degradation. Likewise, the team identifies population size as a key attribute of migratory fish species. An indicator of this KEA is the number of adults observed going over a fish ladder during the peak of the spring spawning season. The team currently has incomplete knowledge of what constitutes a viable population, but based on a review of some past monitoring information, makes an initial assumption that at least 10 adults per hour are required.
Indicator Ratings
Target Key Attribute
Indicator Poor Fair Good Very Good
Current Status
Current Rating
Desired Rating
Grassland Fire regime (frequency)
Years between fires
>10 or <5
5-10 5-10 8 Good Good
Migratory fish species
Population size
Spawning adults observed per hour
<10 >10 ? < 2 Poor? Good
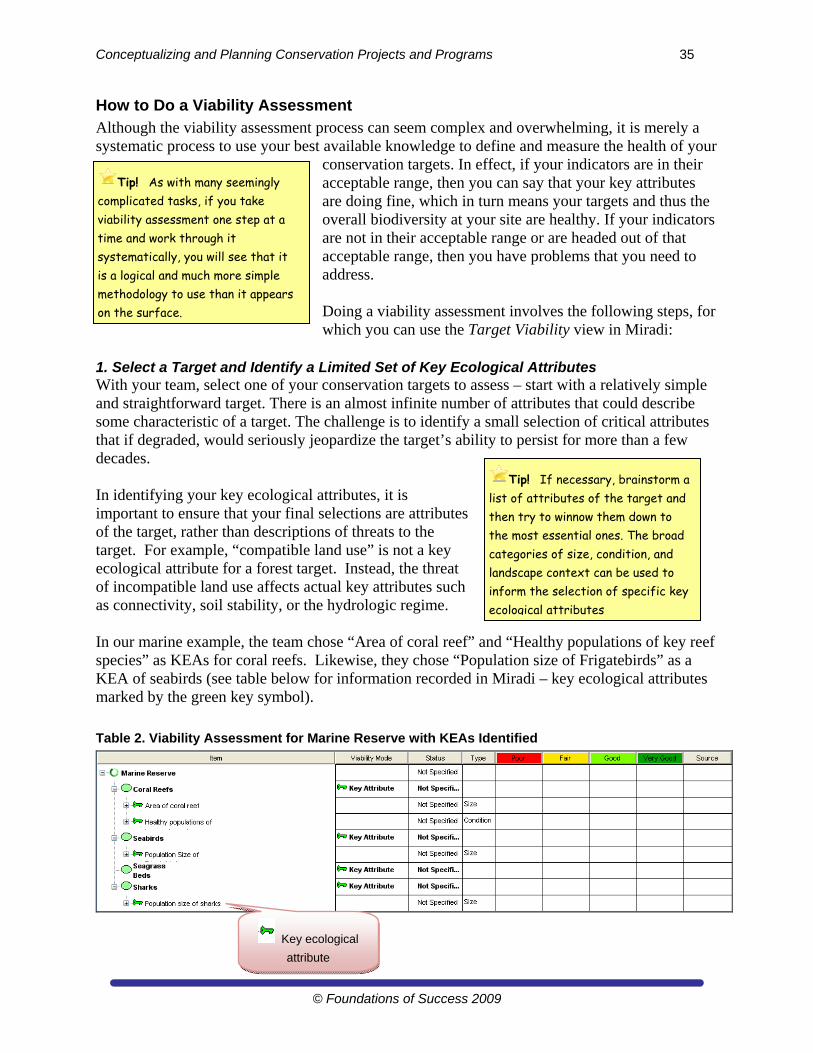
Conceptualizing and Planning Conservation Projects and Programs 35
© Foundations of Success 2009
How to Do a Viability Assessment Although the viability assessment process can seem complex and overwhelming, it is merely a systematic process to use your best available knowledge to define and measure the health of your
conservation targets. In effect, if your indicators are in their acceptable range, then you can say that your key attributes are doing fine, which in turn means your targets and thus the overall biodiversity at your site are healthy. If your indicators are not in their acceptable range or are headed out of that acceptable range, then you have problems that you need to address. Doing a viability assessment involves the following steps, for which you can use the Target Viability view in Miradi:
1. Select a Target and Identify a Limited Set of Key Ecological Attributes With your team, select one of your conservation targets to assess – start with a relatively simple and straightforward target. There is an almost infinite number of attributes that could describe some characteristic of a target. The challenge is to identify a small selection of critical attributes that if degraded, would seriously jeopardize the target’s ability to persist for more than a few decades. In identifying your key ecological attributes, it is important to ensure that your final selections are attributes of the target, rather than descriptions of threats to the target. For example, “compatible land use” is not a key ecological attribute for a forest target. Instead, the threat of incompatible land use affects actual key attributes such as connectivity, soil stability, or the hydrologic regime. In our marine example, the team chose “Area of coral reef” and “Healthy populations of key reef species” as KEAs for coral reefs. Likewise, they chose “Population size of Frigatebirds” as a KEA of seabirds (see table below for information recorded in Miradi – key ecological attributes marked by the green key symbol).
Table 2. Viability Assessment for Marine Reserve with KEAs Identified
Tip! As with many seemingly complicated tasks, if you take viability assessment one step at a time and work through it systematically, you will see that it is a logical and much more simple methodology to use than it appears on the surface.
Tip! If necessary, brainstorm a list of attributes of the target and then try to winnow them down to the most essential ones. The broad categories of size, condition, and landscape context can be used to inform the selection of specific key ecological attributes
Key ecological
attribute
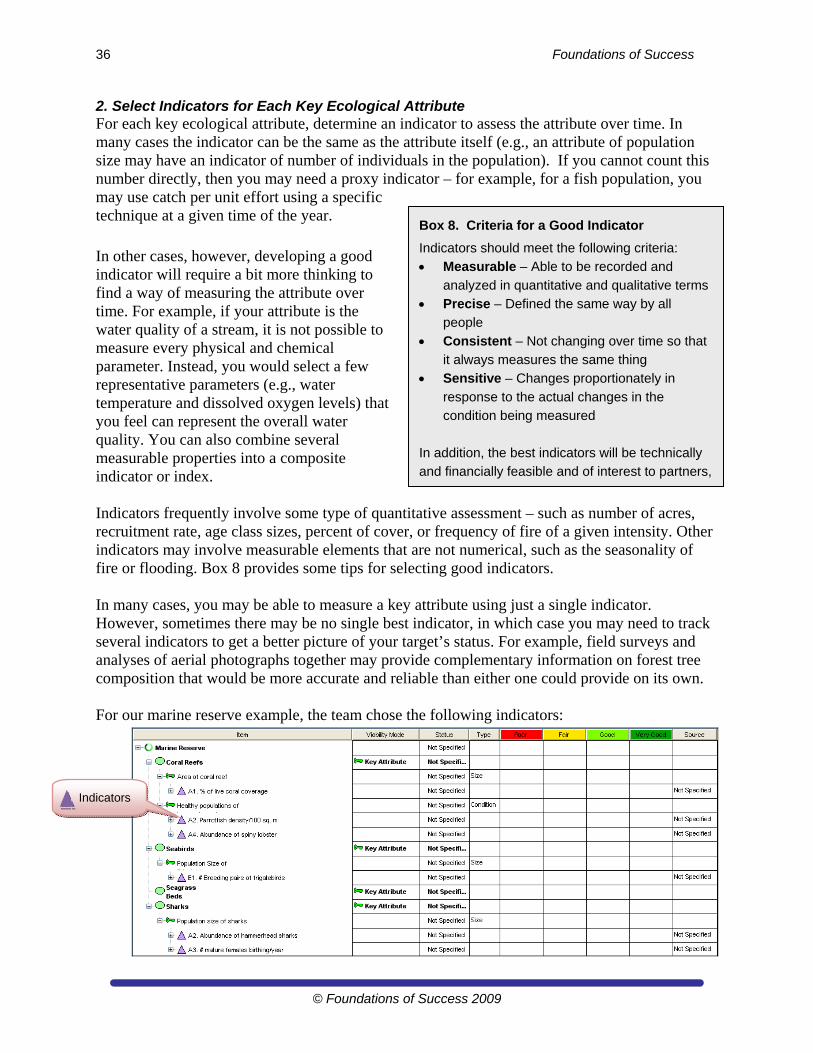
36 Foundations of Success
© Foundations of Success 2009
2. Select Indicators for Each Key Ecological Attribute For each key ecological attribute, determine an indicator to assess the attribute over time. In many cases the indicator can be the same as the attribute itself (e.g., an attribute of population size may have an indicator of number of individuals in the population). If you cannot count this number directly, then you may need a proxy indicator – for example, for a fish population, you may use catch per unit effort using a specific technique at a given time of the year.
In other cases, however, developing a good indicator will require a bit more thinking to find a way of measuring the attribute over time. For example, if your attribute is the water quality of a stream, it is not possible to measure every physical and chemical parameter. Instead, you would select a few representative parameters (e.g., water temperature and dissolved oxygen levels) that you feel can represent the overall water quality. You can also combine several measurable properties into a composite indicator or index. Indicators frequently involve some type of quantitative assessment – such as number of acres, recruitment rate, age class sizes, percent of cover, or frequency of fire of a given intensity. Other indicators may involve measurable elements that are not numerical, such as the seasonality of fire or flooding. Box 8 provides some tips for selecting good indicators. In many cases, you may be able to measure a key attribute using just a single indicator. However, sometimes there may be no single best indicator, in which case you may need to track several indicators to get a better picture of your target’s status. For example, field surveys and analyses of aerial photographs together may provide complementary information on forest tree composition that would be more accurate and reliable than either one could provide on its own. For our marine reserve example, the team chose the following indicators:
Box 8. Criteria for a Good Indicator
Indicators should meet the following criteria:
Measurable – Able to be recorded and
analyzed in quantitative and qualitative terms
Precise – Defined the same way by all
people
Consistent – Not changing over time so that
it always measures the same thing
Sensitive – Changes proportionately in
response to the actual changes in the
condition being measured
In addition, the best indicators will be technically
and financially feasible and of interest to partners,
Indicators
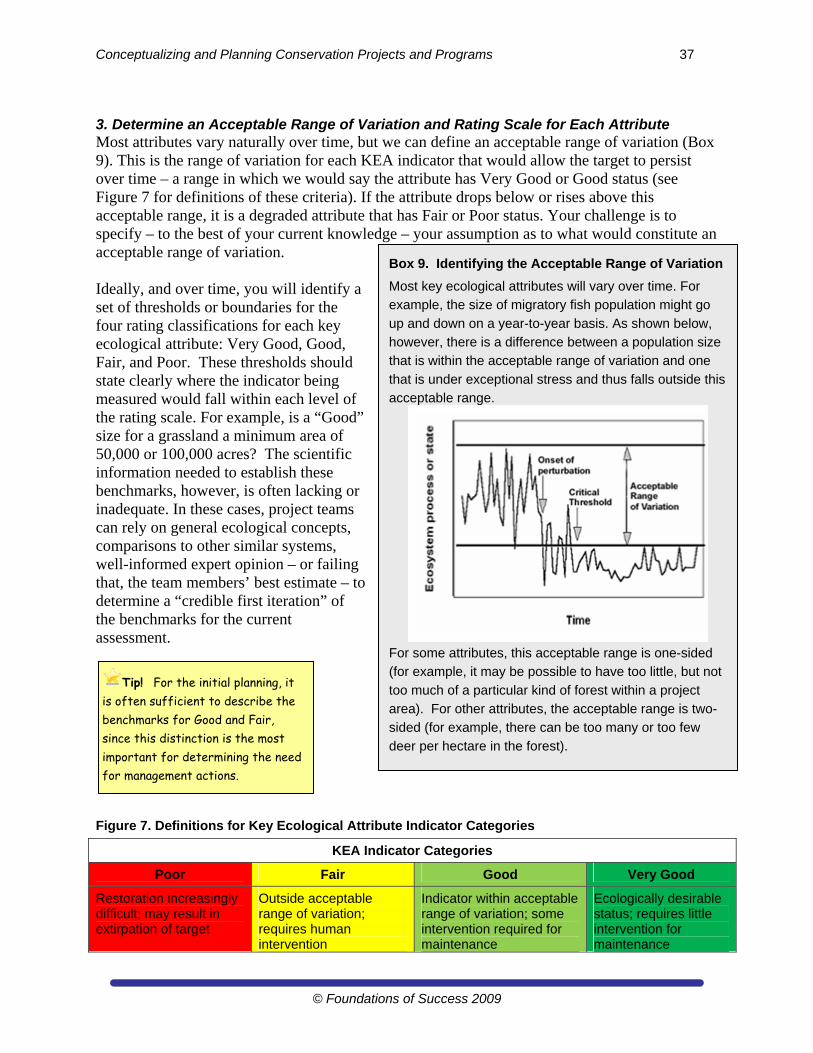
Conceptualizing and Planning Conservation Projects and Programs 37
© Foundations of Success 2009
3. Determine an Acceptable Range of Variation and Rating Scale for Each Attribute Most attributes vary naturally over time, but we can define an acceptable range of variation (Box 9). This is the range of variation for each KEA indicator that would allow the target to persist over time – a range in which we would say the attribute has Very Good or Good status (see Figure 7 for definitions of these criteria). If the attribute drops below or rises above this acceptable range, it is a degraded attribute that has Fair or Poor status. Your challenge is to specify – to the best of your current knowledge – your assumption as to what would constitute an acceptable range of variation. Ideally, and over time, you will identify a set of thresholds or boundaries for the four rating classifications for each key ecological attribute: Very Good, Good, Fair, and Poor. These thresholds should state clearly where the indicator being measured would fall within each level of the rating scale. For example, is a “Good” size for a grassland a minimum area of 50,000 or 100,000 acres? The scientific information needed to establish these benchmarks, however, is often lacking or inadequate. In these cases, project teams can rely on general ecological concepts, comparisons to other similar systems, well-informed expert opinion – or failing that, the team members’ best estimate – to determine a “credible first iteration” of the benchmarks for the current assessment.
Figure 7. Definitions for Key Ecological Attribute Indicator Categories
KEA Indicator Categories
Poor Fair Good Very Good
Restoration increasingly difficult; may result in extirpation of target
Outside acceptable range of variation; requires human intervention
Indicator within acceptable range of variation; some intervention required for maintenance
Ecologically desirable status; requires little intervention for maintenance
Tip! For the initial planning, it is often sufficient to describe the benchmarks for Good and Fair, since this distinction is the most important for determining the need for management actions.
Box 9. Identifying the Acceptable Range of Variation
Most key ecological attributes will vary over time. For
example, the size of migratory fish population might go
up and down on a year-to-year basis. As shown below,
however, there is a difference between a population size
that is within the acceptable range of variation and one
that is under exceptional stress and thus falls outside this
acceptable range.
For some attributes, this acceptable range is one-sided
(for example, it may be possible to have too little, but not
too much of a particular kind of forest within a project
area). For other attributes, the acceptable range is two-
sided (for example, there can be too many or too few
deer per hectare in the forest).
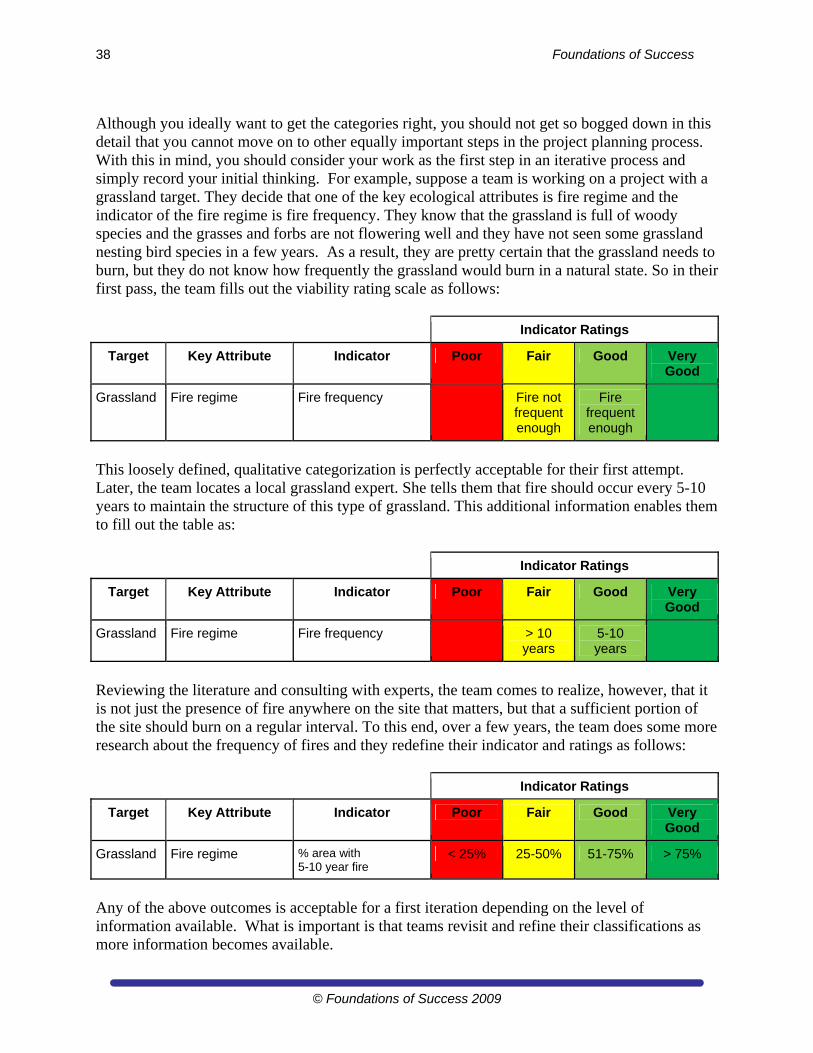
38 Foundations of Success
© Foundations of Success 2009
Although you ideally want to get the categories right, you should not get so bogged down in this detail that you cannot move on to other equally important steps in the project planning process. With this in mind, you should consider your work as the first step in an iterative process and simply record your initial thinking. For example, suppose a team is working on a project with a grassland target. They decide that one of the key ecological attributes is fire regime and the indicator of the fire regime is fire frequency. They know that the grassland is full of woody species and the grasses and forbs are not flowering well and they have not seen some grassland nesting bird species in a few years. As a result, they are pretty certain that the grassland needs to burn, but they do not know how frequently the grassland would burn in a natural state. So in their first pass, the team fills out the viability rating scale as follows:
Indicator Ratings
Target Key Attribute Indicator Poor Fair Good Very Good
Grassland Fire regime Fire frequency Fire not frequent enough
Fire frequent enough
This loosely defined, qualitative categorization is perfectly acceptable for their first attempt. Later, the team locates a local grassland expert. She tells them that fire should occur every 5-10 years to maintain the structure of this type of grassland. This additional information enables them to fill out the table as:
Indicator Ratings
Target Key Attribute Indicator Poor Fair Good Very Good
Grassland Fire regime Fire frequency > 10 years
5-10 years
Reviewing the literature and consulting with experts, the team comes to realize, however, that it is not just the presence of fire anywhere on the site that matters, but that a sufficient portion of the site should burn on a regular interval. To this end, over a few years, the team does some more research about the frequency of fires and they redefine their indicator and ratings as follows:
Indicator Ratings
Target Key Attribute Indicator Poor Fair Good Very Good
Grassland Fire regime % area with 5-10 year fire
< 25% 25-50% 51-75% > 75%
Any of the above outcomes is acceptable for a first iteration depending on the level of information available. What is important is that teams revisit and refine their classifications as more information becomes available.
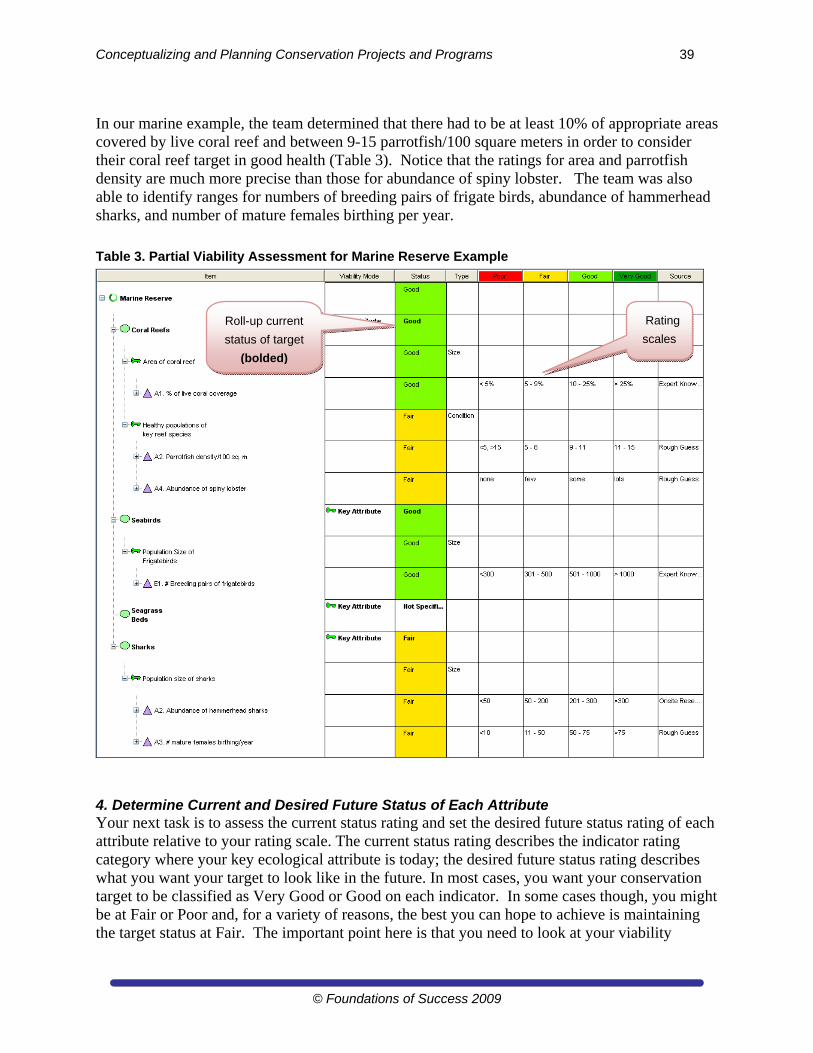
Conceptualizing and Planning Conservation Projects and Programs 39
© Foundations of Success 2009
In our marine example, the team determined that there had to be at least 10% of appropriate areas covered by live coral reef and between 9-15 parrotfish/100 square meters in order to consider their coral reef target in good health (Table 3). Notice that the ratings for area and parrotfish density are much more precise than those for abundance of spiny lobster. The team was also able to identify ranges for numbers of breeding pairs of frigate birds, abundance of hammerhead sharks, and number of mature females birthing per year.
Table 3. Partial Viability Assessment for Marine Reserve Example
4. Determine Current and Desired Future Status of Each Attribute Your next task is to assess the current status rating and set the desired future status rating of each attribute relative to your rating scale. The current status rating describes the indicator rating category where your key ecological attribute is today; the desired future status rating describes what you want your target to look like in the future. In most cases, you want your conservation target to be classified as Very Good or Good on each indicator. In some cases though, you might be at Fair or Poor and, for a variety of reasons, the best you can hope to achieve is maintaining the target status at Fair. The important point here is that you need to look at your viability
Rating
scales
Roll-up current
status of target
(bolded)
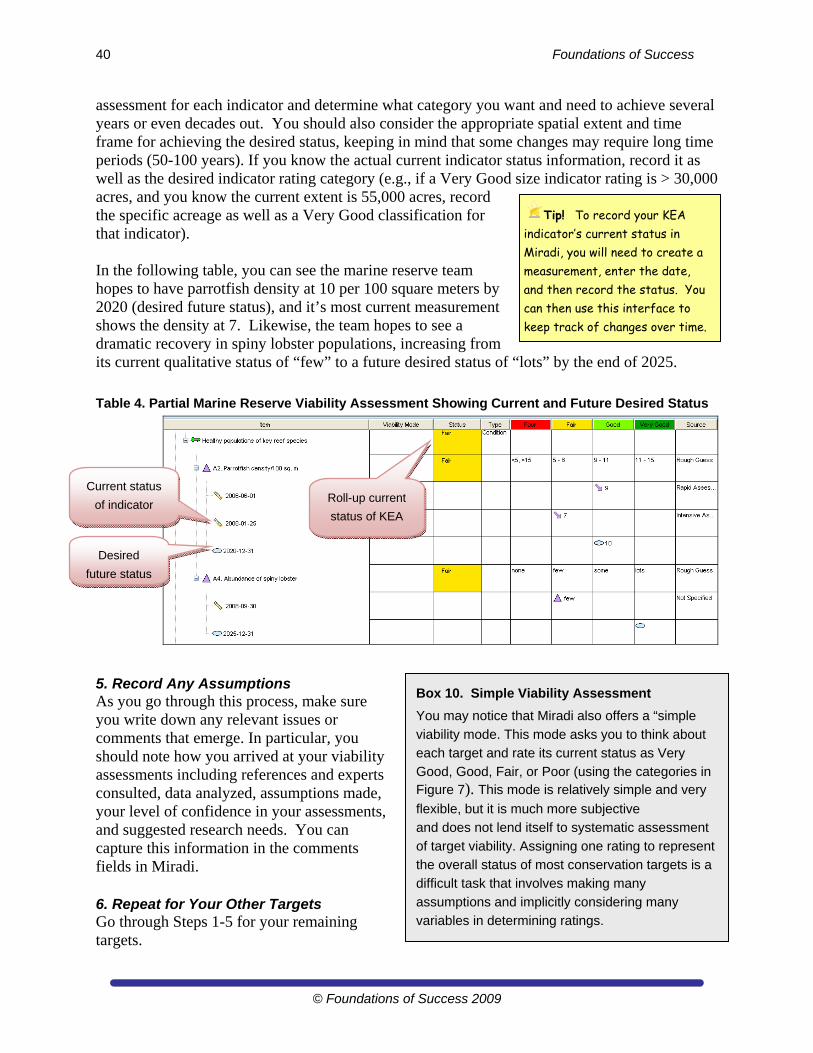
40 Foundations of Success
© Foundations of Success 2009
assessment for each indicator and determine what category you want and need to achieve several years or even decades out. You should also consider the appropriate spatial extent and time frame for achieving the desired status, keeping in mind that some changes may require long time periods (50-100 years). If you know the actual current indicator status information, record it as well as the desired indicator rating category (e.g., if a Very Good size indicator rating is > 30,000 acres, and you know the current extent is 55,000 acres, record the specific acreage as well as a Very Good classification for that indicator). In the following table, you can see the marine reserve team hopes to have parrotfish density at 10 per 100 square meters by 2020 (desired future status), and it’s most current measurement shows the density at 7. Likewise, the team hopes to see a dramatic recovery in spiny lobster populations, increasing from its current qualitative status of “few” to a future desired status of “lots” by the end of 2025.
Table 4. Partial Marine Reserve Viability Assessment Showing Current and Future Desired Status
5. Record Any Assumptions As you go through this process, make sure you write down any relevant issues or comments that emerge. In particular, you should note how you arrived at your viability assessments including references and experts consulted, data analyzed, assumptions made, your level of confidence in your assessments, and suggested research needs. You can capture this information in the comments fields in Miradi. 6. Repeat for Your Other Targets Go through Steps 1-5 for your remaining targets.
Tip! To record your KEA indicator’s current status in Miradi, you will need to create a measurement, enter the date, and then record the status. You can then use this interface to keep track of changes over time.
Box 10. Simple Viability Assessment
You may notice that Miradi also offers a “simple
viability mode. This mode asks you to think about
each target and rate its current status as Very
Good, Good, Fair, or Poor (using the categories in Figure 7). This mode is relatively simple and very
flexible, but it is much more subjective
and does not lend itself to systematic assessment
of target viability. Assigning one rating to represent
the overall status of most conservation targets is a
difficult task that involves making many
assumptions and implicitly considering many
variables in determining ratings.
Desired
future status
Current status
of indicator Roll-up current
status of KEA
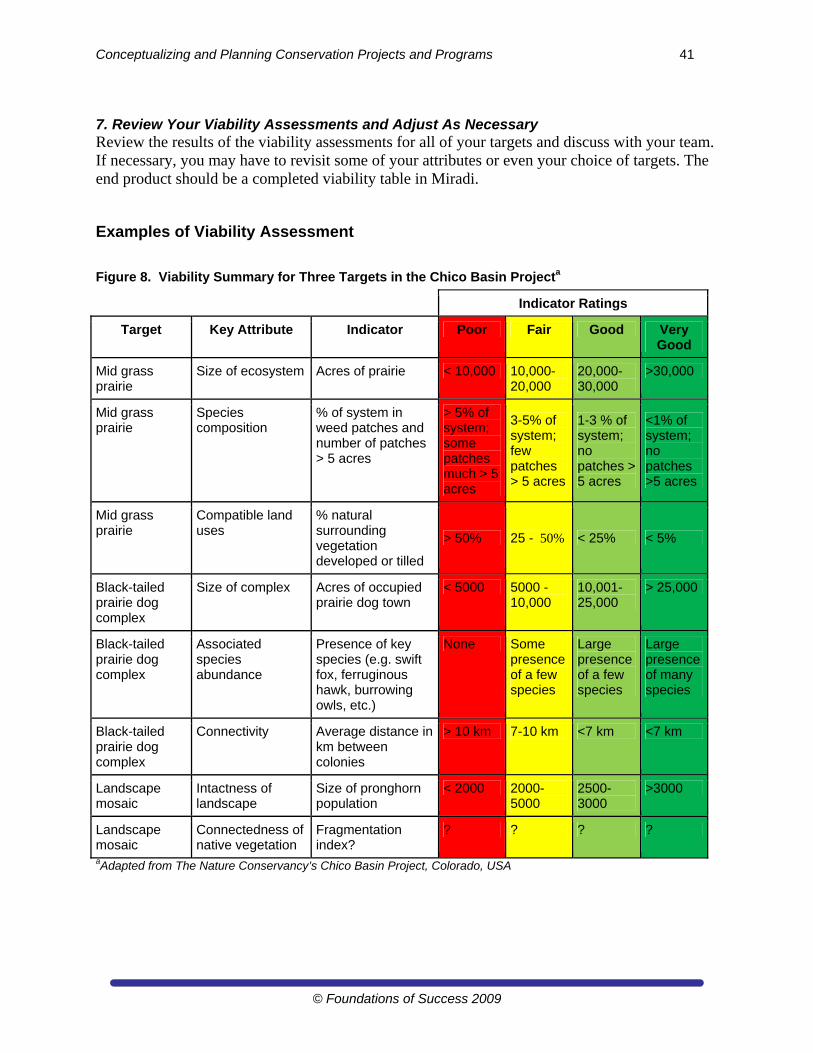
Conceptualizing and Planning Conservation Projects and Programs 41
© Foundations of Success 2009
7. Review Your Viability Assessments and Adjust As Necessary Review the results of the viability assessments for all of your targets and discuss with your team. If necessary, you may have to revisit some of your attributes or even your choice of targets. The end product should be a completed viability table in Miradi.
Examples of Viability Assessment
Figure 8. Viability Summary for Three Targets in the Chico Basin Projecta
Indicator Ratings
Target Key Attribute Indicator Poor Fair Good Very Good
Mid grass prairie
Size of ecosystem Acres of prairie < 10,000 10,000-20,000
20,000-30,000
>30,000
Mid grass prairie
Species composition
% of system in weed patches and number of patches > 5 acres
> 5% of system; some patches much > 5 acres
3-5% of system; few patches > 5 acres
1-3 % of system; no patches > 5 acres
<1% of system; no patches >5 acres
Mid grass prairie
Compatible land uses
% natural surrounding vegetation developed or tilled
> 50% 25 - 50% < 25% < 5%
Black-tailed prairie dog complex
Size of complex Acres of occupied prairie dog town
< 5000 5000 - 10,000
10,001-25,000
> 25,000
Black-tailed prairie dog complex
Associated species abundance
Presence of key species (e.g. swift fox, ferruginous hawk, burrowing owls, etc.)
None Some presence of a few species
Large presence of a few species
Large presence of many species
Black-tailed prairie dog complex
Connectivity Average distance in km between colonies
> 10 km 7-10 km <7 km <7 km
Landscape mosaic
Intactness of landscape
Size of pronghorn population
< 2000 2000-5000
2500- 3000
>3000
Landscape mosaic
Connectedness of native vegetation
Fragmentation index?
? ? ? ?
aAdapted from The Nature Conservancy’s Chico Basin Project, Colorado, USA
42 Foundations of Success
© Foundations of Success 2009
Some References
Braun 2007. Advanced Guidance for Step 3: Assessing the Viability of the Focal Conservation Targets. The Nature Conservancy, Arlington, VA.
Parrish, J.D., D.P. Braun, and R.S. Unnasch. 2003. Are we conserving what we say we are? Measuring ecological integrity within protected areas. Bioscience 53: 851-860.
TNC, 2007. Guidance for Step 3: Assess Viability. In Conservation Action Planning Handbook: Developing Strategies, Taking Action and Measuring Success at Any Scale. The Nature Conservancy, Arlington, VA. Available from: http://conserveonline.org/workspaces/cbdgateway/cap/resources/2/1/handbook
For examples of collaborative approaches teams have used to conduct viability assessments, see: Schulz, T. and R. Neugarten. 2007. Incorporating Ecoregional Goals into the San Miguel/Lower
Dolores Rivers Viability Assessment. The Nature Conservancy. Basic Practice 3: Assess Viability of Focal Conservation Targets. Available from: http://conserveonline.org/workspaces/cbdgateway/cap/practices/cs/. [Note: You may get a request to choose an application when opening this – select Adobe Acrobat]
Martin, T., Pace-Aldana, B. and R. Neugarten. 2007. Involving Local Experts in the Viability Assessment of the Lake Wales Ridge Archipelago, Florida. The Nature Conservancy. Basic Practice 3: Assess Viability of Focal Conservation Targets. Available from: http://conserveonline.org/workspaces/cbdgateway/cap/practices/cs/.
Assignment 4 – Describe the Status of Your Conservation Targets
For your project, please choose two conservation targets (one species and one ecosystem target, if you have a mix). Conduct a viability assessment by carrying out the following steps:
1. Identify a limited set of key ecological attributes (KEAs) for each target. Record these in Miradi. (Note: In Miradi, you will need to double click on each target and set your “viability analysis mode” to Key Attribute. You can use the viability tab in this same dialog box to create your KEAs and fill out your viability assessment. You can also use the Viability view within Miradi to enter information).
For just one of your targets, complete the rest of a viability assessment:
2. Select indicators for each KEA.
3. Determine an acceptable range of variation and rating scale for each indicator
4. Determine current and desired future status of each attribute
5. Record any assumptions or important background information
Remember, this is just a first iteration. The purpose of this section is to help you become familiar with the methodology. Complete this to the best of your ability and note areas where you might need to talk to other experts at a later date.
Be sure to capture any more detailed descriptive information in the details box and important discussions or clarification in the comments box (both are located in the factor properties dialog, when you double click on your target).
Conceptualizing and Planning Conservation Projects and Programs 43
© Foundations of Success 2009
Write a short paragraph about your impression of the process of conducting a viability analysis. Include any challenges you had or anything you found to be useful.
Hand in your assignment (Word document + mpz file) as Assignment 4.
44 Foundations of Success
© Foundations of Success 2009
Step 1C. Identify Critical Threats (Week 5)
Structure for Week 5. In this week you will:
Read Introduction to Threat Rating, How To Do an Absolute Target-by-Target Threat Rating, Other Methods for Threat Rating, and an Example Threat Rating.
Hand in Assignment 5
Introduction to Threat Rating Conservation takes place in the face of a wide variety of threats to natural resources and biodiversity. A common challenge for conservation practitioners is determining which of these threats they will try to address. Often, decisions are made applying an implicit set of criteria to evaluate threats. The danger with this approach is that different people might use different criteria or apply them differently. Moreover, there is a tendency to address threats for which strategies and expertise already exist, rather than addressing those threats that pose the greatest risk to the biodiversity at a site. Threat rating is a method for making this implicit assessment of threats more explicit and more objective. It involves determining and defining a set of criteria and then applying those criteria systematically to the direct threats to a project’s conservation targets so that conservation actions can be directed where they are most needed.
How to Do an Absolute Target-by-Target Threat Rating To do a threat rating, it is important to be clear about what the main threats at your project site are and what conservation targets they are affecting. Once you have identified these direct threats, you and your project team will evaluate each direct threat and the impact it has on the conservation target(s) affected. The methodology presented here uses Miradi to do an absolute rating of threats on a target-by-target basis and to roll up the ratings to determine each threat’s overall effect on the site. Thus, for each target, you will need to assess the degree to which each of its direct threats affect it. In some cases, you may find yourself evaluating both actual and potential threats. In the case of potential threats, it is best to only include them in your rating if they are threats that are realistic and likely to occur within a reasonable time period (10 years, for example). So, you might include a road that a local logging company is negotiating with the government as a real potential threat, but you would not include mining as a potential threat if no companies plan to mine in the area over the next ten years. 1. Identify Direct Threats to Your Conservation Targets
Direct threats are primarily human activities that immediately affect a conservation target (e.g., unsustainable fishing, hunting, oil drilling, construction of roads, pollution or introduction of exotic invasive species), but they can be natural phenomena altered by human activities (e.g., increase in water temperature caused by global warming) or natural phenomena whose impact is increased by other human activities (e.g., a tsunami that threatens the last remaining population of an Asian rhino). One good source to browse for ideas of different direct threats is the IUCN-
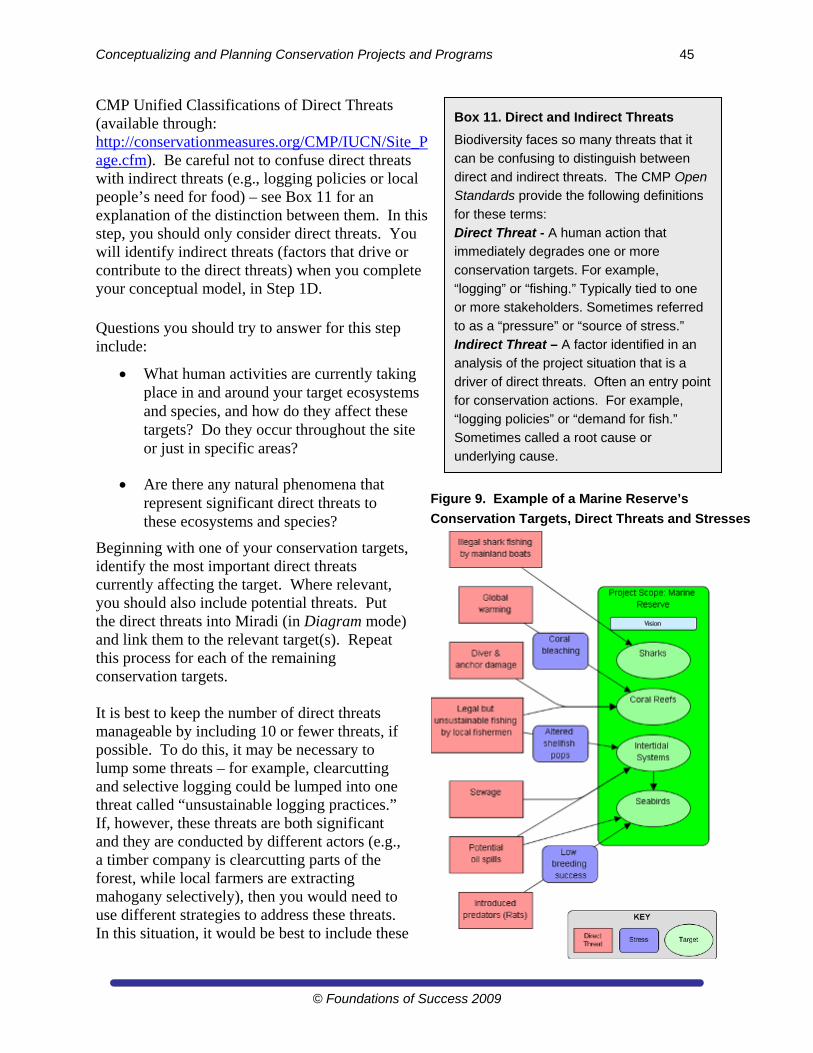
Conceptualizing and Planning Conservation Projects and Programs 45
© Foundations of Success 2009
CMP Unified Classifications of Direct Threats (available through: http://conservationmeasures.org/CMP/IUCN/Site_Page.cfm). Be careful not to confuse direct threats with indirect threats (e.g., logging policies or local people’s need for food) – see Box 11 for an explanation of the distinction between them. In this step, you should only consider direct threats. You will identify indirect threats (factors that drive or contribute to the direct threats) when you complete your conceptual model, in Step 1D. Questions you should try to answer for this step include:
What human activities are currently taking place in and around your target ecosystems and species, and how do they affect these targets? Do they occur throughout the site or just in specific areas?
Are there any natural phenomena that represent significant direct threats to these ecosystems and species?
Beginning with one of your conservation targets, identify the most important direct threats currently affecting the target. Where relevant, you should also include potential threats. Put the direct threats into Miradi (in Diagram mode) and link them to the relevant target(s). Repeat this process for each of the remaining conservation targets. It is best to keep the number of direct threats manageable by including 10 or fewer threats, if possible. To do this, it may be necessary to lump some threats – for example, clearcutting and selective logging could be lumped into one threat called “unsustainable logging practices.” If, however, these threats are both significant and they are conducted by different actors (e.g., a timber company is clearcutting parts of the forest, while local farmers are extracting mahogany selectively), then you would need to use different strategies to address these threats. In this situation, it would be best to include these
Box 11. Direct and Indirect Threats
Biodiversity faces so many threats that it
can be confusing to distinguish between
direct and indirect threats. The CMP Open
Standards provide the following definitions
for these terms:
Direct Threat - A human action that
immediately degrades one or more
conservation targets. For example,
“logging” or “fishing.” Typically tied to one
or more stakeholders. Sometimes referred
to as a “pressure” or “source of stress.”
Indirect Threat – A factor identified in an
analysis of the project situation that is a
driver of direct threats. Often an entry point
for conservation actions. For example,
“logging policies” or “demand for fish.”
Sometimes called a root cause or
underlying cause.
Figure 9. Example of a Marine Reserve’s
Conservation Targets, Direct Threats and Stresses
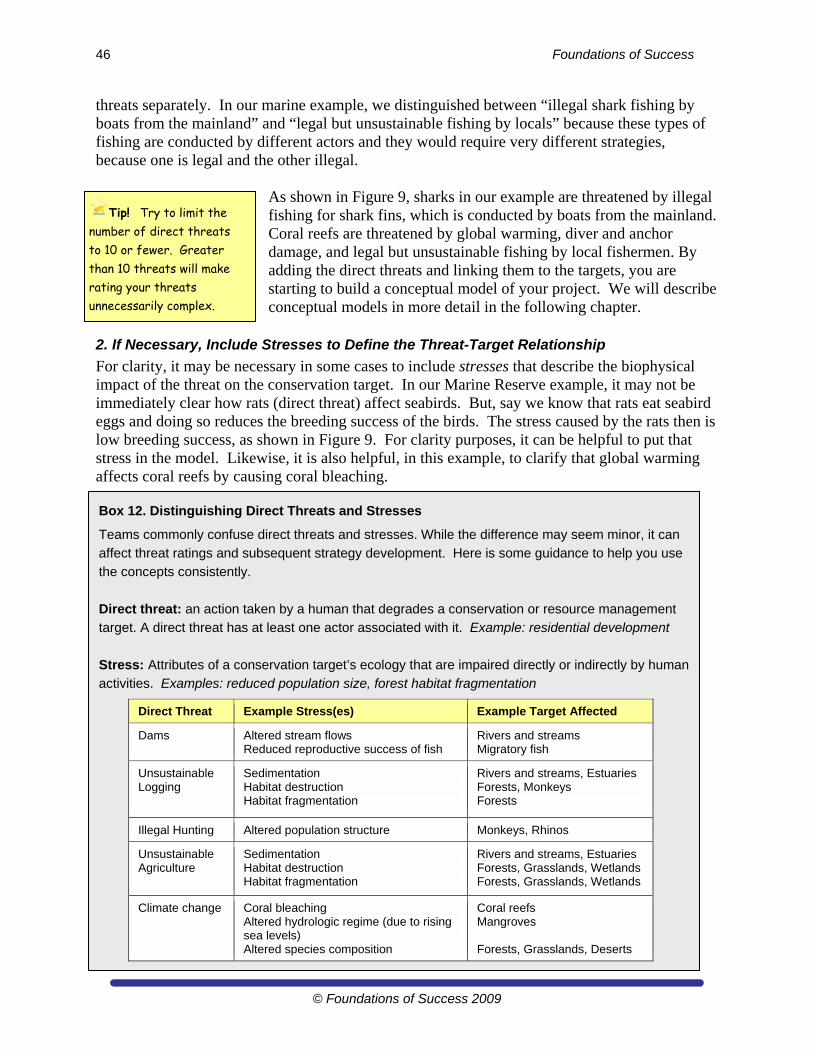
46 Foundations of Success
© Foundations of Success 2009
Box 12. Distinguishing Direct Threats and Stresses
Teams commonly confuse direct threats and stresses. While the difference may seem minor, it can
affect threat ratings and subsequent strategy development. Here is some guidance to help you use
the concepts consistently.
Direct threat: an action taken by a human that degrades a conservation or resource management
target. A direct threat has at least one actor associated with it. Example: residential development
Stress: Attributes of a conservation target’s ecology that are impaired directly or indirectly by human
activities. Examples: reduced population size, forest habitat fragmentation
Direct Threat Example Stress(es) Example Target Affected
Dams Altered stream flows Reduced reproductive success of fish
Rivers and streams Migratory fish
Unsustainable Logging
Sedimentation Habitat destruction Habitat fragmentation
Rivers and streams, Estuaries Forests, Monkeys Forests
Illegal Hunting Altered population structure Monkeys, Rhinos
Unsustainable Agriculture
Sedimentation Habitat destruction Habitat fragmentation
Rivers and streams, Estuaries Forests, Grasslands, Wetlands Forests, Grasslands, Wetlands
Climate change Coral bleaching Altered hydrologic regime (due to rising sea levels) Altered species composition
Coral reefs Mangroves Forests, Grasslands, Deserts
threats separately. In our marine example, we distinguished between “illegal shark fishing by boats from the mainland” and “legal but unsustainable fishing by locals” because these types of fishing are conducted by different actors and they would require very different strategies, because one is legal and the other illegal.
As shown in Figure 9, sharks in our example are threatened by illegal fishing for shark fins, which is conducted by boats from the mainland. Coral reefs are threatened by global warming, diver and anchor damage, and legal but unsustainable fishing by local fishermen. By adding the direct threats and linking them to the targets, you are starting to build a conceptual model of your project. We will describe conceptual models in more detail in the following chapter.
2. If Necessary, Include Stresses to Define the Threat-Target Relationship
For clarity, it may be necessary in some cases to include stresses that describe the biophysical impact of the threat on the conservation target. In our Marine Reserve example, it may not be immediately clear how rats (direct threat) affect seabirds. But, say we know that rats eat seabird eggs and doing so reduces the breeding success of the birds. The stress caused by the rats then is low breeding success, as shown in Figure 9. For clarity purposes, it can be helpful to put that stress in the model. Likewise, it is also helpful, in this example, to clarify that global warming affects coral reefs by causing coral bleaching.
Tip! Try to limit the number of direct threats to 10 or fewer. Greater than 10 threats will make rating your threats unnecessarily complex.
Conceptualizing and Planning Conservation Projects and Programs 47
© Foundations of Success 2009
You should review your direct threats to make sure that none of them are stresses (see Box 12 for guidance on distinguishing between direct threats and stresses). Direct threats are human actions and stresses describe the effect of those actions on the target. For example, habitat fragmentation and habitat degradation are both stresses – not direct threats. In the case of a forest target, habitat fragmentation and habitat degradation are the result of direct threats such as commercial logging, agricultural encroachment, mining, road construction, or other human activities. 3. Understand the Criteria for Threat Rating
The results of any threat rating will depend on the criteria used to rate the threats. In most cases, it is important to know how much of your target is affected by the threat (scope) and how severe the threat is (severity). Miradi uses the criteria of scope, severity, and irreversibility (see Box 13). Scope refers to the proportion of the target that will likely be affected by the threat within 10 years under current circumstances. Severity attempts to categorize the level of damage to the conservation target expected in the next ten years. Irreversibility describes the degree to which the effects of a given threat can be undone and the targets affected by the threat restored, if the threat no longer existed. Although one could use other criteria for the threat rating, many conservation organizations agree that scope and severity are key criteria. Recently, representatives from FOS, The Nature Conservancy (TNC) and BirdLife International worked together to compare six existing threat rating systems developed by their organizations and the Wildlife Conservation Society (WCS), World Wildlife Fund (WWF), and the Conservation Measures Partnership (CMP). They analyzed six existing threat measurement systems to make recommendations for a standard threat measurement system. They found that all six of the threat rating methods they analyzed used scope (sometimes called “area” or “extent”) and severity (sometimes called “intensity” or “impact”) as criteria for rating threats. Four of the six methods also used irreversibility (also called “permanence,” recoverability” or “recovery time”) as a criterion. Other criteria included urgency, timing, probability (for potential threats) and trend. CMP and Benetech incorporated the results and conclusions of this analysis into the threat rating component of Miradi.
4. Apply the Threat Rating for Each Threat-Target Combination
Use Miradi to do your threat rating. When you go into the Threat Rating view of Miradi, you will see a table of threat-target relationships based on the links between threats and targets that
you established in your conceptual model. If any relevant threats or threat-target relationships are missing, you can right click on a cell and Miradi will automatically add a link and insert a direct threat box into your figure in the Diagram view. For each threat-target relationship, you need to rate the threat’s impact on the target according to each criterion – scope, severity and irreversibility. Miradi uses a 4-point scale (e.g. Very High, High, Medium, Low – see Box 13) for each
Tip! A helpful way to consider irreversibility is to ask yourself, “If the threat were to disappear today, how easily would the target recover?” Also, note that the criteria ask you to consider costs of target recovery, NOT threat abatement costs.
48 Foundations of Success
© Foundations of Success 2009
criterion and then rolls up the results. One advantage of a four-point system is that it is easier to resist the temptation to give an average or middle score, as is the case with a 5- or 3-point scale.
Box 13. Criteria for Threat Rankings Using the Absolute Target-by-Target System
Scope – Most commonly defined spatially as the proportion of the target that can reasonably be expected to be affected by the threat within ten years given the continuation of current circumstances and trends. For ecosystems and ecological communities, measured as the proportion of the target's occurrence. For species, measured as the proportion of the target's population. 4 = Very High: The threat is likely to be pervasive in its scope, affecting the target across all or most (71-100%) of its occurrence/population. 3 = High: The threat is likely to be widespread in its scope, affecting the target across much (31-70%) of its occurrence/population. 2 = Medium: The threat is likely to be restricted in its scope, affecting the target across some (11-30%) of its occurrence/population. 1 = Low: The threat is likely to be very narrow in its scope, affecting the target across a small proportion (1-10%) of its occurrence/population. Severity – Within the scope, the level of damage to the target from the threat that can reasonably be expected given the continuation of current circumstances and trends. For ecosystems and ecological communities, typically measured as the degree of destruction or degradation of the target within the scope. For species, usually measured as the degree of reduction of the target population within the scope. 4 = Very High: Within the scope, the threat is likely to destroy or eliminate the target, or reduce its population by 71-100% within ten years or three generations. 3 = High: Within the scope, the threat is likely to seriously degrade/reduce the target or reduce its population by 31-70% within ten years or three generations. 2 = Medium: Within the scope, the threat is likely to moderately degrade/reduce the target or reduce its population by 11-30% within ten years or three generations. 1 = Low: Within the scope, the threat is likely to only slightly degrade/reduce the target or reduce its population by 1-10% within ten years or three generations. Irreversibility – The degree to which the effects of a threat can be reversed and the target affected by the threat restored, if the threat no longer existed. 4 = Very High: The effects of the threat cannot be reversed and it is very unlikely the target can be restored, and/or it would take more than 100 years to achieve this (e.g., wetlands converted to a shopping center). 3 = High: The effects of the threat can technically be reversed and the target restored, but it is not practically affordable and/or it would take 21-100 years to achieve this (e.g., wetland converted to agriculture). 2 = Medium: The effects of the threat can be reversed and the target restored with a reasonable commitment of resources and/or within 6-20 years (e.g., ditching and draining of wetland). 1 = Low: The effects of the threat are easily reversible and the target can be easily restored at a relatively low cost and/or within 0-5 years (e.g., off-road vehicles trespassing in wetland).
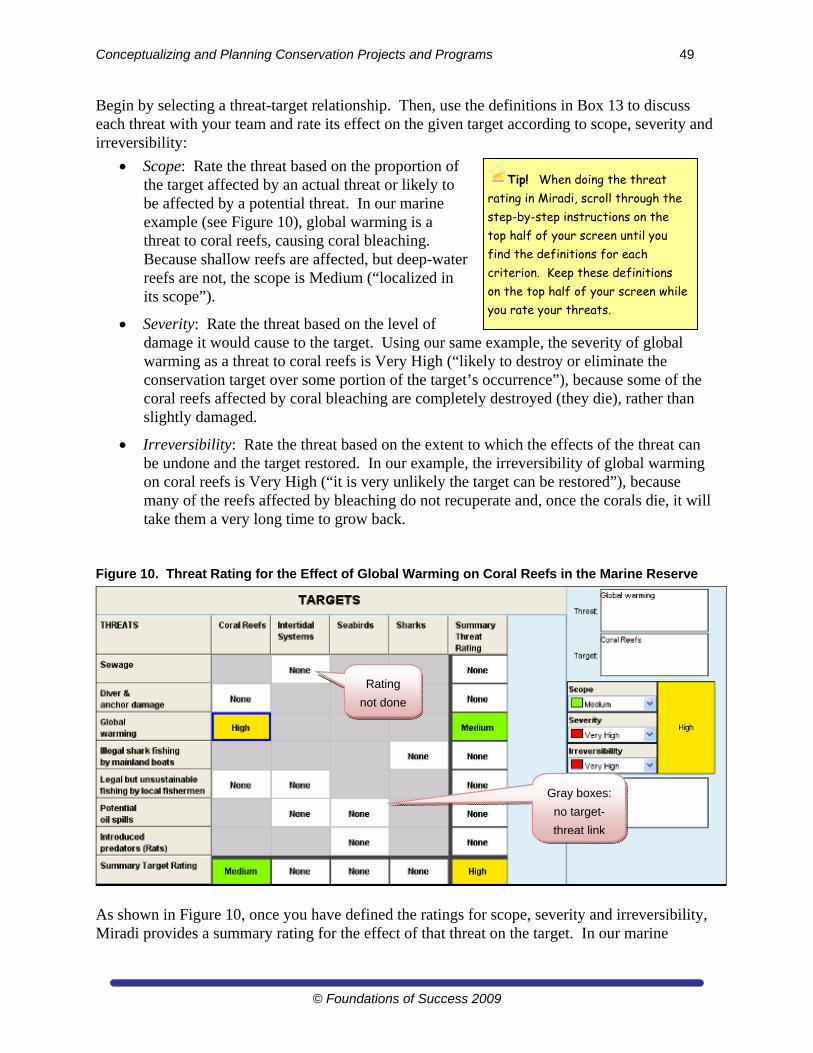
Conceptualizing and Planning Conservation Projects and Programs 49
© Foundations of Success 2009
Begin by selecting a threat-target relationship. Then, use the definitions in Box 13 to discuss each threat with your team and rate its effect on the given target according to scope, severity and irreversibility:
Scope: Rate the threat based on the proportion of the target affected by an actual threat or likely to be affected by a potential threat. In our marine example (see Figure 10), global warming is a threat to coral reefs, causing coral bleaching. Because shallow reefs are affected, but deep-water reefs are not, the scope is Medium (“localized in its scope”).
Severity: Rate the threat based on the level of damage it would cause to the target. Using our same example, the severity of global warming as a threat to coral reefs is Very High (“likely to destroy or eliminate the conservation target over some portion of the target’s occurrence”), because some of the coral reefs affected by coral bleaching are completely destroyed (they die), rather than slightly damaged.
Irreversibility: Rate the threat based on the extent to which the effects of the threat can be undone and the target restored. In our example, the irreversibility of global warming on coral reefs is Very High (“it is very unlikely the target can be restored”), because many of the reefs affected by bleaching do not recuperate and, once the corals die, it will take them a very long time to grow back.
Figure 10. Threat Rating for the Effect of Global Warming on Coral Reefs in the Marine Reserve
As shown in Figure 10, once you have defined the ratings for scope, severity and irreversibility, Miradi provides a summary rating for the effect of that threat on the target. In our marine
Tip! When doing the threat rating in Miradi, scroll through the step-by-step instructions on the top half of your screen until you find the definitions for each criterion. Keep these definitions on the top half of your screen while you rate your threats.
Rating
not done
Gray boxes:
no target-
threat link
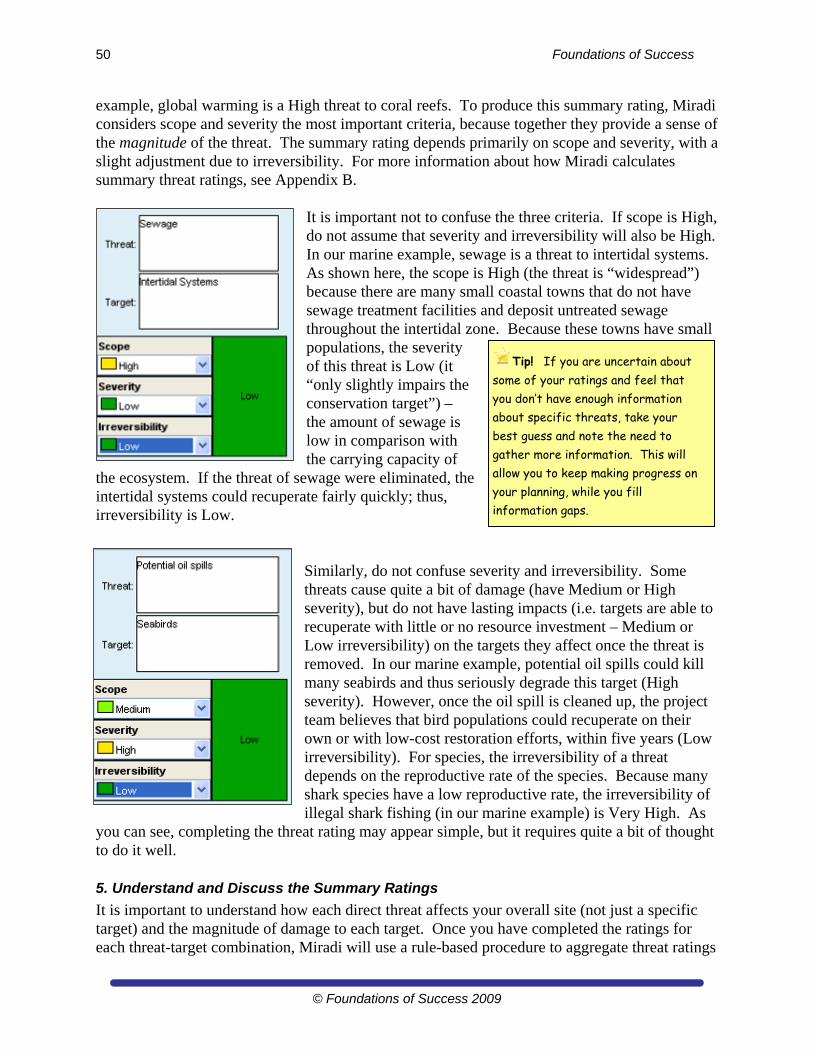
50 Foundations of Success
© Foundations of Success 2009
example, global warming is a High threat to coral reefs. To produce this summary rating, Miradi considers scope and severity the most important criteria, because together they provide a sense of the magnitude of the threat. The summary rating depends primarily on scope and severity, with a slight adjustment due to irreversibility. For more information about how Miradi calculates summary threat ratings, see Appendix B.
It is important not to confuse the three criteria. If scope is High, do not assume that severity and irreversibility will also be High. In our marine example, sewage is a threat to intertidal systems. As shown here, the scope is High (the threat is “widespread”) because there are many small coastal towns that do not have sewage treatment facilities and deposit untreated sewage throughout the intertidal zone. Because these towns have small populations, the severity of this threat is Low (it “only slightly impairs the conservation target”) – the amount of sewage is low in comparison with the carrying capacity of
the ecosystem. If the threat of sewage were eliminated, the intertidal systems could recuperate fairly quickly; thus, irreversibility is Low.
Similarly, do not confuse severity and irreversibility. Some threats cause quite a bit of damage (have Medium or High severity), but do not have lasting impacts (i.e. targets are able to recuperate with little or no resource investment – Medium or Low irreversibility) on the targets they affect once the threat is removed. In our marine example, potential oil spills could kill many seabirds and thus seriously degrade this target (High severity). However, once the oil spill is cleaned up, the project team believes that bird populations could recuperate on their own or with low-cost restoration efforts, within five years (Low irreversibility). For species, the irreversibility of a threat depends on the reproductive rate of the species. Because many shark species have a low reproductive rate, the irreversibility of illegal shark fishing (in our marine example) is Very High. As
you can see, completing the threat rating may appear simple, but it requires quite a bit of thought to do it well. 5. Understand and Discuss the Summary Ratings
It is important to understand how each direct threat affects your overall site (not just a specific target) and the magnitude of damage to each target. Once you have completed the ratings for each threat-target combination, Miradi will use a rule-based procedure to aggregate threat ratings
Tip! If you are uncertain about some of your ratings and feel that you don’t have enough information about specific threats, take your best guess and note the need to gather more information. This will allow you to keep making progress on your planning, while you fill information gaps.
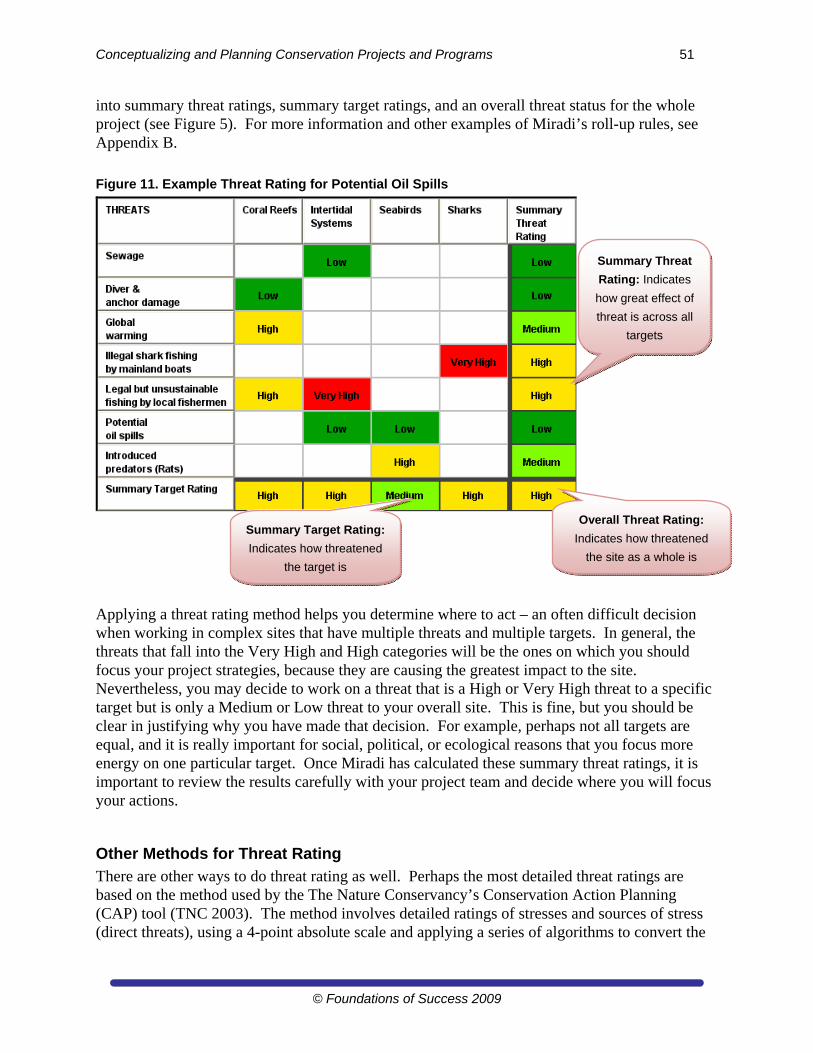
Conceptualizing and Planning Conservation Projects and Programs 51
© Foundations of Success 2009
into summary threat ratings, summary target ratings, and an overall threat status for the whole project (see Figure 5). For more information and other examples of Miradi’s roll-up rules, see Appendix B.
Figure 11. Example Threat Rating for Potential Oil Spills
Applying a threat rating method helps you determine where to act – an often difficult decision when working in complex sites that have multiple threats and multiple targets. In general, the threats that fall into the Very High and High categories will be the ones on which you should focus your project strategies, because they are causing the greatest impact to the site. Nevertheless, you may decide to work on a threat that is a High or Very High threat to a specific target but is only a Medium or Low threat to your overall site. This is fine, but you should be clear in justifying why you have made that decision. For example, perhaps not all targets are equal, and it is really important for social, political, or ecological reasons that you focus more energy on one particular target. Once Miradi has calculated these summary threat ratings, it is important to review the results carefully with your project team and decide where you will focus your actions.
Other Methods for Threat Rating
There are other ways to do threat rating as well. Perhaps the most detailed threat ratings are based on the method used by the The Nature Conservancy’s Conservation Action Planning (CAP) tool (TNC 2003). The method involves detailed ratings of stresses and sources of stress (direct threats), using a 4-point absolute scale and applying a series of algorithms to convert the
Overall Threat Rating:
Indicates how threatened
the site as a whole is
Summary Threat
Rating: Indicates
how great effect of
threat is across all
targets
Summary Target Rating:
Indicates how threatened
the target is
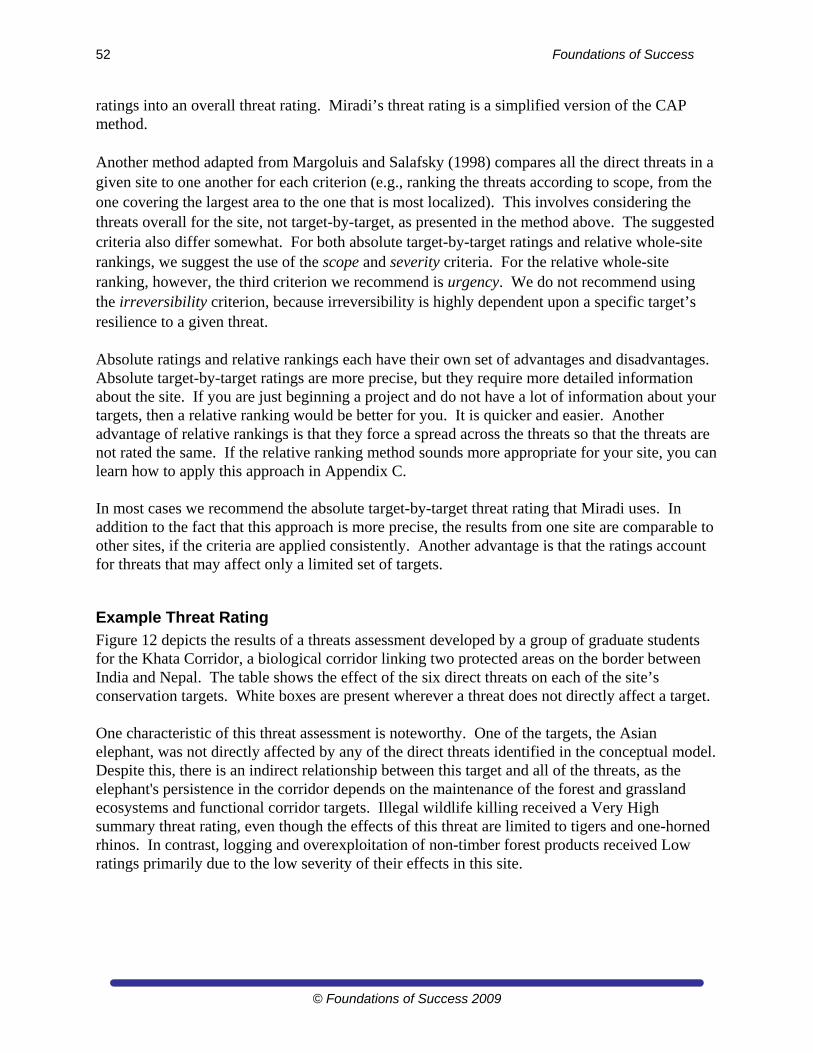
52 Foundations of Success
© Foundations of Success 2009
ratings into an overall threat rating. Miradi’s threat rating is a simplified version of the CAP method. Another method adapted from Margoluis and Salafsky (1998) compares all the direct threats in a given site to one another for each criterion (e.g., ranking the threats according to scope, from the one covering the largest area to the one that is most localized). This involves considering the threats overall for the site, not target-by-target, as presented in the method above. The suggested criteria also differ somewhat. For both absolute target-by-target ratings and relative whole-site rankings, we suggest the use of the scope and severity criteria. For the relative whole-site ranking, however, the third criterion we recommend is urgency. We do not recommend using the irreversibility criterion, because irreversibility is highly dependent upon a specific target’s resilience to a given threat. Absolute ratings and relative rankings each have their own set of advantages and disadvantages. Absolute target-by-target ratings are more precise, but they require more detailed information about the site. If you are just beginning a project and do not have a lot of information about your targets, then a relative ranking would be better for you. It is quicker and easier. Another advantage of relative rankings is that they force a spread across the threats so that the threats are not rated the same. If the relative ranking method sounds more appropriate for your site, you can learn how to apply this approach in Appendix C. In most cases we recommend the absolute target-by-target threat rating that Miradi uses. In addition to the fact that this approach is more precise, the results from one site are comparable to other sites, if the criteria are applied consistently. Another advantage is that the ratings account for threats that may affect only a limited set of targets.
Example Threat Rating
Figure 12 depicts the results of a threats assessment developed by a group of graduate students for the Khata Corridor, a biological corridor linking two protected areas on the border between India and Nepal. The table shows the effect of the six direct threats on each of the site’s conservation targets. White boxes are present wherever a threat does not directly affect a target. One characteristic of this threat assessment is noteworthy. One of the targets, the Asian elephant, was not directly affected by any of the direct threats identified in the conceptual model. Despite this, there is an indirect relationship between this target and all of the threats, as the elephant's persistence in the corridor depends on the maintenance of the forest and grassland ecosystems and functional corridor targets. Illegal wildlife killing received a Very High summary threat rating, even though the effects of this threat are limited to tigers and one-horned rhinos. In contrast, logging and overexploitation of non-timber forest products received Low ratings primarily due to the low severity of their effects in this site.
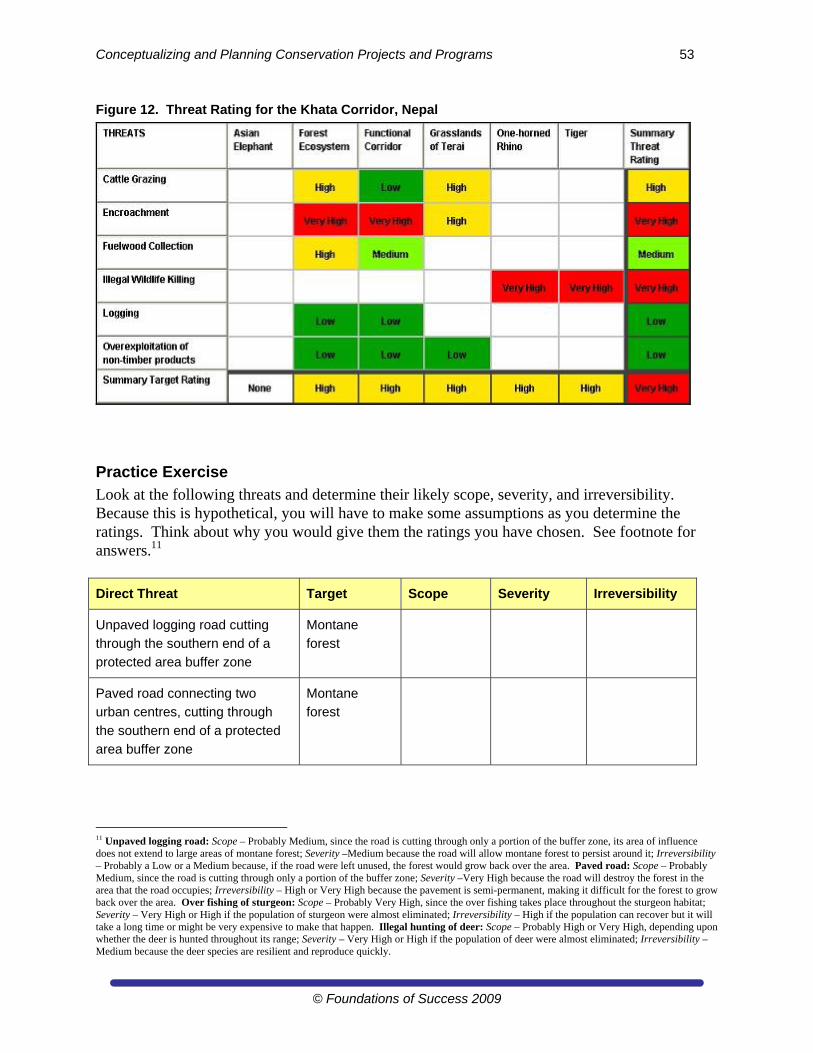
Conceptualizing and Planning Conservation Projects and Programs 53
© Foundations of Success 2009
Figure 12. Threat Rating for the Khata Corridor, Nepal
Practice Exercise
Look at the following threats and determine their likely scope, severity, and irreversibility. Because this is hypothetical, you will have to make some assumptions as you determine the ratings. Think about why you would give them the ratings you have chosen. See footnote for answers.11
Direct Threat Target Scope Severity Irreversibility
Unpaved logging road cutting
through the southern end of a
protected area buffer zone
Montane
forest
Paved road connecting two
urban centres, cutting through
the southern end of a protected
area buffer zone
Montane
forest
11 Unpaved logging road: Scope – Probably Medium, since the road is cutting through only a portion of the buffer zone, its area of influence does not extend to large areas of montane forest; Severity –Medium because the road will allow montane forest to persist around it; Irreversibility – Probably a Low or a Medium because, if the road were left unused, the forest would grow back over the area. Paved road: Scope – Probably Medium, since the road is cutting through only a portion of the buffer zone; Severity –Very High because the road will destroy the forest in the area that the road occupies; Irreversibility – High or Very High because the pavement is semi-permanent, making it difficult for the forest to grow back over the area. Over fishing of sturgeon: Scope – Probably Very High, since the over fishing takes place throughout the sturgeon habitat; Severity – Very High or High if the population of sturgeon were almost eliminated; Irreversibility – High if the population can recover but it will take a long time or might be very expensive to make that happen. Illegal hunting of deer: Scope – Probably High or Very High, depending upon whether the deer is hunted throughout its range; Severity – Very High or High if the population of deer were almost eliminated; Irreversibility – Medium because the deer species are resilient and reproduce quickly.
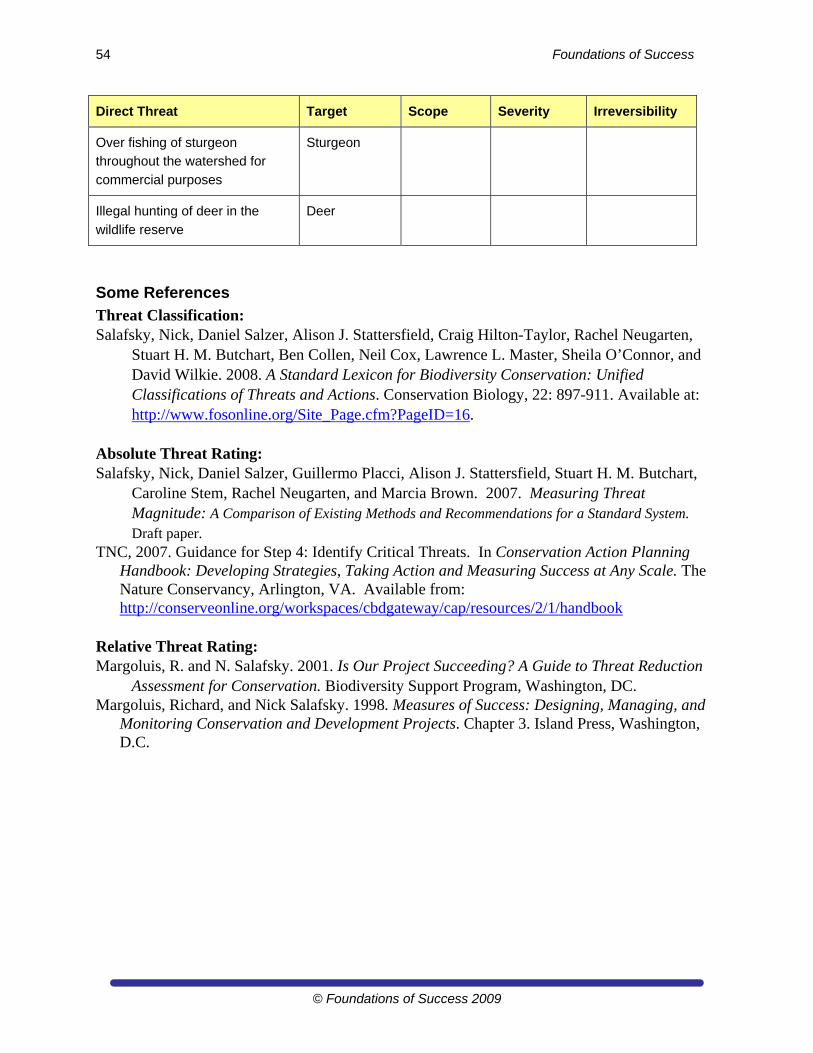
54 Foundations of Success
© Foundations of Success 2009
Direct Threat Target Scope Severity Irreversibility
Over fishing of sturgeon
throughout the watershed for
commercial purposes
Sturgeon
Illegal hunting of deer in the
wildlife reserve
Deer
Some References
Threat Classification: Salafsky, Nick, Daniel Salzer, Alison J. Stattersfield, Craig Hilton-Taylor, Rachel Neugarten,
Stuart H. M. Butchart, Ben Collen, Neil Cox, Lawrence L. Master, Sheila O’Connor, and David Wilkie. 2008. A Standard Lexicon for Biodiversity Conservation: Unified Classifications of Threats and Actions. Conservation Biology, 22: 897-911. Available at: http://www.fosonline.org/Site_Page.cfm?PageID=16.
Absolute Threat Rating: Salafsky, Nick, Daniel Salzer, Guillermo Placci, Alison J. Stattersfield, Stuart H. M. Butchart,
Caroline Stem, Rachel Neugarten, and Marcia Brown. 2007. Measuring Threat Magnitude: A Comparison of Existing Methods and Recommendations for a Standard System. Draft paper.
TNC, 2007. Guidance for Step 4: Identify Critical Threats. In Conservation Action Planning Handbook: Developing Strategies, Taking Action and Measuring Success at Any Scale. The Nature Conservancy, Arlington, VA. Available from: http://conserveonline.org/workspaces/cbdgateway/cap/resources/2/1/handbook
Relative Threat Rating: Margoluis, R. and N. Salafsky. 2001. Is Our Project Succeeding? A Guide to Threat Reduction
Assessment for Conservation. Biodiversity Support Program, Washington, DC. Margoluis, Richard, and Nick Salafsky. 1998. Measures of Success: Designing, Managing, and
Monitoring Conservation and Development Projects. Chapter 3. Island Press, Washington, D.C.
Conceptualizing and Planning Conservation Projects and Programs 55
© Foundations of Success 2009
Assignment 5 – Identify and Rate Your Critical Threats
Identify the direct threats affecting each of your conservation targets and link them to the targets in the Diagram view of Miradi.
Use the Threat Rating view of Miradi to do your rating.
o Rank each threat by target for scope, severity, and irreversibility. Where you lack information, make your best guess at the rating, but be sure to note any questions or concerns you have.
o Review Miradi’s summary ratings for each threat, for each target and for the overall site.
In a separate Word document, briefly reflect on the process of conducting your threat rating. Write a short summary (1-2 paragraphs) of your observations about:
o The process in general.
o Did the results surprise you? Were the results what you expected? Why or why not?
o Did you have any challenges in applying the rating?
Export your Miradi file as an mpz file.
Hand in your assignment (Word document + mpz file) as Assignment 5.
Conceptualizing and Planning Conservation Projects and Programs 56
© Foundations of Success 2009
Step 1D. Complete Situation Analysis (Week 6)
Structure for Week 6. In this week you will:
Read Introduction to Situation Analysis, How to Complete a Situation Analysis and Examples.
Hand in Assignment 6.
Introduction to Situation Analysis Before you even begin to think about what you should do to protect biodiversity at your site, you need to have a clear understanding of what is happening there. A situation analysis is a process that will help you and your project team create a common understanding of your project’s context – including the biological environment and the social, economic, political, and institutional systems that affect the conservation targets you want to conserve. This practice is one that is sometimes overlooked – at least, not explicitly carried out – in conservation projects, yet it is one of the most important steps to consider. By understanding the biological and human context, you will have a better chance of developing appropriate goals and objectives and designing strategies that will help you achieve them. The challenge here is to make your logic explicit without spending too much time on trying to develop a perfect model of reality. A situation analysis involves an analysis of the key factors affecting your targets – including direct threats, indirect threats and opportunities, and enabling conditions. Often project teams think they have a shared understanding of their project’s context and what the main threats and opportunities are. In going through a formal process to gather information about the site and using it to document underlying assumptions about the project’s context, however, project teams often find they have somewhat different perceptions of the same situation. For example, biologists tend to focus on the biological aspects of the site, whereas development organizations tend to focus on the socioeconomic aspects. A situation analysis helps all project team members come to a common understanding of your site’s context, its critical threats, and the underlying factors (indirect threats and opportunities) you should be considering in your project planning.
How to Complete a Situation Analysis and Document the Results
1. Gather Information about the Factors Affecting Your Conservation Targets
In the previous sections, you conducted a viability assessment and rated the direct threats to your conservation targets. To plan actions to conserve those targets, you need to know about the indirect threats and opportunities that influence those direct threats and the viability of the targets. A situation analysis is an analysis of these factors (direct threats, indirect threats and opportunities). The project team can conduct a situation analysis at varying levels of detail, depending on how much knowledge they have about the site, the conservation targets, and the biological, social, economic, political, and cultural factors that may be influencing the health of the targets. For example, a team that has been working for several years on forest management may have a good idea about the current condition of the forests and the extent to which they are threatened by clearcutting, selective logging, slash-and-burn agriculture, road construction and other actions. This same team, however, may feel the need to gather information or consult with
Conceptualizing and Planning Conservation Projects and Programs 57
© Foundations of Success 2009
specialists about issues driving direct threats, such as national and international demand for high-value timber, local community livelihood strategies, and how the policy environment influences resource use and extraction. A project team that is just beginning to work in a site will generally need to dedicate several months to their situation analysis before planning their project interventions. Sources of information can include: 1) existing literature (scientific publications, grey literature, etc.); 2) new or primary research conducted by your team;and/or 3) key informants, such as resource users, community members, scientists, project managers or others who know something about the current and historic status of each of the targets and what practices are currently affecting (or have historically affected) these ecosystems and species. Thus, a situation analysis can involve anything from a cursory review of existing information and a relatively brief discussion with key informants to an in-depth analysis of documents and a more lengthy process of consultation with key informants. Use your judgment in deciding how much time and energy to devote to a situation analysis. Because a situation analysis lays the groundwork for all subsequent steps in your planning process, it is very important. On the other hand, projects should not get caught in “planning paralysis,” spending months or even years gathering information without implementing activities. You have already gathered information relevant for part of your situation analysis. In selecting your conservation targets and conducting a viability assessment of them, it is likely that you have already reviewed documents and talked with scientists who are knowledgeable about the condition of your conservation targets. In doing your threat rating, you have probably also gathered information about the direct threats to your conservation targets. To complete your situation analysis, you should follow these steps: a) For Each Direct Threat, Identify the Factors (Indirect Threats and Opportunities) Driving or Leading to the Direct Threats That Are Affecting Your Site
These factors may include economic, political, institutional, social, or cultural influences. Examples of common indirect threats include weak legislation and enforcement, strong market demand, and limited environmental awareness or conscience. Conversely, you might have opportunities or create them around similar issues – for example, strong legislation, markets for certified products, a high level of awareness of conservation issues and cultural values that support conservation and sustainable resource management. Questions to consider for this step include:
Who is involved in this direct threat? What exactly are they doing? Why are they conducting these activities?
What incentives and disincentives influence this direct threat?
What economic, political, institutional, social or cultural factors contribute to this threat?
Are there positive factors (opportunities) that currently contribute or potentially could contribute to decreasing this threat?
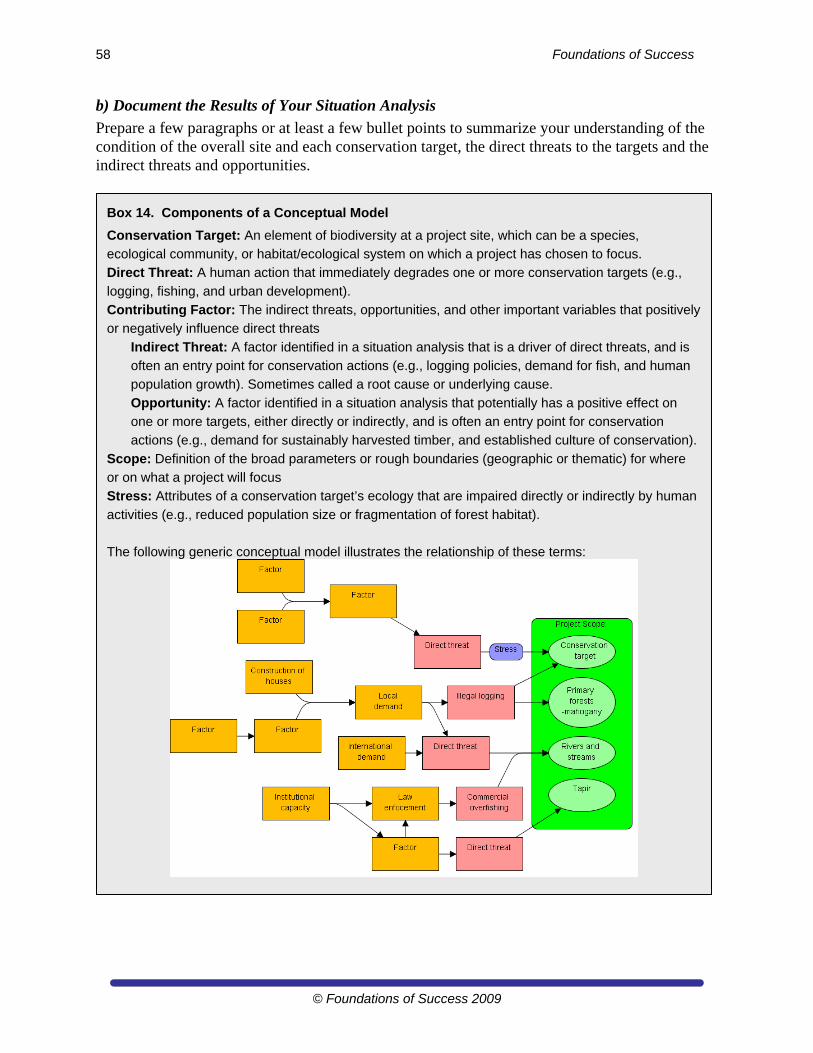
58 Foundations of Success
© Foundations of Success 2009
b) Document the Results of Your Situation Analysis
Prepare a few paragraphs or at least a few bullet points to summarize your understanding of the condition of the overall site and each conservation target, the direct threats to the targets and the indirect threats and opportunities.
Box 14. Components of a Conceptual Model
Conservation Target: An element of biodiversity at a project site, which can be a species,
ecological community, or habitat/ecological system on which a project has chosen to focus.
Direct Threat: A human action that immediately degrades one or more conservation targets (e.g.,
logging, fishing, and urban development).
Contributing Factor: The indirect threats, opportunities, and other important variables that positively
or negatively influence direct threats
Indirect Threat: A factor identified in a situation analysis that is a driver of direct threats, and is
often an entry point for conservation actions (e.g., logging policies, demand for fish, and human
population growth). Sometimes called a root cause or underlying cause.
Opportunity: A factor identified in a situation analysis that potentially has a positive effect on
one or more targets, either directly or indirectly, and is often an entry point for conservation
actions (e.g., demand for sustainably harvested timber, and established culture of conservation).
Scope: Definition of the broad parameters or rough boundaries (geographic or thematic) for where
or on what a project will focus
Stress: Attributes of a conservation target’s ecology that are impaired directly or indirectly by human
activities (e.g., reduced population size or fragmentation of forest habitat).
The following generic conceptual model illustrates the relationship of these terms:
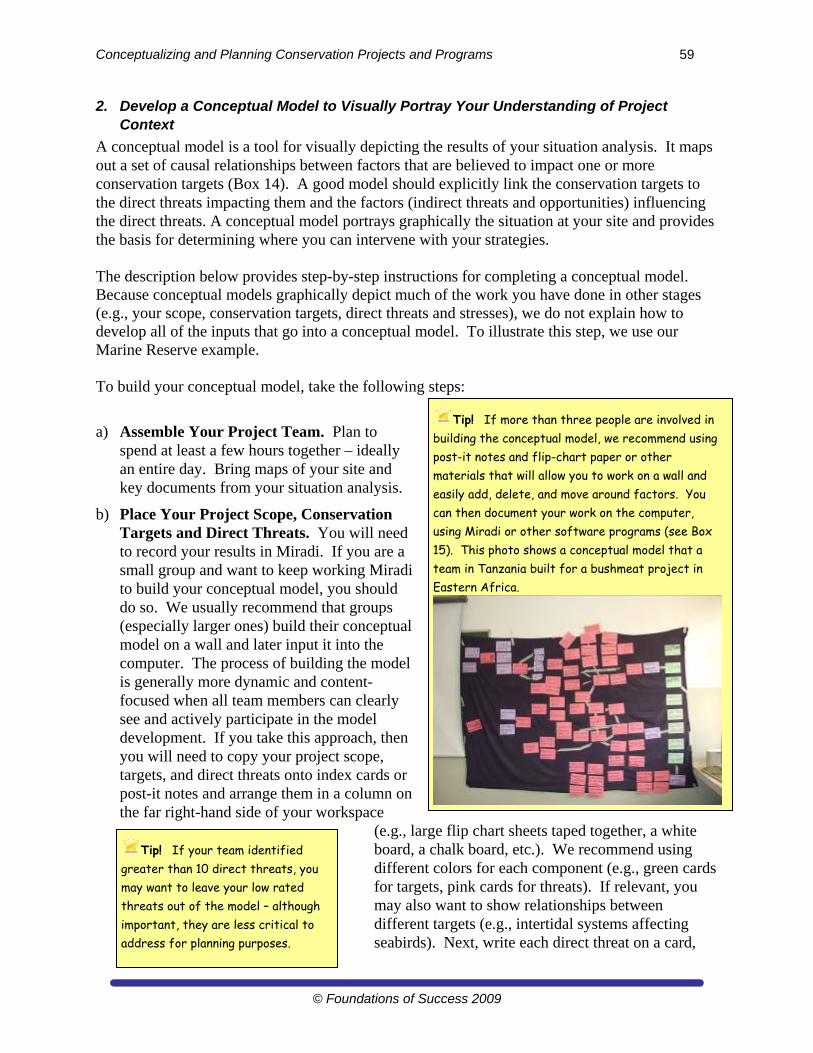
Conceptualizing and Planning Conservation Projects and Programs 59
© Foundations of Success 2009
2. Develop a Conceptual Model to Visually Portray Your Understanding of Project Context
A conceptual model is a tool for visually depicting the results of your situation analysis. It maps out a set of causal relationships between factors that are believed to impact one or more conservation targets (Box 14). A good model should explicitly link the conservation targets to the direct threats impacting them and the factors (indirect threats and opportunities) influencing the direct threats. A conceptual model portrays graphically the situation at your site and provides the basis for determining where you can intervene with your strategies. The description below provides step-by-step instructions for completing a conceptual model. Because conceptual models graphically depict much of the work you have done in other stages (e.g., your scope, conservation targets, direct threats and stresses), we do not explain how to develop all of the inputs that go into a conceptual model. To illustrate this step, we use our Marine Reserve example. To build your conceptual model, take the following steps:
a) Assemble Your Project Team. Plan to spend at least a few hours together – ideally an entire day. Bring maps of your site and key documents from your situation analysis.
b) Place Your Project Scope, Conservation Targets and Direct Threats. You will need to record your results in Miradi. If you are a small group and want to keep working Miradi to build your conceptual model, you should do so. We usually recommend that groups (especially larger ones) build their conceptual model on a wall and later input it into the computer. The process of building the model is generally more dynamic and content-focused when all team members can clearly see and actively participate in the model development. If you take this approach, then you will need to copy your project scope, targets, and direct threats onto index cards or post-it notes and arrange them in a column on the far right-hand side of your workspace
(e.g., large flip chart sheets taped together, a white board, a chalk board, etc.). We recommend using different colors for each component (e.g., green cards for targets, pink cards for threats). If relevant, you may also want to show relationships between different targets (e.g., intertidal systems affecting seabirds). Next, write each direct threat on a card,
Tip! If more than three people are involved in building the conceptual model, we recommend using post-it notes and flip-chart paper or other materials that will allow you to work on a wall and easily add, delete, and move around factors. You can then document your work on the computer, using Miradi or other software programs (see Box 15). This photo shows a conceptual model that a team in Tanzania built for a bushmeat project in Eastern Africa.
Tip! If your team identified greater than 10 direct threats, you may want to leave your low rated threats out of the model – although important, they are less critical to address for planning purposes.
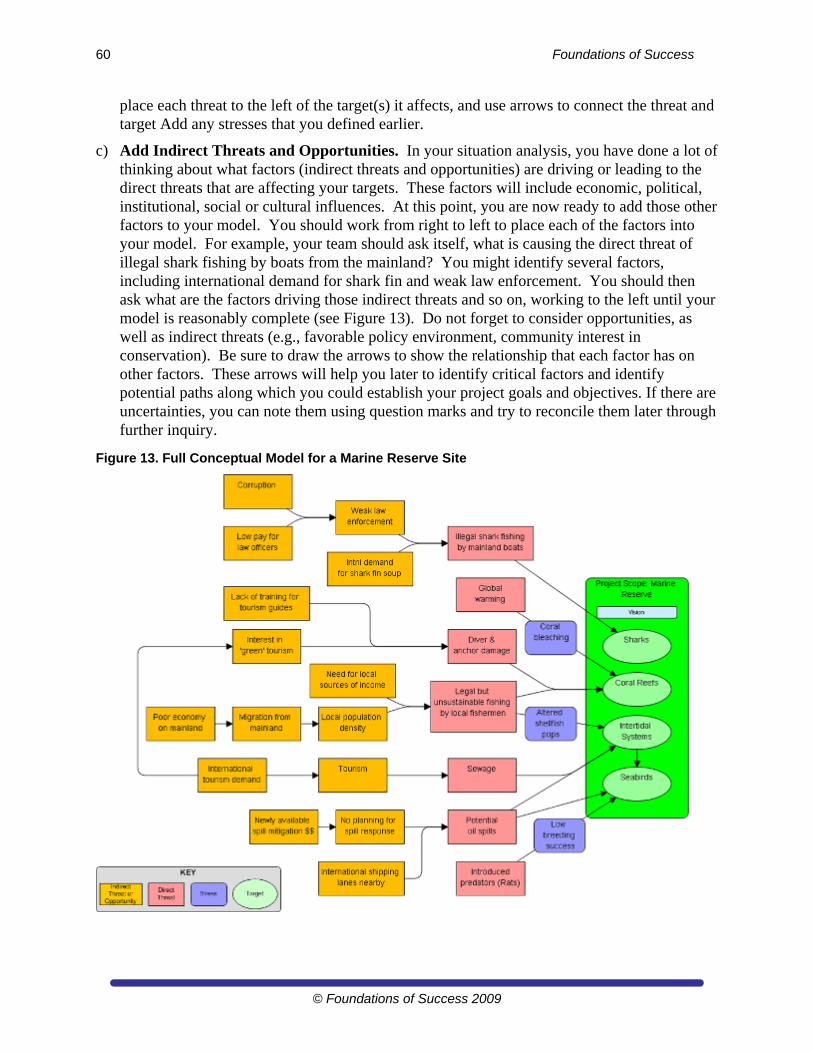
60 Foundations of Success
© Foundations of Success 2009
place each threat to the left of the target(s) it affects, and use arrows to connect the threat and target Add any stresses that you defined earlier.
c) Add Indirect Threats and Opportunities. In your situation analysis, you have done a lot of thinking about what factors (indirect threats and opportunities) are driving or leading to the direct threats that are affecting your targets. These factors will include economic, political, institutional, social or cultural influences. At this point, you are now ready to add those other factors to your model. You should work from right to left to place each of the factors into your model. For example, your team should ask itself, what is causing the direct threat of illegal shark fishing by boats from the mainland? You might identify several factors, including international demand for shark fin and weak law enforcement. You should then ask what are the factors driving those indirect threats and so on, working to the left until your model is reasonably complete (see Figure 13). Do not forget to consider opportunities, as well as indirect threats (e.g., favorable policy environment, community interest in conservation). Be sure to draw the arrows to show the relationship that each factor has on other factors. These arrows will help you later to identify critical factors and identify potential paths along which you could establish your project goals and objectives. If there are uncertainties, you can note them using question marks and try to reconcile them later through further inquiry.
Figure 13. Full Conceptual Model for a Marine Reserve Site
Conceptualizing and Planning Conservation Projects and Programs 61
© Foundations of Success 2009
As you add indirect threats and opportunities, identify relevant stakeholder groups. Each of the threat and opportunity factors included in your conceptual model has one or more stakeholder groups associated with it. As you are identifying indirect threats and opportunities, make sure you are capturing the activities and motivations of key stakeholder groups. Keep the following questions in mind:
Who is undertaking what activities that contribute to this direct threat, indirect threat or opportunity?
What are their motivations? Are their actions driven by economic dependency (livelihood) or economic advantage? Are these resources replaceable by other resources? Do they have legal jurisdiction over the use of the resource and regulate its use for conservation, economic development or another purpose? Are they working to conserve the resource? Have they conducted research on the resource?
What is the feasibility of changing their behaviour?
d) Complete Your Model. As you work, you may have to rearrange, add, delete, or combine cards. Although the process may seem straightforward, you will find that you and your project team will have some lively debates about what should go where. You also may debate about how much detail to include. A general rule of thumb is to keep your model to 35-40 boxes total.
e) Document Your Work. At the end of the meeting, capture what you have done in Miradi (or using a computer flow-chart program, see Box 15). You may also want to develop brief text paragraphs describing each part of the model. These will provide detail that will be useful to describing your model to others who did not participate, as well as for formally documenting group discussions and decisions.
f) Discuss Your Model. Discuss with your group your confidence level in the different portions of the model and which stakeholders or other experts you might need to consult to vet different sections of your model. Assign follow-up tasks as necessary.
g) USE Your Conceptual Model! A conceptual model is one of the most helpful and versatile tools you will use for your project planning. The process of building a conceptual model with your project team helps all team members explicitly state their assumptions about what is happening at your site and collectively come to an understanding about your site and what you need to do as a team. The model itself is a useful communications tool for
Tip! Don’t strive for perfection – strive for a product that will help you and your project team members effectively summarize what is happening at your site and decide what to do in a strategic fashion.
Box 15. Software Programs You Can Use to
Capture Your Conceptual Model
Miradi Adaptive Management Software –
Use the Diagram mode to develop your
conceptual model.
MS Visio - This is diagramming software
with features that facilitate digitizing flow
charts such as conceptual models.
MS Word or MS PowerPoint - You can
use the drawing feature in these programs,
but this is more time-consuming and less
flexible than Miradi or MS Visio.
62 Foundations of Success
© Foundations of Success 2009
your project team, as well as for people outside of your project. It provides a quick, easy-to-understand overview of your project site and the rationale for your project’s goals, objectives, and activities. A conceptual model also provides you with the building blocks for developing results chains – a tool that helps make explicit the logical series of results that link your strategies to your targets, in a more detailed fashion than is realistically possible with a conceptual model. Your project team should revisit your conceptual model at least once a year to determine if there are any new threats or factors (or ones that you may have missed in your earlier model) that are now affecting your targets. If so, you will need to make decisions about if and how you will address them.
h) Get Feedback on Your Model. Consult with stakeholders and other experts and then reconvene with your team to discuss how you might change your model based on this input.
Examples As explained earlier, one can document the results of a situation analysis by writing a few paragraphs of text or just a few bullets that summarize your understanding of the condition of the overall site and each conservation target, the direct threats to biodiversity and the indirect threats and opportunities. Here we provide an example of bulleted text explaining a direct threat and the indirect threats and opportunities influencing one of the conservation targets in our Marine Reserve site. Conservation target: Sharks Direct Threat: Boats from the mainland not only capture sharks accidentally, as bycatch, but some of them also target sharks. They capture them using primarily longlines. Some of these boats operate at night. When they capture a shark, they cut off the shark fins and toss the rest of the shark back into the ocean. Indirect Threats and Opportunities:
There is strong international demand for shark fin. Shark fin soup is a delicacy in China and Hong Kong. As shark populations have declined worldwide over the past few years, the price of shark fin has increased.
It is illegal for fishing boats to keep and sell shark products. If sharks are captured as by-catch, the boats are supposed to return the whole shark to the ocean. When boats come into the municipal dock on the mainland, fisheries officers can check their product and, if they find shark parts, then they are authorized to confiscate them and fine the boat US $500. Law enforcement is weak, however. The Fisheries Department does not have enough personnel, so they only check the boats occasionally. Also, because the boats return to the mainland from a large coastal area and bring in different products (finfish, shrimp, etc.), the fisheries officers are more focused on implementing size limits and closed seasons for commercial fisheries than in enforcing regulations to protect sharks.
There are rumours that some fishing boats may sell their shark fins at sea. The park wardens cannot control this because the boats operate outside of the Marine Reserve. The Fisheries Department either does not have the capacity to control this activity or they
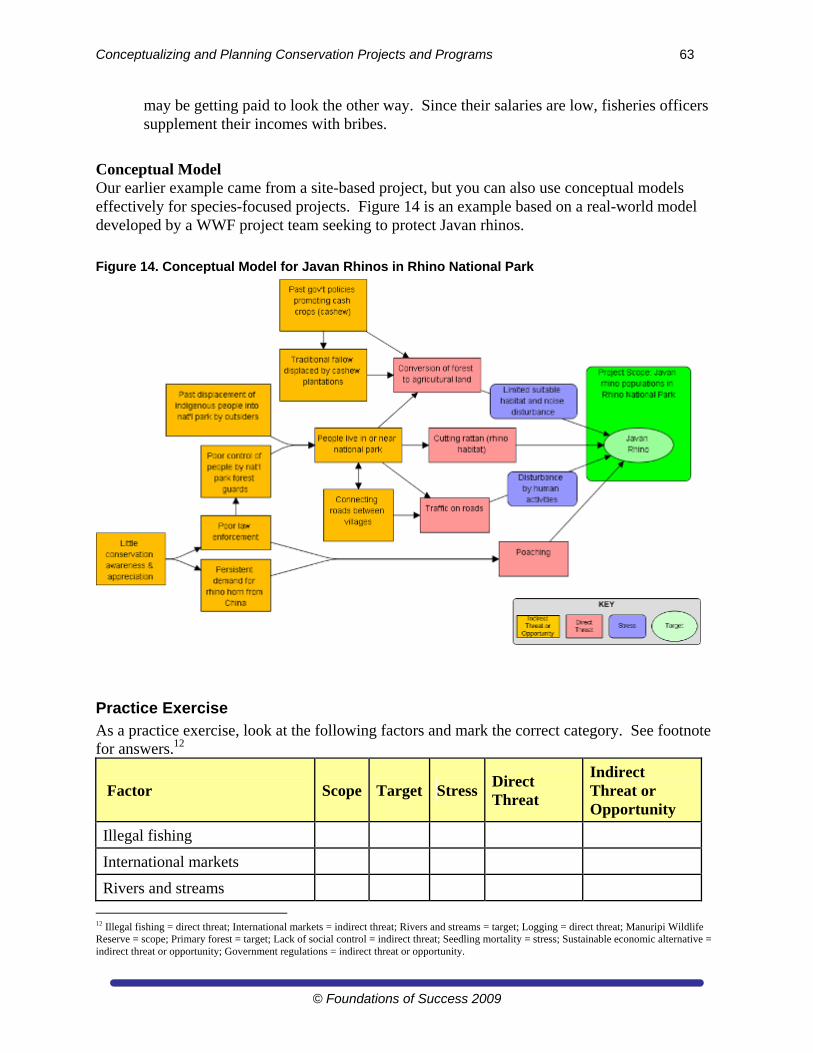
Conceptualizing and Planning Conservation Projects and Programs 63
© Foundations of Success 2009
may be getting paid to look the other way. Since their salaries are low, fisheries officers supplement their incomes with bribes.
Conceptual Model Our earlier example came from a site-based project, but you can also use conceptual models effectively for species-focused projects. Figure 14 is an example based on a real-world model developed by a WWF project team seeking to protect Javan rhinos.
Figure 14. Conceptual Model for Javan Rhinos in Rhino National Park
Practice Exercise As a practice exercise, look at the following factors and mark the correct category. See footnote for answers.12
Factor Scope Target StressDirect Threat
Indirect Threat or Opportunity
Illegal fishing
International markets
Rivers and streams
12 Illegal fishing = direct threat; International markets = indirect threat; Rivers and streams = target; Logging = direct threat; Manuripi Wildlife Reserve = scope; Primary forest = target; Lack of social control = indirect threat; Seedling mortality = stress; Sustainable economic alternative = indirect threat or opportunity; Government regulations = indirect threat or opportunity.
64 Foundations of Success
© Foundations of Success 2009
Factor Scope Target StressDirect Threat
Indirect Threat or Opportunity
Logging
Manuripi Wildlife Reserve
Primary forest
Lack of social control
Seedling mortality
Sustainable economic alternatives
Government regulations
Some References
Margoluis, Richard, and Nick Salafsky. 1998. Measures of Success: Designing, Managing, and Monitoring Conservation and Development Projects. Chapter 3. Island Press, Washington, D.C.
Margoluis, Richard and Caroline Stem. 2008. Using Conceptual Models as a Planning and Evaluation Tool in Conservation. Under review by Evaluation and Program Planning.
PPM&E Resource Portal. Source: http://portals.wi.wur.nl/ppme/ [Web site with a lot of links to good M&E resources, methods, and tools – some of which would be helpful for a situation analysis].
TNC, 2007. Guidance for Step 5: Complete Situation Analysis. In Conservation Action Planning Handbook: Developing Strategies, Taking Action and Measuring Success at Any Scale. The Nature Conservancy, Arlington, VA. Available from: http://conserveonline.org/workspaces/cbdgateway/cap/resources/2/1/handbook
World Conservation Union M&E Initiative. Situation Analysis: An Approach and Method for Analyzing the Context of Projects and Programmes. World Conservation Union, Gland, Switzerland. Available from: http://cmsdata.iucn.org/downloads/approach_and_method.pdf
WWF. 2006. Step 1.4. Define Situation Analysis. Resources for Implementing the WWF Project & Programme Standards. Available from: http://www.panda.org/what_we_do/how_we_work/conservation/programme_standards.
Assignment 6 – Develop a Conceptual Model and Complete a Course Evaluation Form
In real life, it is always important to conduct a situation analysis before developing your conceptual model. For the purposes of this learning module, however, we realize that participants do not have the time to conduct a thorough situation analysis. For this reason, we ask that you focus on developing your conceptual model based on your team’s current knowledge of your site.
Conceptualizing and Planning Conservation Projects and Programs 65
© Foundations of Success 2009
Develop a Conceptual Model
For your project, please develop a conceptual model, using the steps described above:
a. Assemble your project team
b. Place your project scope, conservation targets and direct threats
c. Add indirect threats and opportunities
d. Complete your model
e. Document your work in the Diagram view of Miradi
Write 1-2 pages of text to explain your conceptual model. Describe the model from the right (conservation targets) to the left (direct threats and then indirect threats and opportunities). Since you already described your conservation targets in a previous section, you can just mention them briefly here. Focus on explaining each direct threat and the indirect threats and opportunities that contribute to it.
Complete a Course Evaluation Congratulations!! You have now finished Step 1 of the Open Standards. We would like to ask you to take a few minutes to fill out an official evaluation form – to be used for general module evaluation improvement. You can fill out this form anonymously, especially if this will help you more comfortably provide us with honest feedback – both positive and critical. This is an ongoing course that we update and improve every time we give it, so please help us to practice the adaptive management process and learn from what we do. Your facilitator will provide you with an evaluation form in advance of this assignment.
Hand in your assignment (Word document + mpz file) as Assignment 6.
Hand in your evaluation form.
66 Foundations of Success
© Foundations of Success 2009
Step 2A. Develop a Formal Action Plan: Goals, Strategies, Assumptions, & Objectives (Week 7)
Structure for Week 7. In this week you will:
Read Overview of Step 2: Plan Actions and Monitoring, Introduction to Goals, How to Develop Goals, and Examples of Goals
Hand in Assignment 7.
Overview of Step 2: Plan Actions and Monitoring Now that you have completed Step 1 (Conceptualize) of the Open Standards, you are ready to start panning your actions and monitoring. Often, if teams even do project planning, this is where they start. While some individuals might have a mental model of what is happening at their site, they have not explicitly shared and agreed upon that model with their team. You, however, should have a very clear idea of your site’s context, your vision, what you ultimately want to conserve (your conservation targets), and what is affecting their health. With all of this information at hand, you are in a good position to set relevant goals and objectives and choose strategies that are well-suited for your circumstances. In Step 2, you will first develop an action plan and then a monitoring plan. An action plan is a document that pulls together your project’s goals, strategies, objectives, and activities. Ideally, it will include the background thinking that helped you set these goals and objectives and choose your strategies. So, a complete action plan should also include your conceptual model, a text description of the current situation at your site and how you wish to affect it, your results chains (see Week 9), and any other background material that helps convey what your project will do and why. Your action plan is a core component of your overall strategic plan. Your action plan also forms the foundation for the other two components – your monitoring plan and operational plan.13 Spending time upfront developing your action plan is important because well defined goals and objectives provide an explicit and shared understanding of your project and keep your project team members focused on what you ultimately want to achieve. Without them, it is far too easy to get side-tracked by other opportunities that do not directly contribute to what your project is designed to achieve – everything seems (and often is) important, but time, money, and other resources limit what you can reasonably accomplish. A sound action plan that includes well defined goals and objectives also focuses monitoring efforts. Too often, project staff approach monitoring as if it were a fishing expedition – collecting as much information as they can but without a clear idea of how it will be used. In addition, methods and tools for conducting monitoring are often much more complicated and sophisticated than need be. Well defined goals and objectives tell you exactly what you need to monitor and help you be more efficient with your project resources. The following five chapters of this manual will introduce you to the various components of an action plan and some tools that will help you develop your action plan.
13 In this manual, we will not cover the Operational Plan.
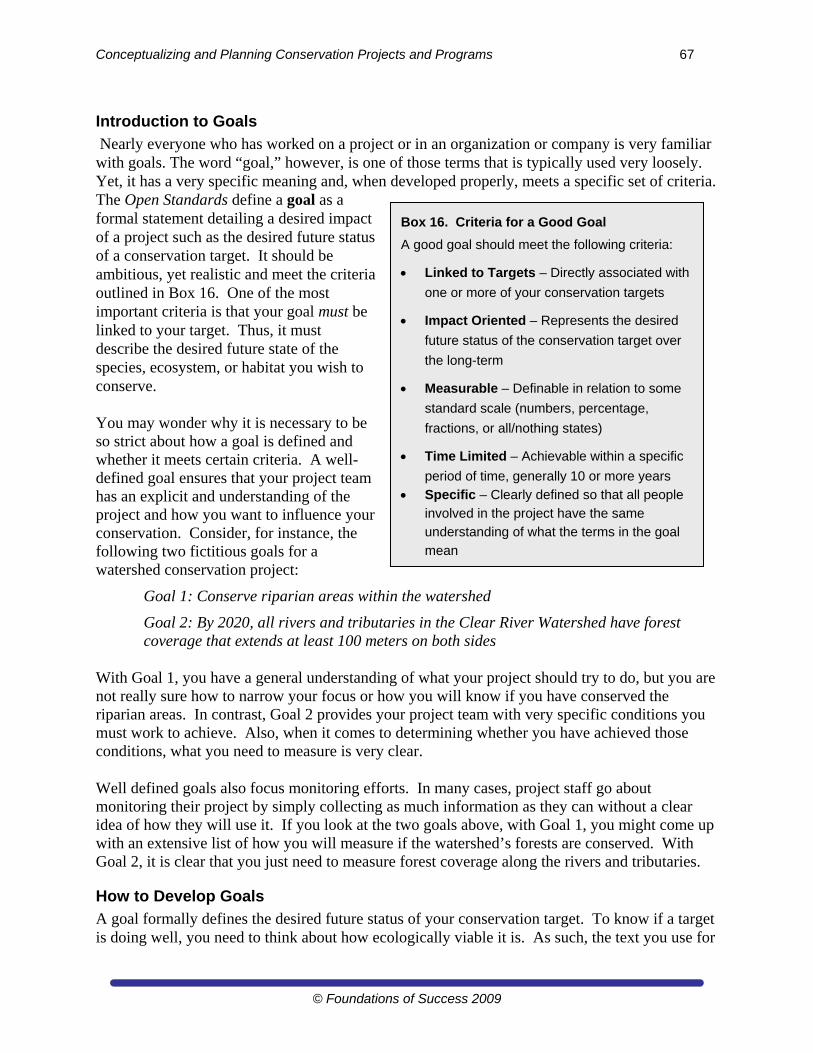
Conceptualizing and Planning Conservation Projects and Programs 67
© Foundations of Success 2009
Introduction to Goals
Nearly everyone who has worked on a project or in an organization or company is very familiar with goals. The word “goal,” however, is one of those terms that is typically used very loosely. Yet, it has a very specific meaning and, when developed properly, meets a specific set of criteria. The Open Standards define a goal as a formal statement detailing a desired impact of a project such as the desired future status of a conservation target. It should be ambitious, yet realistic and meet the criteria outlined in Box 16. One of the most important criteria is that your goal must be linked to your target. Thus, it must describe the desired future state of the species, ecosystem, or habitat you wish to conserve. You may wonder why it is necessary to be so strict about how a goal is defined and whether it meets certain criteria. A well-defined goal ensures that your project team has an explicit and understanding of the project and how you want to influence your conservation. Consider, for instance, the following two fictitious goals for a watershed conservation project:
Goal 1: Conserve riparian areas within the watershed
Goal 2: By 2020, all rivers and tributaries in the Clear River Watershed have forest coverage that extends at least 100 meters on both sides
With Goal 1, you have a general understanding of what your project should try to do, but you are not really sure how to narrow your focus or how you will know if you have conserved the riparian areas. In contrast, Goal 2 provides your project team with very specific conditions you must work to achieve. Also, when it comes to determining whether you have achieved those conditions, what you need to measure is very clear. Well defined goals also focus monitoring efforts. In many cases, project staff go about monitoring their project by simply collecting as much information as they can without a clear idea of how they will use it. If you look at the two goals above, with Goal 1, you might come up with an extensive list of how you will measure if the watershed’s forests are conserved. With Goal 2, it is clear that you just need to measure forest coverage along the rivers and tributaries.
How to Develop Goals
A goal formally defines the desired future status of your conservation target. To know if a target is doing well, you need to think about how ecologically viable it is. As such, the text you use for
Box 16. Criteria for a Good Goal
A good goal should meet the following criteria:
Linked to Targets – Directly associated with
one or more of your conservation targets
Impact Oriented – Represents the desired
future status of the conservation target over
the long-term
Measurable – Definable in relation to some
standard scale (numbers, percentage,
fractions, or all/nothing states)
Time Limited – Achievable within a specific
period of time, generally 10 or more years
Specific – Clearly defined so that all people
involved in the project have the same
understanding of what the terms in the goal
mean
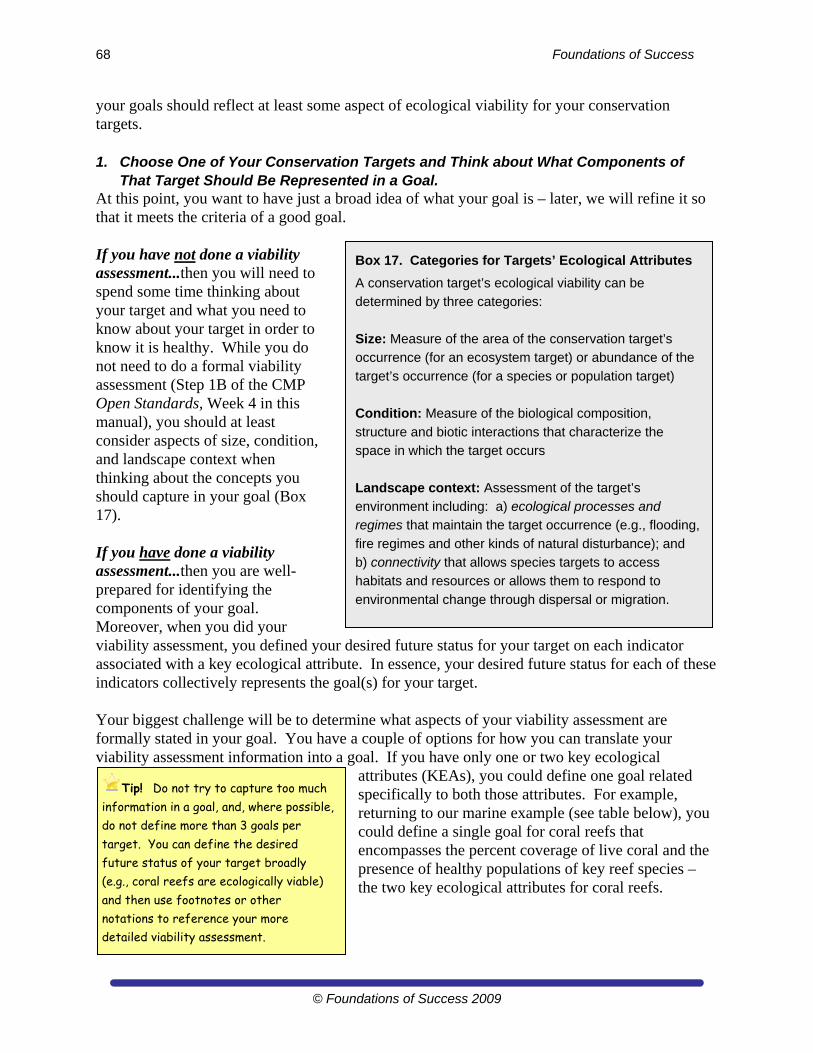
68 Foundations of Success
© Foundations of Success 2009
your goals should reflect at least some aspect of ecological viability for your conservation targets. 1. Choose One of Your Conservation Targets and Think about What Components of
That Target Should Be Represented in a Goal. At this point, you want to have just a broad idea of what your goal is – later, we will refine it so that it meets the criteria of a good goal. If you have not done a viability assessment...then you will need to spend some time thinking about your target and what you need to know about your target in order to know it is healthy. While you do not need to do a formal viability assessment (Step 1B of the CMP Open Standards, Week 4 in this manual), you should at least consider aspects of size, condition, and landscape context when thinking about the concepts you should capture in your goal (Box 17). If you have done a viability assessment...then you are well-prepared for identifying the components of your goal. Moreover, when you did your viability assessment, you defined your desired future status for your target on each indicator associated with a key ecological attribute. In essence, your desired future status for each of these indicators collectively represents the goal(s) for your target. Your biggest challenge will be to determine what aspects of your viability assessment are formally stated in your goal. You have a couple of options for how you can translate your viability assessment information into a goal. If you have only one or two key ecological
attributes (KEAs), you could define one goal related specifically to both those attributes. For example, returning to our marine example (see table below), you could define a single goal for coral reefs that encompasses the percent coverage of live coral and the presence of healthy populations of key reef species – the two key ecological attributes for coral reefs.
Tip! Do not try to capture too much information in a goal, and, where possible, do not define more than 3 goals per target. You can define the desired future status of your target broadly (e.g., coral reefs are ecologically viable) and then use footnotes or other notations to reference your more detailed viability assessment.
Box 17. Categories for Targets’ Ecological Attributes
A conservation target’s ecological viability can be
determined by three categories:
Size: Measure of the area of the conservation target’s
occurrence (for an ecosystem target) or abundance of the
target’s occurrence (for a species or population target)
Condition: Measure of the biological composition,
structure and biotic interactions that characterize the
space in which the target occurs
Landscape context: Assessment of the target’s
environment including: a) ecological processes and
regimes that maintain the target occurrence (e.g., flooding,
fire regimes and other kinds of natural disturbance); and
b) connectivity that allows species targets to access
habitats and resources or allows them to respond to
environmental change through dispersal or migration.
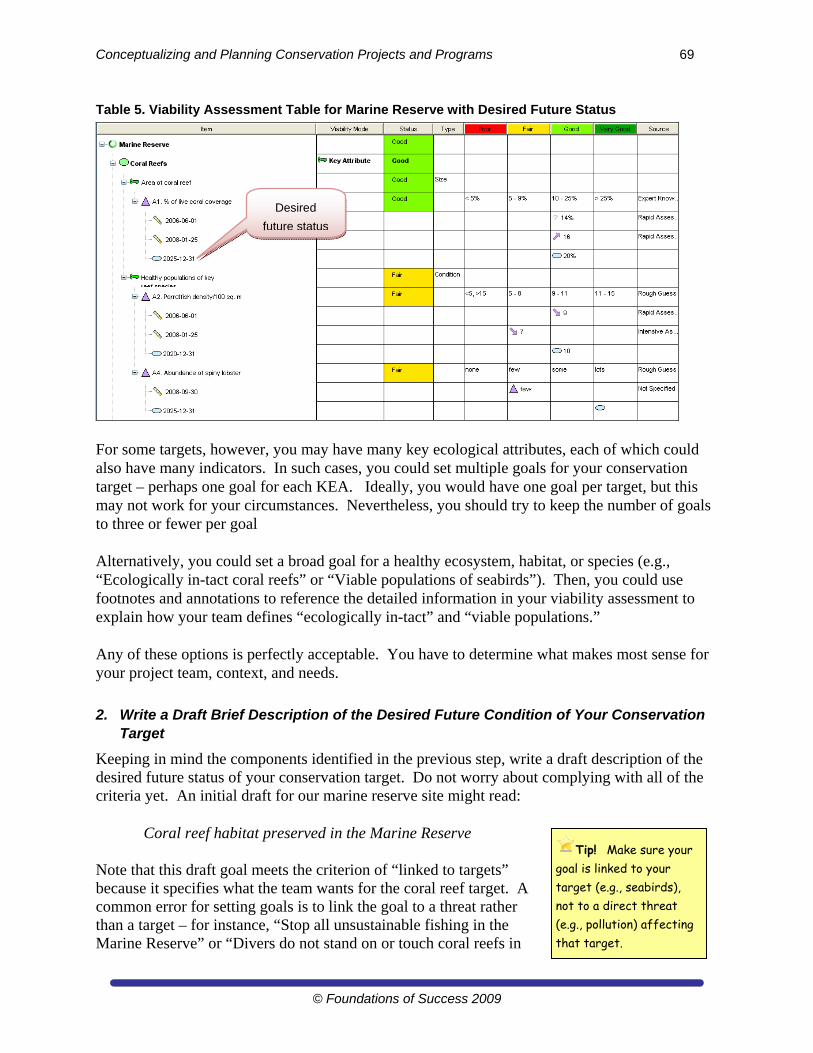
Conceptualizing and Planning Conservation Projects and Programs 69
© Foundations of Success 2009
Table 5. Viability Assessment Table for Marine Reserve with Desired Future Status
For some targets, however, you may have many key ecological attributes, each of which could also have many indicators. In such cases, you could set multiple goals for your conservation target – perhaps one goal for each KEA. Ideally, you would have one goal per target, but this may not work for your circumstances. Nevertheless, you should try to keep the number of goals to three or fewer per goal Alternatively, you could set a broad goal for a healthy ecosystem, habitat, or species (e.g., “Ecologically in-tact coral reefs” or “Viable populations of seabirds”). Then, you could use footnotes and annotations to reference the detailed information in your viability assessment to explain how your team defines “ecologically in-tact” and “viable populations.” Any of these options is perfectly acceptable. You have to determine what makes most sense for your project team, context, and needs.
2. Write a Draft Brief Description of the Desired Future Condition of Your Conservation Target
Keeping in mind the components identified in the previous step, write a draft description of the desired future status of your conservation target. Do not worry about complying with all of the criteria yet. An initial draft for our marine reserve site might read:
Coral reef habitat preserved in the Marine Reserve
Note that this draft goal meets the criterion of “linked to targets” because it specifies what the team wants for the coral reef target. A common error for setting goals is to link the goal to a threat rather than a target – for instance, “Stop all unsustainable fishing in the Marine Reserve” or “Divers do not stand on or touch coral reefs in
Desired
future status
Tip! Make sure your goal is linked to your target (e.g., seabirds), not to a direct threat (e.g., pollution) affecting that target.
70 Foundations of Success
© Foundations of Success 2009
the Marine Reserve.” Both of these statements are linked to a direct threat to the coral reef target and not to the condition of the target itself.
3. Review the Criteria for a Good Goal and Determine Whether Your Goal Meets the Criteria
Take your draft statement and go through your criteria, one by one. Working off of the example above (Coral reef habitat preserved in the Marine Reserve), your project team should ask itself:
Is it linked to a target? Yes, it is linked to the coral reef target
Is it impact oriented? Yes, it states that you want the habitat preserved, although, as the other criteria reveal, it is not clear what is meant by “preserved”
Is it measurable? No, it is not clear how you would measure “preserved.” There is not a relation to a standard scale.
Is it time limited? No, the goal statement does not specify a time period
Is it specific? No, it is not clear what is meant by “preserved.” Also, it does not say what part of the coral reef habitat is of concern.
4. Modify Your Draft Goal as Needed to Make Sure It Complies with the Criteria for a Good Goal.
For this example, you would need to work on making the initial goal more measurable, time-limited, and specific. At this point, you should also review the components (i.e., the key ecological attributes) you identified in Step 1 above and make sure they are reflected directly or indirectly in your goal. Your second draft might read:
By 2020, the coral reef habitat contains live coral and healthy populations of key species.
This new draft goal is time limited and slightly more specific and measurable.
5. Repeat Steps 3 and 4, as Needed
Although the new draft goal is getting closer to meeting the criteria, it could be made more specific and measurable by stating what part of the coral reef is of concern, how much live coral is needed, and what is meant by “healthy populations of key species.” Your third draft might read:
By 2025, at least 80% of the coral reef habitat in the northern bioregion will have live coral coverage of at least 20% and will contain healthy populations of key species* * Healthy populations of species at the top of the food chain, such as sharks, and an abundance of other key species, such as parrot fish and spiny lobster. Whether a population is “healthy” will be based on the latest scientific understanding. See viability assessment for population numbers for different species.
Conceptualizing and Planning Conservation Projects and Programs 71
© Foundations of Success 2009
As this example shows, you may have some terms in your goal statement that you need to define better. You can do this with an asterisk and a note, if including it within the text of your goal would make the goal difficult to understand. You may also have some uncertainties at the time you define your goal. This is fine, as long as you indicate them in your goal and have a plan for how you will find the information you need to clear them up.
6. Repeat Steps 1 through 5 for Each of Your Remaining Targets.
Take each of your remaining targets and develop draft goals, review your criteria, and refine them as needed.
Examples of Goals Working off the conceptual model in Figure 13 (Step 1D), here are examples of goals that meet and do not meet the criteria. Target: Intertidal systems Example of a poorly-defined goal: By 2020, sewage loads to the intertidal zone of the Marine Reserve have decreased by 50%
Review your criteria to determine why this is not a well-defined goal. (See footnote14 for the answer.)
Example of a well-defined goal: By 2020, at least 80% of the Marine Reserve’s intertidal zone supports healthy populations* of cormorants, marine iguanas, chitons, and bivalves *Healthy populations will be defined by the latest scientific data for the region Review your criteria and make sure you agree that this is a well-defined goal. Target: Seabirds Example of a poorly-defined goal: By 2025, penguins at the Marine Reserve are healthy Review your criteria to determine why this is not a well-defined goal. (See footnote15 for the answer.) Example of a well-defined goal: By 2020, at least 100 pairs of nesting penguins are successfully reproducing at the Marine Reserve, leaving 2 eggs per clutch every year. Review your criteria and make sure you agree that this is a well-defined goal.
Some References
Margoluis, Richard, and Nick Salafsky. 1998. Measures of Success: Designing, Managing, and Monitoring Conservation and Development Projects. Chapter 4. Island Press, Washington, D.C.
WWF. 2006. Step 2.1Design Action Plan: Goals, Objectives, & Activities. Resources for Implementing the WWF Project & Programme Standards. Available from: http://www.panda.org/what_we_do/how_we_work/conservation/programme_standards.
14 The goal is not linked to the intertidal zones target but rather to the threat of sewage loads. 15 The goal is not specific or measurable. It does not indicate what is meant by “healthy” nor does it indicate how many penguins would have to be healthy for the team to meet its goal. Would one healthy penguin be sufficient for the team to meet its goal?
72 Foundations of Success
© Foundations of Success 2009
Assignment 7 – Develop Goals for Conservation Targets That Meet Criteria for “Good” Goals
Part 1: Identifying Goals That Meet the Open Standards’ Criteria
For each of the following draft goals, apply the criteria for good goals and determine whether the goals meet the criteria. For each goal explain why or why not.
o Conservation Target: High-value timber species Goal: By 2018, selective logging of high value timber species decreases by 75%
o Conservation Target: Jaguars Goal: To develop a jaguar protection program that ensures that jaguars have sufficient habitat to meet their ecological needs
o Conservation Target: Native grasslands Goal: Within 15 years of the start of the project, native grassland coverage across the project site is re-established to its documented historic range.
o Conservation Target: Migratory fish Goal: By 2025, the Blue River mainstem and its associated tributaries are considered ecologically healthy and functioning, according to criteria defined by the Blue River Conservation Consortium.
Part 2: Developing Goals for Conservation Targets
For your project, develop one goal for each of your conservation targets. Record your goals in Miradi by double-clicking on a target and creating goal under the ‘Goals’ tab. Follow the steps described earlier:
1. Choose one of your conservation targets and think about what components of that target should be represented in a goal.
2. Write a draft brief description of the desired future condition of your conservation target
3. Review the criteria for a good goal and determine whether your goal meets the criteria. 4. Modify your draft goal as needed to make sure it complies with the criteria for a good
goal. 5. Repeat steps 3 and 4, as needed. 6. Repeat steps 1 through 5 for at least 2 other targets.
If you are missing any information to adequately define your goals, be sure to note this and explain how you intend to fill the information gap.
Briefly describe (1-2 paragraphs) your observations about the process of developing goals. If you did a viability assessment, discuss how that helped (or did not help) you define your goals.
Hand in your assignment (Word document + mpz file) as Assignment 7.
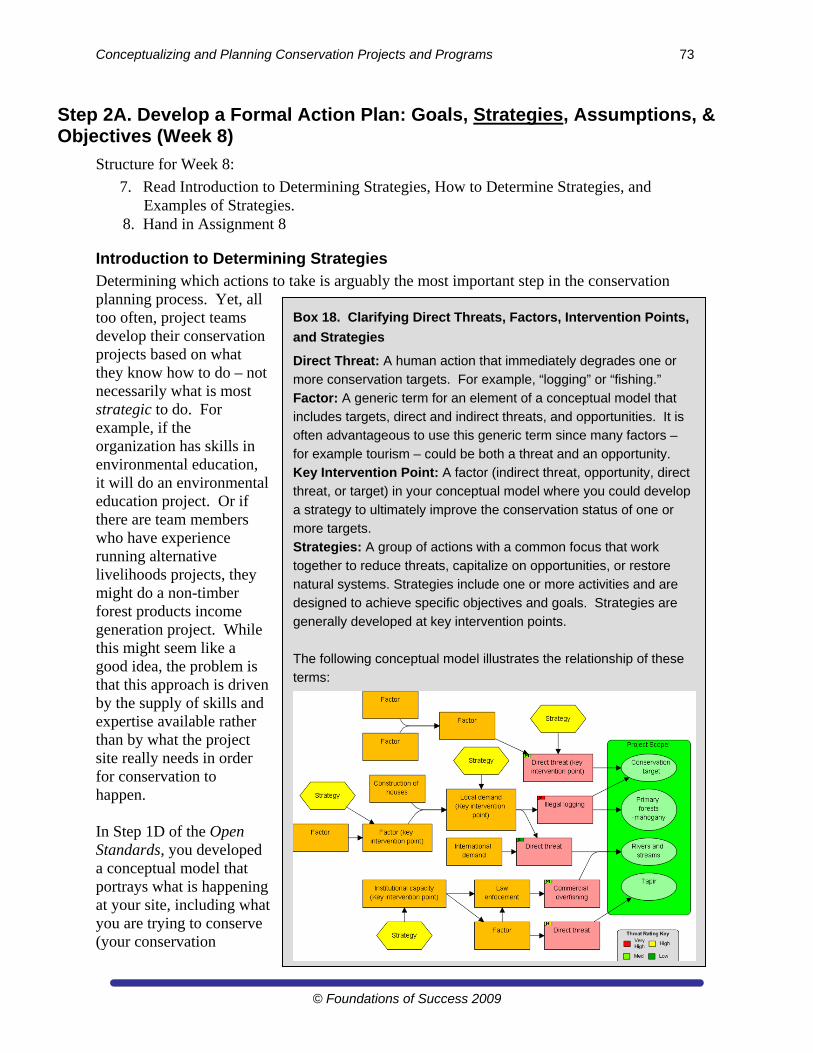
Conceptualizing and Planning Conservation Projects and Programs 73
© Foundations of Success 2009
Step 2A. Develop a Formal Action Plan: Goals, Strategies, Assumptions, & Objectives (Week 8)
Structure for Week 8:
7. Read Introduction to Determining Strategies, How to Determine Strategies, and Examples of Strategies.
8. Hand in Assignment 8
Introduction to Determining Strategies Determining which actions to take is arguably the most important step in the conservation planning process. Yet, all too often, project teams develop their conservation projects based on what they know how to do – not necessarily what is most strategic to do. For example, if the organization has skills in environmental education, it will do an environmental education project. Or if there are team members who have experience running alternative livelihoods projects, they might do a non-timber forest products income generation project. While this might seem like a good idea, the problem is that this approach is driven by the supply of skills and expertise available rather than by what the project site really needs in order for conservation to happen. In Step 1D of the Open Standards, you developed a conceptual model that portrays what is happening at your site, including what you are trying to conserve (your conservation
Box 18. Clarifying Direct Threats, Factors, Intervention Points,
and Strategies
Direct Threat: A human action that immediately degrades one or
more conservation targets. For example, “logging” or “fishing.”
Factor: A generic term for an element of a conceptual model that
includes targets, direct and indirect threats, and opportunities. It is
often advantageous to use this generic term since many factors –
for example tourism – could be both a threat and an opportunity.
Key Intervention Point: A factor (indirect threat, opportunity, direct
threat, or target) in your conceptual model where you could develop
a strategy to ultimately improve the conservation status of one or
more targets.
Strategies: A group of actions with a common focus that work
together to reduce threats, capitalize on opportunities, or restore
natural systems. Strategies include one or more activities and are
designed to achieve specific objectives and goals. Strategies are
generally developed at key intervention points.
The following conceptual model illustrates the relationship of these
terms:
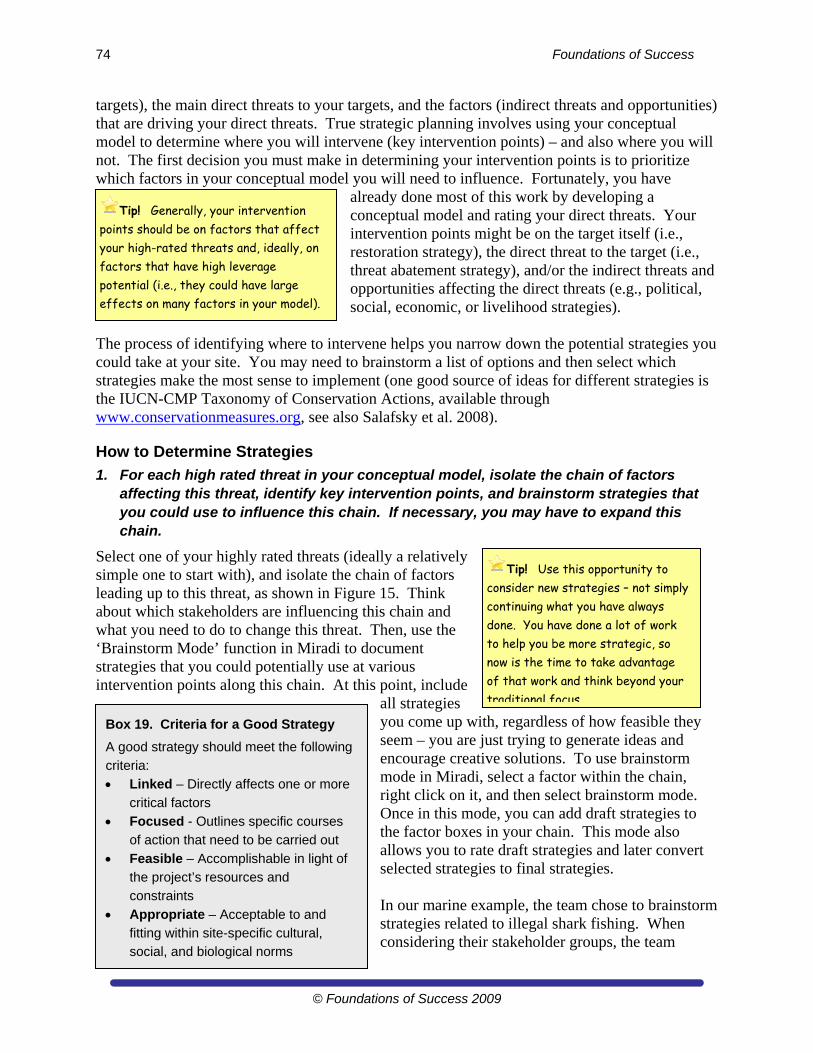
74 Foundations of Success
© Foundations of Success 2009
targets), the main direct threats to your targets, and the factors (indirect threats and opportunities) that are driving your direct threats. True strategic planning involves using your conceptual model to determine where you will intervene (key intervention points) – and also where you will not. The first decision you must make in determining your intervention points is to prioritize which factors in your conceptual model you will need to influence. Fortunately, you have
already done most of this work by developing a conceptual model and rating your direct threats. Your intervention points might be on the target itself (i.e., restoration strategy), the direct threat to the target (i.e., threat abatement strategy), and/or the indirect threats and opportunities affecting the direct threats (e.g., political, social, economic, or livelihood strategies).
The process of identifying where to intervene helps you narrow down the potential strategies you could take at your site. You may need to brainstorm a list of options and then select which strategies make the most sense to implement (one good source of ideas for different strategies is the IUCN-CMP Taxonomy of Conservation Actions, available through www.conservationmeasures.org, see also Salafsky et al. 2008).
How to Determine Strategies
1. For each high rated threat in your conceptual model, isolate the chain of factors affecting this threat, identify key intervention points, and brainstorm strategies that you could use to influence this chain. If necessary, you may have to expand this chain.
Select one of your highly rated threats (ideally a relatively simple one to start with), and isolate the chain of factors leading up to this threat, as shown in Figure 15. Think about which stakeholders are influencing this chain and what you need to do to change this threat. Then, use the ‘Brainstorm Mode’ function in Miradi to document strategies that you could potentially use at various intervention points along this chain. At this point, include
all strategies you come up with, regardless of how feasible they seem – you are just trying to generate ideas and encourage creative solutions. To use brainstorm mode in Miradi, select a factor within the chain, right click on it, and then select brainstorm mode. Once in this mode, you can add draft strategies to the factor boxes in your chain. This mode also allows you to rate draft strategies and later convert selected strategies to final strategies. In our marine example, the team chose to brainstorm strategies related to illegal shark fishing. When considering their stakeholder groups, the team
Box 19. Criteria for a Good Strategy
A good strategy should meet the following
criteria:
Linked – Directly affects one or more
critical factors
Focused - Outlines specific courses
of action that need to be carried out
Feasible – Accomplishable in light of
the project’s resources and
constraints
Appropriate – Acceptable to and
fitting within site-specific cultural, social, and biological norms
Tip! Generally, your intervention points should be on factors that affect your high-rated threats and, ideally, on factors that have high leverage potential (i.e., they could have large effects on many factors in your model).
Tip! Use this opportunity to consider new strategies – not simply continuing what you have always done. You have done a lot of work to help you be more strategic, so now is the time to take advantage of that work and think beyond your traditional focus
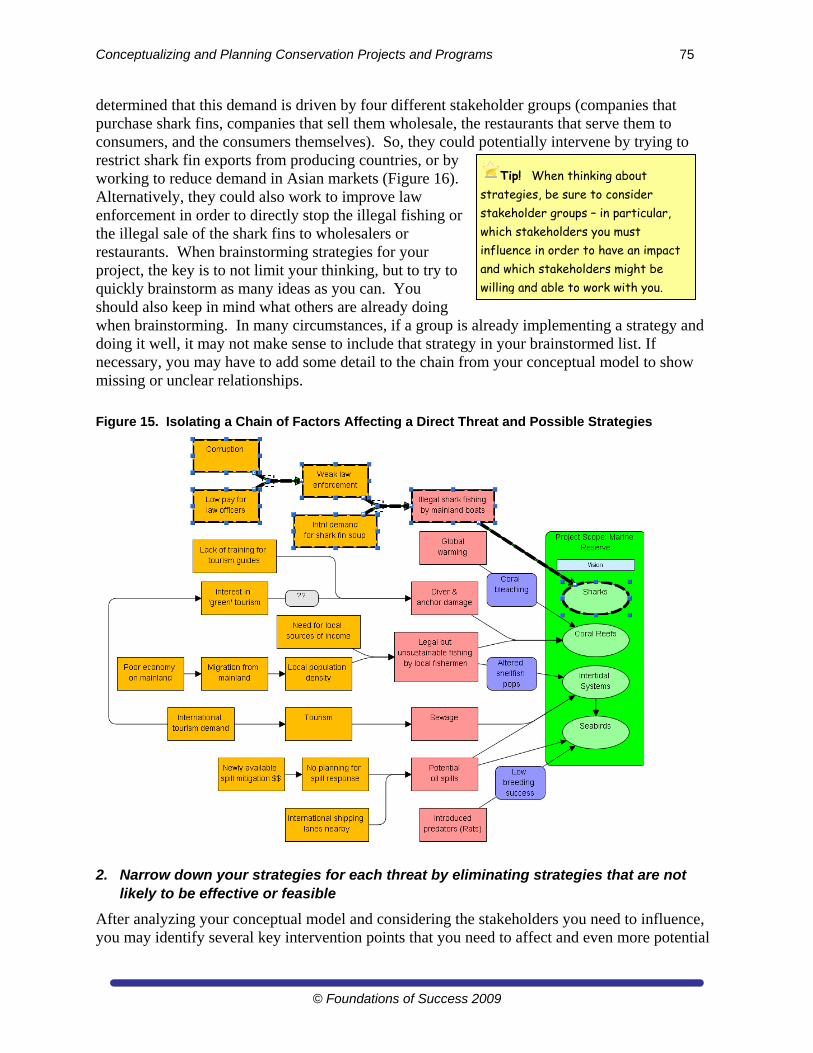
Conceptualizing and Planning Conservation Projects and Programs 75
© Foundations of Success 2009
determined that this demand is driven by four different stakeholder groups (companies that purchase shark fins, companies that sell them wholesale, the restaurants that serve them to consumers, and the consumers themselves). So, they could potentially intervene by trying to restrict shark fin exports from producing countries, or by working to reduce demand in Asian markets (Figure 16). Alternatively, they could also work to improve law enforcement in order to directly stop the illegal fishing or the illegal sale of the shark fins to wholesalers or restaurants. When brainstorming strategies for your project, the key is to not limit your thinking, but to try to quickly brainstorm as many ideas as you can. You should also keep in mind what others are already doing when brainstorming. In many circumstances, if a group is already implementing a strategy and doing it well, it may not make sense to include that strategy in your brainstormed list. If necessary, you may have to add some detail to the chain from your conceptual model to show missing or unclear relationships.
Figure 15. Isolating a Chain of Factors Affecting a Direct Threat and Possible Strategies
2. Narrow down your strategies for each threat by eliminating strategies that are not likely to be effective or feasible
After analyzing your conceptual model and considering the stakeholders you need to influence, you may identify several key intervention points that you need to affect and even more potential
Tip! When thinking about strategies, be sure to consider stakeholder groups – in particular, which stakeholders you must influence in order to have an impact and which stakeholders might be willing and able to work with you.
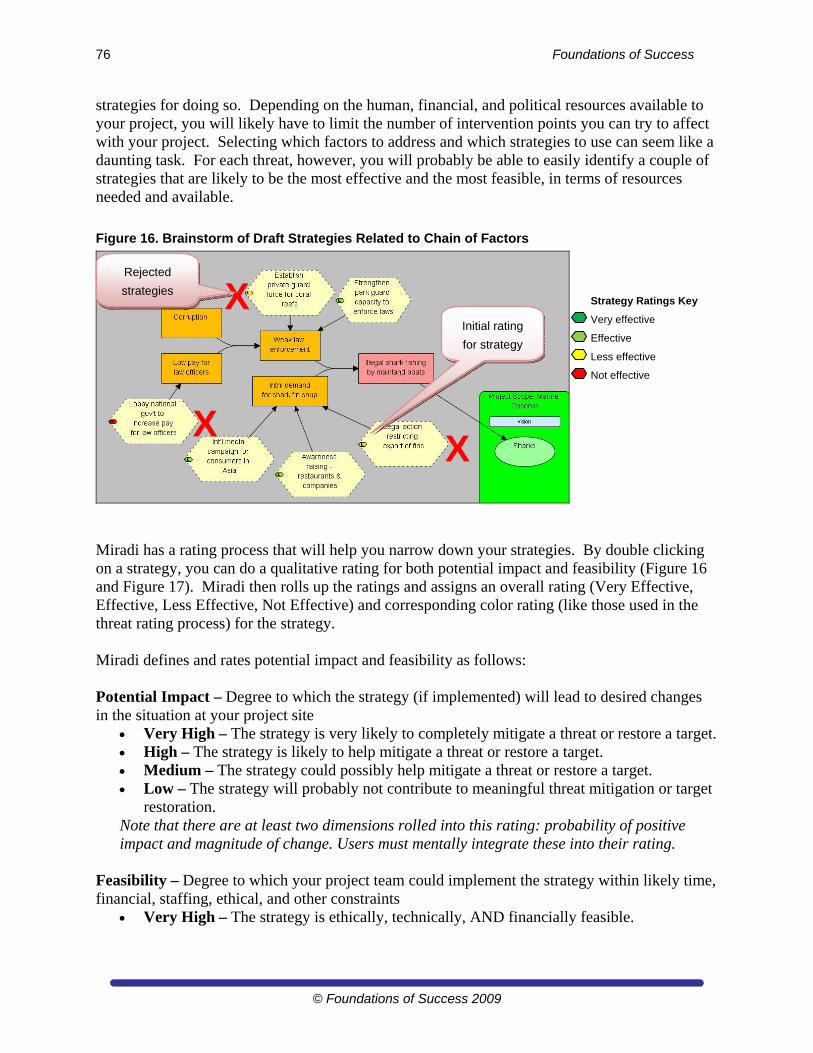
76 Foundations of Success
© Foundations of Success 2009
strategies for doing so. Depending on the human, financial, and political resources available to your project, you will likely have to limit the number of intervention points you can try to affect with your project. Selecting which factors to address and which strategies to use can seem like a daunting task. For each threat, however, you will probably be able to easily identify a couple of strategies that are likely to be the most effective and the most feasible, in terms of resources needed and available.
Figure 16. Brainstorm of Draft Strategies Related to Chain of Factors
Miradi has a rating process that will help you narrow down your strategies. By double clicking on a strategy, you can do a qualitative rating for both potential impact and feasibility (Figure 16 and Figure 17). Miradi then rolls up the ratings and assigns an overall rating (Very Effective, Effective, Less Effective, Not Effective) and corresponding color rating (like those used in the threat rating process) for the strategy. Miradi defines and rates potential impact and feasibility as follows: Potential Impact – Degree to which the strategy (if implemented) will lead to desired changes in the situation at your project site
Very High – The strategy is very likely to completely mitigate a threat or restore a target. High – The strategy is likely to help mitigate a threat or restore a target. Medium – The strategy could possibly help mitigate a threat or restore a target. Low – The strategy will probably not contribute to meaningful threat mitigation or target
restoration. Note that there are at least two dimensions rolled into this rating: probability of positive impact and magnitude of change. Users must mentally integrate these into their rating.
Feasibility – Degree to which your project team could implement the strategy within likely time, financial, staffing, ethical, and other constraints
Very High – The strategy is ethically, technically, AND financially feasible.
Initial rating
for strategy
Strategy Ratings Key
Very effective
Effective
Less effective
Not effective
X
X
X
Rejected
strategies
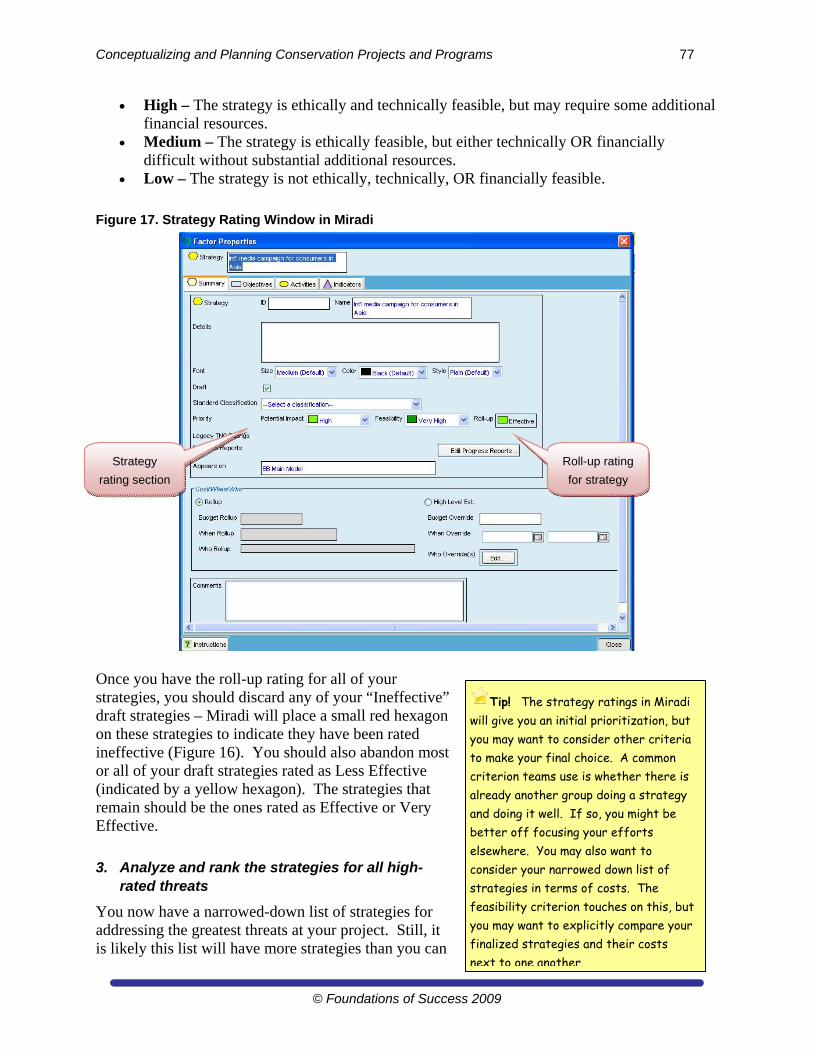
Conceptualizing and Planning Conservation Projects and Programs 77
© Foundations of Success 2009
High – The strategy is ethically and technically feasible, but may require some additional financial resources.
Medium – The strategy is ethically feasible, but either technically OR financially difficult without substantial additional resources.
Low – The strategy is not ethically, technically, OR financially feasible.
Figure 17. Strategy Rating Window in Miradi
Once you have the roll-up rating for all of your strategies, you should discard any of your “Ineffective” draft strategies – Miradi will place a small red hexagon on these strategies to indicate they have been rated ineffective (Figure 16). You should also abandon most or all of your draft strategies rated as Less Effective (indicated by a yellow hexagon). The strategies that remain should be the ones rated as Effective or Very Effective.
3. Analyze and rank the strategies for all high-rated threats
You now have a narrowed-down list of strategies for addressing the greatest threats at your project. Still, it is likely this list will have more strategies than you can
Roll-up rating
for strategy
Strategy
rating section
Tip! The strategy ratings in Miradi will give you an initial prioritization, but you may want to consider other criteria to make your final choice. A common criterion teams use is whether there is already another group doing a strategy and doing it well. If so, you might be better off focusing your efforts elsewhere. You may also want to consider your narrowed down list of strategies in terms of costs. The feasibility criterion touches on this, but you may want to explicitly compare your finalized strategies and their costs next to one another.
78 Foundations of Success
© Foundations of Success 2009
realistically address with your project. At this point, it may be helpful to do another prioritization process. Depending upon your project’s needs, you could narrow down the strategies under consideration through a team discussion, or you could do a relative ranking exercise to help you choose your strategies. Both approaches have their pros and cons. A discussion with your team will be quicker and more efficient, but a more formal ranking process will help your team more objectively consider and choose from the different strategies. It will also force you to compare strategies to one another and systematically rank them on key criteria. Whether you do a formal ranking exercise or have a less formal discussion with your team, your analysis should include the same criteria as you used for your initial rating exercise. The difference here (as opposed to Step 2 above) is that you will rank each strategy relative to the other strategies under consideration. By doing so, you will be forcing yourselves to create a spread among a suite of strategies that have all passed an initial screening. In addition to potential impact and feasibility, we recommend a third criterion to do this second prioritization process:
Niche/gap the strategy would fill – the extent to which your strategy will fill a gap not addressed by another project or organization. You may find that you have the perfect strategy to address a particular threat, but another team is already implementing that strategy and doing it effectively. If this is the case, you need to consider whether your resources would be better spent implementing a different strategy or addressing a key intervention point where nothing is currently being done, or whether you could support existing work. You ideally want to choose intervention points where you can add the most value for conservation in general. This may mean filling a gap by implementing an entirely new strategy or filling a gap by providing additional resources to an existing strategy implemented by another group or project.
To do a relative ranking,16 you should create a matrix like the one in Table 6 with the strategies in the rows and the criteria in the columns (Note: this ranking process is not currently supported in Miradi – you will need to do it using some other software program). Begin ranking your strategies in terms of potential impact by giving the strategy you think is likely to have the greatest impact the highest ranking (e.g., a 6 if you have 6 strategies) and the one likely to have the lowest impact a 1. Continue ranking the remaining strategies until you have completed the
potential impact column. Repeat the same process for ranking the strategies according to feasibility and gap/niche. Sum the numbers up by column and rows. The strategy with the highest number is your best strategy and one you should probably undertake. Likewise, the strategy with the lowest number is one that, with limited resources, you should probably not undertake.
16 Appendix C offers a more detailed explanation of the relative ranking process, in the context of threat rankings. The general steps are the same regardless of what you are ranking.
Tip! To fill in a relative ranking matrix, it is often easiest to identify which strategy should get the highest rank for a particular criterion and which should get the lowest rank. You can then start filling in the middle by choosing the next in line for the second highest or lowest spot.
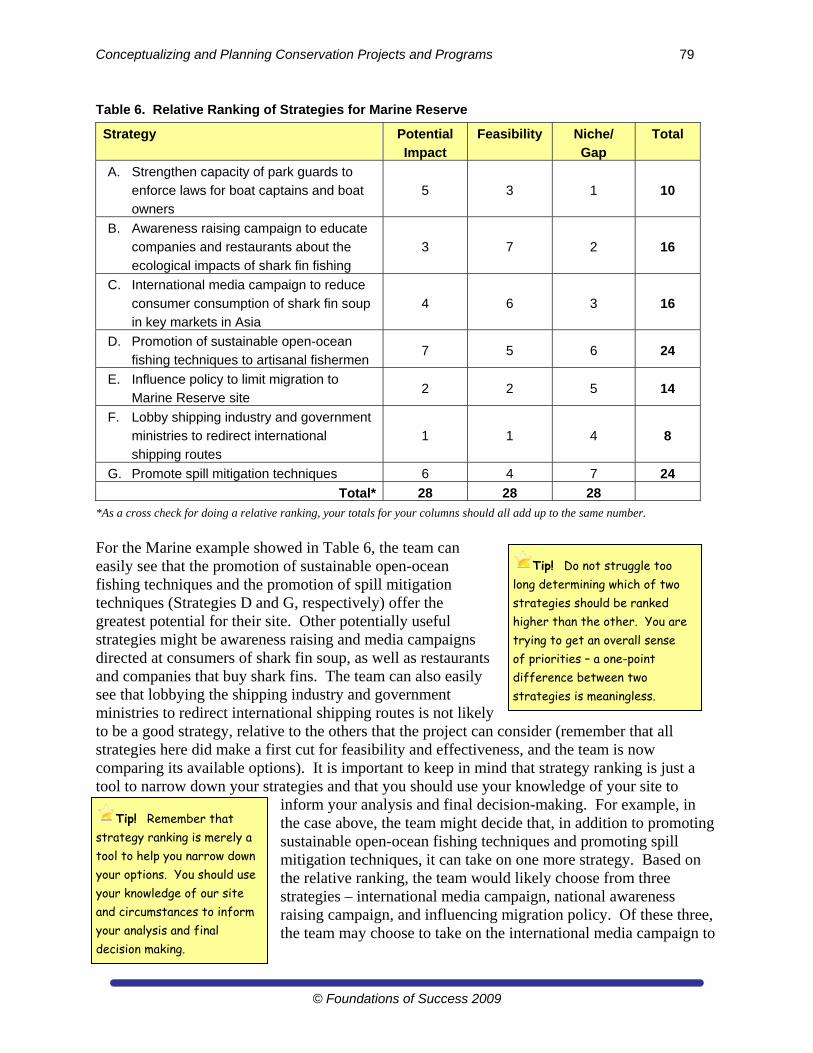
Conceptualizing and Planning Conservation Projects and Programs 79
© Foundations of Success 2009
Table 6. Relative Ranking of Strategies for Marine Reserve
Strategy Potential
Impact
Feasibility Niche/
Gap
Total
A. Strengthen capacity of park guards to
enforce laws for boat captains and boat
owners
5 3 1 10
B. Awareness raising campaign to educate
companies and restaurants about the
ecological impacts of shark fin fishing
3 7 2 16
C. International media campaign to reduce
consumer consumption of shark fin soup
in key markets in Asia
4 6 3 16
D. Promotion of sustainable open-ocean
fishing techniques to artisanal fishermen 7 5 6 24
E. Influence policy to limit migration to
Marine Reserve site 2 2 5 14
F. Lobby shipping industry and government
ministries to redirect international
shipping routes
1 1 4 8
G. Promote spill mitigation techniques 6 4 7 24
Total* 28 28 28
*As a cross check for doing a relative ranking, your totals for your columns should all add up to the same number.
For the Marine example showed in Table 6, the team can easily see that the promotion of sustainable open-ocean fishing techniques and the promotion of spill mitigation techniques (Strategies D and G, respectively) offer the greatest potential for their site. Other potentially useful strategies might be awareness raising and media campaigns directed at consumers of shark fin soup, as well as restaurants and companies that buy shark fins. The team can also easily see that lobbying the shipping industry and government ministries to redirect international shipping routes is not likely to be a good strategy, relative to the others that the project can consider (remember that all strategies here did make a first cut for feasibility and effectiveness, and the team is now comparing its available options). It is important to keep in mind that strategy ranking is just a tool to narrow down your strategies and that you should use your knowledge of your site to
inform your analysis and final decision-making. For example, in the case above, the team might decide that, in addition to promoting sustainable open-ocean fishing techniques and promoting spill mitigation techniques, it can take on one more strategy. Based on the relative ranking, the team would likely choose from three strategies – international media campaign, national awareness raising campaign, and influencing migration policy. Of these three, the team may choose to take on the international media campaign to
Tip! Remember that strategy ranking is merely a tool to help you narrow down your options. You should use your knowledge of our site and circumstances to inform your analysis and final decision making.
Tip! Do not struggle too long determining which of two strategies should be ranked higher than the other. You are trying to get an overall sense of priorities – a one-point difference between two strategies is meaningless.
80 Foundations of Success
© Foundations of Success 2009
reduce shark fin soup consumption because it has strong ties to a Chinese conservation organization that has been very successful in its awareness campaigns. Thus, it is important to bring your knowledge of your site and your circumstances to help you decide which strategy to implement. In some cases, you may pick a lower-ranked strategy because of other variables that you did not consider in your strategy ranking that make the strategy more desirable for your project.
4. Choose your final set of strategies
Based on your analysis above, choose your final set of strategies. In Miradi, you can convert your draft strategies into final strategies by double clicking on the strategy hexagon and unchecking the Draft box. If you decide to choose any of your lower-ranked draft strategies, you should provide a brief explanation of why you did so in the comments field of the strategy properties box.
5. Revisit this list of strategies when developing your work plan and budget (Step 3 of the CMP Open Standards)
You now have your list of final strategies, but you may not have a formal budget in place. Or you may not yet have all the funds you need to implement all strategies. You will have a better idea of what you can do when you start developing your work plan and budget. At that point, you should revisit your final list of strategies and determine, with the funds you currently have, which you will implement first.
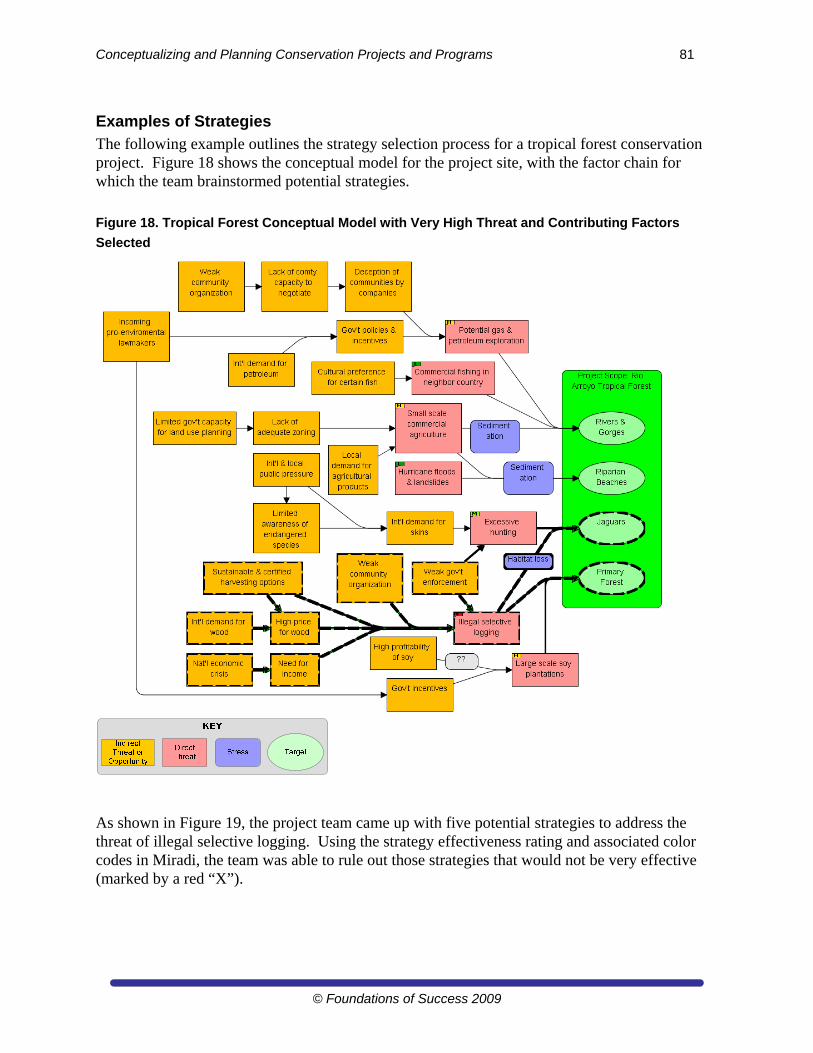
Conceptualizing and Planning Conservation Projects and Programs 81
© Foundations of Success 2009
Examples of Strategies
The following example outlines the strategy selection process for a tropical forest conservation project. Figure 18 shows the conceptual model for the project site, with the factor chain for which the team brainstormed potential strategies.
Figure 18. Tropical Forest Conceptual Model with Very High Threat and Contributing Factors
Selected
As shown in Figure 19, the project team came up with five potential strategies to address the threat of illegal selective logging. Using the strategy effectiveness rating and associated color codes in Miradi, the team was able to rule out those strategies that would not be very effective (marked by a red “X”).
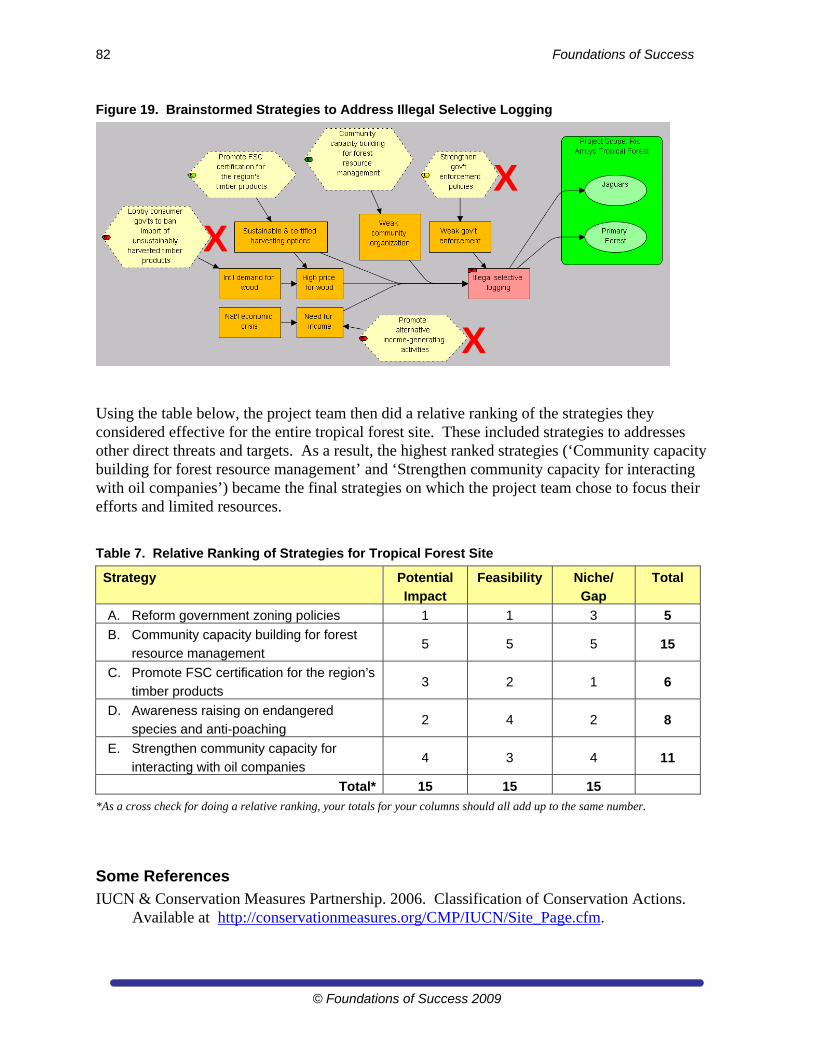
82 Foundations of Success
© Foundations of Success 2009
Figure 19. Brainstormed Strategies to Address Illegal Selective Logging
Using the table below, the project team then did a relative ranking of the strategies they considered effective for the entire tropical forest site. These included strategies to addresses other direct threats and targets. As a result, the highest ranked strategies (‘Community capacity building for forest resource management’ and ‘Strengthen community capacity for interacting with oil companies’) became the final strategies on which the project team chose to focus their efforts and limited resources.
Table 7. Relative Ranking of Strategies for Tropical Forest Site
Strategy Potential
Impact
Feasibility Niche/
Gap
Total
A. Reform government zoning policies 1 1 3 5
B. Community capacity building for forest
resource management 5 5 5 15
C. Promote FSC certification for the region’s
timber products 3 2 1 6
D. Awareness raising on endangered
species and anti-poaching 2 4 2 8
E. Strengthen community capacity for
interacting with oil companies 4 3 4 11
Total* 15 15 15
*As a cross check for doing a relative ranking, your totals for your columns should all add up to the same number.
Some References
IUCN & Conservation Measures Partnership. 2006. Classification of Conservation Actions. Available at http://conservationmeasures.org/CMP/IUCN/Site_Page.cfm.
X
X
X
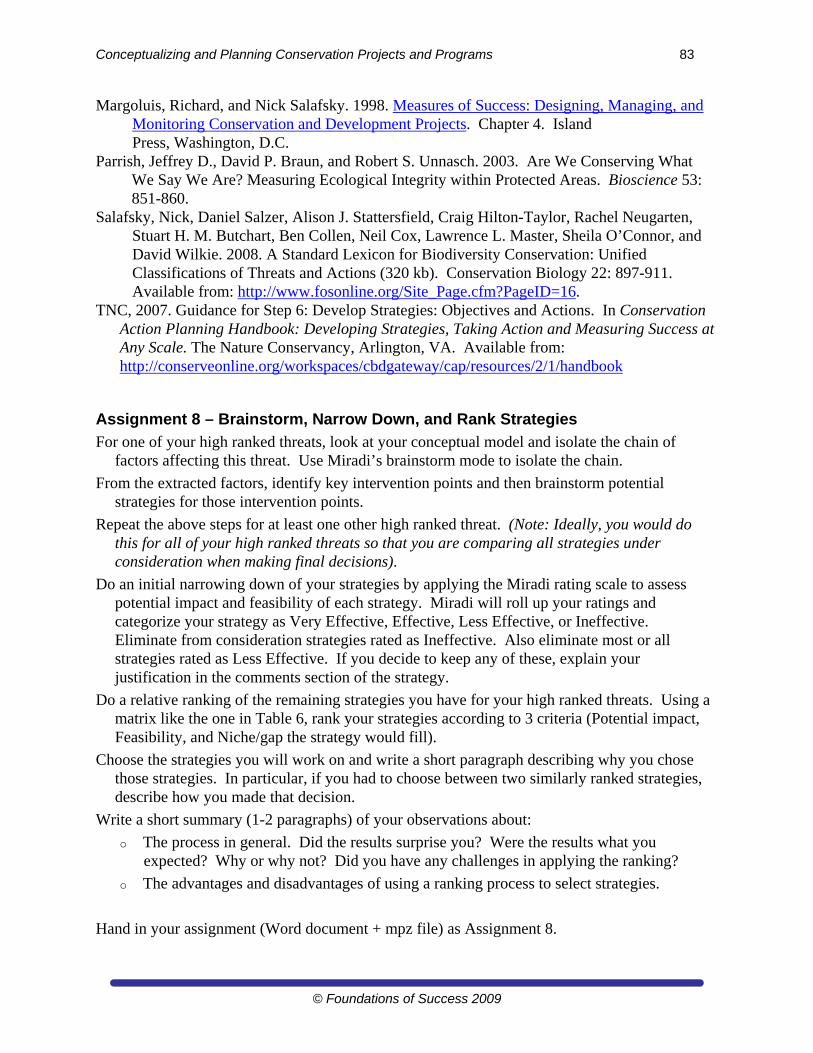
Conceptualizing and Planning Conservation Projects and Programs 83
© Foundations of Success 2009
Margoluis, Richard, and Nick Salafsky. 1998. Measures of Success: Designing, Managing, and Monitoring Conservation and Development Projects. Chapter 4. Island Press, Washington, D.C.
Parrish, Jeffrey D., David P. Braun, and Robert S. Unnasch. 2003. Are We Conserving What We Say We Are? Measuring Ecological Integrity within Protected Areas. Bioscience 53: 851-860.
Salafsky, Nick, Daniel Salzer, Alison J. Stattersfield, Craig Hilton-Taylor, Rachel Neugarten, Stuart H. M. Butchart, Ben Collen, Neil Cox, Lawrence L. Master, Sheila O’Connor, and David Wilkie. 2008. A Standard Lexicon for Biodiversity Conservation: Unified Classifications of Threats and Actions (320 kb). Conservation Biology 22: 897-911. Available from: http://www.fosonline.org/Site_Page.cfm?PageID=16.
TNC, 2007. Guidance for Step 6: Develop Strategies: Objectives and Actions. In Conservation Action Planning Handbook: Developing Strategies, Taking Action and Measuring Success at Any Scale. The Nature Conservancy, Arlington, VA. Available from: http://conserveonline.org/workspaces/cbdgateway/cap/resources/2/1/handbook
Assignment 8 – Brainstorm, Narrow Down, and Rank Strategies
For one of your high ranked threats, look at your conceptual model and isolate the chain of factors affecting this threat. Use Miradi’s brainstorm mode to isolate the chain.
From the extracted factors, identify key intervention points and then brainstorm potential strategies for those intervention points.
Repeat the above steps for at least one other high ranked threat. (Note: Ideally, you would do this for all of your high ranked threats so that you are comparing all strategies under consideration when making final decisions).
Do an initial narrowing down of your strategies by applying the Miradi rating scale to assess potential impact and feasibility of each strategy. Miradi will roll up your ratings and categorize your strategy as Very Effective, Effective, Less Effective, or Ineffective. Eliminate from consideration strategies rated as Ineffective. Also eliminate most or all strategies rated as Less Effective. If you decide to keep any of these, explain your justification in the comments section of the strategy.
Do a relative ranking of the remaining strategies you have for your high ranked threats. Using a matrix like the one in Table 6, rank your strategies according to 3 criteria (Potential impact, Feasibility, and Niche/gap the strategy would fill).
Choose the strategies you will work on and write a short paragraph describing why you chose those strategies. In particular, if you had to choose between two similarly ranked strategies, describe how you made that decision.
Write a short summary (1-2 paragraphs) of your observations about:
o The process in general. Did the results surprise you? Were the results what you expected? Why or why not? Did you have any challenges in applying the ranking?
o The advantages and disadvantages of using a ranking process to select strategies.
Hand in your assignment (Word document + mpz file) as Assignment 8.
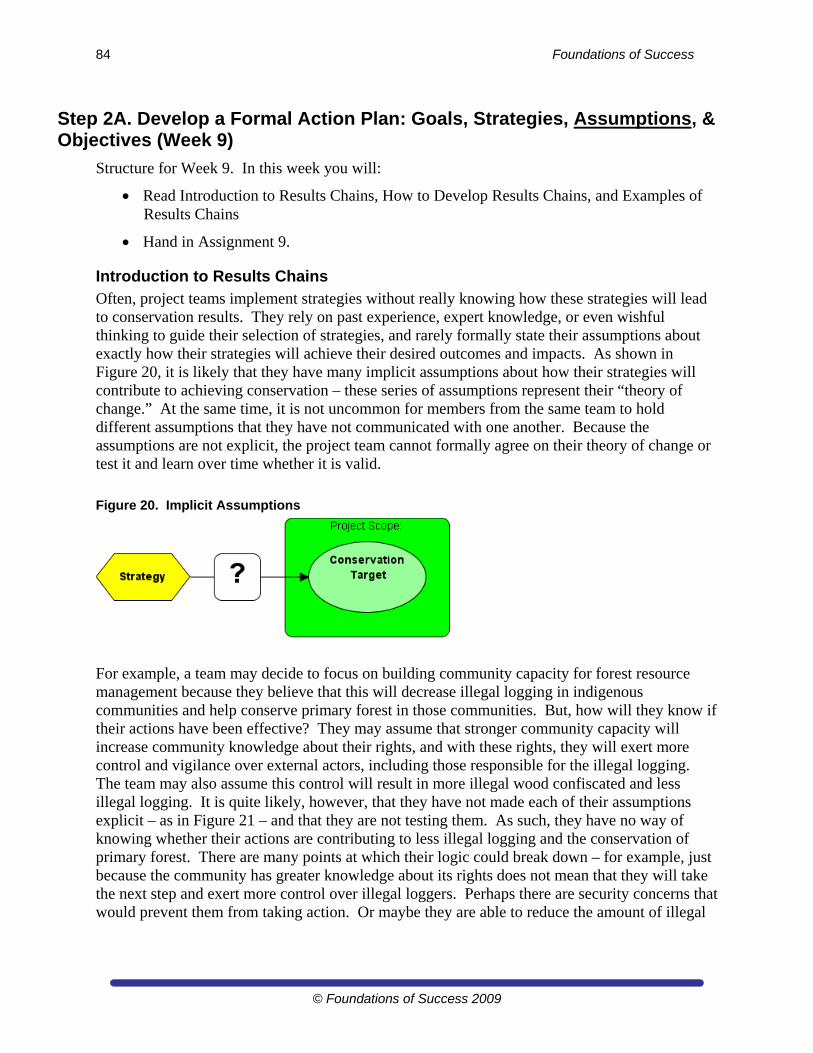
84 Foundations of Success
© Foundations of Success 2009
Step 2A. Develop a Formal Action Plan: Goals, Strategies, Assumptions, & Objectives (Week 9)
Structure for Week 9. In this week you will:
Read Introduction to Results Chains, How to Develop Results Chains, and Examples of Results Chains
Hand in Assignment 9.
Introduction to Results Chains Often, project teams implement strategies without really knowing how these strategies will lead to conservation results. They rely on past experience, expert knowledge, or even wishful thinking to guide their selection of strategies, and rarely formally state their assumptions about exactly how their strategies will achieve their desired outcomes and impacts. As shown in Figure 20, it is likely that they have many implicit assumptions about how their strategies will contribute to achieving conservation – these series of assumptions represent their “theory of change.” At the same time, it is not uncommon for members from the same team to hold different assumptions that they have not communicated with one another. Because the assumptions are not explicit, the project team cannot formally agree on their theory of change or test it and learn over time whether it is valid.
Figure 20. Implicit Assumptions
For example, a team may decide to focus on building community capacity for forest resource management because they believe that this will decrease illegal logging in indigenous communities and help conserve primary forest in those communities. But, how will they know if their actions have been effective? They may assume that stronger community capacity will increase community knowledge about their rights, and with these rights, they will exert more control and vigilance over external actors, including those responsible for the illegal logging. The team may also assume this control will result in more illegal wood confiscated and less illegal logging. It is quite likely, however, that they have not made each of their assumptions explicit – as in Figure 21 – and that they are not testing them. As such, they have no way of knowing whether their actions are contributing to less illegal logging and the conservation of primary forest. There are many points at which their logic could break down – for example, just because the community has greater knowledge about its rights does not mean that they will take the next step and exert more control over illegal loggers. Perhaps there are security concerns that would prevent them from taking action. Or maybe they are able to reduce the amount of illegal
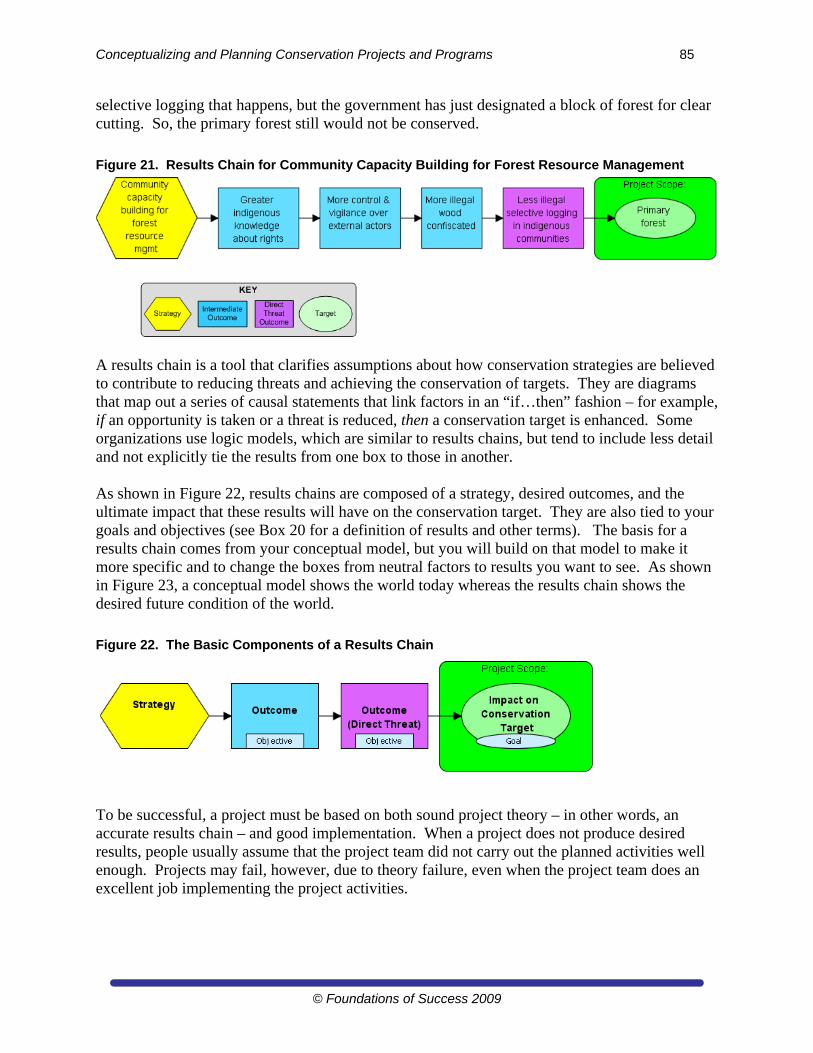
Conceptualizing and Planning Conservation Projects and Programs 85
© Foundations of Success 2009
selective logging that happens, but the government has just designated a block of forest for clear cutting. So, the primary forest still would not be conserved.
Figure 21. Results Chain for Community Capacity Building for Forest Resource Management
A results chain is a tool that clarifies assumptions about how conservation strategies are believed to contribute to reducing threats and achieving the conservation of targets. They are diagrams that map out a series of causal statements that link factors in an “if…then” fashion – for example, if an opportunity is taken or a threat is reduced, then a conservation target is enhanced. Some organizations use logic models, which are similar to results chains, but tend to include less detail and not explicitly tie the results from one box to those in another. As shown in Figure 22, results chains are composed of a strategy, desired outcomes, and the ultimate impact that these results will have on the conservation target. They are also tied to your goals and objectives (see Box 20 for a definition of results and other terms). The basis for a results chain comes from your conceptual model, but you will build on that model to make it more specific and to change the boxes from neutral factors to results you want to see. As shown in Figure 23, a conceptual model shows the world today whereas the results chain shows the desired future condition of the world.
Figure 22. The Basic Components of a Results Chain
To be successful, a project must be based on both sound project theory – in other words, an accurate results chain – and good implementation. When a project does not produce desired results, people usually assume that the project team did not carry out the planned activities well enough. Projects may fail, however, due to theory failure, even when the project team does an excellent job implementing the project activities.
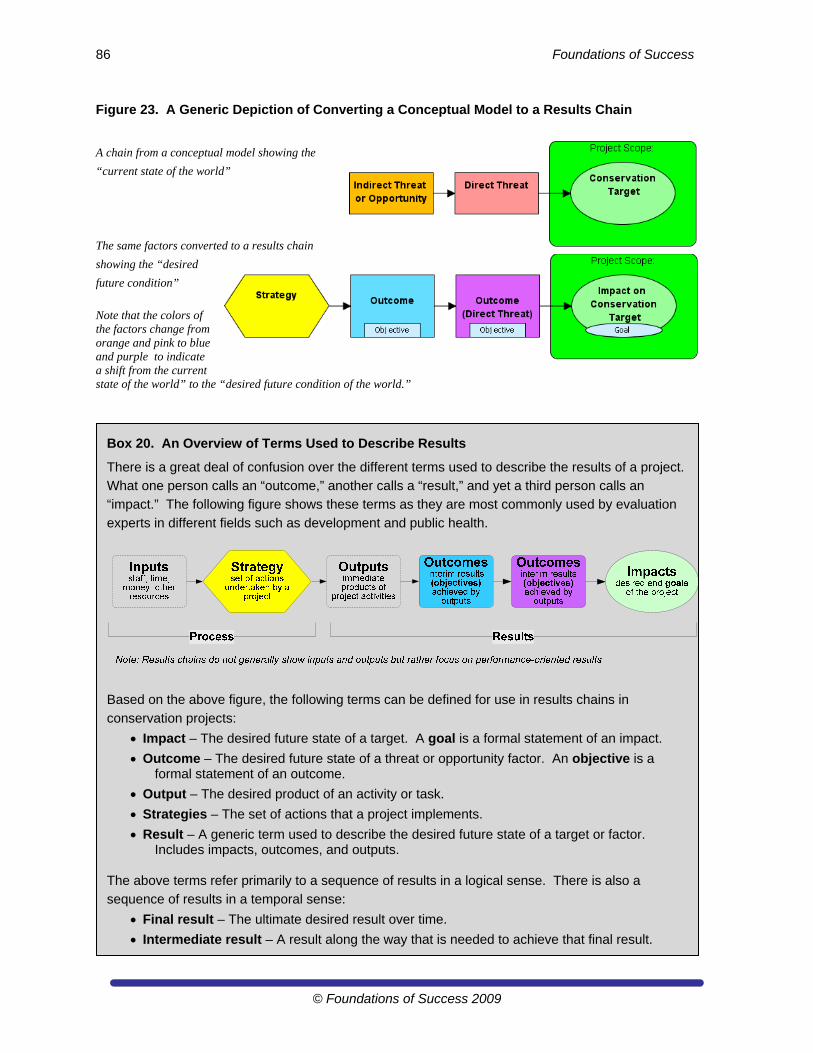
86 Foundations of Success
© Foundations of Success 2009
Figure 23. A Generic Depiction of Converting a Conceptual Model to a Results Chain
A chain from a conceptual model showing the
“current state of the world”
The same factors converted to a results chain
showing the “desired
future condition”
Note that the colors of the factors change from orange and pink to blue and purple to indicate a shift from the current state of the world” to the “desired future condition of the world.”
Box 20. An Overview of Terms Used to Describe Results
There is a great deal of confusion over the different terms used to describe the results of a project.
What one person calls an “outcome,” another calls a “result,” and yet a third person calls an
“impact.” The following figure shows these terms as they are most commonly used by evaluation
experts in different fields such as development and public health.
Based on the above figure, the following terms can be defined for use in results chains in
conservation projects:
Impact – The desired future state of a target. A goal is a formal statement of an impact.
Outcome – The desired future state of a threat or opportunity factor. An objective is a formal statement of an outcome.
Output – The desired product of an activity or task.
Strategies – The set of actions that a project implements.
Result – A generic term used to describe the desired future state of a target or factor. Includes impacts, outcomes, and outputs.
The above terms refer primarily to a sequence of results in a logical sense. There is also a
sequence of results in a temporal sense:
Final result – The ultimate desired result over time.
Intermediate result – A result along the way that is needed to achieve that final result.
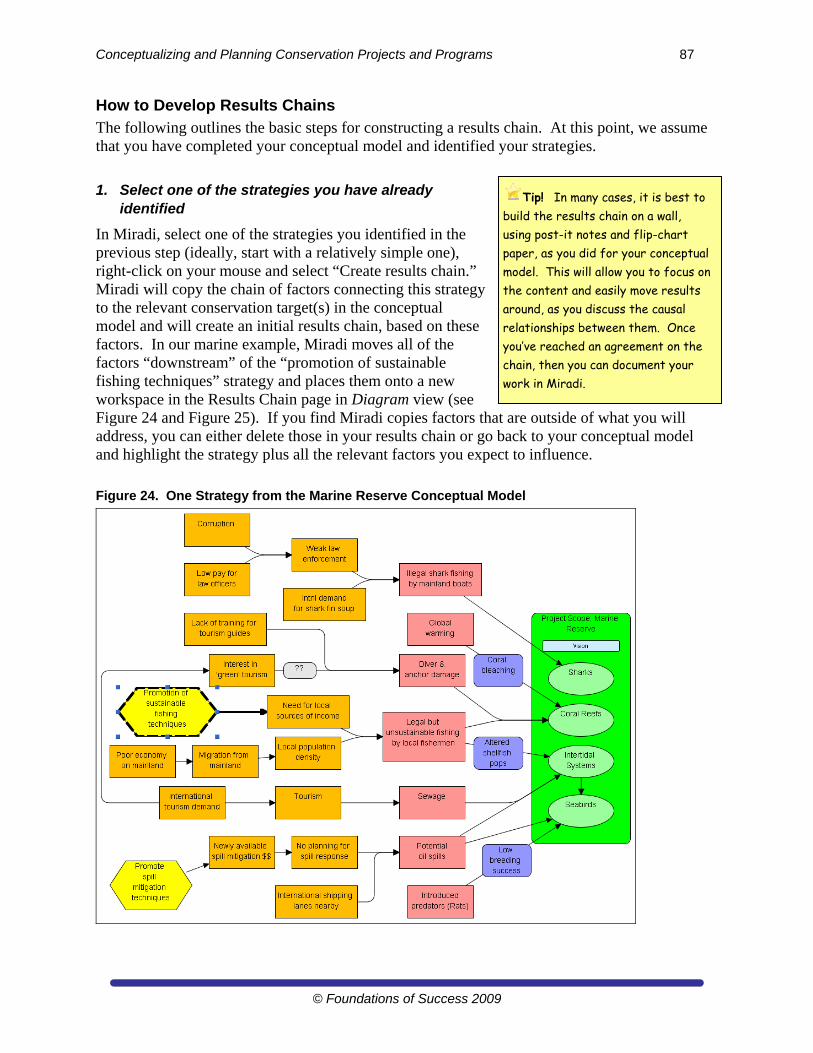
Conceptualizing and Planning Conservation Projects and Programs 87
© Foundations of Success 2009
How to Develop Results Chains The following outlines the basic steps for constructing a results chain. At this point, we assume that you have completed your conceptual model and identified your strategies.
1. Select one of the strategies you have already identified
In Miradi, select one of the strategies you identified in the previous step (ideally, start with a relatively simple one), right-click on your mouse and select “Create results chain.” Miradi will copy the chain of factors connecting this strategy to the relevant conservation target(s) in the conceptual model and will create an initial results chain, based on these factors. In our marine example, Miradi moves all of the factors “downstream” of the “promotion of sustainable fishing techniques” strategy and places them onto a new workspace in the Results Chain page in Diagram view (see Figure 24 and Figure 25). If you find Miradi copies factors that are outside of what you will address, you can either delete those in your results chain or go back to your conceptual model and highlight the strategy plus all the relevant factors you expect to influence.
Figure 24. One Strategy from the Marine Reserve Conceptual Model
Tip! In many cases, it is best to build the results chain on a wall, using post-it notes and flip-chart paper, as you did for your conceptual model. This will allow you to focus on the content and easily move results around, as you discuss the causal relationships between them. Once you’ve reached an agreement on the chain, then you can document your work in Miradi.
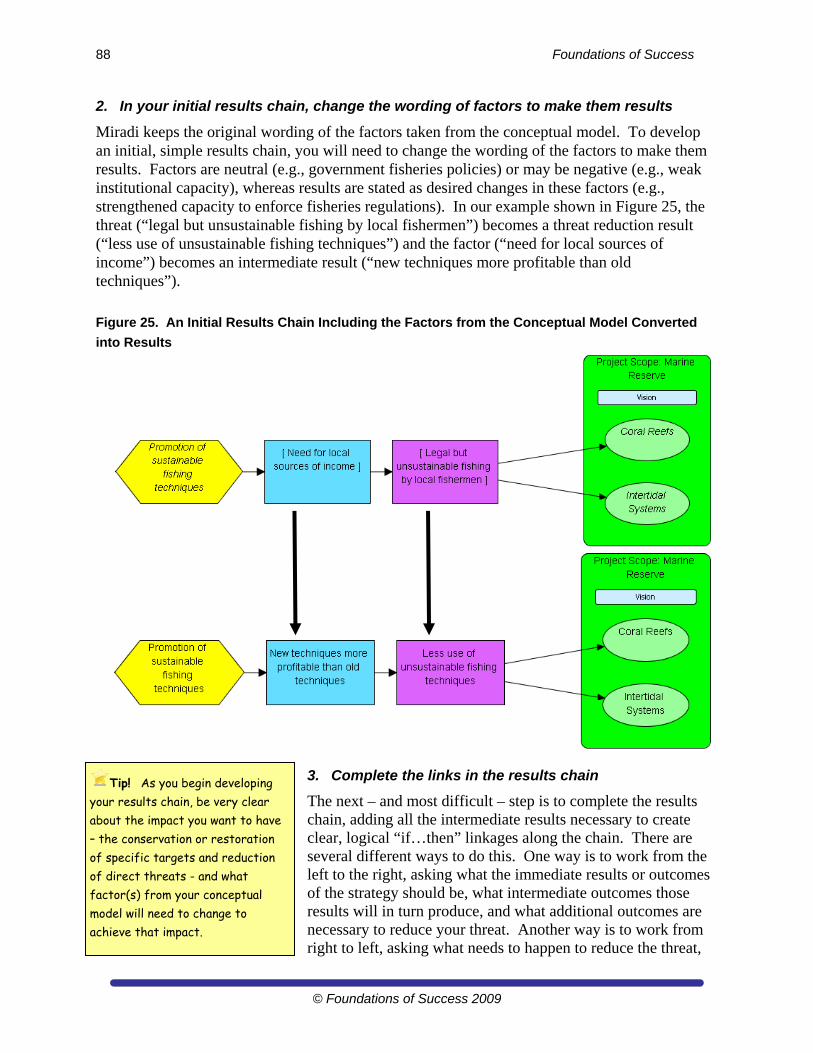
88 Foundations of Success
© Foundations of Success 2009
2. In your initial results chain, change the wording of factors to make them results
Miradi keeps the original wording of the factors taken from the conceptual model. To develop an initial, simple results chain, you will need to change the wording of the factors to make them results. Factors are neutral (e.g., government fisheries policies) or may be negative (e.g., weak institutional capacity), whereas results are stated as desired changes in these factors (e.g., strengthened capacity to enforce fisheries regulations). In our example shown in Figure 25, the threat (“legal but unsustainable fishing by local fishermen”) becomes a threat reduction result (“less use of unsustainable fishing techniques”) and the factor (“need for local sources of income”) becomes an intermediate result (“new techniques more profitable than old techniques”).
Figure 25. An Initial Results Chain Including the Factors from the Conceptual Model Converted
into Results
3. Complete the links in the results chain
The next – and most difficult – step is to complete the results chain, adding all the intermediate results necessary to create clear, logical “if…then” linkages along the chain. There are several different ways to do this. One way is to work from the left to the right, asking what the immediate results or outcomes of the strategy should be, what intermediate outcomes those results will in turn produce, and what additional outcomes are necessary to reduce your threat. Another way is to work from right to left, asking what needs to happen to reduce the threat,
Tip! As you begin developing your results chain, be very clear about the impact you want to have – the conservation or restoration of specific targets and reduction of direct threats - and what factor(s) from your conceptual model will need to change to achieve that impact.
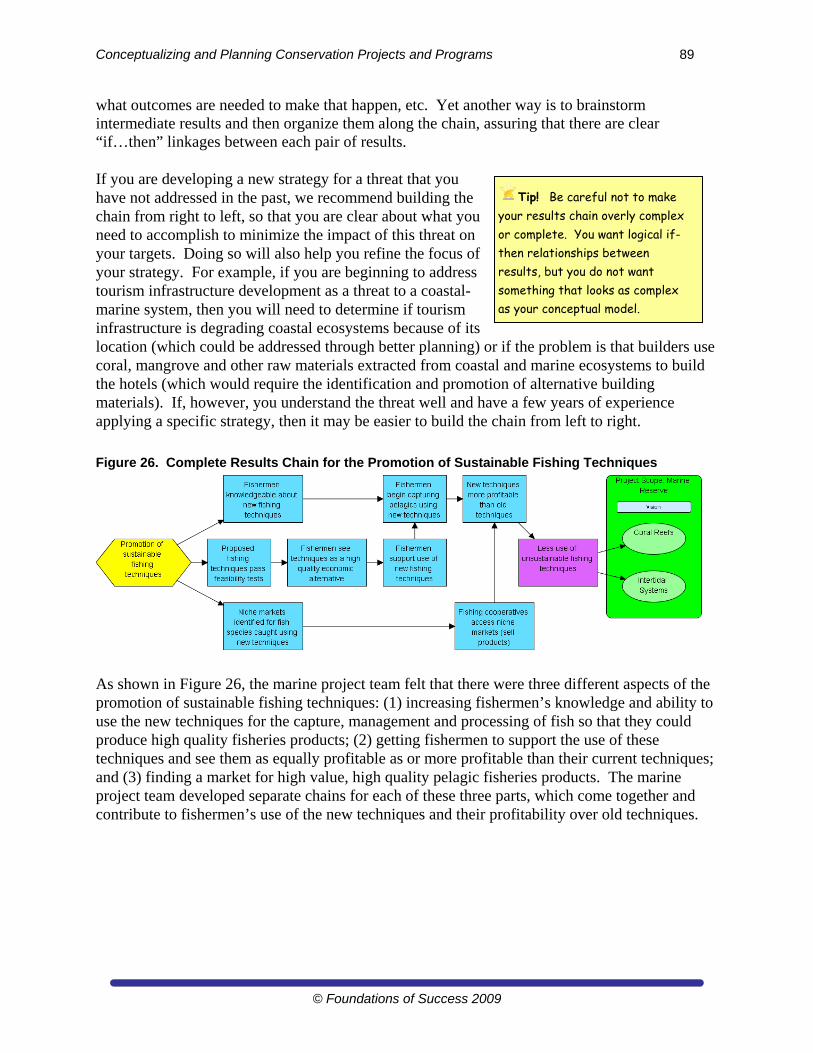
Conceptualizing and Planning Conservation Projects and Programs 89
© Foundations of Success 2009
what outcomes are needed to make that happen, etc. Yet another way is to brainstorm intermediate results and then organize them along the chain, assuring that there are clear “if…then” linkages between each pair of results. If you are developing a new strategy for a threat that you have not addressed in the past, we recommend building the chain from right to left, so that you are clear about what you need to accomplish to minimize the impact of this threat on your targets. Doing so will also help you refine the focus of your strategy. For example, if you are beginning to address tourism infrastructure development as a threat to a coastal-marine system, then you will need to determine if tourism infrastructure is degrading coastal ecosystems because of its location (which could be addressed through better planning) or if the problem is that builders use coral, mangrove and other raw materials extracted from coastal and marine ecosystems to build the hotels (which would require the identification and promotion of alternative building materials). If, however, you understand the threat well and have a few years of experience applying a specific strategy, then it may be easier to build the chain from left to right.
Figure 26. Complete Results Chain for the Promotion of Sustainable Fishing Techniques
As shown in Figure 26, the marine project team felt that there were three different aspects of the promotion of sustainable fishing techniques: (1) increasing fishermen’s knowledge and ability to use the new techniques for the capture, management and processing of fish so that they could produce high quality fisheries products; (2) getting fishermen to support the use of these techniques and see them as equally profitable as or more profitable than their current techniques; and (3) finding a market for high value, high quality pelagic fisheries products. The marine project team developed separate chains for each of these three parts, which come together and contribute to fishermen’s use of the new techniques and their profitability over old techniques.
Tip! Be careful not to make your results chain overly complex or complete. You want logical if-then relationships between results, but you do not want something that looks as complex as your conceptual model.
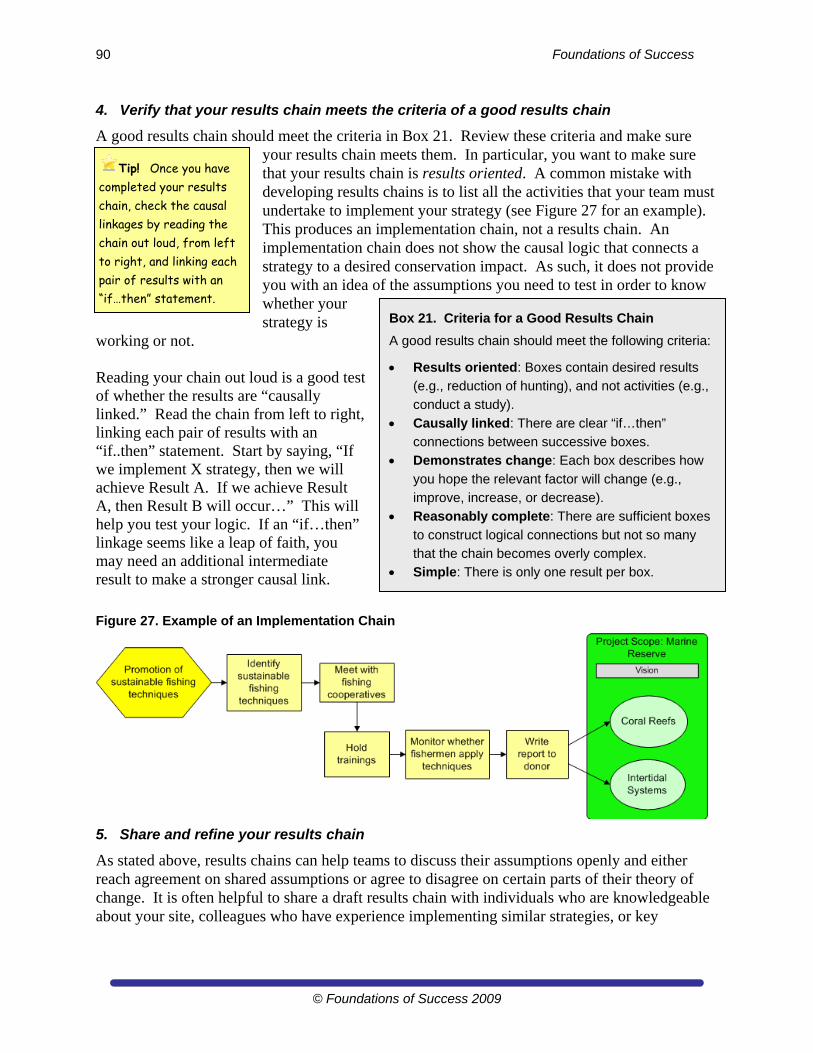
90 Foundations of Success
© Foundations of Success 2009
4. Verify that your results chain meets the criteria of a good results chain
A good results chain should meet the criteria in Box 21. Review these criteria and make sure your results chain meets them. In particular, you want to make sure that your results chain is results oriented. A common mistake with developing results chains is to list all the activities that your team must undertake to implement your strategy (see Figure 27 for an example). This produces an implementation chain, not a results chain. An implementation chain does not show the causal logic that connects a strategy to a desired conservation impact. As such, it does not provide you with an idea of the assumptions you need to test in order to know whether your strategy is
working or not. Reading your chain out loud is a good test of whether the results are “causally linked.” Read the chain from left to right, linking each pair of results with an “if..then” statement. Start by saying, “If we implement X strategy, then we will achieve Result A. If we achieve Result A, then Result B will occur…” This will help you test your logic. If an “if…then” linkage seems like a leap of faith, you may need an additional intermediate result to make a stronger causal link.
Figure 27. Example of an Implementation Chain
5. Share and refine your results chain
As stated above, results chains can help teams to discuss their assumptions openly and either reach agreement on shared assumptions or agree to disagree on certain parts of their theory of change. It is often helpful to share a draft results chain with individuals who are knowledgeable about your site, colleagues who have experience implementing similar strategies, or key
Box 21. Criteria for a Good Results Chain
A good results chain should meet the following criteria:
Results oriented: Boxes contain desired results
(e.g., reduction of hunting), and not activities (e.g.,
conduct a study).
Causally linked: There are clear “if…then”
connections between successive boxes.
Demonstrates change: Each box describes how
you hope the relevant factor will change (e.g.,
improve, increase, or decrease).
Reasonably complete: There are sufficient boxes
to construct logical connections but not so many
that the chain becomes overly complex. Simple: There is only one result per box.
Tip! Once you have completed your results chain, check the causal linkages by reading the chain out loud, from left to right, and linking each pair of results with an “if…then” statement.
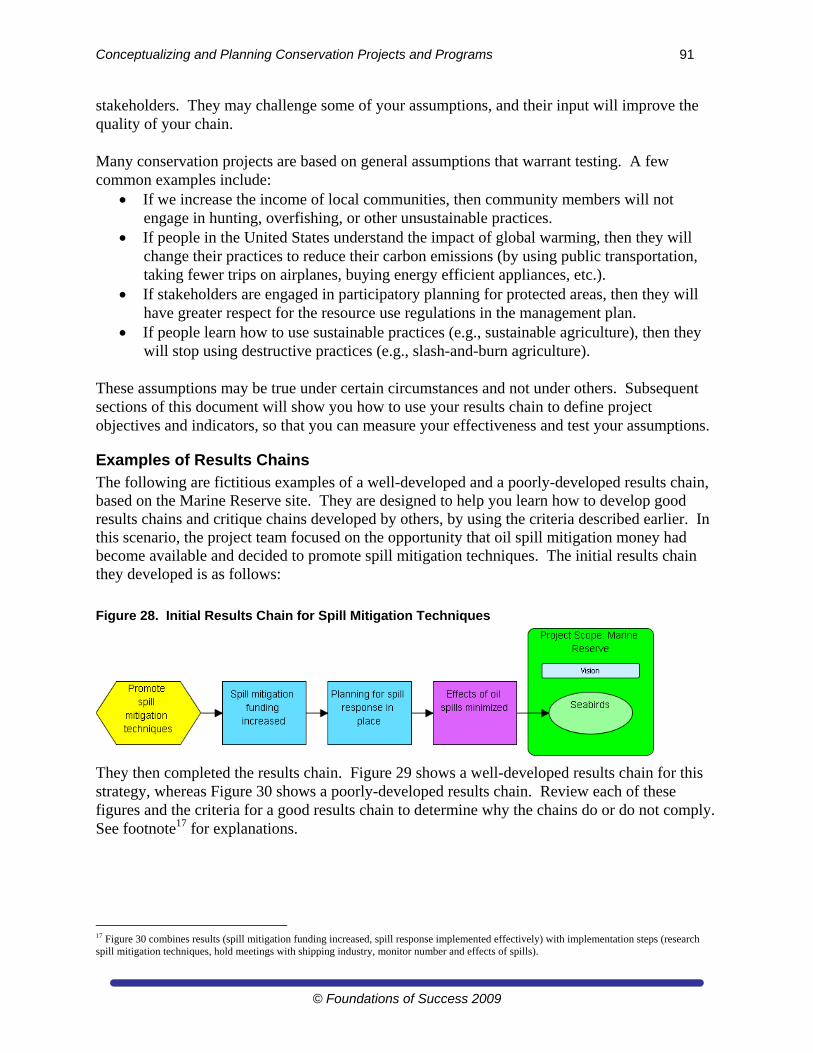
Conceptualizing and Planning Conservation Projects and Programs 91
© Foundations of Success 2009
stakeholders. They may challenge some of your assumptions, and their input will improve the quality of your chain. Many conservation projects are based on general assumptions that warrant testing. A few common examples include:
If we increase the income of local communities, then community members will not engage in hunting, overfishing, or other unsustainable practices.
If people in the United States understand the impact of global warming, then they will change their practices to reduce their carbon emissions (by using public transportation, taking fewer trips on airplanes, buying energy efficient appliances, etc.).
If stakeholders are engaged in participatory planning for protected areas, then they will have greater respect for the resource use regulations in the management plan.
If people learn how to use sustainable practices (e.g., sustainable agriculture), then they will stop using destructive practices (e.g., slash-and-burn agriculture).
These assumptions may be true under certain circumstances and not under others. Subsequent sections of this document will show you how to use your results chain to define project objectives and indicators, so that you can measure your effectiveness and test your assumptions.
Examples of Results Chains The following are fictitious examples of a well-developed and a poorly-developed results chain, based on the Marine Reserve site. They are designed to help you learn how to develop good results chains and critique chains developed by others, by using the criteria described earlier. In this scenario, the project team focused on the opportunity that oil spill mitigation money had become available and decided to promote spill mitigation techniques. The initial results chain they developed is as follows:
Figure 28. Initial Results Chain for Spill Mitigation Techniques
They then completed the results chain. Figure 29 shows a well-developed results chain for this strategy, whereas Figure 30 shows a poorly-developed results chain. Review each of these figures and the criteria for a good results chain to determine why the chains do or do not comply. See footnote17 for explanations.
17 Figure 30 combines results (spill mitigation funding increased, spill response implemented effectively) with implementation steps (research spill mitigation techniques, hold meetings with shipping industry, monitor number and effects of spills).
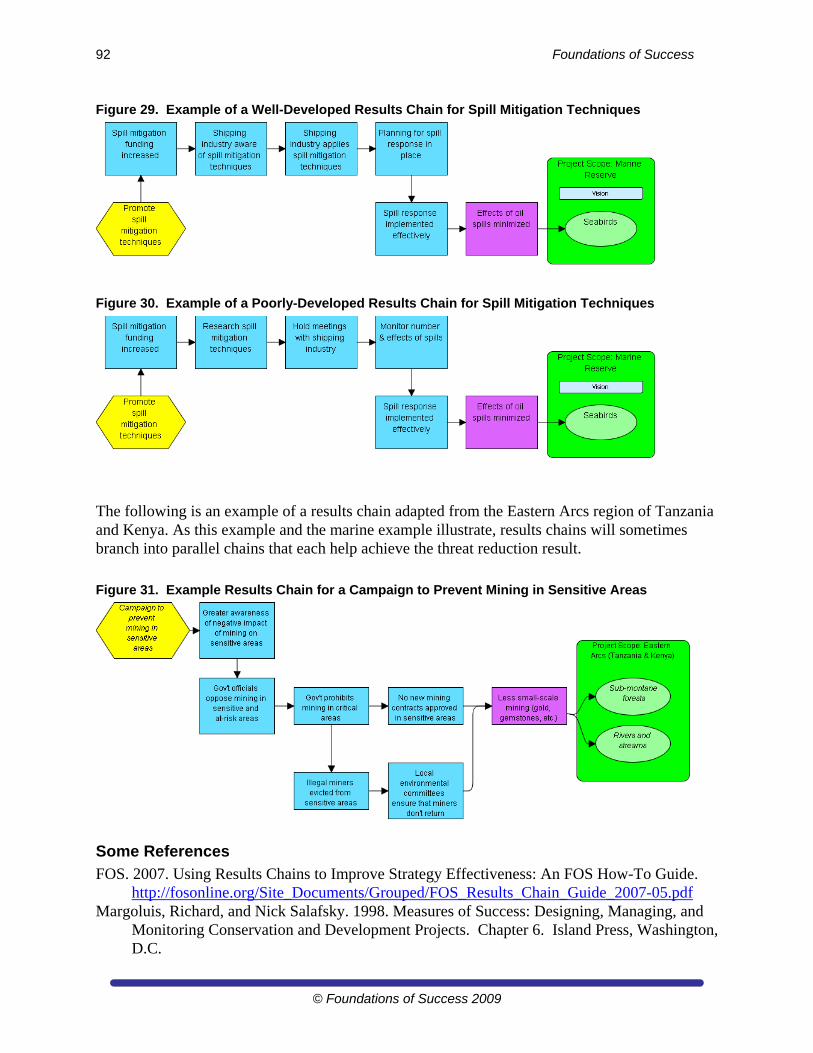
92 Foundations of Success
© Foundations of Success 2009
Figure 29. Example of a Well-Developed Results Chain for Spill Mitigation Techniques
Figure 30. Example of a Poorly-Developed Results Chain for Spill Mitigation Techniques
The following is an example of a results chain adapted from the Eastern Arcs region of Tanzania and Kenya. As this example and the marine example illustrate, results chains will sometimes branch into parallel chains that each help achieve the threat reduction result.
Figure 31. Example Results Chain for a Campaign to Prevent Mining in Sensitive Areas
Some References
FOS. 2007. Using Results Chains to Improve Strategy Effectiveness: An FOS How-To Guide. http://fosonline.org/Site_Documents/Grouped/FOS_Results_Chain_Guide_2007-05.pdf
Margoluis, Richard, and Nick Salafsky. 1998. Measures of Success: Designing, Managing, and Monitoring Conservation and Development Projects. Chapter 6. Island Press, Washington, D.C.
Conceptualizing and Planning Conservation Projects and Programs 93
© Foundations of Success 2009
W.K. Kellogg Foundation. Updated January 2004. Logic Model Development Guide: Using Logic Models to Bring Together Planning, Evaluation & Action. Battle Creek, Michigan. http://www.wkkf.org/Pubs/Tools/Evaluation/Pub3669.pdf.
Assignment 9 – Assemble Results Chains
Choose a strategy (ideally one your team is already implementing) and develop a results chain for this strategy following the steps for developing a results chain:
1. In Miradi Diagram view, select a strategy for which you would like to develop a results chain. Right-click on the strategy and choose “Create Results Chain.” Miradi will put you into the Results Chain page in Diagram view. Change the wording in the boxes to results to get an initial results chain based on the factors linked to this strategy in your conceptual model.
2. Complete the links in the results chain
3. Verify that your results chain meets the criteria for a good results chain. In particular, ensure that your results chain is not an implementation chain. Read the chain aloud to see if the causal linkages sound logical.
Repeat the steps for a second strategy (ideally one that your team has not yet tried).
Write up your observations about the exercise. Be sure to address the following points:
o If you developed a results chain for an existing strategy, please comment on the extent to which you feel the logic between your strategy and the desired impact is sound.
o In light of the work you have done on your results chain, do you feel the strategy you have chosen makes sense from a strategic point of view? Why or why not? If you look at your conceptual model again, are there other strategies you could choose that might give you greater results?
o What do you see as the value of developing results chains? What are the drawbacks? Hand in your assignment (Word document + mpz file) as Assignment 9.
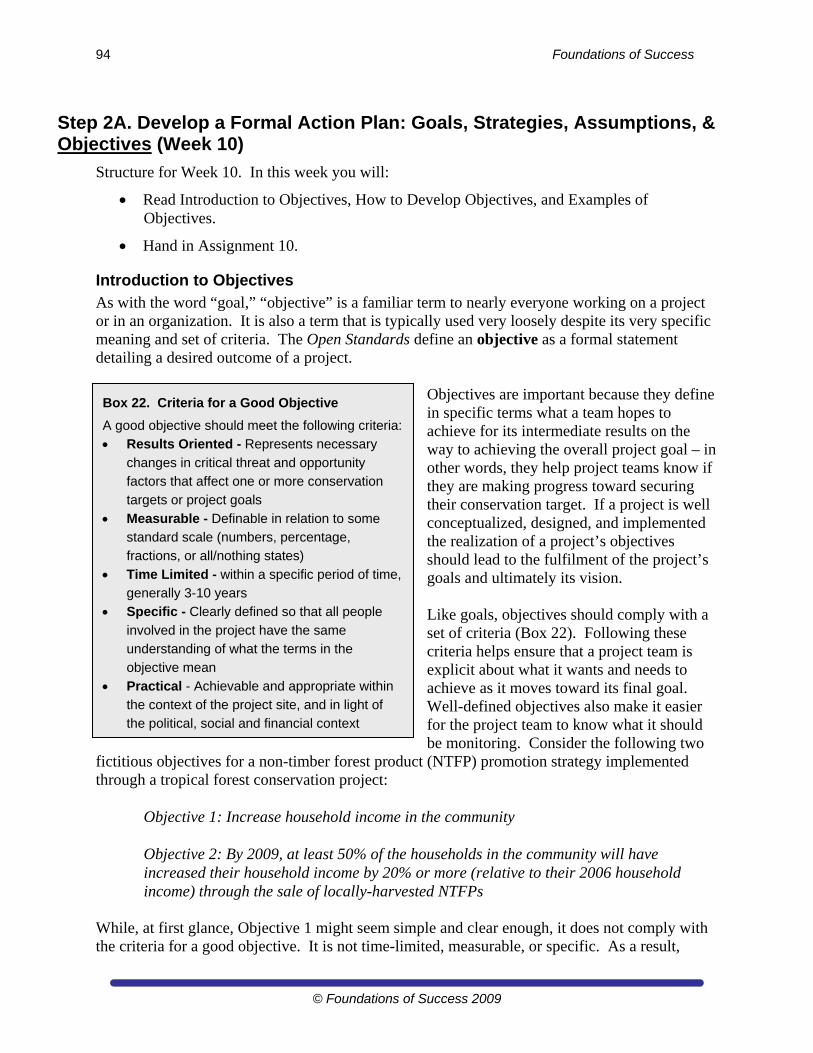
94 Foundations of Success
© Foundations of Success 2009
Step 2A. Develop a Formal Action Plan: Goals, Strategies, Assumptions, & Objectives (Week 10)
Structure for Week 10. In this week you will:
Read Introduction to Objectives, How to Develop Objectives, and Examples of Objectives.
Hand in Assignment 10.
Introduction to Objectives As with the word “goal,” “objective” is a familiar term to nearly everyone working on a project or in an organization. It is also a term that is typically used very loosely despite its very specific meaning and set of criteria. The Open Standards define an objective as a formal statement detailing a desired outcome of a project.
Objectives are important because they define in specific terms what a team hopes to achieve for its intermediate results on the way to achieving the overall project goal – in other words, they help project teams know if they are making progress toward securing their conservation target. If a project is well conceptualized, designed, and implemented the realization of a project’s objectives should lead to the fulfilment of the project’s goals and ultimately its vision. Like goals, objectives should comply with a set of criteria (Box 22). Following these criteria helps ensure that a project team is explicit about what it wants and needs to achieve as it moves toward its final goal. Well-defined objectives also make it easier for the project team to know what it should be monitoring. Consider the following two
fictitious objectives for a non-timber forest product (NTFP) promotion strategy implemented through a tropical forest conservation project:
Objective 1: Increase household income in the community Objective 2: By 2009, at least 50% of the households in the community will have increased their household income by 20% or more (relative to their 2006 household income) through the sale of locally-harvested NTFPs
While, at first glance, Objective 1 might seem simple and clear enough, it does not comply with the criteria for a good objective. It is not time-limited, measurable, or specific. As a result,
Box 22. Criteria for a Good Objective
A good objective should meet the following criteria:
Results Oriented - Represents necessary
changes in critical threat and opportunity
factors that affect one or more conservation
targets or project goals
Measurable - Definable in relation to some
standard scale (numbers, percentage,
fractions, or all/nothing states)
Time Limited - within a specific period of time,
generally 3-10 years
Specific - Clearly defined so that all people
involved in the project have the same
understanding of what the terms in the
objective mean
Practical - Achievable and appropriate within
the context of the project site, and in light of
the political, social and financial context
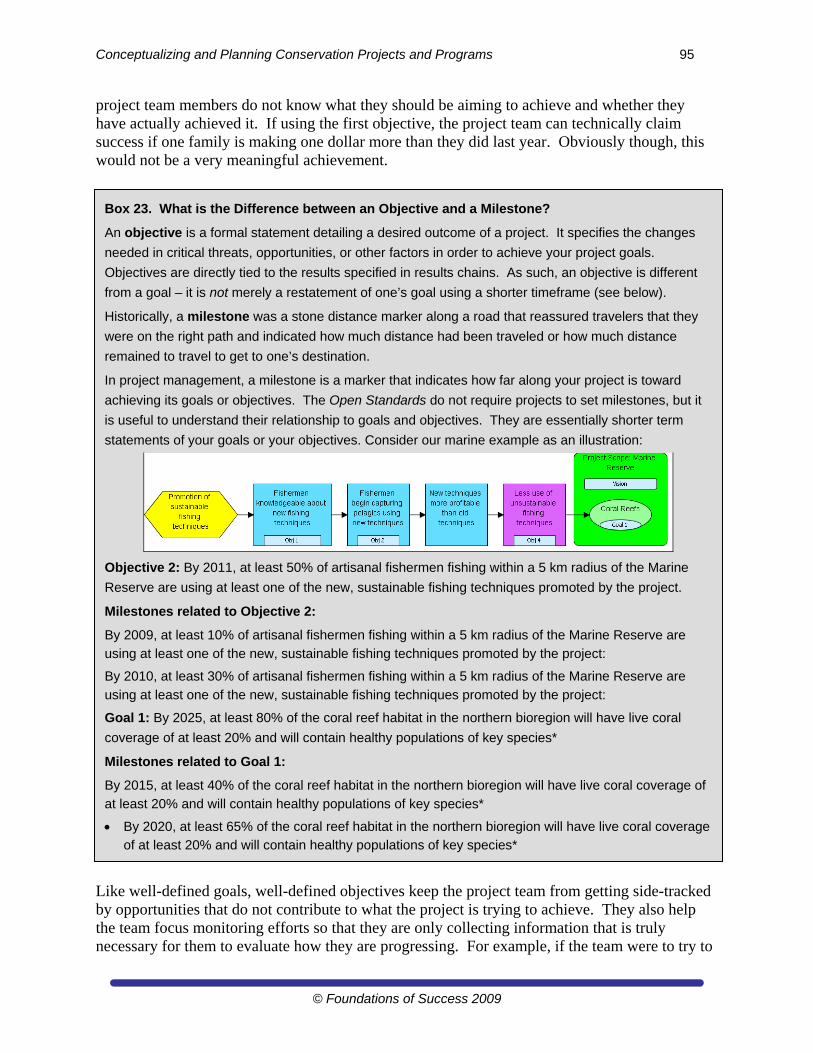
Conceptualizing and Planning Conservation Projects and Programs 95
© Foundations of Success 2009
project team members do not know what they should be aiming to achieve and whether they have actually achieved it. If using the first objective, the project team can technically claim success if one family is making one dollar more than they did last year. Obviously though, this would not be a very meaningful achievement.
Like well-defined goals, well-defined objectives keep the project team from getting side-tracked by opportunities that do not contribute to what the project is trying to achieve. They also help the team focus monitoring efforts so that they are only collecting information that is truly necessary for them to evaluate how they are progressing. For example, if the team were to try to
Box 23. What is the Difference between an Objective and a Milestone?
An objective is a formal statement detailing a desired outcome of a project. It specifies the changes
needed in critical threats, opportunities, or other factors in order to achieve your project goals.
Objectives are directly tied to the results specified in results chains. As such, an objective is different
from a goal – it is not merely a restatement of one’s goal using a shorter timeframe (see below).
Historically, a milestone was a stone distance marker along a road that reassured travelers that they
were on the right path and indicated how much distance had been traveled or how much distance
remained to travel to get to one’s destination.
In project management, a milestone is a marker that indicates how far along your project is toward
achieving its goals or objectives. The Open Standards do not require projects to set milestones, but it
is useful to understand their relationship to goals and objectives. They are essentially shorter term
statements of your goals or your objectives. Consider our marine example as an illustration:
Objective 2: By 2011, at least 50% of artisanal fishermen fishing within a 5 km radius of the Marine
Reserve are using at least one of the new, sustainable fishing techniques promoted by the project.
Milestones related to Objective 2:
By 2009, at least 10% of artisanal fishermen fishing within a 5 km radius of the Marine Reserve are
using at least one of the new, sustainable fishing techniques promoted by the project:
By 2010, at least 30% of artisanal fishermen fishing within a 5 km radius of the Marine Reserve are
using at least one of the new, sustainable fishing techniques promoted by the project:
Goal 1: By 2025, at least 80% of the coral reef habitat in the northern bioregion will have live coral
coverage of at least 20% and will contain healthy populations of key species*
Milestones related to Goal 1:
By 2015, at least 40% of the coral reef habitat in the northern bioregion will have live coral coverage of
at least 20% and will contain healthy populations of key species*
By 2020, at least 65% of the coral reef habitat in the northern bioregion will have live coral coverage of at least 20% and will contain healthy populations of key species*
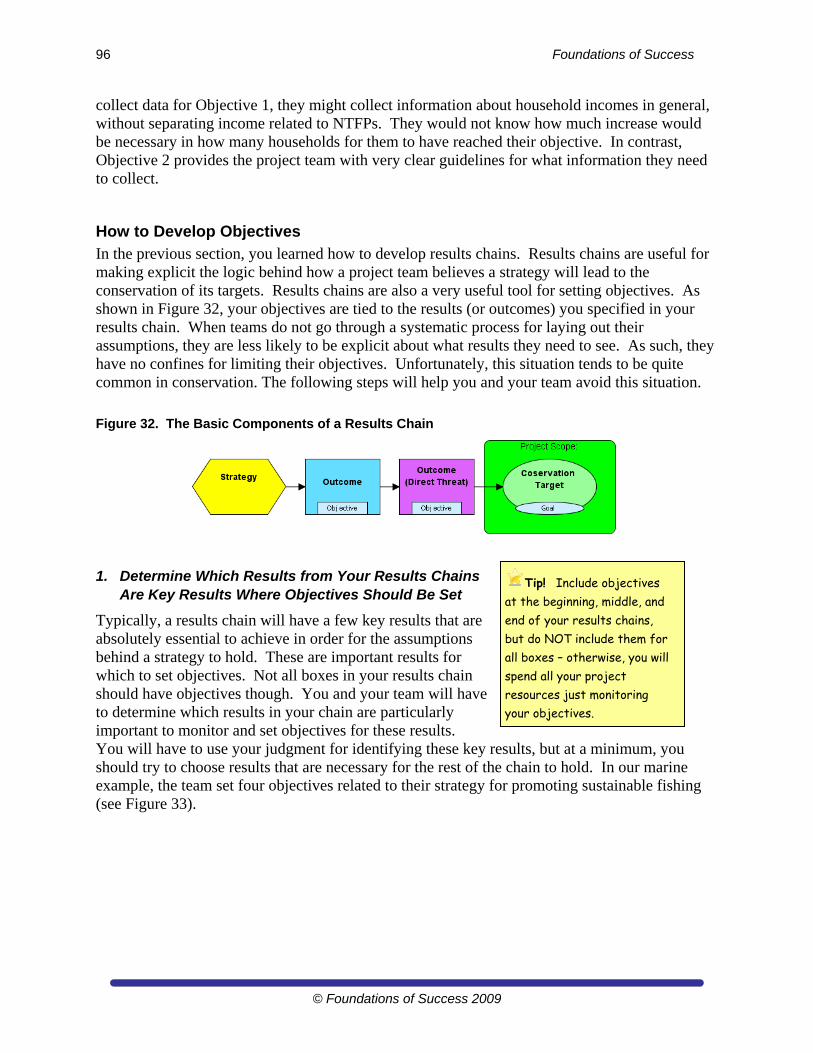
96 Foundations of Success
© Foundations of Success 2009
collect data for Objective 1, they might collect information about household incomes in general, without separating income related to NTFPs. They would not know how much increase would be necessary in how many households for them to have reached their objective. In contrast, Objective 2 provides the project team with very clear guidelines for what information they need to collect.
How to Develop Objectives In the previous section, you learned how to develop results chains. Results chains are useful for making explicit the logic behind how a project team believes a strategy will lead to the conservation of its targets. Results chains are also a very useful tool for setting objectives. As shown in Figure 32, your objectives are tied to the results (or outcomes) you specified in your results chain. When teams do not go through a systematic process for laying out their assumptions, they are less likely to be explicit about what results they need to see. As such, they have no confines for limiting their objectives. Unfortunately, this situation tends to be quite common in conservation. The following steps will help you and your team avoid this situation.
Figure 32. The Basic Components of a Results Chain
1. Determine Which Results from Your Results Chains Are Key Results Where Objectives Should Be Set
Typically, a results chain will have a few key results that are absolutely essential to achieve in order for the assumptions behind a strategy to hold. These are important results for which to set objectives. Not all boxes in your results chain should have objectives though. You and your team will have to determine which results in your chain are particularly important to monitor and set objectives for these results. You will have to use your judgment for identifying these key results, but at a minimum, you should try to choose results that are necessary for the rest of the chain to hold. In our marine example, the team set four objectives related to their strategy for promoting sustainable fishing (see Figure 33).
Tip! Include objectives at the beginning, middle, and end of your results chains, but do NOT include them for all boxes – otherwise, you will spend all your project resources just monitoring your objectives.
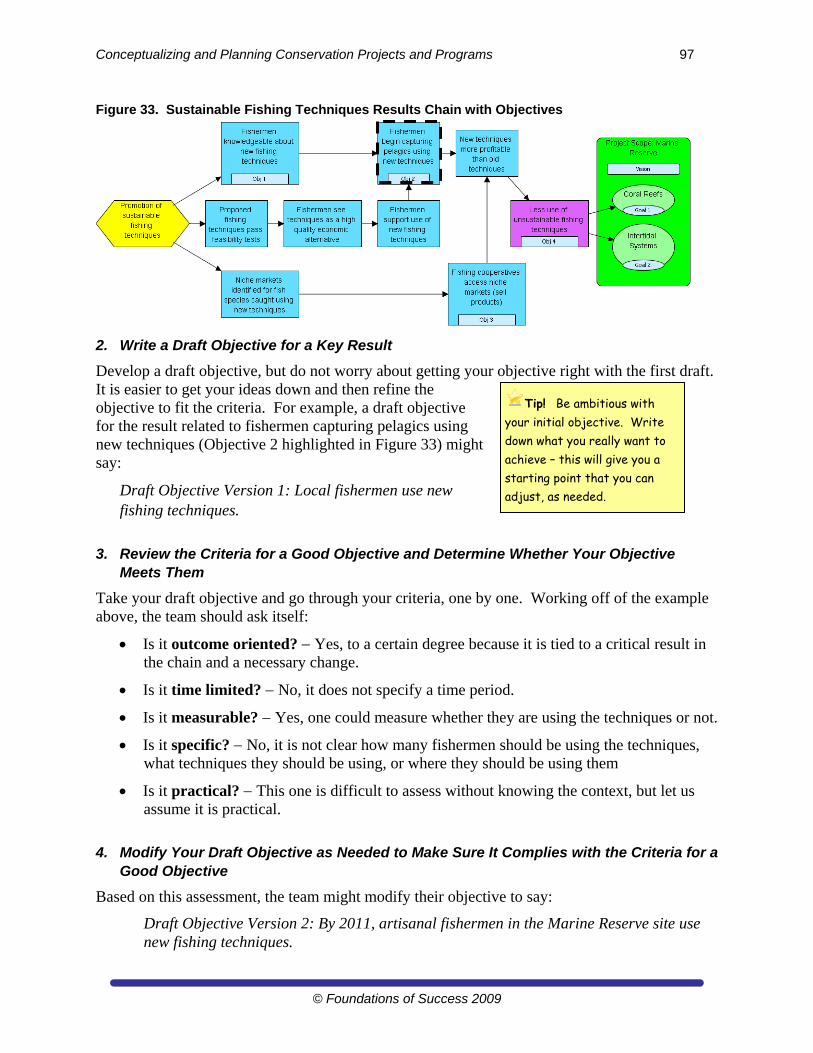
Conceptualizing and Planning Conservation Projects and Programs 97
© Foundations of Success 2009
Figure 33. Sustainable Fishing Techniques Results Chain with Objectives
2. Write a Draft Objective for a Key Result
Develop a draft objective, but do not worry about getting your objective right with the first draft. It is easier to get your ideas down and then refine the objective to fit the criteria. For example, a draft objective for the result related to fishermen capturing pelagics using new techniques (Objective 2 highlighted in Figure 33) might say:
Draft Objective Version 1: Local fishermen use new fishing techniques.
3. Review the Criteria for a Good Objective and Determine Whether Your Objective Meets Them
Take your draft objective and go through your criteria, one by one. Working off of the example above, the team should ask itself:
Is it outcome oriented? Yes, to a certain degree because it is tied to a critical result in the chain and a necessary change.
Is it time limited? No, it does not specify a time period.
Is it measurable? Yes, one could measure whether they are using the techniques or not.
Is it specific? No, it is not clear how many fishermen should be using the techniques, what techniques they should be using, or where they should be using them
Is it practical? This one is difficult to assess without knowing the context, but let us assume it is practical.
4. Modify Your Draft Objective as Needed to Make Sure It Complies with the Criteria for a Good Objective
Based on this assessment, the team might modify their objective to say:
Draft Objective Version 2: By 2011, artisanal fishermen in the Marine Reserve site use new fishing techniques.
Tip! Be ambitious with your initial objective. Write down what you really want to achieve – this will give you a starting point that you can adjust, as needed.
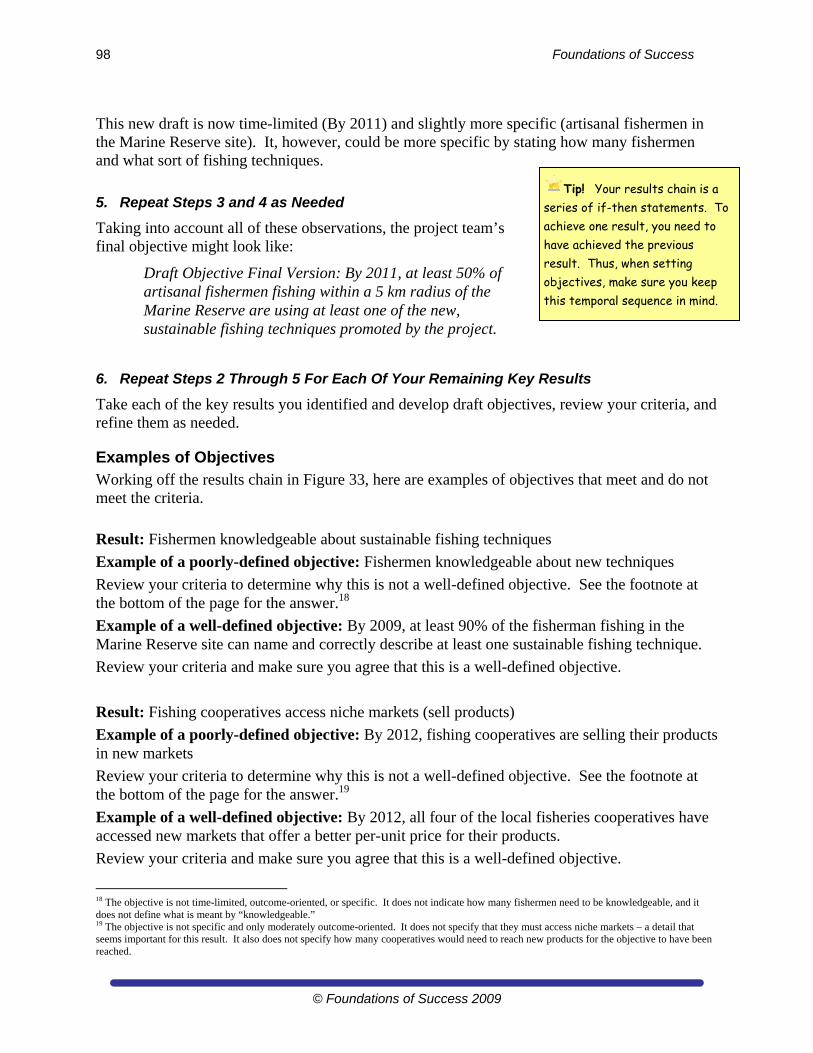
98 Foundations of Success
© Foundations of Success 2009
This new draft is now time-limited (By 2011) and slightly more specific (artisanal fishermen in the Marine Reserve site). It, however, could be more specific by stating how many fishermen and what sort of fishing techniques.
5. Repeat Steps 3 and 4 as Needed
Taking into account all of these observations, the project team’s final objective might look like:
Draft Objective Final Version: By 2011, at least 50% of artisanal fishermen fishing within a 5 km radius of the Marine Reserve are using at least one of the new, sustainable fishing techniques promoted by the project.
6. Repeat Steps 2 Through 5 For Each Of Your Remaining Key Results
Take each of the key results you identified and develop draft objectives, review your criteria, and refine them as needed.
Examples of Objectives Working off the results chain in Figure 33, here are examples of objectives that meet and do not meet the criteria.
Result: Fishermen knowledgeable about sustainable fishing techniques
Example of a poorly-defined objective: Fishermen knowledgeable about new techniques
Review your criteria to determine why this is not a well-defined objective. See the footnote at the bottom of the page for the answer.18
Example of a well-defined objective: By 2009, at least 90% of the fisherman fishing in the Marine Reserve site can name and correctly describe at least one sustainable fishing technique.
Review your criteria and make sure you agree that this is a well-defined objective.
Result: Fishing cooperatives access niche markets (sell products)
Example of a poorly-defined objective: By 2012, fishing cooperatives are selling their products in new markets
Review your criteria to determine why this is not a well-defined objective. See the footnote at the bottom of the page for the answer.19
Example of a well-defined objective: By 2012, all four of the local fisheries cooperatives have accessed new markets that offer a better per-unit price for their products.
Review your criteria and make sure you agree that this is a well-defined objective.
18 The objective is not time-limited, outcome-oriented, or specific. It does not indicate how many fishermen need to be knowledgeable, and it does not define what is meant by “knowledgeable.” 19 The objective is not specific and only moderately outcome-oriented. It does not specify that they must access niche markets – a detail that seems important for this result. It also does not specify how many cooperatives would need to reach new products for the objective to have been reached.
Tip! Your results chain is a series of if-then statements. To achieve one result, you need to have achieved the previous result. Thus, when setting objectives, make sure you keep this temporal sequence in mind.
Conceptualizing and Planning Conservation Projects and Programs 99
© Foundations of Success 2009
Result: Less use of unsustainable fishing techniques on coral reefs
Example of a poorly-defined objective: By 2015, fishing is reduced
Review your criteria to determine why this is not a well-defined objective. See the footnote at the bottom of the page for the answer.20
Example of a well-defined objective: By 2015, at least 70% of the local fishing fleet in the Marine Reserve no longer use any unsustainable fishing techniques.
Review your criteria and make sure you agree that this is a well-defined objective.
Some References
Margoluis, Richard, and Nick Salafsky. 1998. Measures of Success: Designing, Managing, and Monitoring Conservation and Development Projects. Chapter 4. Island Press, Washington, D.C
TNC, 2007. Guidance for Step 6: Develop Strategies: Objectives and Actions. In Conservation Action Planning Handbook: Developing Strategies, Taking Action and Measuring Success at Any Scale. The Nature Conservancy, Arlington, VA. Available from: http://conserveonline.org/workspaces/cbdgateway/cap/resources/2/1/handbook
WWF. 2006. Step 2.1Design Action Plan: Goals, Objectives, & Activities. Resources for Implementing the WWF Project & Programme Standards. Available from: http://www.panda.org/what_we_do/how_we_work/conservation/programme_standards.
Assignment 10– Develop Objectives along Results Chain That Meet Criteria for “Good” Objectives
Part 1: Identifying Objectives That Meet the Standards Criteria
For each of the following objectives, apply the criteria for good objectives and determine whether the objectives meet the criteria. For each objective explain why or why not.
o Result: Clearcutting decreased Objective: By 2012, clearcutting has been reduced by at least 50%, as compared to 2006 levels, in the official buffer zone of Heartland National Park
o Result: Improved enforcement of hunting restrictions Objective: Hunting restrictions enforced within 5 years of the start of the project
o Result: Community participation strengthened Objective: To ensure greater commitment to the principles of sustainable forest management so that forests are conserved for current and future generations
o Result: Water policies enacted Objective: Develop an awareness raising campaign so that policymakers understand the importance of water policies
20 The objective is not outcome-oriented or specific. It is not linked to the critical result of less use of unsustainable fishing techniques on coral reefs. The threat is not fishing per se but rather unsustainable fishing, and this should be reflected in the objective. It also does not indicate where fishing should be reduced or by how much.
100 Foundations of Success
© Foundations of Success 2009
Part 2: Developing Objectives Along a Results Chain
Write objectives for at least one of the chains you developed in Assignment 9. Using the following steps:
1. Determine which results from your results chain are key results
2. Write a draft objective for a key result (enter this in Miradi by double clicking on the result and creating a new objective)
3. Review the criteria for a good objective and determine whether your objective meets the criteria
4. Modify your draft objective as needed to make sure it complies with the criteria for a good objective
5. Repeat steps 3 and 4 as needed
6. Repeat steps 2 through 5 for each of your remaining key results
Briefly (1-2 paragraphs) describe your observations about the process of developing objectives.
Hand in your assignment (Word document + mpz file) as Assignment 10.
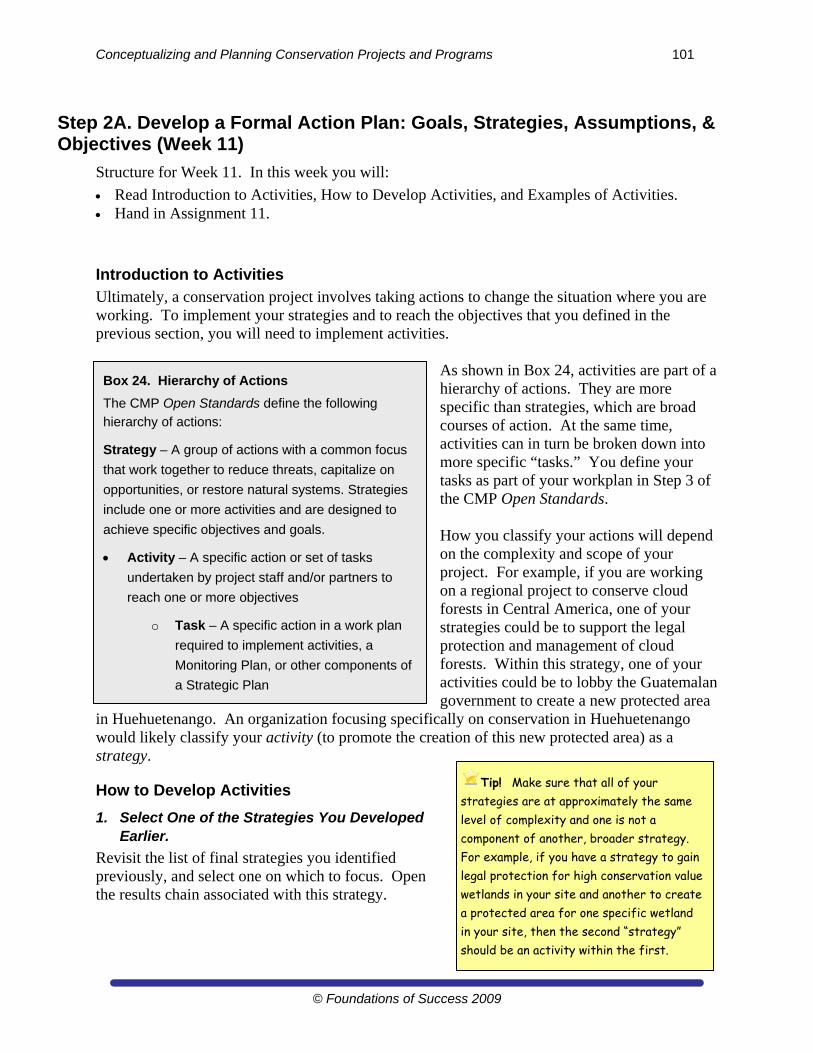
Conceptualizing and Planning Conservation Projects and Programs 101
© Foundations of Success 2009
Step 2A. Develop a Formal Action Plan: Goals, Strategies, Assumptions, & Objectives (Week 11)
Structure for Week 11. In this week you will:
Read Introduction to Activities, How to Develop Activities, and Examples of Activities. Hand in Assignment 11.
Introduction to Activities Ultimately, a conservation project involves taking actions to change the situation where you are working. To implement your strategies and to reach the objectives that you defined in the previous section, you will need to implement activities.
As shown in Box 24, activities are part of a hierarchy of actions. They are more specific than strategies, which are broad courses of action. At the same time, activities can in turn be broken down into more specific “tasks.” You define your tasks as part of your workplan in Step 3 of the CMP Open Standards. How you classify your actions will depend on the complexity and scope of your project. For example, if you are working on a regional project to conserve cloud forests in Central America, one of your strategies could be to support the legal protection and management of cloud forests. Within this strategy, one of your activities could be to lobby the Guatemalan government to create a new protected area
in Huehuetenango. An organization focusing specifically on conservation in Huehuetenango would likely classify your activity (to promote the creation of this new protected area) as a strategy.
How to Develop Activities
1. Select One of the Strategies You Developed Earlier.
Revisit the list of final strategies you identified previously, and select one on which to focus. Open the results chain associated with this strategy.
Box 24. Hierarchy of Actions
The CMP Open Standards define the following
hierarchy of actions:
Strategy – A group of actions with a common focus
that work together to reduce threats, capitalize on
opportunities, or restore natural systems. Strategies
include one or more activities and are designed to
achieve specific objectives and goals.
Activity – A specific action or set of tasks
undertaken by project staff and/or partners to
reach one or more objectives
o Task – A specific action in a work plan
required to implement activities, a
Monitoring Plan, or other components of
a Strategic Plan
Tip! Make sure that all of your strategies are at approximately the same level of complexity and one is not a component of another, broader strategy. For example, if you have a strategy to gain legal protection for high conservation value wetlands in your site and another to create a protected area for one specific wetland in your site, then the second “strategy” should be an activity within the first.
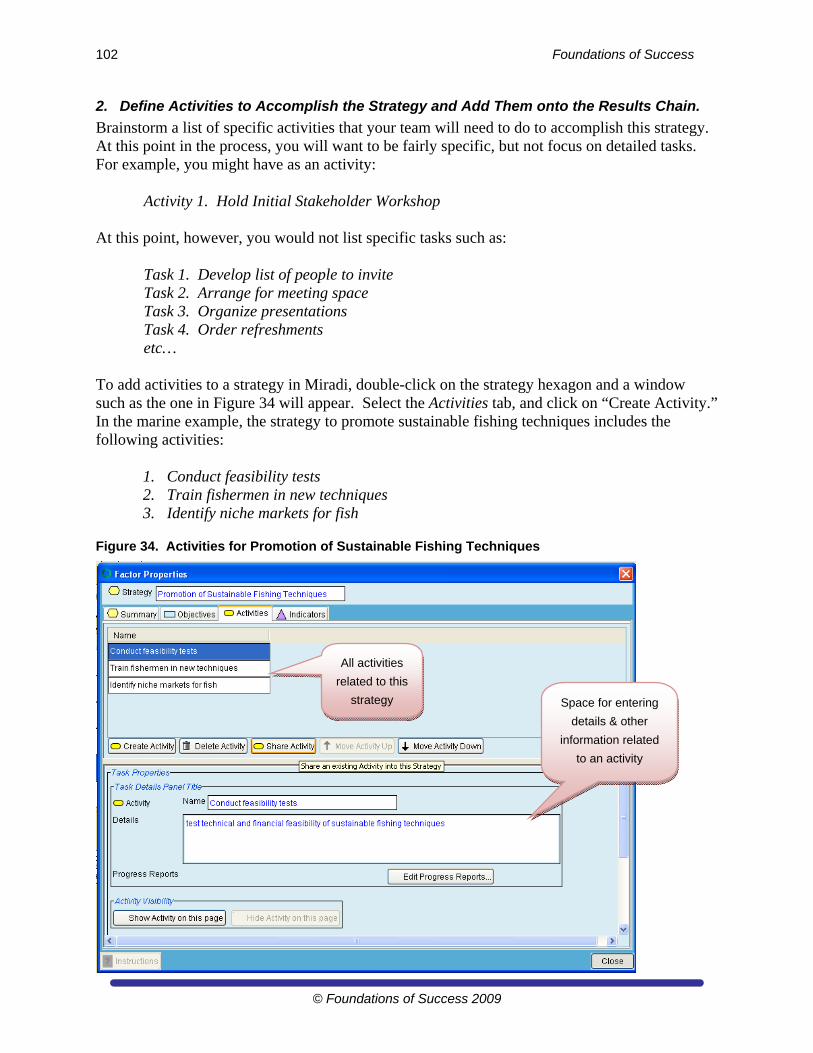
102 Foundations of Success
© Foundations of Success 2009
2. Define Activities to Accomplish the Strategy and Add Them onto the Results Chain.
Brainstorm a list of specific activities that your team will need to do to accomplish this strategy. At this point in the process, you will want to be fairly specific, but not focus on detailed tasks. For example, you might have as an activity:
Activity 1. Hold Initial Stakeholder Workshop
At this point, however, you would not list specific tasks such as:
Task 1. Develop list of people to invite Task 2. Arrange for meeting space Task 3. Organize presentations Task 4. Order refreshments etc…
To add activities to a strategy in Miradi, double-click on the strategy hexagon and a window such as the one in Figure 34 will appear. Select the Activities tab, and click on “Create Activity.” In the marine example, the strategy to promote sustainable fishing techniques includes the following activities:
1. Conduct feasibility tests 2. Train fishermen in new techniques 3. Identify niche markets for fish
Figure 34. Activities for Promotion of Sustainable Fishing Techniques
All activities
related to this
strategy Space for entering
details & other
information related
to an activity
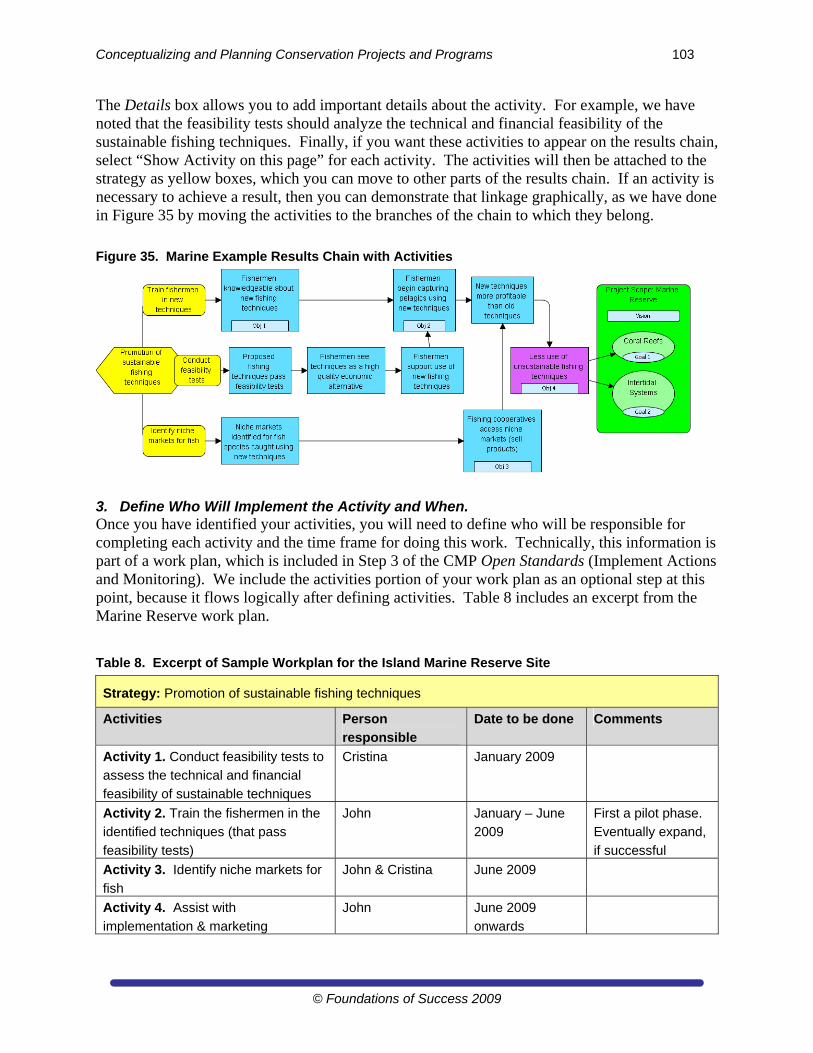
Conceptualizing and Planning Conservation Projects and Programs 103
© Foundations of Success 2009
The Details box allows you to add important details about the activity. For example, we have noted that the feasibility tests should analyze the technical and financial feasibility of the sustainable fishing techniques. Finally, if you want these activities to appear on the results chain, select “Show Activity on this page” for each activity. The activities will then be attached to the strategy as yellow boxes, which you can move to other parts of the results chain. If an activity is necessary to achieve a result, then you can demonstrate that linkage graphically, as we have done in Figure 35 by moving the activities to the branches of the chain to which they belong.
Figure 35. Marine Example Results Chain with Activities
3. Define Who Will Implement the Activity and When. Once you have identified your activities, you will need to define who will be responsible for completing each activity and the time frame for doing this work. Technically, this information is part of a work plan, which is included in Step 3 of the CMP Open Standards (Implement Actions and Monitoring). We include the activities portion of your work plan as an optional step at this point, because it flows logically after defining activities. Table 8 includes an excerpt from the Marine Reserve work plan.
Table 8. Excerpt of Sample Workplan for the Island Marine Reserve Site
Strategy: Promotion of sustainable fishing techniques
Activities Person
responsible
Date to be done Comments
Activity 1. Conduct feasibility tests to
assess the technical and financial
feasibility of sustainable techniques
Cristina January 2009
Activity 2. Train the fishermen in the
identified techniques (that pass
feasibility tests)
John January – June
2009
First a pilot phase.
Eventually expand,
if successful
Activity 3. Identify niche markets for
fish
John & Cristina June 2009
Activity 4. Assist with
implementation & marketing
John June 2009
onwards
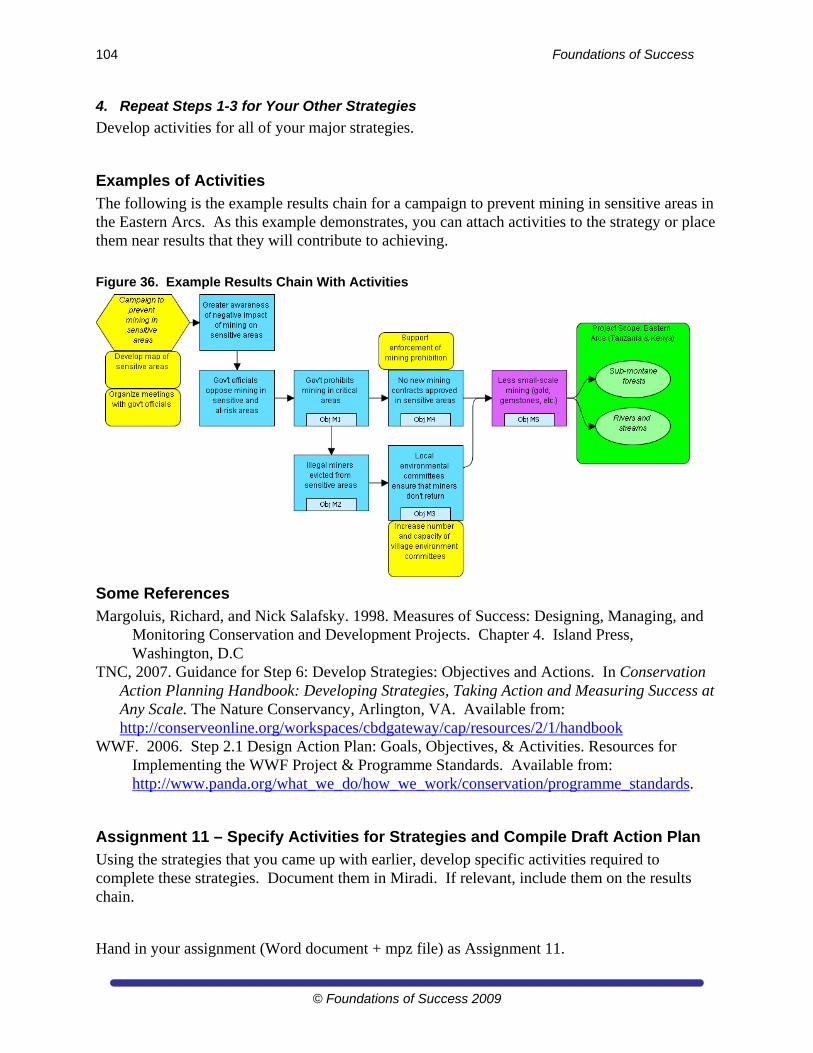
104 Foundations of Success
© Foundations of Success 2009
4. Repeat Steps 1-3 for Your Other Strategies
Develop activities for all of your major strategies.
Examples of Activities
The following is the example results chain for a campaign to prevent mining in sensitive areas in the Eastern Arcs. As this example demonstrates, you can attach activities to the strategy or place them near results that they will contribute to achieving.
Figure 36. Example Results Chain With Activities
Some References
Margoluis, Richard, and Nick Salafsky. 1998. Measures of Success: Designing, Managing, and Monitoring Conservation and Development Projects. Chapter 4. Island Press, Washington, D.C
TNC, 2007. Guidance for Step 6: Develop Strategies: Objectives and Actions. In Conservation Action Planning Handbook: Developing Strategies, Taking Action and Measuring Success at Any Scale. The Nature Conservancy, Arlington, VA. Available from: http://conserveonline.org/workspaces/cbdgateway/cap/resources/2/1/handbook
WWF. 2006. Step 2.1 Design Action Plan: Goals, Objectives, & Activities. Resources for Implementing the WWF Project & Programme Standards. Available from: http://www.panda.org/what_we_do/how_we_work/conservation/programme_standards.
Assignment 11 – Specify Activities for Strategies and Compile Draft Action Plan
Using the strategies that you came up with earlier, develop specific activities required to complete these strategies. Document them in Miradi. If relevant, include them on the results chain.
Hand in your assignment (Word document + mpz file) as Assignment 11.
Conceptualizing and Planning Conservation Projects and Programs 105
© Foundations of Success 2009
Step 2B. Develop a Formal Monitoring Plan (Week 12)
Structure for Week 12. In this week you will:
Read Introduction to Monitoring Plans, How To Develop a Monitoring Plan, and Example of a Monitoring Plan
Hand in Assignment 12.
Introduction to Monitoring Plans
Now that you have your action plan in place and are ready to implement your project, you may be wondering how you will know if you are on track and if you are having the impact desired. This is where monitoring comes in. Monitoring is the periodic process of gathering data related to the project goals and objectives. If your project team is practicing adaptive management, monitoring should be primarily for your team’s benefit so that team members know whether your project is on track and what adjustments you may need to make to improve its conservation results. Monitoring provides the basis for learning by helping your team determine what is working and what is not working. This, in turn, allows your team to adapt and improve its project. While monitoring is most important for the project team, it is also important for other actors. For instance, it can:
Help your organization assess its total contribution as an institution to the field of conservation.
Help you and your colleagues learn which approaches are working well or not well and under what conditions, thus enabling better decisions on future priorities and strategies.
Enhance accountability, credibility, and transparency with external donors, policymakers, and the general public.
Strengthen ownership of the work by partners and stakeholders, and therefore sustainability of the work for the future.
Capture lessons that can be shared with the broader conservation community, thus improving learning beyond your own organization.
Some misconceptions about monitoring: #1. Monitoring is the domain of scientists or professionals with advanced graduate degrees. In reality monitoring is something that most project staff can and should do. One reason this training guide spends a lot of upfront time on defining the context of and designing your action plan is because investing time on these initial steps will make completing a monitoring plan more straightforward. #2. The first step in monitoring is to ask, “What indicators should I use?” Although this is an important question, it is usually premature to ask such a broad question without having the means to narrow down the answer. Fortunately, you have done a lot of the work and thinking in Step 1A through Step 2A of the CMP Open Standard, including identifying indicators for your targets’ key ecological attributes as part of the viability assessment in Step 1B. The work you have already done will help you easily define the rest of your indicators.
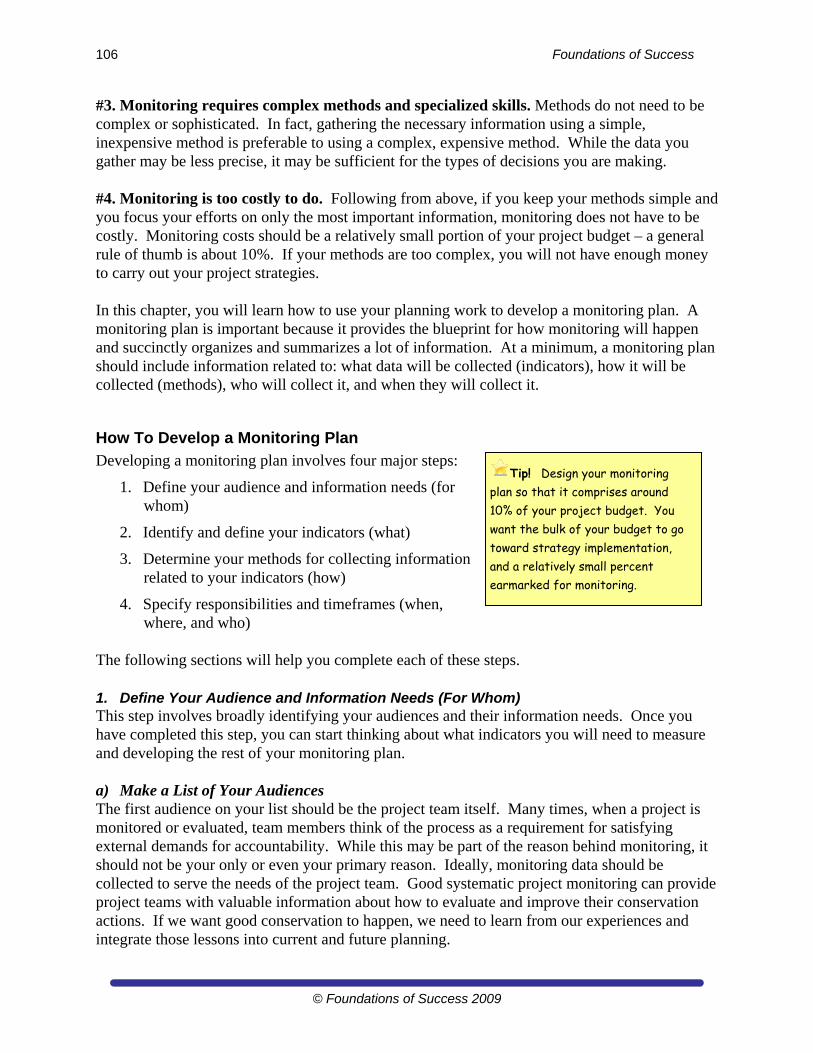
106 Foundations of Success
© Foundations of Success 2009
#3. Monitoring requires complex methods and specialized skills. Methods do not need to be complex or sophisticated. In fact, gathering the necessary information using a simple, inexpensive method is preferable to using a complex, expensive method. While the data you gather may be less precise, it may be sufficient for the types of decisions you are making. #4. Monitoring is too costly to do. Following from above, if you keep your methods simple and you focus your efforts on only the most important information, monitoring does not have to be costly. Monitoring costs should be a relatively small portion of your project budget – a general rule of thumb is about 10%. If your methods are too complex, you will not have enough money to carry out your project strategies. In this chapter, you will learn how to use your planning work to develop a monitoring plan. A monitoring plan is important because it provides the blueprint for how monitoring will happen and succinctly organizes and summarizes a lot of information. At a minimum, a monitoring plan should include information related to: what data will be collected (indicators), how it will be collected (methods), who will collect it, and when they will collect it.
How To Develop a Monitoring Plan
Developing a monitoring plan involves four major steps:
1. Define your audience and information needs (for whom)
2. Identify and define your indicators (what)
3. Determine your methods for collecting information related to your indicators (how)
4. Specify responsibilities and timeframes (when, where, and who)
The following sections will help you complete each of these steps. 1. Define Your Audience and Information Needs (For Whom) This step involves broadly identifying your audiences and their information needs. Once you have completed this step, you can start thinking about what indicators you will need to measure and developing the rest of your monitoring plan. a) Make a List of Your Audiences The first audience on your list should be the project team itself. Many times, when a project is monitored or evaluated, team members think of the process as a requirement for satisfying external demands for accountability. While this may be part of the reason behind monitoring, it should not be your only or even your primary reason. Ideally, monitoring data should be collected to serve the needs of the project team. Good systematic project monitoring can provide project teams with valuable information about how to evaluate and improve their conservation actions. If we want good conservation to happen, we need to learn from our experiences and integrate those lessons into current and future planning.
Tip! Design your monitoring plan so that it comprises around 10% of your project budget. You want the bulk of your budget to go toward strategy implementation, and a relatively small percent earmarked for monitoring.
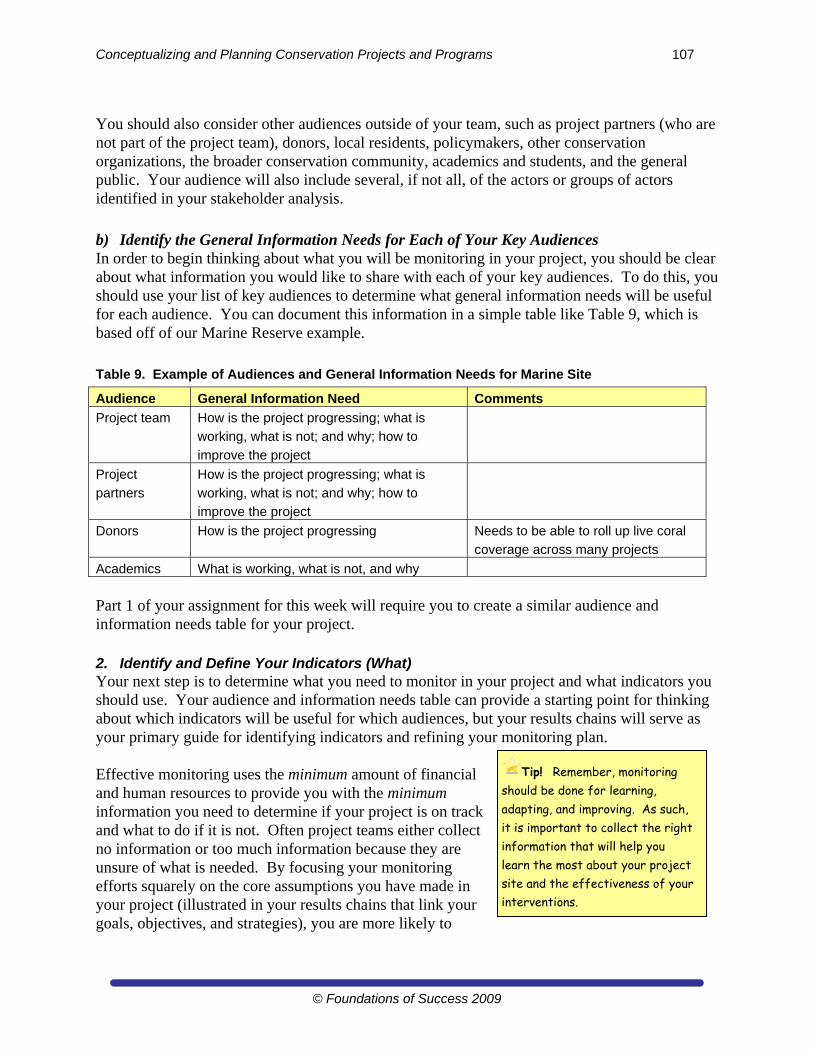
Conceptualizing and Planning Conservation Projects and Programs 107
© Foundations of Success 2009
You should also consider other audiences outside of your team, such as project partners (who are not part of the project team), donors, local residents, policymakers, other conservation organizations, the broader conservation community, academics and students, and the general public. Your audience will also include several, if not all, of the actors or groups of actors identified in your stakeholder analysis.
b) Identify the General Information Needs for Each of Your Key Audiences In order to begin thinking about what you will be monitoring in your project, you should be clear about what information you would like to share with each of your key audiences. To do this, you should use your list of key audiences to determine what general information needs will be useful for each audience. You can document this information in a simple table like Table 9, which is based off of our Marine Reserve example.
Table 9. Example of Audiences and General Information Needs for Marine Site
Audience General Information Need Comments
Project team How is the project progressing; what is
working, what is not; and why; how to
improve the project
Project
partners
How is the project progressing; what is
working, what is not; and why; how to
improve the project
Donors How is the project progressing Needs to be able to roll up live coral
coverage across many projects
Academics What is working, what is not, and why
Part 1 of your assignment for this week will require you to create a similar audience and information needs table for your project. 2. Identify and Define Your Indicators (What) Your next step is to determine what you need to monitor in your project and what indicators you should use. Your audience and information needs table can provide a starting point for thinking about which indicators will be useful for which audiences, but your results chains will serve as your primary guide for identifying indicators and refining your monitoring plan. Effective monitoring uses the minimum amount of financial and human resources to provide you with the minimum information you need to determine if your project is on track and what to do if it is not. Often project teams either collect no information or too much information because they are unsure of what is needed. By focusing your monitoring efforts squarely on the core assumptions you have made in your project (illustrated in your results chains that link your goals, objectives, and strategies), you are more likely to
Tip! Remember, monitoring should be done for learning, adapting, and improving. As such, it is important to collect the right information that will help you learn the most about your project site and the effectiveness of your interventions.
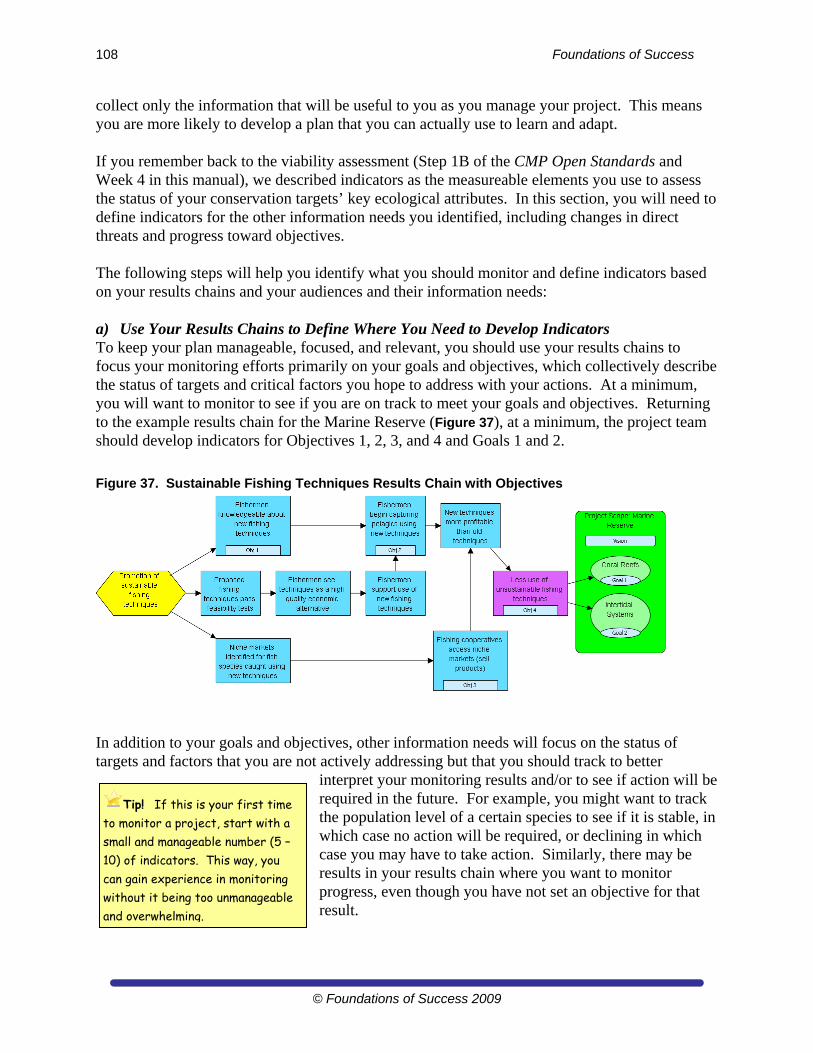
108 Foundations of Success
© Foundations of Success 2009
collect only the information that will be useful to you as you manage your project. This means you are more likely to develop a plan that you can actually use to learn and adapt.
If you remember back to the viability assessment (Step 1B of the CMP Open Standards and Week 4 in this manual), we described indicators as the measureable elements you use to assess the status of your conservation targets’ key ecological attributes. In this section, you will need to define indicators for the other information needs you identified, including changes in direct threats and progress toward objectives. The following steps will help you identify what you should monitor and define indicators based on your results chains and your audiences and their information needs: a) Use Your Results Chains to Define Where You Need to Develop Indicators To keep your plan manageable, focused, and relevant, you should use your results chains to focus your monitoring efforts primarily on your goals and objectives, which collectively describe the status of targets and critical factors you hope to address with your actions. At a minimum, you will want to monitor to see if you are on track to meet your goals and objectives. Returning to the example results chain for the Marine Reserve (Figure 37), at a minimum, the project team should develop indicators for Objectives 1, 2, 3, and 4 and Goals 1 and 2.
Figure 37. Sustainable Fishing Techniques Results Chain with Objectives
In addition to your goals and objectives, other information needs will focus on the status of targets and factors that you are not actively addressing but that you should track to better
interpret your monitoring results and/or to see if action will be required in the future. For example, you might want to track the population level of a certain species to see if it is stable, in which case no action will be required, or declining in which case you may have to take action. Similarly, there may be results in your results chain where you want to monitor progress, even though you have not set an objective for that result.
Tip! If this is your first time to monitor a project, start with a small and manageable number (5 – 10) of indicators. This way, you can gain experience in monitoring without it being too unmanageable and overwhelming.
Conceptualizing and Planning Conservation Projects and Programs 109
© Foundations of Success 2009
In the Marine Reserve example, the team may want to know whether the proposed fishing techniques passed the feasibility tests. So, they would include an indicator for this in their monitoring plan, even though they did not set an objective there. In this case, it would be important to include an indicator for this middle part of the chain because its logic would not be adequately analyzed if the monitoring focused solely on goals and objectives. You may also want to monitor the external context of your project including key risks you have identified (e.g., climate change, spread of invasive species, political climate). This will help you determine if – even though the project is well implemented and has a sound theory of change – factors outside of your project are influencing the effectiveness of your actions. b) Use Your Audience and Information Needs Table to Determine if There are Any
Additional Indicators You Should Consider Monitoring Finally, you should go back to your audience and information needs table and make sure that your indicators are covering all of the information needs. You may have an audience that would like to see reporting on a particular outcome or a specific indicator. In our Marine example, the donor is interested in how the project is progressing (Table 9), but more specifically the donor wants to know about the profitability of the new fishing techniques being promoted. As such, the project
team should consider having an indicator that measures this intermediate result in their results chain, even though they did not develop an objective for this result. As long as your indicators are all within the framework of your results chain or conceptual model, and within your resource capacity, then you could include additional indicators that have special interest for certain audiences, but may not be necessary for effective monitoring. Once you have identified what you should monitor based on your results chains and your audiences and their information needs, you can define your specific indicators. c) Define Your Indicators If your goals and objectives meet the criteria of being specific and measurable, then the indicators should flow directly from your goal and objective statements. Consider, for example, the following goals and objectives developed earlier for the Marine Reserve example and their associated indicators:
Objective 2: By 2009, at least 50% of artisanal fishermen fishing within a 5 km radius of the Marine Reserve are using at least one of the new, sustainable fishing techniques promoted by the project.
Indicator: % of artisanal fishermen fishing within a 5 km radius of the marine reserve that are using at least one of the new sustainable fishing techniques promoted by the project
Objective 3: By 2008, all four of the local fisheries cooperatives have accessed new markets that offer a better per-unit price for their products.
Tip! Keep in mind that one indicator could very well satisfy the information needs of several different key audiences. You should maximize such opportunities for more efficient monitoring. What may vary though is how you present information from this indicator to your audience.
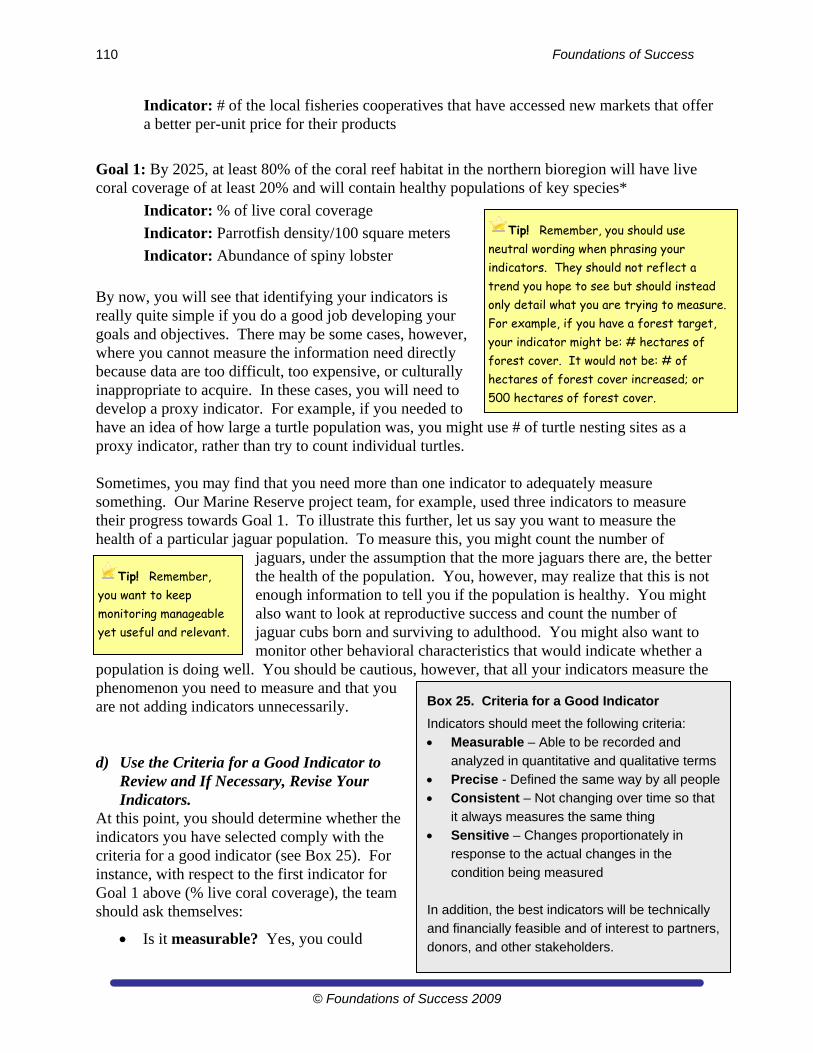
110 Foundations of Success
© Foundations of Success 2009
Indicator: # of the local fisheries cooperatives that have accessed new markets that offer a better per-unit price for their products
Goal 1: By 2025, at least 80% of the coral reef habitat in the northern bioregion will have live coral coverage of at least 20% and will contain healthy populations of key species*
Indicator: % of live coral coverage
Indicator: Parrotfish density/100 square meters
Indicator: Abundance of spiny lobster
By now, you will see that identifying your indicators is really quite simple if you do a good job developing your goals and objectives. There may be some cases, however, where you cannot measure the information need directly because data are too difficult, too expensive, or culturally inappropriate to acquire. In these cases, you will need to develop a proxy indicator. For example, if you needed to have an idea of how large a turtle population was, you might use # of turtle nesting sites as a proxy indicator, rather than try to count individual turtles. Sometimes, you may find that you need more than one indicator to adequately measure something. Our Marine Reserve project team, for example, used three indicators to measure their progress towards Goal 1. To illustrate this further, let us say you want to measure the health of a particular jaguar population. To measure this, you might count the number of
jaguars, under the assumption that the more jaguars there are, the better the health of the population. You, however, may realize that this is not enough information to tell you if the population is healthy. You might also want to look at reproductive success and count the number of jaguar cubs born and surviving to adulthood. You might also want to monitor other behavioral characteristics that would indicate whether a
population is doing well. You should be cautious, however, that all your indicators measure the phenomenon you need to measure and that you are not adding indicators unnecessarily. d) Use the Criteria for a Good Indicator to
Review and If Necessary, Revise Your Indicators.
At this point, you should determine whether the indicators you have selected comply with the criteria for a good indicator (see Box 25). For instance, with respect to the first indicator for Goal 1 above (% live coral coverage), the team should ask themselves:
Is it measurable? Yes, you could
Tip! Remember, you should use neutral wording when phrasing your indicators. They should not reflect a trend you hope to see but should instead only detail what you are trying to measure. For example, if you have a forest target, your indicator might be: # hectares of forest cover. It would not be: # of hectares of forest cover increased; or 500 hectares of forest cover.
Tip! Remember, you want to keep monitoring manageable yet useful and relevant.
Box 25. Criteria for a Good Indicator
Indicators should meet the following criteria:
Measurable – Able to be recorded and
analyzed in quantitative and qualitative terms
Precise - Defined the same way by all people
Consistent – Not changing over time so that
it always measures the same thing
Sensitive – Changes proportionately in
response to the actual changes in the
condition being measured
In addition, the best indicators will be technically
and financially feasible and of interest to partners,
donors, and other stakeholders.
Conceptualizing and Planning Conservation Projects and Programs 111
© Foundations of Success 2009
measure the area of live coral coverage relative to the entire Marine Reserve to come up with a percentage of coverage.
Is it precise? Yes, the meaning should be clear to everyone.
Is it consistent? Yes, the meaning would not change over time.
Is it sensitive? Yes, the indicator directly measures extent of live coral coverage. As another example, let us say that you are trying to measure household wealth and you decide to use the number of cattle a family owns as a proxy indicator for household wealth. Applying the criteria again:
Is it measurable? Yes, you could count the number of cows a family owns.
Is it precise? Yes, the meaning should be clear to everyone.
Is it consistent? Yes, the meaning would not change over time – unless consumer demand varied, and there was no longer a market for beef so people would not be likely to invest in cattle.
Is it sensitive? Yes, to a certain degree – the more cattle a family owns, the wealthier they are likely to be. At some point, however, the relationship tapers off, and the difference between a family that owns 500 heads of cattle and one that owns 525 heads of cattle is much less significant than the difference between a family that owns 3 heads of cattle and one that owns 28. Likewise, at some point, how many cattle a family owns will be limited by how much land they have. Thus, one would need to be careful in interpreting the data associated with this indicator.
After going through the criteria with each indicator, you should revise, as appropriate, any indicator that does not comply with all the criteria for a good indicator. e) Prioritize Based on Cost and Benefit Consider the level of effort you will use to monitor your goals and objectives. You may need to prioritize your options if you want a realistic monitoring plan. If you do have to make choices, think about the cost and benefit of monitoring each possible indicator, taking into consideration the following issues:
The monitoring of goals and objectives is essential. The majority of your monitoring investment should go toward that. If your resources are very limited, you might need to monitor only your goals and objectives.
In addition to the objectives along your results chains, consider the extent to which you will be able to measure other key results. In the interest of keeping monitoring manageable, you should not try to measure all points along your results chains.
External factors that could influence the degree to which you can be successful with your project, even if it is well-implemented and has a sound theory of change.
These issues and possibly others relevant to the context of your project will help guide the prioritization of your monitoring efforts. Although you could use a ranking system or other
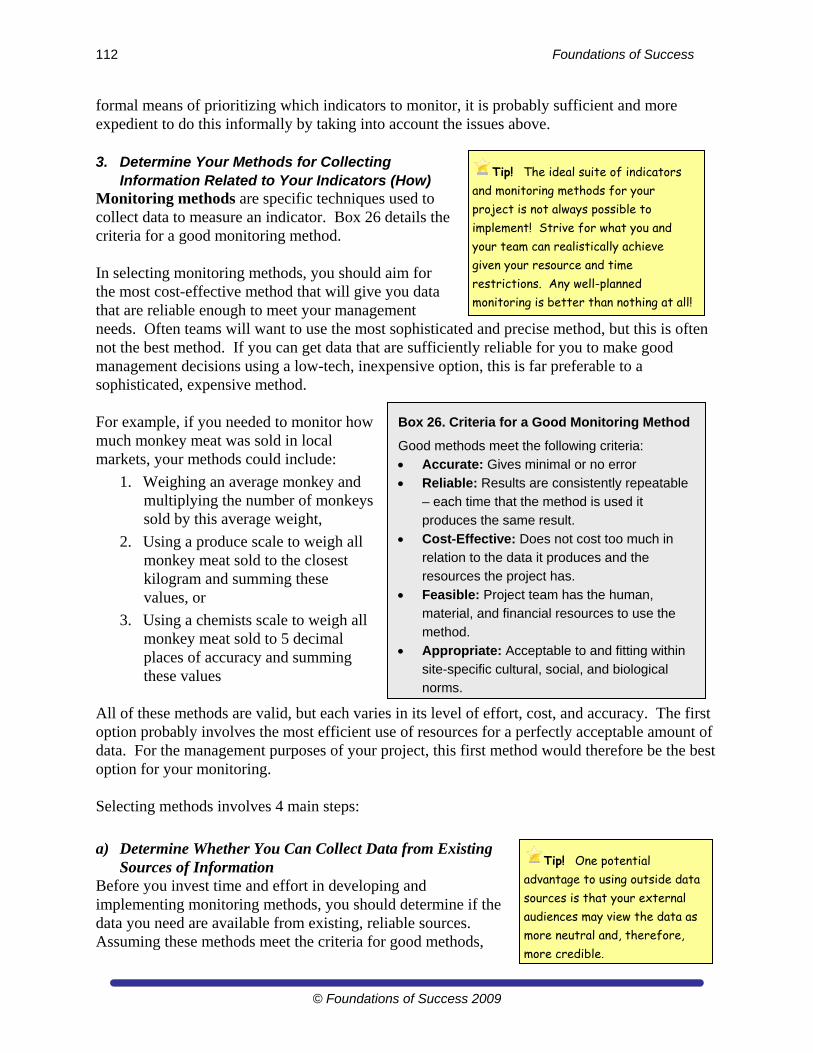
112 Foundations of Success
© Foundations of Success 2009
formal means of prioritizing which indicators to monitor, it is probably sufficient and more expedient to do this informally by taking into account the issues above. 3. Determine Your Methods for Collecting
Information Related to Your Indicators (How) Monitoring methods are specific techniques used to collect data to measure an indicator. Box 26 details the criteria for a good monitoring method. In selecting monitoring methods, you should aim for the most cost-effective method that will give you data that are reliable enough to meet your management needs. Often teams will want to use the most sophisticated and precise method, but this is often not the best method. If you can get data that are sufficiently reliable for you to make good management decisions using a low-tech, inexpensive option, this is far preferable to a sophisticated, expensive method. For example, if you needed to monitor how much monkey meat was sold in local markets, your methods could include:
1. Weighing an average monkey and multiplying the number of monkeys sold by this average weight,
2. Using a produce scale to weigh all monkey meat sold to the closest kilogram and summing these values, or
3. Using a chemists scale to weigh all monkey meat sold to 5 decimal places of accuracy and summing these values
All of these methods are valid, but each varies in its level of effort, cost, and accuracy. The first option probably involves the most efficient use of resources for a perfectly acceptable amount of data. For the management purposes of your project, this first method would therefore be the best option for your monitoring. Selecting methods involves 4 main steps:
a) Determine Whether You Can Collect Data from Existing Sources of Information
Before you invest time and effort in developing and implementing monitoring methods, you should determine if the data you need are available from existing, reliable sources. Assuming these methods meet the criteria for good methods,
Box 26. Criteria for a Good Monitoring Method
Good methods meet the following criteria:
Accurate: Gives minimal or no error
Reliable: Results are consistently repeatable
– each time that the method is used it
produces the same result.
Cost-Effective: Does not cost too much in
relation to the data it produces and the
resources the project has.
Feasible: Project team has the human,
material, and financial resources to use the
method.
Appropriate: Acceptable to and fitting within
site-specific cultural, social, and biological
norms.
Tip! One potential advantage to using outside data sources is that your external audiences may view the data as more neutral and, therefore, more credible.
Tip! The ideal suite of indicators and monitoring methods for your project is not always possible to implement! Strive for what you and your team can realistically achieve given your resource and time restrictions. Any well-planned monitoring is better than nothing at all!
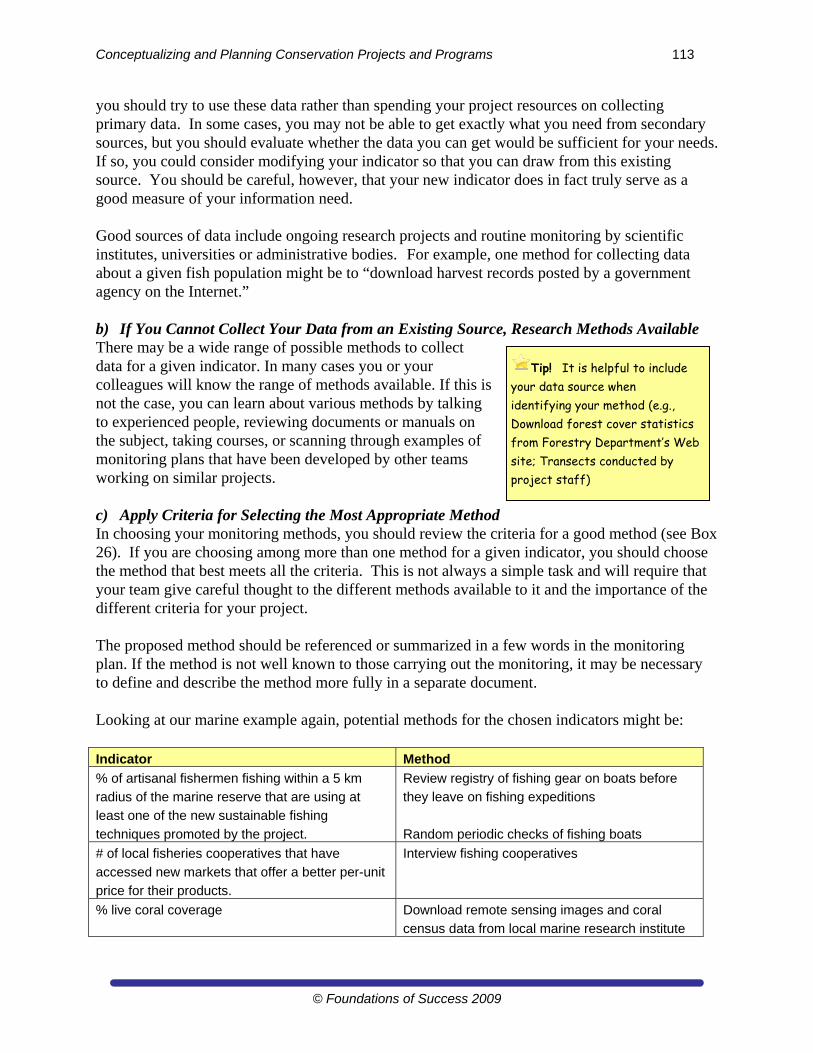
Conceptualizing and Planning Conservation Projects and Programs 113
© Foundations of Success 2009
you should try to use these data rather than spending your project resources on collecting primary data. In some cases, you may not be able to get exactly what you need from secondary sources, but you should evaluate whether the data you can get would be sufficient for your needs. If so, you could consider modifying your indicator so that you can draw from this existing source. You should be careful, however, that your new indicator does in fact truly serve as a good measure of your information need. Good sources of data include ongoing research projects and routine monitoring by scientific institutes, universities or administrative bodies. For example, one method for collecting data about a given fish population might be to “download harvest records posted by a government agency on the Internet.” b) If You Cannot Collect Your Data from an Existing Source, Research Methods Available There may be a wide range of possible methods to collect data for a given indicator. In many cases you or your colleagues will know the range of methods available. If this is not the case, you can learn about various methods by talking to experienced people, reviewing documents or manuals on the subject, taking courses, or scanning through examples of monitoring plans that have been developed by other teams working on similar projects. c) Apply Criteria for Selecting the Most Appropriate Method In choosing your monitoring methods, you should review the criteria for a good method (see Box 26). If you are choosing among more than one method for a given indicator, you should choose the method that best meets all the criteria. This is not always a simple task and will require that your team give careful thought to the different methods available to it and the importance of the different criteria for your project. The proposed method should be referenced or summarized in a few words in the monitoring plan. If the method is not well known to those carrying out the monitoring, it may be necessary to define and describe the method more fully in a separate document. Looking at our marine example again, potential methods for the chosen indicators might be: Indicator Method
% of artisanal fishermen fishing within a 5 km
radius of the marine reserve that are using at
least one of the new sustainable fishing
techniques promoted by the project.
Review registry of fishing gear on boats before
they leave on fishing expeditions
Random periodic checks of fishing boats
# of local fisheries cooperatives that have
accessed new markets that offer a better per-unit
price for their products.
Interview fishing cooperatives
% live coral coverage Download remote sensing images and coral
census data from local marine research institute
Tip! It is helpful to include your data source when identifying your method (e.g., Download forest cover statistics from Forestry Department’s Web site; Transects conducted by project staff)
114 Foundations of Success
© Foundations of Success 2009
If you review each of the methods above, you will see that they meet the criteria for good methods, although typically, there will be some trade-offs in terms of how well they meet each criteria. For example, it may be cost-effective to check the registry of fishing gear on boats involved in the project before they leave on fishing expeditions, but the accuracy of this method might not be as high as hiring someone to visit the boats during fishing hours to make sure they are using only the alternative fishing techniques. The latter option, however, would be much more expensive. In this case, the team also chose to do random checks, which are less expensive but might help them determine if their first indicator is suitable. In choosing a method, your project team needs to consider what is acceptable for each criterion you consider. d) Determine Whether You Need an Additional Method As with indicators, you may determine that you want to measure something using more than one method. This may be because you are not very confident in any of the methods available to you, but you feel confident that if two or more methods give you similar results, you can accept and adequately interpret the results. In evaluation lingo, this is known as methods triangulation. The random checks of fishing boats discussed above are an example of this tactic. As another example, you may be interested in knowing how much timber is being harvested from a forest. You could check the records of timber companies or the government forestry agency, but you are not sure how accurate these will be. So, you might also estimate how many logs fit on a truck and then calculate the average number of trucks that leave the area per week. This will help you determine how reliable your methods are. If they consistently give you the same information, you might consider eventually eliminating the more difficult or costly method. 4. Specify responsibilities and timeframes (where and who) In addition to your indicators and methods, your monitoring plan should include other information that is important for those implementing it. At a minimum, it should include information about where the data will come from (i.e., the data source), when it will be collected, and who will be collecting it. Your monitoring methods, indicators, and related goal, objective, or result should be documented in a table like the one shown in the Example of a Monitoring Plan section below (Table 10). The remainder of this section describes only the minimum amount of information required in a monitoring plan table. a) Specify When (Timeframe & Frequency of Data Collection) You should define the dates when baseline and final data will be collected for each indicator. In many cases you will want to collect data more frequently than this (e.g. quarterly or annually throughout the duration of your project). In deciding when and how often you should collect data, consider the following factors:
Time period to effect change. If you realistically cannot expect to see a change in a factor for five years after the start of the project, then your next measurement after the baseline measurement should probably be no earlier than five years (unless you need to monitor it for the influence of other variables).
Tip! If you are unsatisfied with the accuracy of a monitoring method, try adding a second method for the same indicator. By comparing the data from two methods, you can assess, or triangulate each method.
Conceptualizing and Planning Conservation Projects and Programs 115
© Foundations of Success 2009
Natural variability of the phenomenon to be monitored. If what you are monitoring varies naturally, you should have enough data points taken at appropriate timeframes so that your data are not influenced by natural variations that have nothing to do with project-related impacts. For example, if you are collecting data influenced by climatic changes, you should clearly note if the measurement time coincides with an El Niño year and how that might affect your results. You may also want to vary the number of collection times around the El Niño event to compensate for this effect.
Seasonality issues in terms of data availability and variation. You may need to always monitor at the same time of year, or alternatively, at various points of the year to be able to factor in seasonal changes. For example, if you are monitoring water levels, they will vary widely depending upon whether you take them at the beginning of the wet season versus during or at the end of the wet season. In most cases, it would not make sense to compare water levels taken at the end of the dry season one year with those taken at the end of the wet season the following year.
Project life cycle. This is a more practical concern. You should keep in mind if you have key project reviews, planning, reports, or other project-related events on the horizon and adjust your monitoring times to meet those needs if it will not substantially affect the outcome of your monitoring.
b) Specify Who (Individuals Responsible for Data Collection) Monitoring can require extensive resources, especially commitments of project team members’ time. It is important to ensure that the appropriate person(s) with the right skills are designated to handle these functions. While multiple staff may be responsible for collecting and recording data, it is often important to have a single driving force and “owner” of the overall monitoring process. You should state the name of the individual or the organization responsible for measuring each indicator and the name of the person in the project team responsible for getting the information (when this is not the same person). Again, the details for how your monitoring will happen should be recorded in table format. You can use Table 10 below as a template for your project’s monitoring plan.
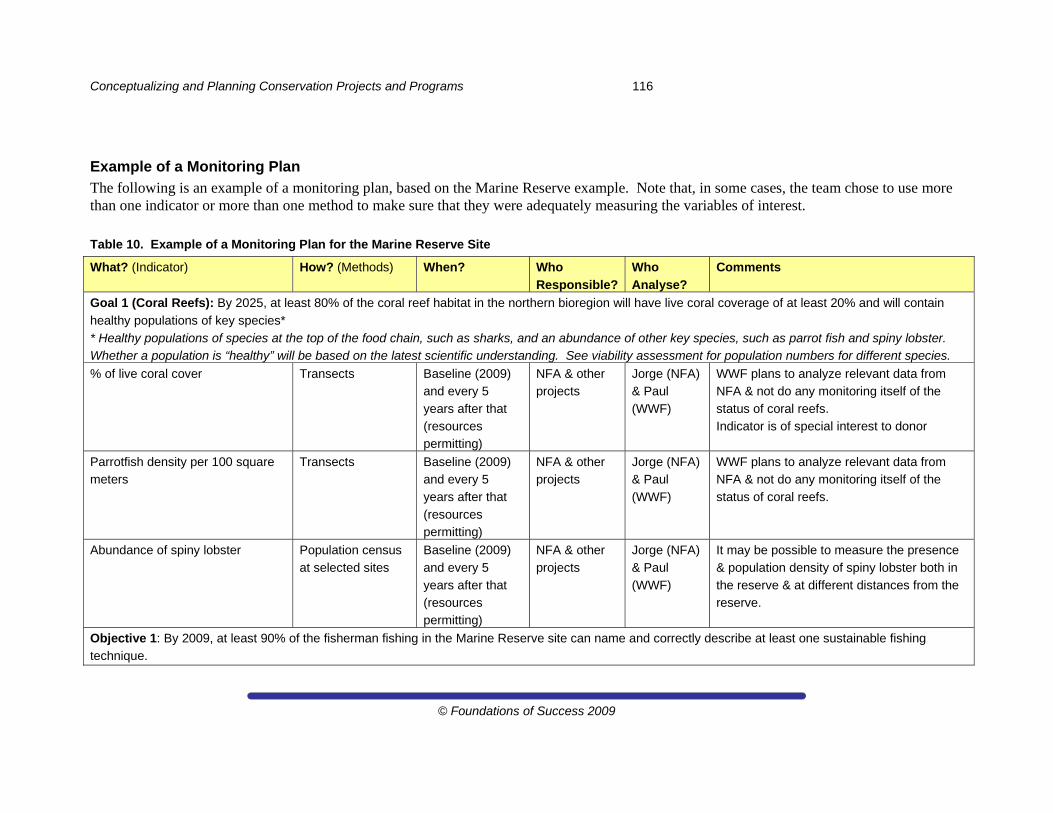
Conceptualizing and Planning Conservation Projects and Programs 116
© Foundations of Success 2009
Example of a Monitoring Plan
The following is an example of a monitoring plan, based on the Marine Reserve example. Note that, in some cases, the team chose to use more than one indicator or more than one method to make sure that they were adequately measuring the variables of interest.
Table 10. Example of a Monitoring Plan for the Marine Reserve Site
What? (Indicator) How? (Methods) When? Who
Responsible?
Who
Analyse?
Comments
Goal 1 (Coral Reefs): By 2025, at least 80% of the coral reef habitat in the northern bioregion will have live coral coverage of at least 20% and will contain
healthy populations of key species*
* Healthy populations of species at the top of the food chain, such as sharks, and an abundance of other key species, such as parrot fish and spiny lobster. Whether a population is “healthy” will be based on the latest scientific understanding. See viability assessment for population numbers for different species.
% of live coral cover Transects Baseline (2009) and every 5
years after that (resources permitting)
NFA & other projects
Jorge (NFA) & Paul
(WWF)
WWF plans to analyze relevant data from NFA & not do any monitoring itself of the
status of coral reefs. Indicator is of special interest to donor
Parrotfish density per 100 square meters
Transects Baseline (2009) and every 5
years after that
(resources permitting)
NFA & other projects
Jorge (NFA) & Paul
(WWF)
WWF plans to analyze relevant data from NFA & not do any monitoring itself of the
status of coral reefs.
Abundance of spiny lobster
Population census
at selected sites
Baseline (2009)
and every 5
years after that (resources permitting)
NFA & other
projects
Jorge (NFA)
& Paul
(WWF)
It may be possible to measure the presence
& population density of spiny lobster both in
the reserve & at different distances from the reserve.
Objective 1: By 2009, at least 90% of the fisherman fishing in the Marine Reserve site can name and correctly describe at least one sustainable fishing
technique.
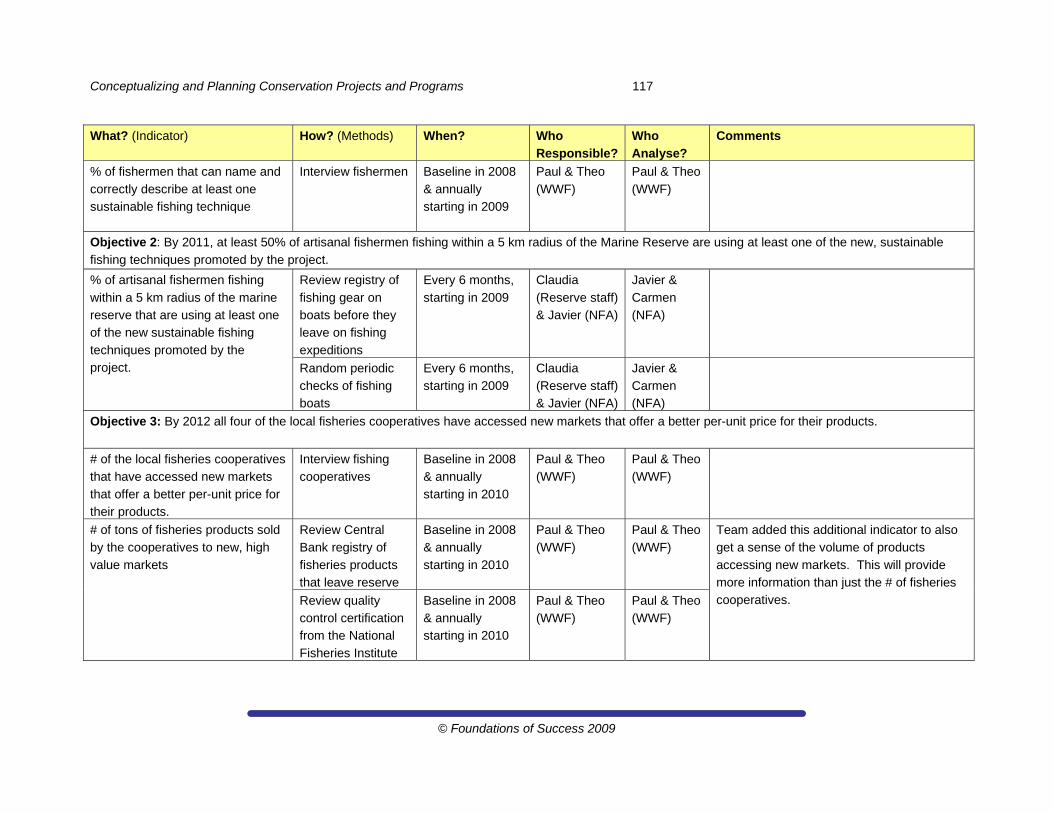
Conceptualizing and Planning Conservation Projects and Programs 117
© Foundations of Success 2009
What? (Indicator) How? (Methods) When? Who
Responsible?
Who
Analyse?
Comments
% of fishermen that can name and
correctly describe at least one sustainable fishing technique
Interview fishermen Baseline in 2008
& annually starting in 2009
Paul & Theo
(WWF)
Paul & Theo
(WWF)
Objective 2: By 2011, at least 50% of artisanal fishermen fishing within a 5 km radius of the Marine Reserve are using at least one of the new, sustainable
fishing techniques promoted by the project.
% of artisanal fishermen fishing
within a 5 km radius of the marine reserve that are using at least one of the new sustainable fishing
techniques promoted by the project.
Review registry of
fishing gear on boats before they leave on fishing
expeditions
Every 6 months,
starting in 2009
Claudia
(Reserve staff) & Javier (NFA)
Javier &
Carmen (NFA)
Random periodic
checks of fishing boats
Every 6 months,
starting in 2009
Claudia
(Reserve staff) & Javier (NFA)
Javier &
Carmen (NFA)
Objective 3: By 2012 all four of the local fisheries cooperatives have accessed new markets that offer a better per-unit price for their products.
# of the local fisheries cooperatives
that have accessed new markets
that offer a better per-unit price for their products.
Interview fishing
cooperatives
Baseline in 2008
& annually
starting in 2010
Paul & Theo
(WWF)
Paul & Theo
(WWF)
# of tons of fisheries products sold
by the cooperatives to new, high
value markets
Review Central
Bank registry of
fisheries products that leave reserve
Baseline in 2008
& annually
starting in 2010
Paul & Theo
(WWF)
Paul & Theo
(WWF)
Team added this additional indicator to also
get a sense of the volume of products
accessing new markets. This will provide more information than just the # of fisheries cooperatives. Review quality
control certification from the National
Fisheries Institute
Baseline in 2008 & annually starting in 2010
Paul & Theo (WWF)
Paul & Theo (WWF)
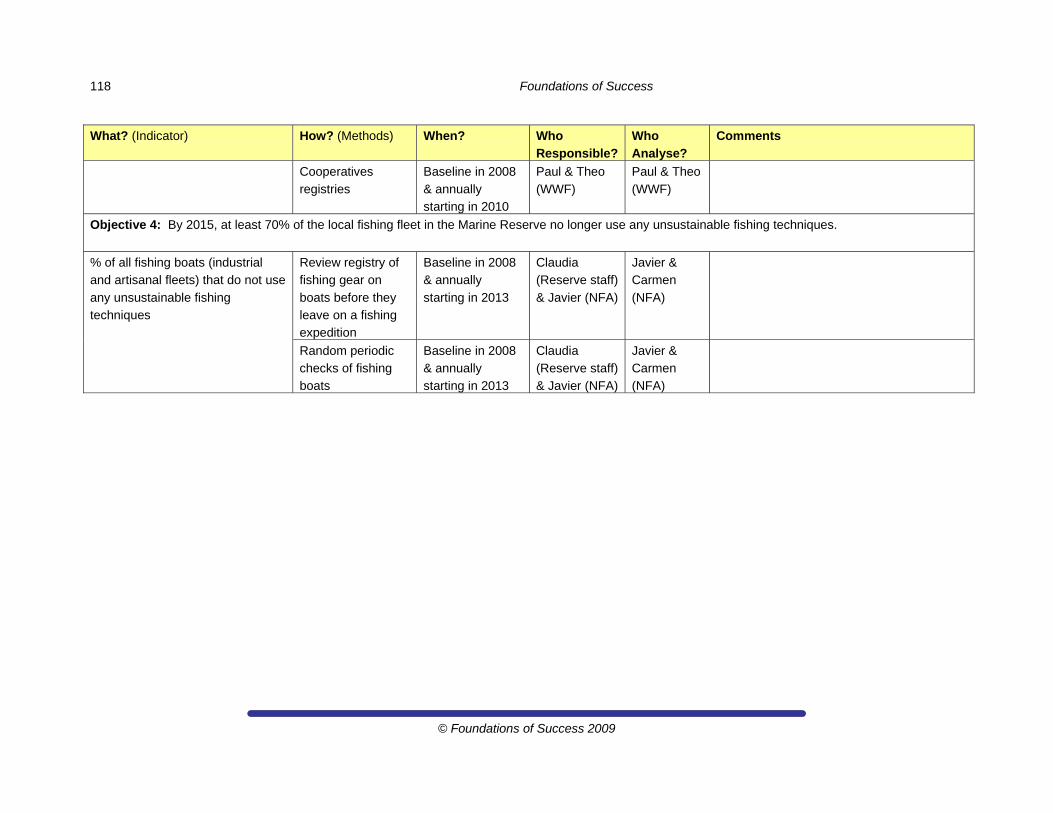
118 Foundations of Success
© Foundations of Success 2009
What? (Indicator) How? (Methods) When? Who
Responsible?
Who
Analyse?
Comments
Cooperatives
registries
Baseline in 2008
& annually starting in 2010
Paul & Theo
(WWF)
Paul & Theo
(WWF)
Objective 4: By 2015, at least 70% of the local fishing fleet in the Marine Reserve no longer use any unsustainable fishing techniques.
% of all fishing boats (industrial and artisanal fleets) that do not use
any unsustainable fishing techniques
Review registry of fishing gear on
boats before they leave on a fishing expedition
Baseline in 2008 & annually
starting in 2013
Claudia (Reserve staff)
& Javier (NFA)
Javier & Carmen
(NFA)
Random periodic checks of fishing
boats
Baseline in 2008 & annually
starting in 2013
Claudia (Reserve staff)
& Javier (NFA)
Javier & Carmen
(NFA)
Conceptualizing and Planning Conservation Projects and Programs 119
© Foundations of Success 2009
Assignment 12 – Define Audiences and Indicators, Develop Draft Monitoring Plan, and Complete a Course Evaluation
Part 1: Define Audience and Information Needs for Monitoring For your project, define your audience and information needs by following these steps:
1. Make a list of your audiences, starting with your project team 2. Identify other potential audiences 3. Identify the general information needs for each of your key audiences
Record your analysis of audiences and information needs in a table like the one provided in Table 9.
Part 2: Define Indicators and Monitoring Methods for a Goal and an Objective Refer to your audience and information needs table and results chain to help you identify
where you need to develop indicators – especially those related to the goals and objectives you have defined.
Choose at least one goal and one objective. For each, define at least one indicator, using the following steps:
1. Define your indicators 2. Review your criteria for a good indicator and make sure your indicators comply 3. Modify your draft indicator as needed to make sure it complies with the criteria 4. Determine whether you need an additional indicator
For each goal and objective, also develop methods: 1. Determine whether you can collect data from existing sources of information 2. If you cannot collect your data from an existing source, research methods available 3. Apply criteria for selecting the most appropriate method 4. Determine whether you need an additional method
Record your indicators and methods in your monitoring plan. Use the format in Table 10 to organize your information. Optional: You can record some of this information in Miradi, however these functions are not fully developed in version 2.2.
Complete a Course Evaluation Congratulations!! You have now finished Step 2 of the Open Standards. We would like to ask you to take a few minutes to fill out an official evaluation form – to be used for general module evaluation improvement. You can fill out this form anonymously, especially if this will help you more comfortably provide us with honest feedback – both positive and critical. This is an ongoing course that we update and improve every time we give it, so please help us to practice the adaptive management process and learn from what we do. Your facilitator will provide you with an evaluation form in advance of this assignment.
Hand in your assignment (Word document + mpz file) as Assignment 12.
Hand in your evaluation form.

Conceptualizing and Planning Conservation Projects and Programs A-1
Appendix A. Glossary and Criteria21
The majority of terms in this glossary comes directly from the glossary in the Conservation Measures Partnership’s Open Standards for the Practice of Conservation (Version 2.0). CMP members carefully selected and defined the technical terms in this glossary. These definitions are based on current usage by many CMP members, other conservation organizations, and planners in other disciplines. We have added to the glossary only in cases where the training manual introduces new terms. These new terms and their definitions are shown in italics.
Action Plan – A description of a project’s goals, objectives, and strategies that will be undertaken to abate identified threats and make use of opportunities.
Activity – A specific action or set of tasks undertaken by project staff and/or partners to reach one or more objectives. Sometimes called an action, intervention, response, or strategic action. (See relationship to strategies below.)
Adaptive Management – The incorporation of a formal learning process into conservation action. Specifically, it is the integration of project design, management, and monitoring, to provide a framework to systematically test assumptions, promote learning, and supply timely information for management decisions.
Assumption – A project’s core assumptions are the logical sequences linking project strategies to one or more targets as reflected in a results chain diagram. Other assumptions are related to factors that can positively or negatively affect project performance – see also risk factor.
Audit – An assessment of a project or program in relation to an external set of criteria such as generally accepted accounting principles, sustainable harvest principles, or the standards outlined in this document. Compare to evaluation.
Biodiversity Target – A synonym for conservation target.
Community of Practice – A group of practitioners who share a concern, a set of problems, or a passion about a topic, and who deepen their knowledge and expertise in this area by interacting on an ongoing basis.
Conceptual Model – A diagram that represents relationships between key factors that are believed to impact or lead to one or more conservation targets. A good model should link the conservation targets to threats, opportunities, stakeholders, and intervention points (factors – threats, opportunities, or targets – in a conceptual model where a team can develop strategies that will influence those factors. It should also indicate which factors are most important to monitor.
Conservation Target – An element of biodiversity at a project site, which can be a species, habitat/ecological system, or ecological process that a project has chosen to focus on. All targets at a site should collectively represent the biodiversity of concern at the site. Synonymous with biodiversity target.
21 Underlined terms are defined elsewhere in the glossary.
A-2 Appendix A
Critical Threat – Direct threats that have been prioritized as being the most important to address.
Direct Threat – A human action that immediately degrades one or more conservation targets. For example, “logging” or “fishing.” Typically tied to one or more stakeholders. Sometimes referred to as a “pressure” or “source of stress.” Compare with indirect threat.
Enabling Condition – A broad or high-level opportunity within a situation analysis. For example, the legal or policy framework within a country.
Evaluation – An assessment of a project or program in relation to its own previously stated goals and objectives. See monitoring and compare to audit.
Factor – A generic term for an element of a conceptual model including direct and indirect threats, opportunities, and associated stakeholders. It is often advantageous to use this generic term since many factors – for example tourism – could be both a threat and an opportunity.
Goal – A formal statement detailing a desired impact of a project, such as the desired future status of a target. A good goal meets the criteria of being linked to targets, impact oriented, measurable, time limited, and specific.
Indicator – A measurable entity related to a specific information need such as the status of a target/factor, change in a threat, or progress toward an objective. A good indicator meets the criteria of being: measurable, precise, consistent, and sensitive.
Indirect Threat – A factor identified in an analysis of the project situation that is a driver of direct threats. Often an entry point for conservation actions. For example, “logging policies” or “demand for fish.” Sometimes called a root cause or underlying cause. Compare with direct threat.
Information Need – Something that a project team and/or other people must know about a project. The basis for designing a monitoring plan.
Intermediate Result – A specific benchmark or milestone that a project is working to achieve en route to accomplishing a final goal or objective (in this case, “intermediate” typically refers to a temporal dimension).
Key Intervention Point – A factor in your conceptual model where you could develop a strategy to ultimately improve the conservation status of one or more targets.
Learning Questions – Questions that define what you want to learn based on the implementation of your project. Learning questions drive the identification of information needs, and thus, your monitoring plan.
Logical Framework – Often abbreviated as logframe. A matrix that results from a logical framework analysis that is used to display a project’s goals, objectives, and indicators in tabular form, showing the logic of the project.
Conceptualizing and Planning Conservation Projects and Programs A-3
Monitoring – The periodic collection and evaluation of data relative to stated project goals and objectives. (Many people often also refer to this process as monitoring and evaluation (abbreviated M&E)).
Monitoring Plan – The plan for monitoring your project. It includes information needs, indicators, and methods, spatial scale and locations, timeframe, and roles and responsibilities for collecting data.
Method – A specific technique used to collect data to measure an indicator. A good method should meet the criteria of accurate, reliable, cost-effective, feasible, and appropriate.
Objective – A formal statement detailing a desired outcome of a project such as reducing a critical threat. A good objective meets the criteria of being: results oriented, measurable, time limited, specific, and practical. If the project is well conceptualized and designed, realization of a project’s objectives should lead to the fulfilment of the project’s goals and ultimately its vision. Compare to vision and goal.
Operational Plan – A plan that includes analyses of: funding required; human capacity and skills and other non-financial resources required; risk assessment and mitigation; and estimate of project lifespan and exit strategy.
Opportunity – A factor identified in an analysis of the project situation that potentially has a positive effect on one or more targets, either directly or indirectly. Often an entry point for conservation actions. For example, “demand for sustainably harvested timber.” In some senses, the opposite of a threat.
Practitioners – All people involved in designing, managing, and monitoring conservation projects and programs.
Program – A group of projects which together aim to achieve a common broad vision. In the interest of simplicity, this document uses the term “project” to represent both projects and programs since these standards of practice are designed to apply equally well to both.
Project – A set of actions undertaken by a defined group of practitioners – including managers, researchers, community members, or other stakeholders – to achieve defined goals and objectives. The basic unit of conservation work. Compare with program.
Project Area – The place where the biodiversity of interest to the project is located. It can include one or more “conservation areas” or “areas of biodiversity significance” as identified through ecoregional assessments. Note that in some cases, project actions may take place outside of the defined project area.
Project Team – A specific core group of practitioners who are responsible for designing, implementing, and monitoring a project. This group can include managers, stakeholders, researchers, operations staff and other key implementers.
Result – The desired future state of a target or factor. Results include impacts which are linked to targets and outcomes which are linked to threats and opportunities.
A-4 Appendix A
Results Chain – A graphical depiction of a project’s core assumption, the logical sequence linking project strategies to one or more targets. In scientific terms, it lays out hypothesized relationships.
Risk Factor – A condition under which the project is expected to function, but which can cause problems for the project. Often, a condition over which the project has no direct control. Killer risks are those that when not overcome, will completely stop the project from achieving its goals and objectives.
Scope – The broad geographic or thematic focus of a project.
Stakeholder – Any individual, group, or institution that has a vested interest in the natural resources of the project area and/or that potentially will be affected by project activities and have something to gain or lose if conditions change or stay the same. Stakeholders are all those who need to be considered in achieving project goals and whose participation and support are crucial to its success.
Strategic Plan – The overall plan for a project. A complete strategic plan includes descriptions of a project’s scope, vision, and targets; an analysis of project situation, an Action Plan, a Monitoring Plan, and an Operational Plan.
Strategy – A group of actions with a common focus that work together to reduce threats, capitalize on opportunities, or restore natural systems. Strategies include one or more activities and are designed to achieve specific objectives and goals. A good strategy meets the criteria of being: linked, focused, feasible, and appropriate.
Target – Shorthand for biodiversity/conservation target.
Task – A specific action in a work plan required to implement activities, a Monitoring Plan, or other components of a Strategic Plan.
Threat – A human activity that directly or indirectly degrades one or more targets. Typically tied to one or more stakeholders. See also direct threat and indirect threat.
Vision – A description of the desired state or ultimate condition that a project is working to achieve. A complete vision can include a description of the biodiversity of the site and/or a map of the project area as well as a summary vision statement.
Vision Statement – A brief summary of the project’s vision. A good vision statement meets the criteria of being relatively general, visionary, and brief.
Work plan – A short-term schedule for implementing an action, monitoring, or operational plan. Work plans typically list tasks required, who will be responsible for each task, when each task will need to be undertaken, and how much money and other resources will be required.
Conceptualizing and Planning Conservation Projects and Programs A-5
Criteria for Key Terms
Vision Statement: A general statement of the desired state or ultimate condition that a project is working to achieve.
Relatively General Broadly defined to encompass all project activities Visionary Inspirational in outlining the desired change in the state of the targets toward which
the project is working Brief Simple and succinct so that that all project participants can remember it
Goal: A formal statement detailing a desired impact of a project such as the desired future status of a target.
Linked to Targets Directly associated with one or more of your conservation targets Impact Oriented Represents the desired future status of the conservation target over the long-
term Measurable Definable in relation to some standard scale (numbers, percentage, fractions, or
all/nothing states) Time Limited Achievable within a specific period of time, generally 10 or more years Specific Clearly defined so that all people involved in the project have the same understanding
of what the terms in the goal mean Objective: A formal statement detailing a desired outcome of a project.
Results Oriented Represents necessary changes in critical threat and opportunity factors that affect one or more conservation targets or project goals
Measurable Definable in relation to some standard scale (numbers, percentage, fractions, or all/nothing states)
Time Limited Achievable within a specific period of time, generally 3-10 years Specific Clearly defined so that all people involved in the project have the same understanding
of what the terms in the objective mean Practical Achievable and appropriate within the context of the project site, and in light of the
political, social and financial context Strategy: A group of actions with a common focus that work together to reduce threats, capitalize on opportunities, or restore natural systems. Strategies include one or more activities and are designed to achieve specific objectives and goals.
Linked – Directly affects one or more critical factors Focused Outlines specific courses of action that need to be carried out Feasible – Accomplishable in light of the project’s resources and constraints Appropriate – Acceptable to and fitting within site-specific cultural, social, and biological norms
Indicator: A measurable entity related to a specific information need such as the status of a target, change in a threat, or progress toward an objective.
Measurable – Able to be recorded and analyzed in quantitative and qualitative terms Precise Defined the same way by all people Consistent – Not changing over time so that it always measures the same thing
A-6 Appendix A
Sensitive – Changes proportionately in response to the actual changes in the condition being measured
Method: A specific technique used to collect data to measure an indicator.
Accurate: Gives minimal or no error Reliable: Results are consistently repeatable – each time that the method is used it produces the
same result. Cost-Effective: Does not cost too much in relation to the data it produces and the resources the
project has. Feasible: Project team has the human, material, and financial resources to use the method. Appropriate: Acceptable to and fitting within site-specific cultural, social, and biological norms.
Note: We have slightly modified the wording of CMP’s criteria for Methods, in particular to clarify the feasible criterion.
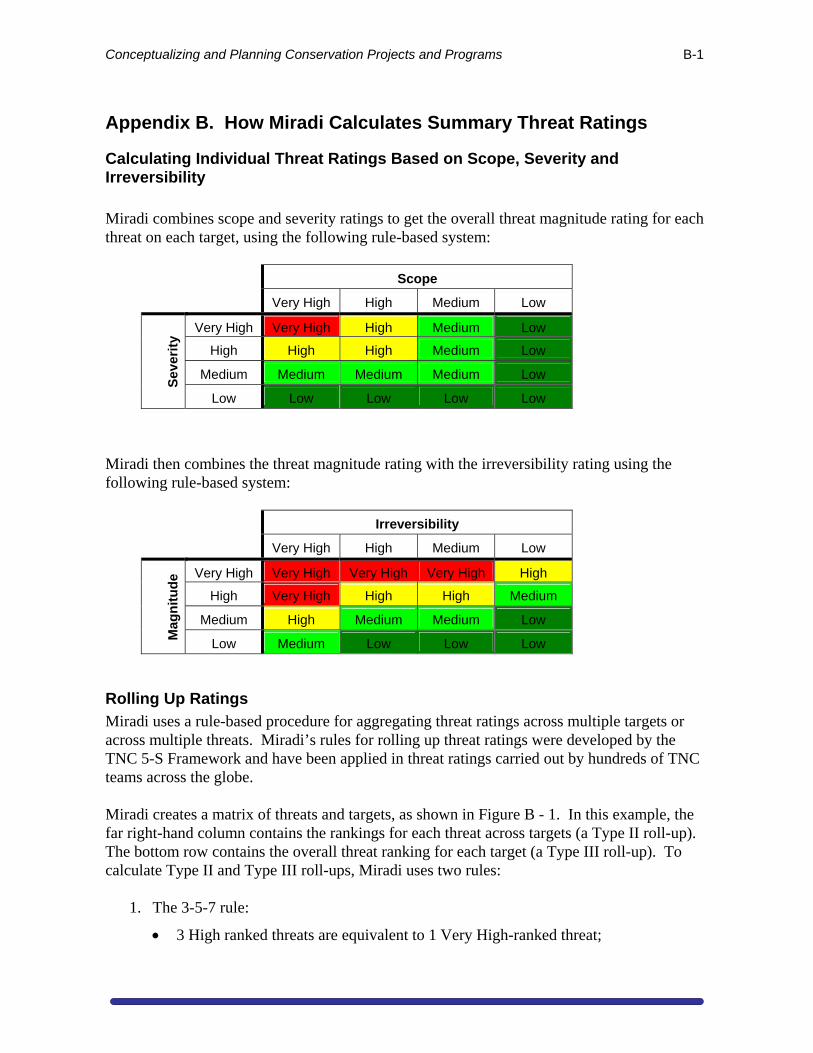
Conceptualizing and Planning Conservation Projects and Programs B-1
Appendix B. How Miradi Calculates Summary Threat Ratings
Calculating Individual Threat Ratings Based on Scope, Severity and Irreversibility
Miradi combines scope and severity ratings to get the overall threat magnitude rating for each threat on each target, using the following rule-based system:
Scope
Very High High Medium Low
Sev
erit
y
Very High Very High High Medium Low
High High High Medium Low
Medium Medium Medium Medium Low
Low Low Low Low Low
Miradi then combines the threat magnitude rating with the irreversibility rating using the following rule-based system:
Irreversibility
Very High High Medium Low
Mag
nit
ud
e Very High Very High Very High Very High High
High Very High High High Medium
Medium High Medium Medium Low
Low Medium Low Low Low
Rolling Up Ratings
Miradi uses a rule-based procedure for aggregating threat ratings across multiple targets or across multiple threats. Miradi’s rules for rolling up threat ratings were developed by the TNC 5-S Framework and have been applied in threat ratings carried out by hundreds of TNC teams across the globe. Miradi creates a matrix of threats and targets, as shown in Figure B - 1. In this example, the far right-hand column contains the rankings for each threat across targets (a Type II roll-up). The bottom row contains the overall threat ranking for each target (a Type III roll-up). To calculate Type II and Type III roll-ups, Miradi uses two rules:
1. The 3-5-7 rule:
3 High ranked threats are equivalent to 1 Very High-ranked threat;
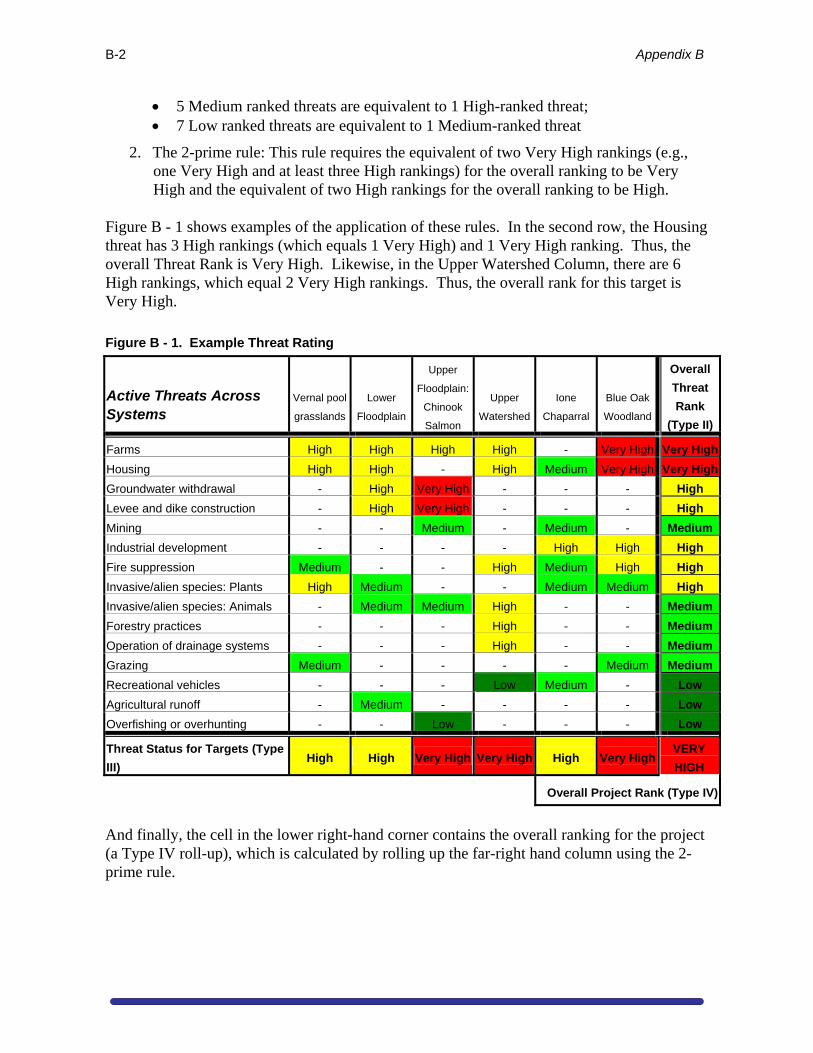
B-2 Appendix B
5 Medium ranked threats are equivalent to 1 High-ranked threat; 7 Low ranked threats are equivalent to 1 Medium-ranked threat
2. The 2-prime rule: This rule requires the equivalent of two Very High rankings (e.g., one Very High and at least three High rankings) for the overall ranking to be Very High and the equivalent of two High rankings for the overall ranking to be High.
Figure B - 1 shows examples of the application of these rules. In the second row, the Housing threat has 3 High rankings (which equals 1 Very High) and 1 Very High ranking. Thus, the overall Threat Rank is Very High. Likewise, in the Upper Watershed Column, there are 6 High rankings, which equal 2 Very High rankings. Thus, the overall rank for this target is Very High.
Figure B - 1. Example Threat Rating
Active Threats Across Systems
Vernal pool
grasslands
Lower
Floodplain
Upper
Floodplain:
Chinook
Salmon
Upper
Watershed
Ione
Chaparral
Blue Oak
Woodland
Overall
Threat
Rank
(Type II)
Farms High High High High - Very High Very High
Housing High High - High Medium Very High Very High
Groundwater withdrawal - High Very High - - - High
Levee and dike construction - High Very High - - - High
Mining - - Medium - Medium - Medium
Industrial development - - - - High High High
Fire suppression Medium - - High Medium High High
Invasive/alien species: Plants High Medium - - Medium Medium High
Invasive/alien species: Animals - Medium Medium High - - Medium
Forestry practices - - - High - - Medium
Operation of drainage systems - - - High - - Medium
Grazing Medium - - - - Medium Medium
Recreational vehicles - - - Low Medium - Low
Agricultural runoff - Medium - - - - Low
Overfishing or overhunting - - Low - - - Low
Threat Status for Targets (Type
III) High High Very High Very High High Very High
VERY
HIGH
Overall Project Rank (Type IV)
And finally, the cell in the lower right-hand corner contains the overall ranking for the project (a Type IV roll-up), which is calculated by rolling up the far-right hand column using the 2-prime rule.
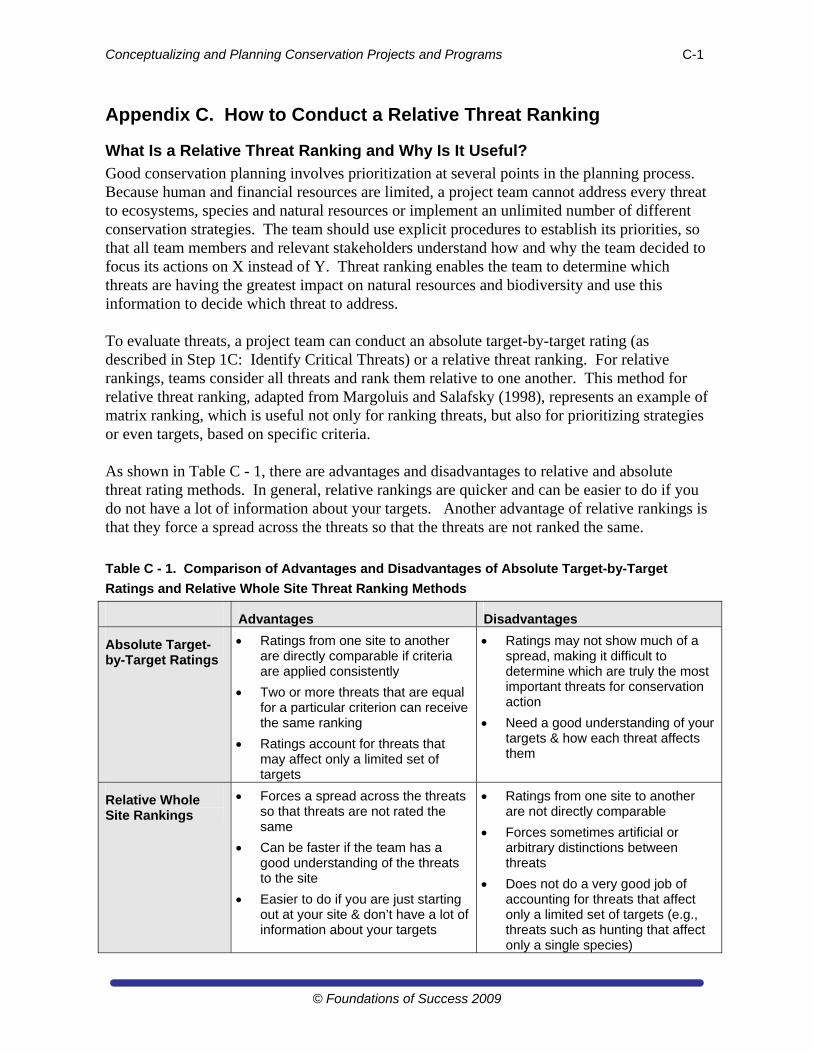
Conceptualizing and Planning Conservation Projects and Programs C-1
© Foundations of Success 2009
Appendix C. How to Conduct a Relative Threat Ranking
What Is a Relative Threat Ranking and Why Is It Useful?
Good conservation planning involves prioritization at several points in the planning process. Because human and financial resources are limited, a project team cannot address every threat to ecosystems, species and natural resources or implement an unlimited number of different conservation strategies. The team should use explicit procedures to establish its priorities, so that all team members and relevant stakeholders understand how and why the team decided to focus its actions on X instead of Y. Threat ranking enables the team to determine which threats are having the greatest impact on natural resources and biodiversity and use this information to decide which threat to address. To evaluate threats, a project team can conduct an absolute target-by-target rating (as described in Step 1C: Identify Critical Threats) or a relative threat ranking. For relative rankings, teams consider all threats and rank them relative to one another. This method for relative threat ranking, adapted from Margoluis and Salafsky (1998), represents an example of matrix ranking, which is useful not only for ranking threats, but also for prioritizing strategies or even targets, based on specific criteria. As shown in Table C - 1, there are advantages and disadvantages to relative and absolute threat rating methods. In general, relative rankings are quicker and can be easier to do if you do not have a lot of information about your targets. Another advantage of relative rankings is that they force a spread across the threats so that the threats are not ranked the same.
Table C - 1. Comparison of Advantages and Disadvantages of Absolute Target-by-Target
Ratings and Relative Whole Site Threat Ranking Methods
Advantages Disadvantages
Absolute Target-by-Target Ratings
Ratings from one site to another are directly comparable if criteria are applied consistently
Two or more threats that are equal for a particular criterion can receive the same ranking
Ratings account for threats that may affect only a limited set of targets
Ratings may not show much of a spread, making it difficult to determine which are truly the most important threats for conservation action
Need a good understanding of your targets & how each threat affects them
Relative Whole Site Rankings
Forces a spread across the threats so that threats are not rated the same
Can be faster if the team has a good understanding of the threats to the site
Easier to do if you are just starting out at your site & don’t have a lot of information about your targets
Ratings from one site to another are not directly comparable
Forces sometimes artificial or arbitrary distinctions between threats
Does not do a very good job of accounting for threats that affect only a limited set of targets (e.g., threats such as hunting that affect only a single species)
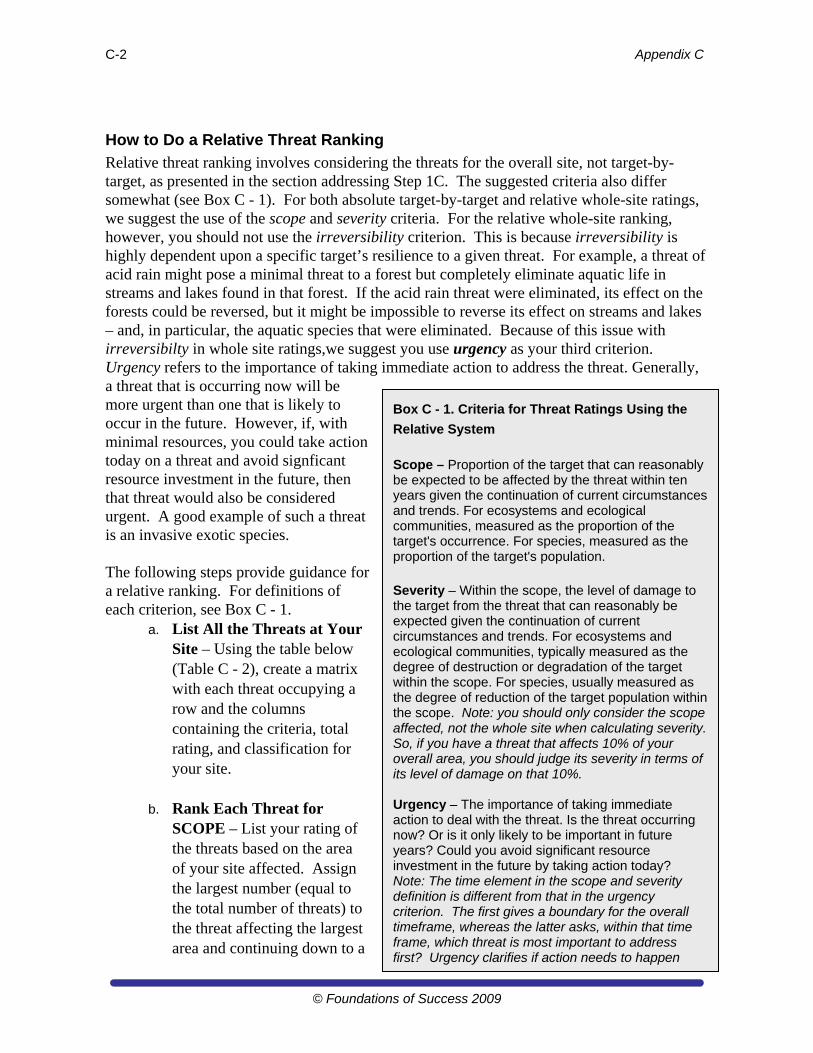
C-2 Appendix C
© Foundations of Success 2009
How to Do a Relative Threat Ranking
Relative threat ranking involves considering the threats for the overall site, not target-by-target, as presented in the section addressing Step 1C. The suggested criteria also differ somewhat (see Box C - 1). For both absolute target-by-target and relative whole-site ratings, we suggest the use of the scope and severity criteria. For the relative whole-site ranking, however, you should not use the irreversibility criterion. This is because irreversibility is highly dependent upon a specific target’s resilience to a given threat. For example, a threat of acid rain might pose a minimal threat to a forest but completely eliminate aquatic life in streams and lakes found in that forest. If the acid rain threat were eliminated, its effect on the forests could be reversed, but it might be impossible to reverse its effect on streams and lakes – and, in particular, the aquatic species that were eliminated. Because of this issue with irreversibilty in whole site ratings,we suggest you use urgency as your third criterion. Urgency refers to the importance of taking immediate action to address the threat. Generally, a threat that is occurring now will be more urgent than one that is likely to occur in the future. However, if, with minimal resources, you could take action today on a threat and avoid signficant resource investment in the future, then that threat would also be considered urgent. A good example of such a threat is an invasive exotic species. The following steps provide guidance for a relative ranking. For definitions of each criterion, see Box C - 1.
a. List All the Threats at Your Site – Using the table below (Table C - 2), create a matrix with each threat occupying a row and the columns containing the criteria, total rating, and classification for your site.
b. Rank Each Threat for SCOPE – List your rating of the threats based on the area of your site affected. Assign the largest number (equal to the total number of threats) to the threat affecting the largest area and continuing down to a
Box C - 1. Criteria for Threat Ratings Using the
Relative System
Scope – Proportion of the target that can reasonably be expected to be affected by the threat within ten years given the continuation of current circumstances and trends. For ecosystems and ecological communities, measured as the proportion of the target's occurrence. For species, measured as the proportion of the target's population. Severity – Within the scope, the level of damage to the target from the threat that can reasonably be expected given the continuation of current circumstances and trends. For ecosystems and ecological communities, typically measured as the degree of destruction or degradation of the target within the scope. For species, usually measured as the degree of reduction of the target population within the scope. Note: you should only consider the scope affected, not the whole site when calculating severity. So, if you have a threat that affects 10% of your overall area, you should judge its severity in terms of its level of damage on that 10%. Urgency – The importance of taking immediate action to deal with the threat. Is the threat occurring now? Or is it only likely to be important in future years? Could you avoid significant resource investment in the future by taking action today? Note: The time element in the scope and severity definition is different from that in the urgency criterion. The first gives a boundary for the overall timeframe, whereas the latter asks, within that time frame, which threat is most important to address first? Urgency clarifies if action needs to happen
Conceptualizing and Planning Conservation Projects and Programs C-3
© Foundations of Success 2009
rank of 1 for the threat that affects the smallest area. For example, if you have 6 threats, the threat affecting the greatest scope would receive a 6, while that affecting the least scope would receive a 1. Add up the total of the rating numbers and record that total at the bottom of the column (Note: As a check on your calculations, this total should be the same for scope, severity, and irreversibility).
Table C - 2. Relative Threat Rating Template
DIRECT THREAT SCOPE SEVERITY URGENCY TOTAL CLASSIFICATION
0
0
0
0
0
0
0
0
0
TOTAL 0 0 0
c. Rank Each Threat for SEVERITY – In the next column, headed SEVERITY,
assign ratings to the threats based on the impact or severity of destruction to the area or scope affected, again with the largest number (equal to the total number of threats) assigned to the threat of greatest severity and continuing down to a rank of 1 for the least severe threat. To avoid confusing scope and severity, where possible we recommend comparing the severity of threats within a uniform area (e.g., a hectare of clearcutting vs. a hectare of firewood collection). Add up the total of the rating numbers and record that total at the bottom of the column.
d. Rank Each Threat for URGENCY – In the column headed URGENCY, list the
rank ordering you established for the threats, with the largest number (equal to the total number of threats) assigned to the threat for which you need to take immediate action to reduce it. Continue down to a rank of 1 for the threat that you can wait longer to address. Add up the total of the rating numbers and record that total at the bottom of the column. Before proceeding to the next step, be sure that the three criteria column totals add up to the same number, and, if not, correct the numbers.
e. Sum Up Your Ratings –Scope and severity, taken together, give you a sense of the
magnitude of the threat. As such, they are the most important criteria for ratings. For this reason, we recommend double-weighting them. This will also help avoid
C-4 Appendix C
© Foundations of Success 2009
situations where a threat that affects only a very small portion of the site but has High severity (e.g., infrastructure) receives an unduly high overall rating. To get a total threat score, for each threat, double its scope and severity scores and add them to its urgency score. Enter the total number in the table (The worksheet in Table C - 2 will do this automatically if you can open it in Excel).
f. Classify Your Threats – Although it may be tempting to evaluate your threats
based solely on the numbers, it is better to classify them into categories of Very High, High, Medium, and Low. These categories are more appropriate, given the somewhat imprecise and subjective nature of the rating process. For example, the difference between a threat with 12 points and one with 10 points is likely not significant, but the difference between one with 12 points and one with 5 is significant. You should use this classification for both the threats and the site overall. Determining a threat’s importance for the overall site will help you determine its effect on your site as a whole and whether you should devote a lot of project resources to trying to minimize it.
The following is an example of a threat rating applied at the level of the whole site and using a relative ranking method. This is based on a real-world rating done by a project team working in a tropical forest site. Three criteria (scope, severity, and urgency) are used to evaluate nine direct threats.
Table C - 3. Example of a Relative Whole-Site Threat Rating
DIRECT THREAT SCOPE SEVERITY URGENCY TOTAL CLASSIFICATION
Agricultural encroachment 7 8 9 24 Very High
Commercial fishing 1 2 1 4 Low
Freshwater turtle and turtle eggs over-harvesting
3 7 4 14 Medium
Hunting 8 4 7 19 High
Illegal Logging 6 5 8 19 High
Mining 2 9 5 16 Medium
Paiche (Invasive fish species) 4 6 6 16 Medium
Palm exploitation 5 3 2 10 Low
Unsustainable Brazil nut management
9 1 3 13 Medium
TOTAL 45 45 45
Conceptualizing and Planning Conservation Projects and Programs D-1
Appendix D. WWF Wetlands Teaching Example
The following example is adapted from WWF Australia’s Wetland Watch project. Two WWF Australia staff members, Christina Mykytiuk and Richard McLellan, participated in the 2006 pilot run of the WWF Online Campus’s training module on the first two steps of the WWF Standards for Conservation Project and Programme Management. Christina Mykytiuk and Richard McLellan have graciously permitted the use and adaptation of their material for training purposes. In the following pages, we provide example outputs from the Wetland Watch project that we have modified slightly to reflect the structure and products of the CMP Open Standards.22 The intent is to give another real-world example of how the Standards have been applied, not to explain each product in detail. If you want more in-depth information about a particular step, please refer back to the relevant section of this manual. Also note that the example is meant to be illustrative and does not include every product that would result from a full strategic planning process.
Brief Project Description
This example has been adapted from the Wetland Watch project in Southwestern Australia. Although the products that follow have been adapted and do not fully match the actual Swan Coastal Plain context, we still include here a brief project description of the true project to orient the reader. The Wetland Watch project is being implemented on the Swan Coastal Plain – where it has been estimated that 80% of wetlands have been cleared, filled, drained or otherwise destroyed since European settlement. Only 15% are considered to retain high conservation values. Urban encroachment, residential development, incompatible landuse practices, industry, agriculture, drainage, pollution, runoff, weed invasion and climate change continue to have significant impact on the majority of wetlands that remain. It has been estimated that if the current rate of loss continues, almost all of these remaining wetlands are likely to be lost in 10-20 years. Another significant threat to the wetlands is a lack of awareness on the part of landowners and the general community of the presence of many seasonal wetland types and of the high biodiversity value of these systems. Due to their seasonal nature many wetlands, particularly damplands and palusplains, are not commonly recognised as wetlands and consequently are not valued or managed for conservation. It is in fact due to their seasonality that these systems contain such high plant species diversity and are so biologically valuable. The wetlands are an integral part of the Swan Coastal Plain, and without immediate action to achieve their protection, will remain under direct threat from human disturbance.
22 WWF is a member of the Conservation Measures Partnership. The WWF Standards build directly off of the CMP Open Standards, with some minor adaptations for WWF’s institutional context.
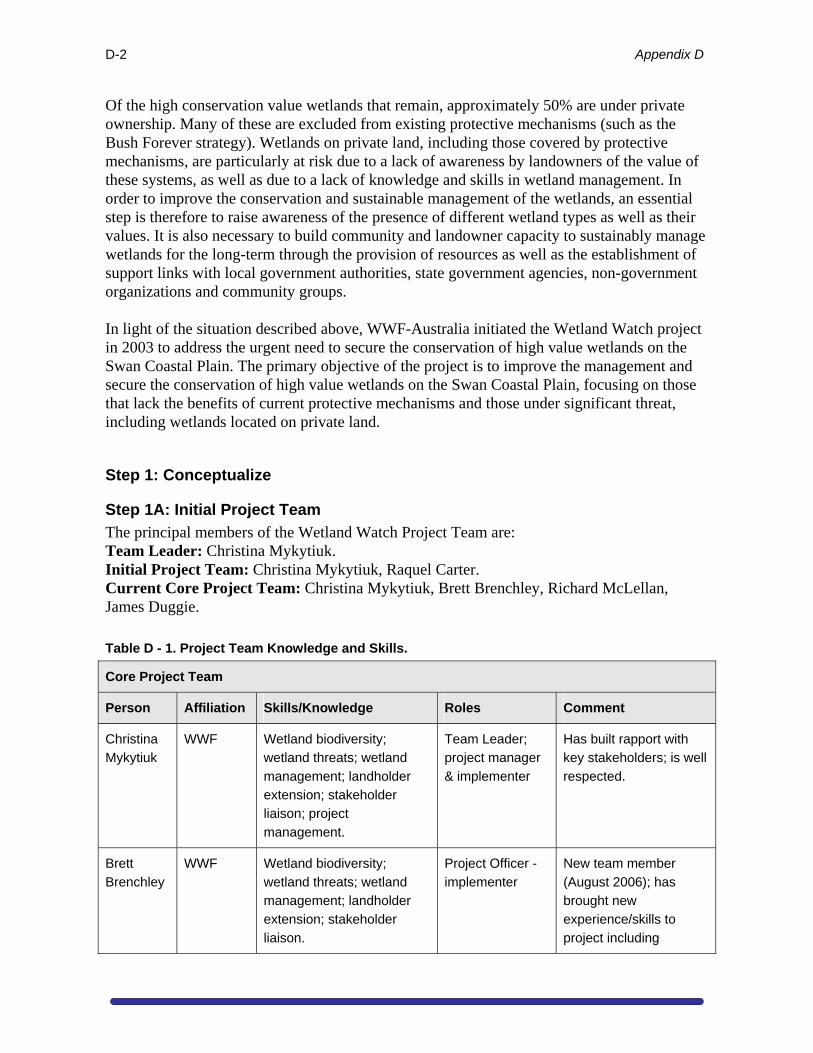
D-2 Appendix D
Of the high conservation value wetlands that remain, approximately 50% are under private ownership. Many of these are excluded from existing protective mechanisms (such as the Bush Forever strategy). Wetlands on private land, including those covered by protective mechanisms, are particularly at risk due to a lack of awareness by landowners of the value of these systems, as well as due to a lack of knowledge and skills in wetland management. In order to improve the conservation and sustainable management of the wetlands, an essential step is therefore to raise awareness of the presence of different wetland types as well as their values. It is also necessary to build community and landowner capacity to sustainably manage wetlands for the long-term through the provision of resources as well as the establishment of support links with local government authorities, state government agencies, non-government organizations and community groups. In light of the situation described above, WWF-Australia initiated the Wetland Watch project in 2003 to address the urgent need to secure the conservation of high value wetlands on the Swan Coastal Plain. The primary objective of the project is to improve the management and secure the conservation of high value wetlands on the Swan Coastal Plain, focusing on those that lack the benefits of current protective mechanisms and those under significant threat, including wetlands located on private land.
Step 1: Conceptualize
Step 1A: Initial Project Team
The principal members of the Wetland Watch Project Team are: Team Leader: Christina Mykytiuk. Initial Project Team: Christina Mykytiuk, Raquel Carter. Current Core Project Team: Christina Mykytiuk, Brett Brenchley, Richard McLellan, James Duggie.
Table D - 1. Project Team Knowledge and Skills.
Core Project Team
Person Affiliation Skills/Knowledge Roles Comment
Christina
Mykytiuk
WWF Wetland biodiversity;
wetland threats; wetland
management; landholder
extension; stakeholder
liaison; project
management.
Team Leader;
project manager
& implementer
Has built rapport with
key stakeholders; is well
respected.
Brett
Brenchley
WWF Wetland biodiversity;
wetland threats; wetland
management; landholder
extension; stakeholder
liaison.
Project Officer -
implementer
New team member
(August 2006); has
brought new
experience/skills to
project including
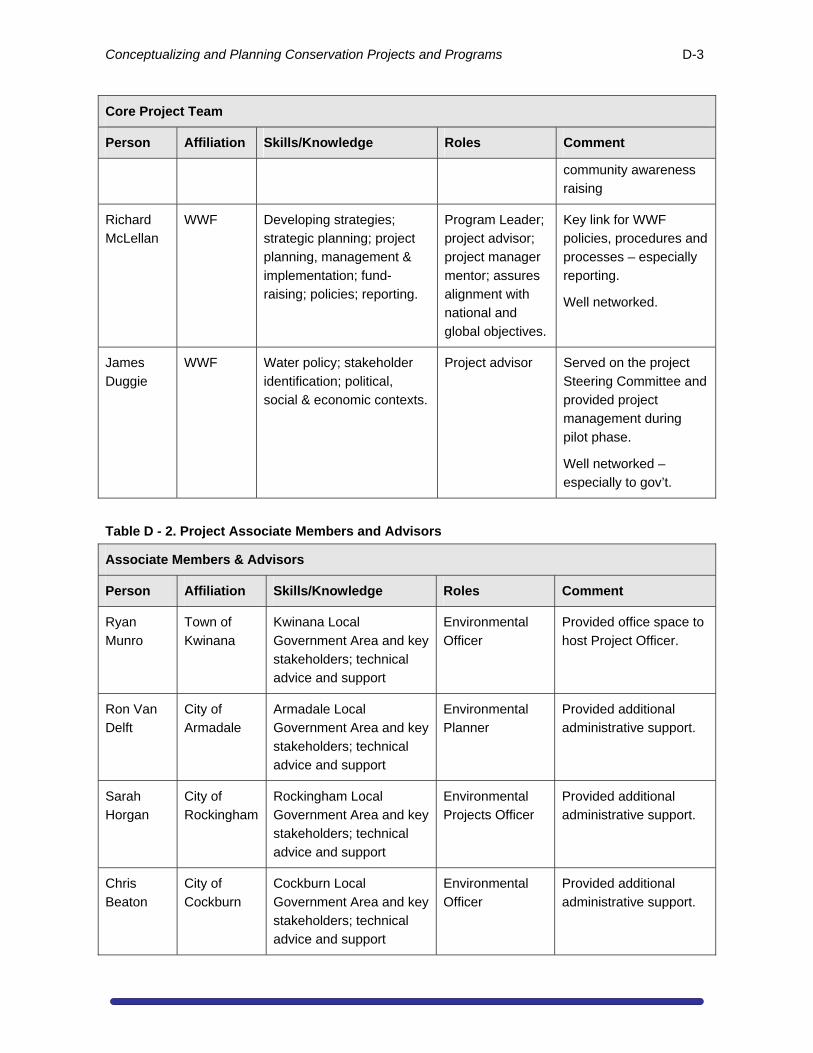
Conceptualizing and Planning Conservation Projects and Programs D-3
Core Project Team
Person Affiliation Skills/Knowledge Roles Comment
community awareness
raising
Richard
McLellan
WWF Developing strategies;
strategic planning; project
planning, management &
implementation; fund-
raising; policies; reporting.
Program Leader;
project advisor;
project manager
mentor; assures
alignment with
national and
global objectives.
Key link for WWF
policies, procedures and
processes – especially
reporting.
Well networked.
James
Duggie
WWF Water policy; stakeholder
identification; political,
social & economic contexts.
Project advisor Served on the project
Steering Committee and
provided project
management during
pilot phase.
Well networked –
especially to gov’t.
Table D - 2. Project Associate Members and Advisors
Associate Members & Advisors
Person Affiliation Skills/Knowledge Roles Comment
Ryan
Munro
Town of
Kwinana
Kwinana Local
Government Area and key
stakeholders; technical
advice and support
Environmental
Officer
Provided office space to
host Project Officer.
Ron Van
Delft
City of
Armadale
Armadale Local
Government Area and key
stakeholders; technical
advice and support
Environmental
Planner
Provided additional
administrative support.
Sarah
Horgan
City of
Rockingham
Rockingham Local
Government Area and key
stakeholders; technical
advice and support
Environmental
Projects Officer
Provided additional
administrative support.
Chris
Beaton
City of
Cockburn
Cockburn Local
Government Area and key
stakeholders; technical
advice and support
Environmental
Officer
Provided additional
administrative support.
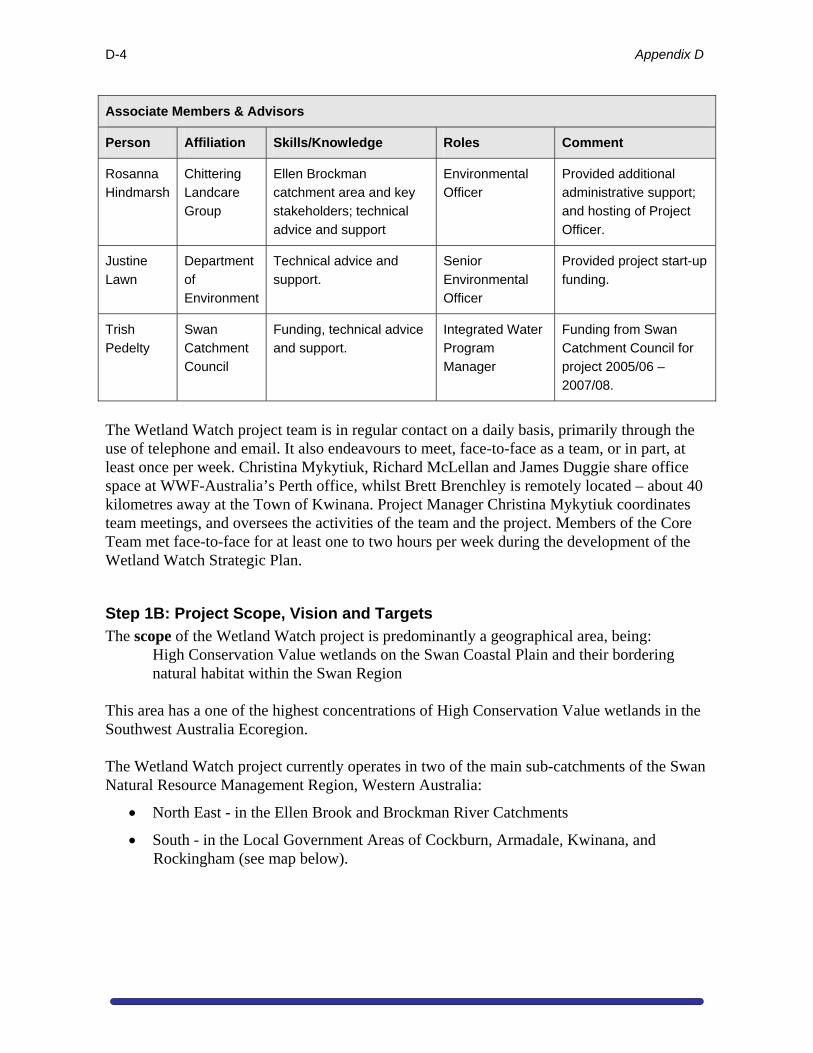
D-4 Appendix D
Associate Members & Advisors
Person Affiliation Skills/Knowledge Roles Comment
Rosanna
Hindmarsh
Chittering
Landcare
Group
Ellen Brockman
catchment area and key
stakeholders; technical
advice and support
Environmental
Officer
Provided additional
administrative support;
and hosting of Project
Officer.
Justine
Lawn
Department
of
Environment
Technical advice and
support.
Senior
Environmental
Officer
Provided project start-up
funding.
Trish
Pedelty
Swan
Catchment
Council
Funding, technical advice
and support.
Integrated Water
Program
Manager
Funding from Swan
Catchment Council for
project 2005/06 –
2007/08.
The Wetland Watch project team is in regular contact on a daily basis, primarily through the use of telephone and email. It also endeavours to meet, face-to-face as a team, or in part, at least once per week. Christina Mykytiuk, Richard McLellan and James Duggie share office space at WWF-Australia’s Perth office, whilst Brett Brenchley is remotely located – about 40 kilometres away at the Town of Kwinana. Project Manager Christina Mykytiuk coordinates team meetings, and oversees the activities of the team and the project. Members of the Core Team met face-to-face for at least one to two hours per week during the development of the Wetland Watch Strategic Plan.
Step 1B: Project Scope, Vision and Targets
The scope of the Wetland Watch project is predominantly a geographical area, being: High Conservation Value wetlands on the Swan Coastal Plain and their bordering natural habitat within the Swan Region
This area has a one of the highest concentrations of High Conservation Value wetlands in the Southwest Australia Ecoregion. The Wetland Watch project currently operates in two of the main sub-catchments of the Swan Natural Resource Management Region, Western Australia:
North East - in the Ellen Brook and Brockman River Catchments
South - in the Local Government Areas of Cockburn, Armadale, Kwinana, and Rockingham (see map below).
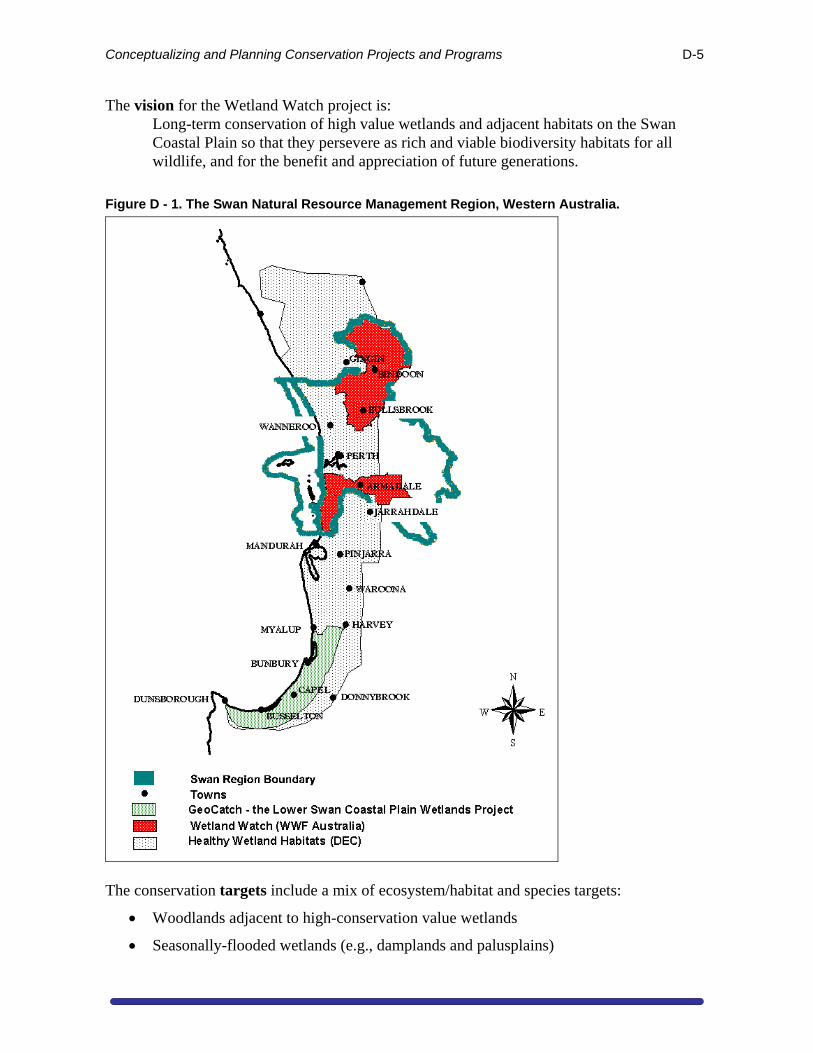
Conceptualizing and Planning Conservation Projects and Programs D-5
The vision for the Wetland Watch project is: Long-term conservation of high value wetlands and adjacent habitats on the Swan Coastal Plain so that they persevere as rich and viable biodiversity habitats for all wildlife, and for the benefit and appreciation of future generations.
Figure D - 1. The Swan Natural Resource Management Region, Western Australia.
The conservation targets include a mix of ecosystem/habitat and species targets:
Woodlands adjacent to high-conservation value wetlands
Seasonally-flooded wetlands (e.g., damplands and palusplains)
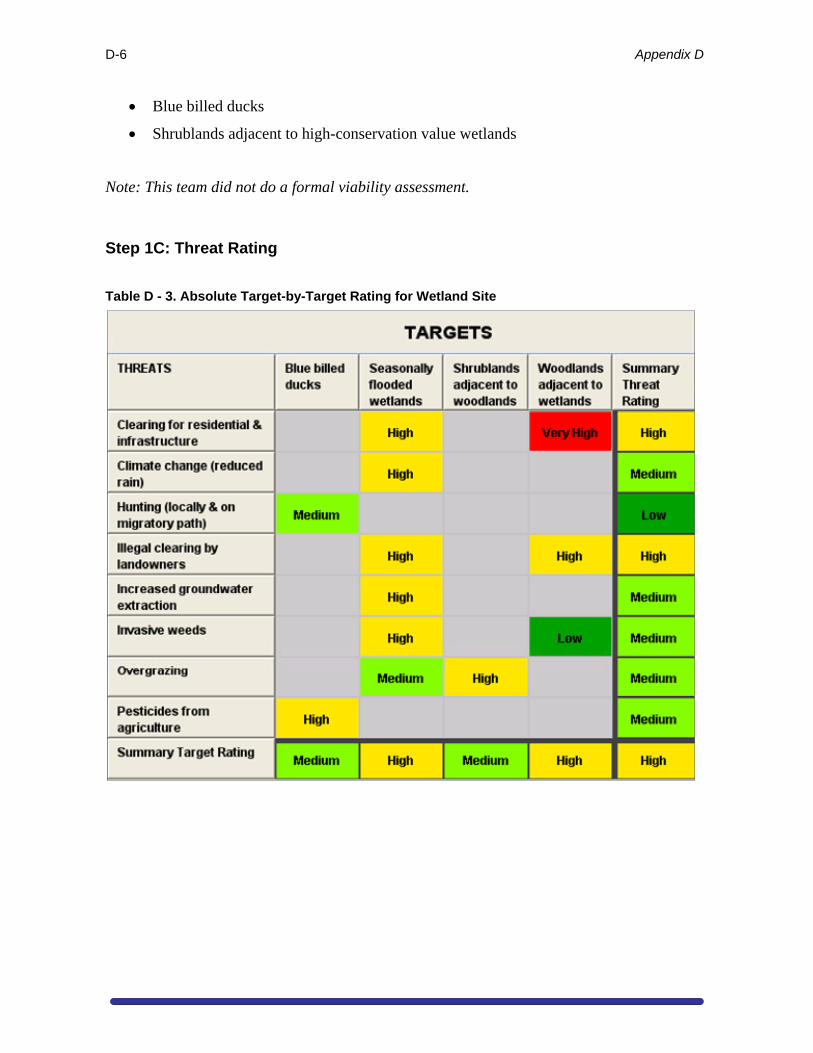
D-6 Appendix D
Blue billed ducks
Shrublands adjacent to high-conservation value wetlands
Note: This team did not do a formal viability assessment.
Step 1C: Threat Rating
Table D - 3. Absolute Target-by-Target Rating for Wetland Site
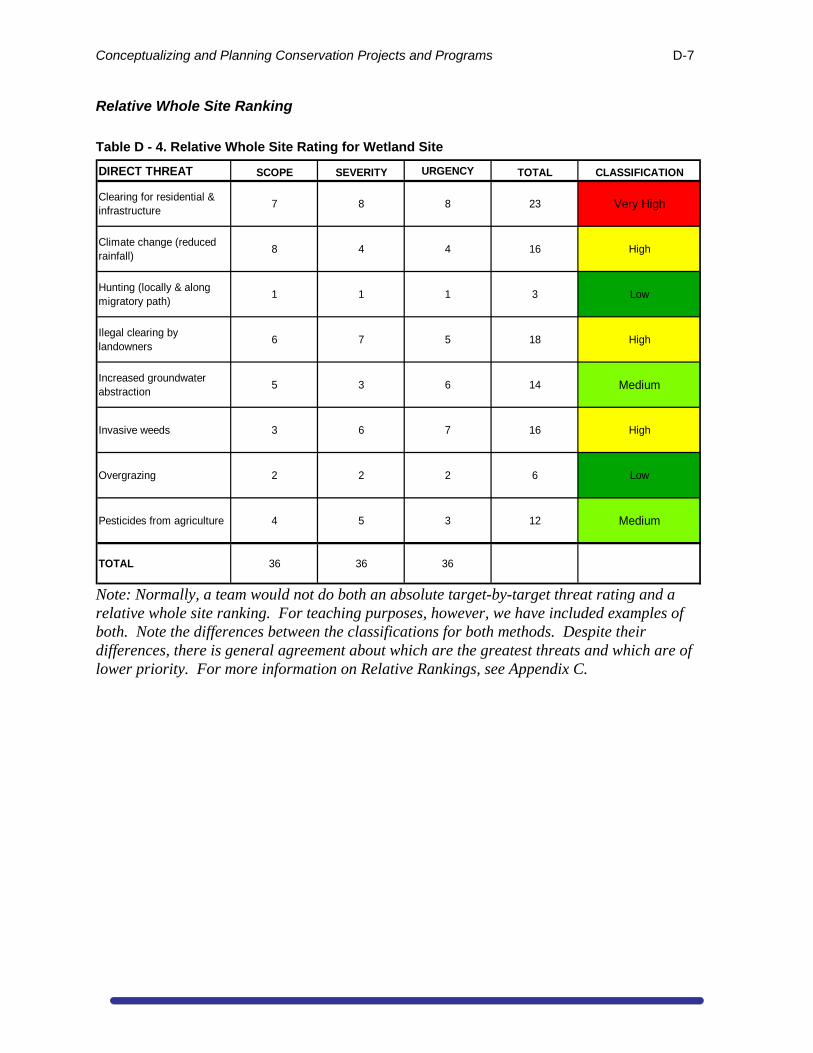
Conceptualizing and Planning Conservation Projects and Programs D-7
Relative Whole Site Ranking
Table D - 4. Relative Whole Site Rating for Wetland Site
DIRECT THREAT SCOPE SEVERITY URGENCY TOTAL CLASSIFICATION
Clearing for residential & infrastructure
7 8 8 23 Very High
Climate change (reduced rainfall)
8 4 4 16 High
Hunting (locally & along migratory path)
1 1 1 3 Low
Ilegal clearing by landowners
6 7 5 18 High
Increased groundwater abstraction
5 3 6 14 Medium
Invasive weeds 3 6 7 16 High
Overgrazing 2 2 2 6 Low
Pesticides from agriculture 4 5 3 12 Medium
TOTAL 36 36 36
Note: Normally, a team would not do both an absolute target-by-target threat rating and a relative whole site ranking. For teaching purposes, however, we have included examples of both. Note the differences between the classifications for both methods. Despite their differences, there is general agreement about which are the greatest threats and which are of lower priority. For more information on Relative Rankings, see Appendix C.
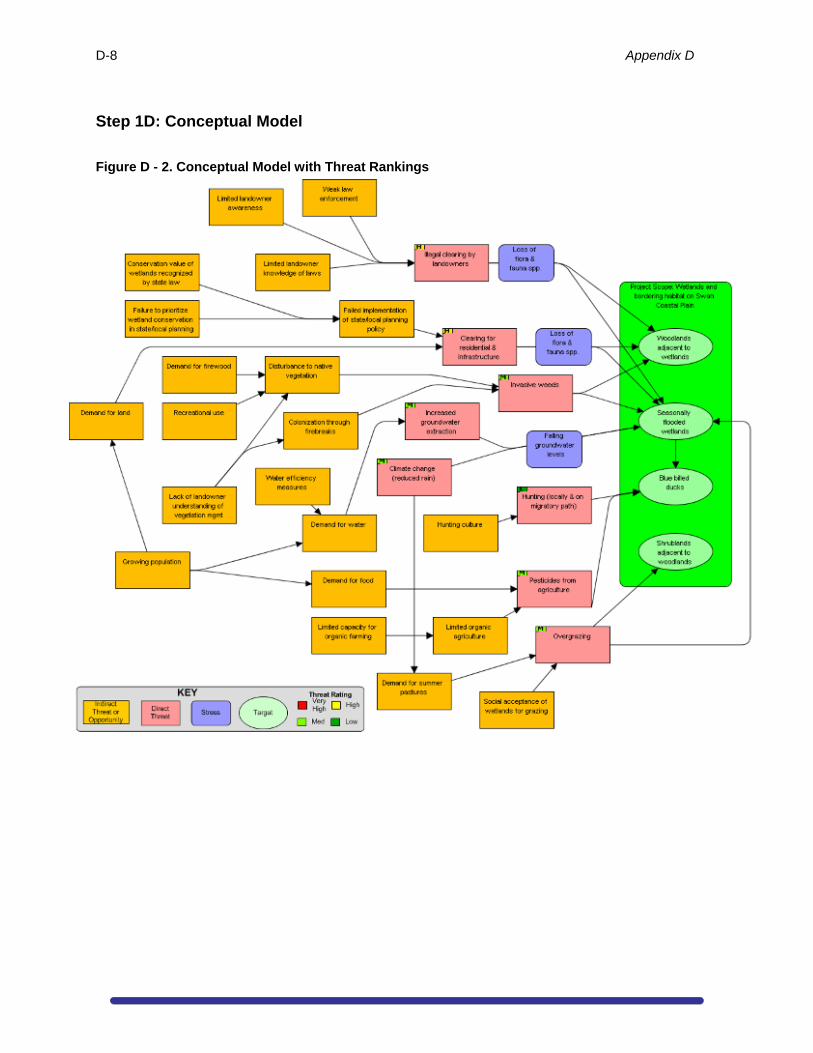
D-8 Appendix D
Step 1D: Conceptual Model
Figure D - 2. Conceptual Model with Threat Rankings
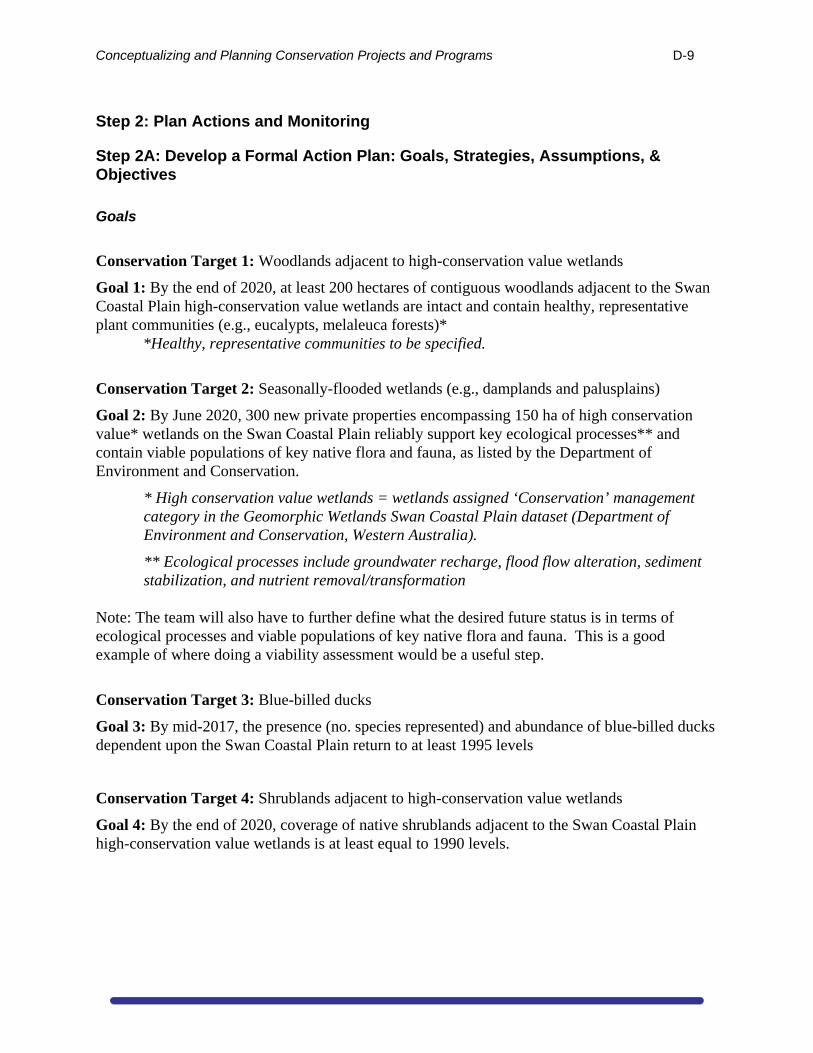
Conceptualizing and Planning Conservation Projects and Programs D-9
Step 2: Plan Actions and Monitoring
Step 2A: Develop a Formal Action Plan: Goals, Strategies, Assumptions, & Objectives
Goals
Conservation Target 1: Woodlands adjacent to high-conservation value wetlands
Goal 1: By the end of 2020, at least 200 hectares of contiguous woodlands adjacent to the Swan Coastal Plain high-conservation value wetlands are intact and contain healthy, representative plant communities (e.g., eucalypts, melaleuca forests)*
*Healthy, representative communities to be specified.
Conservation Target 2: Seasonally-flooded wetlands (e.g., damplands and palusplains)
Goal 2: By June 2020, 300 new private properties encompassing 150 ha of high conservation value* wetlands on the Swan Coastal Plain reliably support key ecological processes** and contain viable populations of key native flora and fauna, as listed by the Department of Environment and Conservation.
* High conservation value wetlands = wetlands assigned ‘Conservation’ management category in the Geomorphic Wetlands Swan Coastal Plain dataset (Department of Environment and Conservation, Western Australia).
** Ecological processes include groundwater recharge, flood flow alteration, sediment stabilization, and nutrient removal/transformation
Note: The team will also have to further define what the desired future status is in terms of ecological processes and viable populations of key native flora and fauna. This is a good example of where doing a viability assessment would be a useful step.
Conservation Target 3: Blue-billed ducks
Goal 3: By mid-2017, the presence (no. species represented) and abundance of blue-billed ducks dependent upon the Swan Coastal Plain return to at least 1995 levels
Conservation Target 4: Shrublands adjacent to high-conservation value wetlands
Goal 4: By the end of 2020, coverage of native shrublands adjacent to the Swan Coastal Plain high-conservation value wetlands is at least equal to 1990 levels.
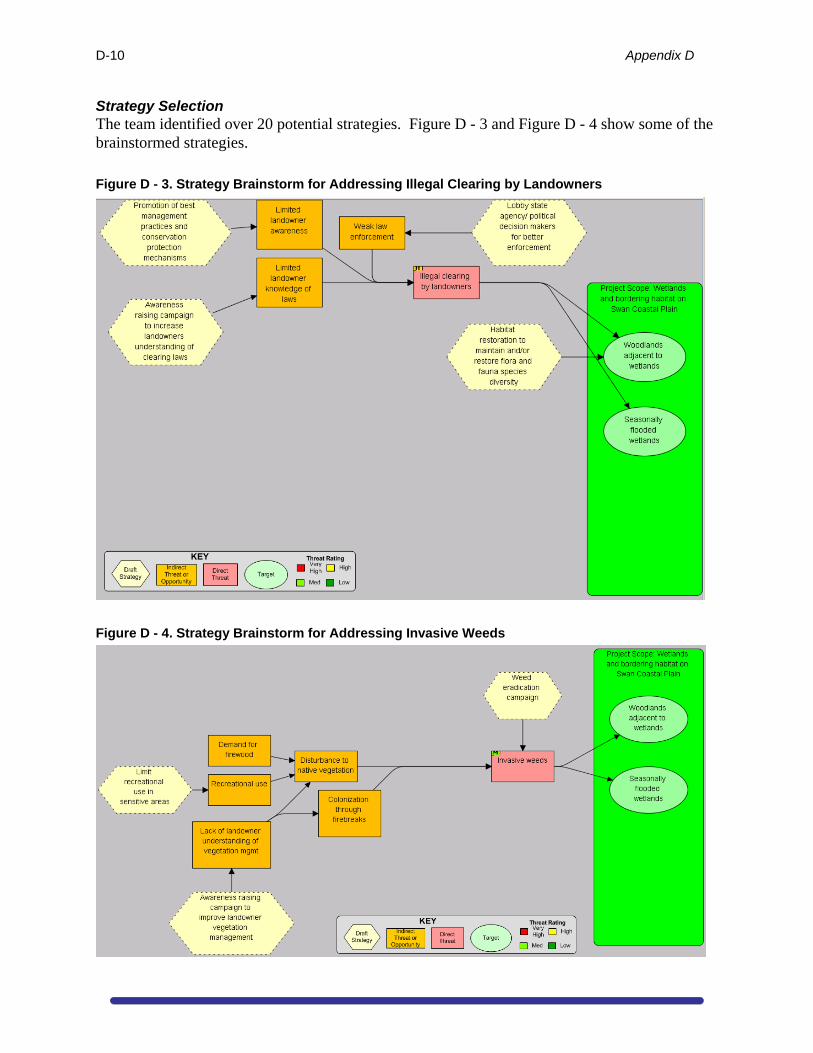
D-10 Appendix D
Strategy Selection The team identified over 20 potential strategies. Figure D - 3 and Figure D - 4 show some of the brainstormed strategies.
Figure D - 3. Strategy Brainstorm for Addressing Illegal Clearing by Landowners
Figure D - 4. Strategy Brainstorm for Addressing Invasive Weeds
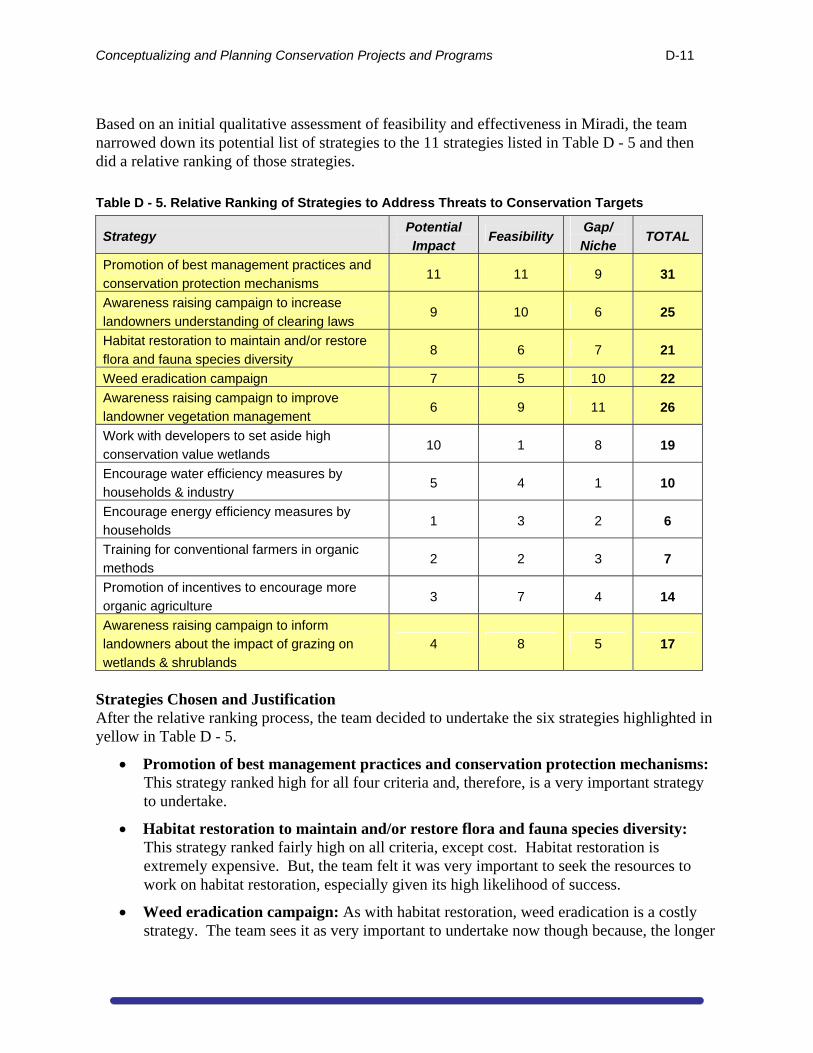
Conceptualizing and Planning Conservation Projects and Programs D-11
Based on an initial qualitative assessment of feasibility and effectiveness in Miradi, the team narrowed down its potential list of strategies to the 11 strategies listed in Table D - 5 and then did a relative ranking of those strategies.
Table D - 5. Relative Ranking of Strategies to Address Threats to Conservation Targets
Strategy Potential
Impact Feasibility
Gap/
Niche TOTAL
Promotion of best management practices and
conservation protection mechanisms 11 11 9 31
Awareness raising campaign to increase
landowners understanding of clearing laws 9 10 6 25
Habitat restoration to maintain and/or restore
flora and fauna species diversity 8 6 7 21
Weed eradication campaign 7 5 10 22
Awareness raising campaign to improve
landowner vegetation management 6 9 11 26
Work with developers to set aside high
conservation value wetlands 10 1 8 19
Encourage water efficiency measures by
households & industry 5 4 1 10
Encourage energy efficiency measures by
households 1 3 2 6
Training for conventional farmers in organic
methods 2 2 3 7
Promotion of incentives to encourage more
organic agriculture 3 7 4 14
Awareness raising campaign to inform
landowners about the impact of grazing on
wetlands & shrublands
4 8 5 17
Strategies Chosen and Justification After the relative ranking process, the team decided to undertake the six strategies highlighted in yellow in Table D - 5.
Promotion of best management practices and conservation protection mechanisms: This strategy ranked high for all four criteria and, therefore, is a very important strategy to undertake.
Habitat restoration to maintain and/or restore flora and fauna species diversity: This strategy ranked fairly high on all criteria, except cost. Habitat restoration is extremely expensive. But, the team felt it was very important to seek the resources to work on habitat restoration, especially given its high likelihood of success.
Weed eradication campaign: As with habitat restoration, weed eradication is a costly strategy. The team sees it as very important to undertake now though because, the longer
D-12 Appendix D
the team waits, the worse the problem of invasive species will become. The team also hopes it can eventually train a volunteer corps, which will help keep the cost of this strategy down.
Awareness raising campaign to increase landowners understanding of clearing laws; Awareness raising campaign to improve landowner vegetation management: These two strategies are similar and could probably be combined into one strategy. They ranked fairly high on the different criteria and, thus, were seen as important strategies. In addition, the team has previous experience with Awareness raising campaigns and would be able to draw on that experience for this project.
Awareness raising campaign to inform landowners about the impact of grazing on wetlands & shrublands: Although this is an awareness raising strategy, the audience is different than the one for the above strategies. While the team is not certain of its likelihood of success, they feel it is important to address this threat because it is the primary threat affecting their shrublands target.
The strategies the team did not choose ranked much lower, with two exceptions:
Work with developers to set aside high conservation value wetlands: This strategy received a relatively high ranking and a higher overall ranking than did some of the strategies the team chose. Nevertheless the team did not feel it was wise for them to pursue it because they did not have the resources or connections to effectively work with developer stakeholders. For this reason, the team ranked the feasibility of this strategy as very low and decided not to pursue it.
Promotion of incentives to encourage more organic agriculture: The team is not certain of this strategy’s likelihood of success, but it still feels it is important to take action here because this is the only strategy they have identified that has potential to impact the blue-bill duck target. The team’s expertise is not in organic agriculture, but it has good contacts with organizations working in this area. Thus, the team decided not to implement this strategy itself but rather encourage local agriculture organizations to adopt it or a similar strategy that would reduce the threat of pesticides from agriculture.
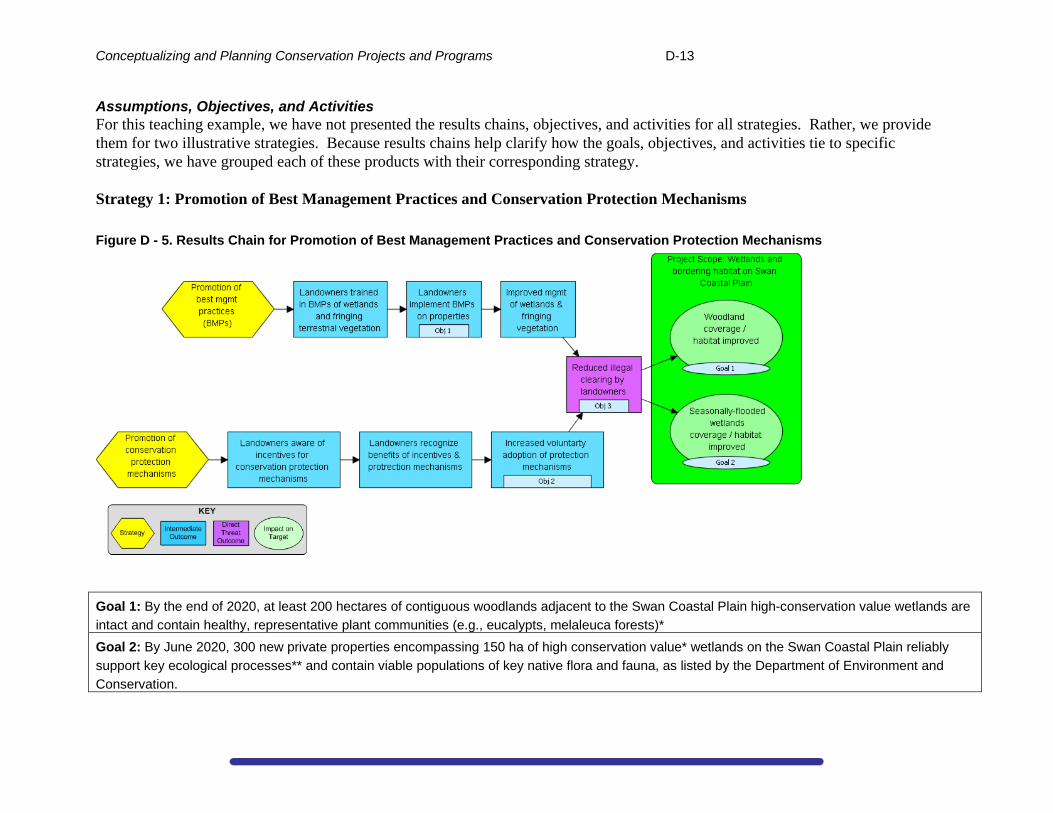
Conceptualizing and Planning Conservation Projects and Programs D-13
Assumptions, Objectives, and Activities For this teaching example, we have not presented the results chains, objectives, and activities for all strategies. Rather, we provide them for two illustrative strategies. Because results chains help clarify how the goals, objectives, and activities tie to specific strategies, we have grouped each of these products with their corresponding strategy. Strategy 1: Promotion of Best Management Practices and Conservation Protection Mechanisms
Figure D - 5. Results Chain for Promotion of Best Management Practices and Conservation Protection Mechanisms
Goal 1: By the end of 2020, at least 200 hectares of contiguous woodlands adjacent to the Swan Coastal Plain high-conservation value wetlands are
intact and contain healthy, representative plant communities (e.g., eucalypts, melaleuca forests)*
Goal 2: By June 2020, 300 new private properties encompassing 150 ha of high conservation value* wetlands on the Swan Coastal Plain reliably
support key ecological processes** and contain viable populations of key native flora and fauna, as listed by the Department of Environment and
Conservation.
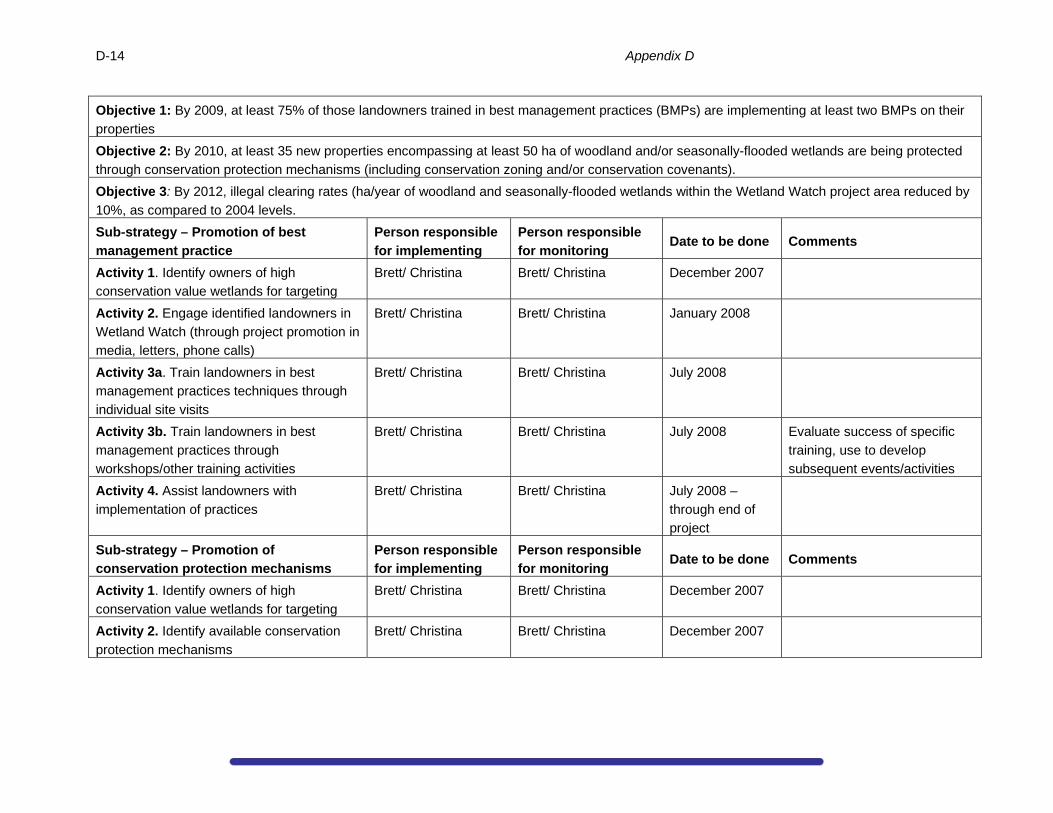
D-14 Appendix D
Objective 1: By 2009, at least 75% of those landowners trained in best management practices (BMPs) are implementing at least two BMPs on their
properties
Objective 2: By 2010, at least 35 new properties encompassing at least 50 ha of woodland and/or seasonally-flooded wetlands are being protected
through conservation protection mechanisms (including conservation zoning and/or conservation covenants).
Objective 3: By 2012, illegal clearing rates (ha/year of woodland and seasonally-flooded wetlands within the Wetland Watch project area reduced by
10%, as compared to 2004 levels.
Sub-strategy – Promotion of best
management practice
Person responsible
for implementing
Person responsible
for monitoring Date to be done Comments
Activity 1. Identify owners of high
conservation value wetlands for targeting
Brett/ Christina Brett/ Christina December 2007
Activity 2. Engage identified landowners in
Wetland Watch (through project promotion in
media, letters, phone calls)
Brett/ Christina Brett/ Christina January 2008
Activity 3a. Train landowners in best
management practices techniques through
individual site visits
Brett/ Christina Brett/ Christina July 2008
Activity 3b. Train landowners in best
management practices through
workshops/other training activities
Brett/ Christina Brett/ Christina July 2008 Evaluate success of specific
training, use to develop
subsequent events/activities
Activity 4. Assist landowners with
implementation of practices
Brett/ Christina Brett/ Christina July 2008 –
through end of
project
Sub-strategy – Promotion of
conservation protection mechanisms
Person responsible
for implementing
Person responsible
for monitoring Date to be done Comments
Activity 1. Identify owners of high
conservation value wetlands for targeting
Brett/ Christina Brett/ Christina December 2007
Activity 2. Identify available conservation
protection mechanisms
Brett/ Christina Brett/ Christina December 2007
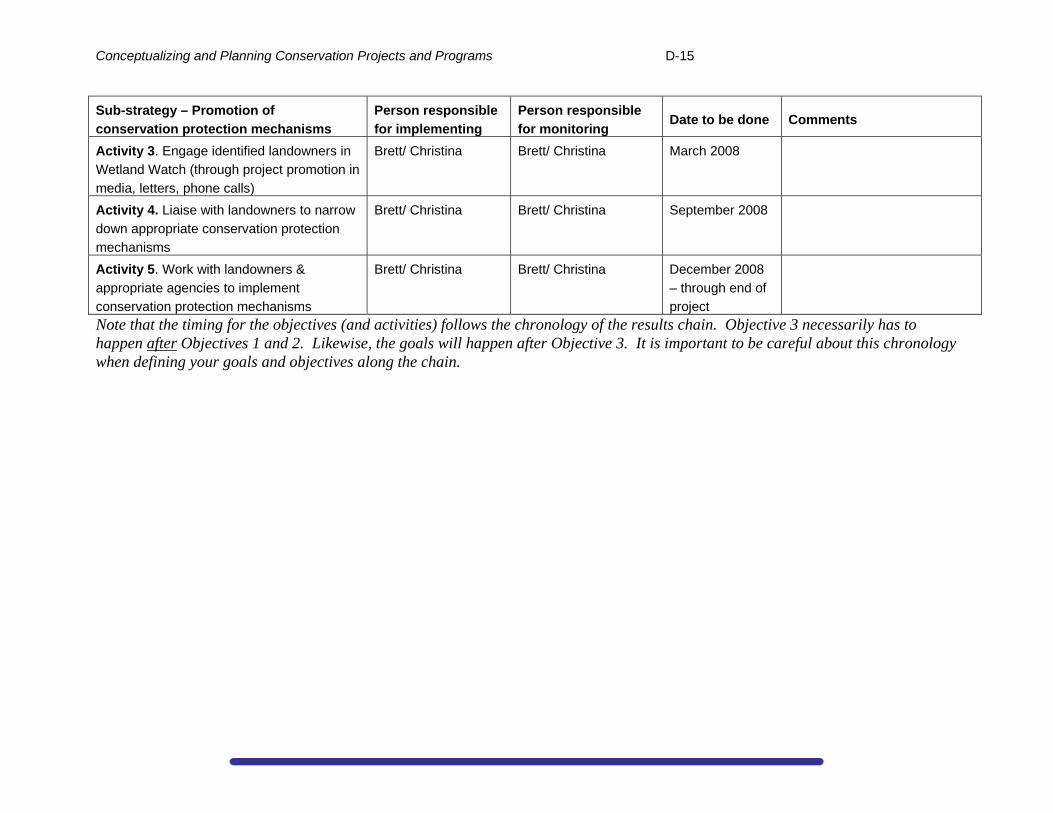
Conceptualizing and Planning Conservation Projects and Programs D-15
Sub-strategy – Promotion of
conservation protection mechanisms
Person responsible
for implementing
Person responsible
for monitoring Date to be done Comments
Activity 3. Engage identified landowners in
Wetland Watch (through project promotion in
media, letters, phone calls)
Brett/ Christina Brett/ Christina March 2008
Activity 4. Liaise with landowners to narrow
down appropriate conservation protection
mechanisms
Brett/ Christina Brett/ Christina September 2008
Activity 5. Work with landowners &
appropriate agencies to implement
conservation protection mechanisms
Brett/ Christina Brett/ Christina December 2008
– through end of
project
Note that the timing for the objectives (and activities) follows the chronology of the results chain. Objective 3 necessarily has to happen after Objectives 1 and 2. Likewise, the goals will happen after Objective 3. It is important to be careful about this chronology when defining your goals and objectives along the chain.
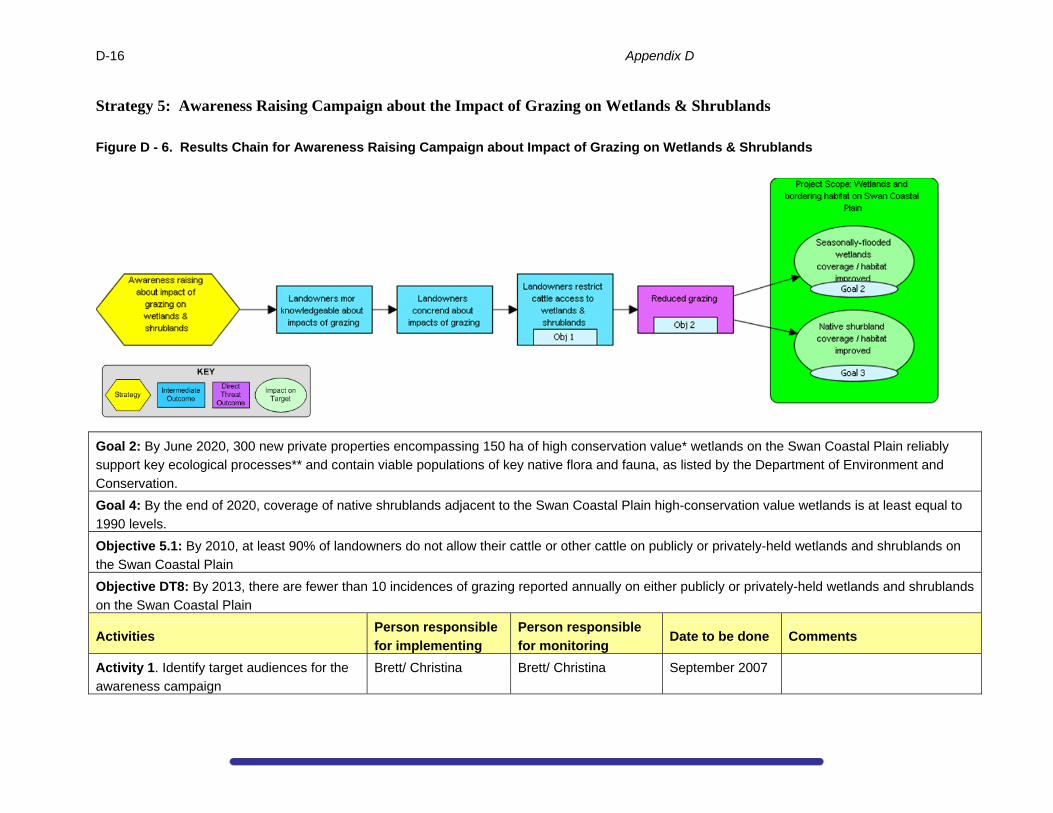
D-16 Appendix D
Strategy 5: Awareness Raising Campaign about the Impact of Grazing on Wetlands & Shrublands
Figure D - 6. Results Chain for Awareness Raising Campaign about Impact of Grazing on Wetlands & Shrublands
Goal 2: By June 2020, 300 new private properties encompassing 150 ha of high conservation value* wetlands on the Swan Coastal Plain reliably
support key ecological processes** and contain viable populations of key native flora and fauna, as listed by the Department of Environment and
Conservation.
Goal 4: By the end of 2020, coverage of native shrublands adjacent to the Swan Coastal Plain high-conservation value wetlands is at least equal to
1990 levels.
Objective 5.1: By 2010, at least 90% of landowners do not allow their cattle or other cattle on publicly or privately-held wetlands and shrublands on
the Swan Coastal Plain
Objective DT8: By 2013, there are fewer than 10 incidences of grazing reported annually on either publicly or privately-held wetlands and shrublands
on the Swan Coastal Plain
Activities Person responsible
for implementing
Person responsible
for monitoring Date to be done Comments
Activity 1. Identify target audiences for the
awareness campaign
Brett/ Christina Brett/ Christina September 2007
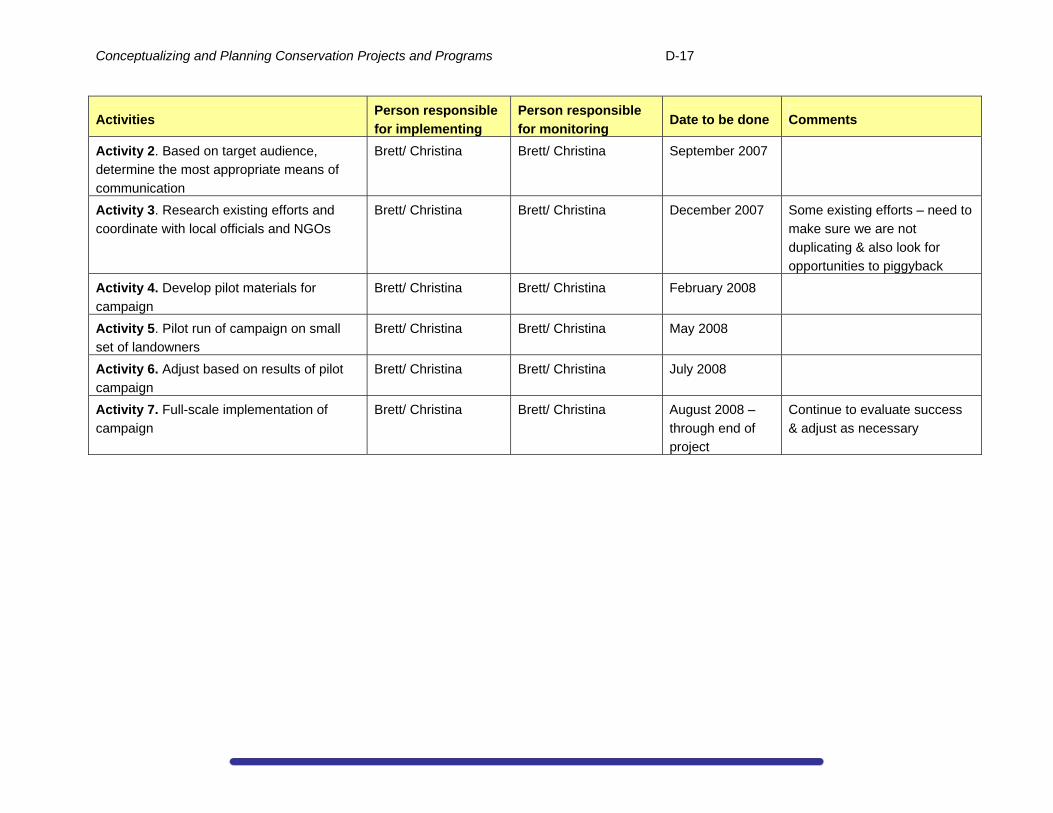
Conceptualizing and Planning Conservation Projects and Programs D-17
Activities Person responsible
for implementing
Person responsible
for monitoring Date to be done Comments
Activity 2. Based on target audience,
determine the most appropriate means of
communication
Brett/ Christina Brett/ Christina September 2007
Activity 3. Research existing efforts and
coordinate with local officials and NGOs
Brett/ Christina Brett/ Christina December 2007 Some existing efforts – need to
make sure we are not
duplicating & also look for
opportunities to piggyback
Activity 4. Develop pilot materials for
campaign
Brett/ Christina Brett/ Christina February 2008
Activity 5. Pilot run of campaign on small
set of landowners
Brett/ Christina Brett/ Christina May 2008
Activity 6. Adjust based on results of pilot
campaign
Brett/ Christina Brett/ Christina July 2008
Activity 7. Full-scale implementation of
campaign
Brett/ Christina Brett/ Christina August 2008 –
through end of
project
Continue to evaluate success
& adjust as necessary
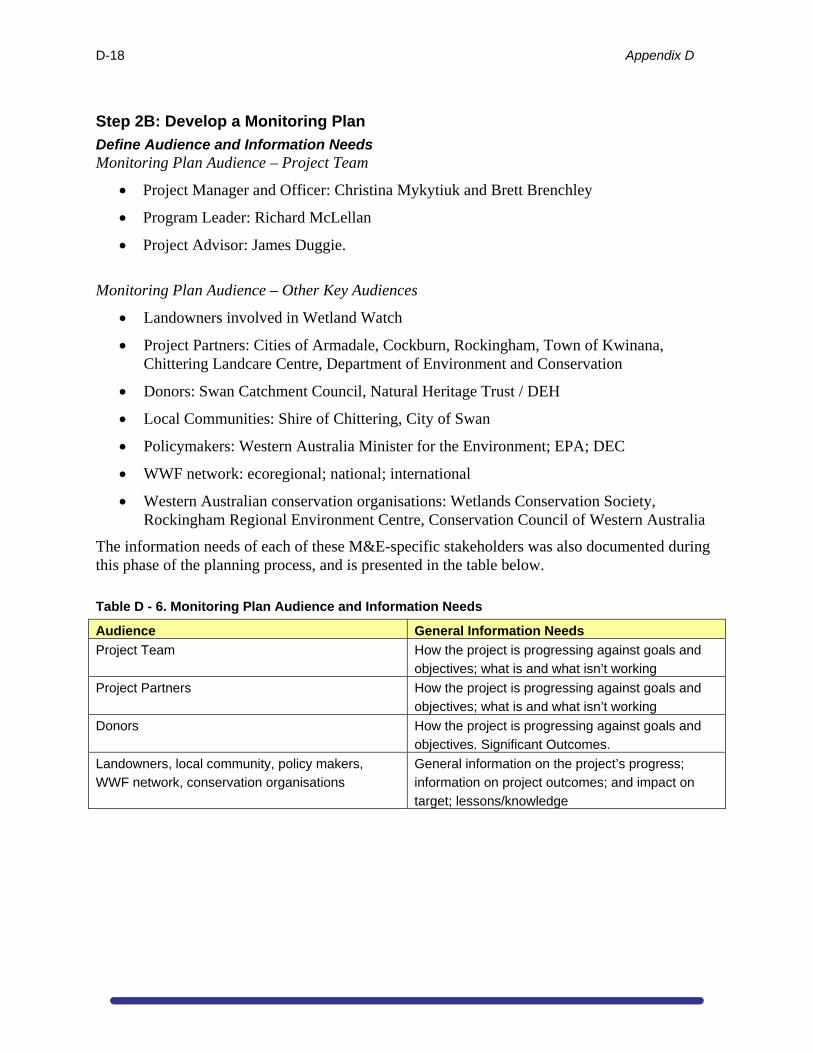
D-18 Appendix D
Step 2B: Develop a Monitoring Plan
Define Audience and Information Needs Monitoring Plan Audience – Project Team
Project Manager and Officer: Christina Mykytiuk and Brett Brenchley
Program Leader: Richard McLellan
Project Advisor: James Duggie.
Monitoring Plan Audience – Other Key Audiences
Landowners involved in Wetland Watch
Project Partners: Cities of Armadale, Cockburn, Rockingham, Town of Kwinana, Chittering Landcare Centre, Department of Environment and Conservation
Donors: Swan Catchment Council, Natural Heritage Trust / DEH
Local Communities: Shire of Chittering, City of Swan
Policymakers: Western Australia Minister for the Environment; EPA; DEC
WWF network: ecoregional; national; international
Western Australian conservation organisations: Wetlands Conservation Society, Rockingham Regional Environment Centre, Conservation Council of Western Australia
The information needs of each of these M&E-specific stakeholders was also documented during this phase of the planning process, and is presented in the table below.
Table D - 6. Monitoring Plan Audience and Information Needs
Audience General Information Needs
Project Team How the project is progressing against goals and
objectives; what is and what isn’t working
Project Partners How the project is progressing against goals and
objectives; what is and what isn’t working
Donors How the project is progressing against goals and
objectives. Significant Outcomes.
Landowners, local community, policy makers,
WWF network, conservation organisations
General information on the project’s progress;
information on project outcomes; and impact on
target; lessons/knowledge
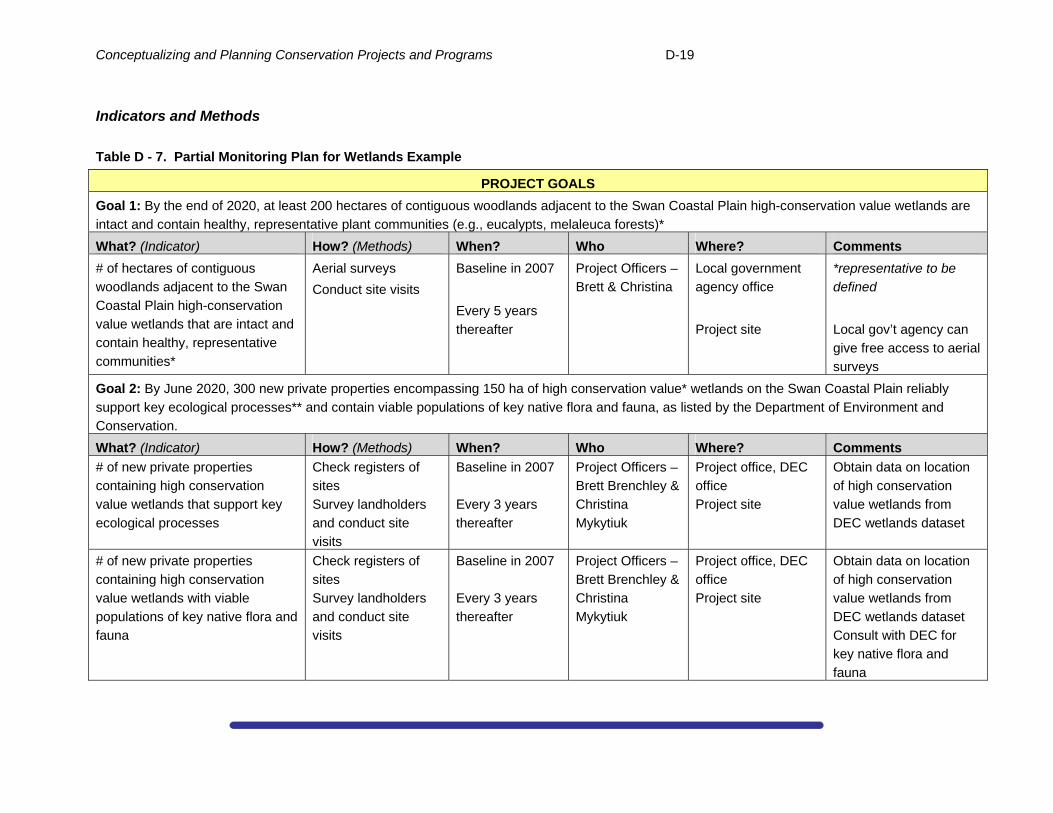
Conceptualizing and Planning Conservation Projects and Programs D-19
Indicators and Methods
Table D - 7. Partial Monitoring Plan for Wetlands Example
PROJECT GOALS
Goal 1: By the end of 2020, at least 200 hectares of contiguous woodlands adjacent to the Swan Coastal Plain high-conservation value wetlands are
intact and contain healthy, representative plant communities (e.g., eucalypts, melaleuca forests)*
What? (Indicator) How? (Methods) When? Who Where? Comments
# of hectares of contiguous
woodlands adjacent to the Swan
Coastal Plain high-conservation
value wetlands that are intact and
contain healthy, representative
communities*
Aerial surveys
Conduct site visits
Baseline in 2007
Every 5 years
thereafter
Project Officers –
Brett & Christina
Local government
agency office
Project site
*representative to be
defined
Local gov’t agency can
give free access to aerial
surveys
Goal 2: By June 2020, 300 new private properties encompassing 150 ha of high conservation value* wetlands on the Swan Coastal Plain reliably
support key ecological processes** and contain viable populations of key native flora and fauna, as listed by the Department of Environment and
Conservation.
What? (Indicator) How? (Methods) When? Who Where? Comments
# of new private properties
containing high conservation
value wetlands that support key
ecological processes
Check registers of
sites
Survey landholders
and conduct site
visits
Baseline in 2007
Every 3 years
thereafter
Project Officers –
Brett Brenchley &
Christina
Mykytiuk
Project office, DEC
office
Project site
Obtain data on location
of high conservation
value wetlands from
DEC wetlands dataset
# of new private properties
containing high conservation
value wetlands with viable
populations of key native flora and
fauna
Check registers of
sites
Survey landholders
and conduct site
visits
Baseline in 2007
Every 3 years
thereafter
Project Officers –
Brett Brenchley &
Christina
Mykytiuk
Project office, DEC
office
Project site
Obtain data on location
of high conservation
value wetlands from
DEC wetlands dataset
Consult with DEC for
key native flora and
fauna
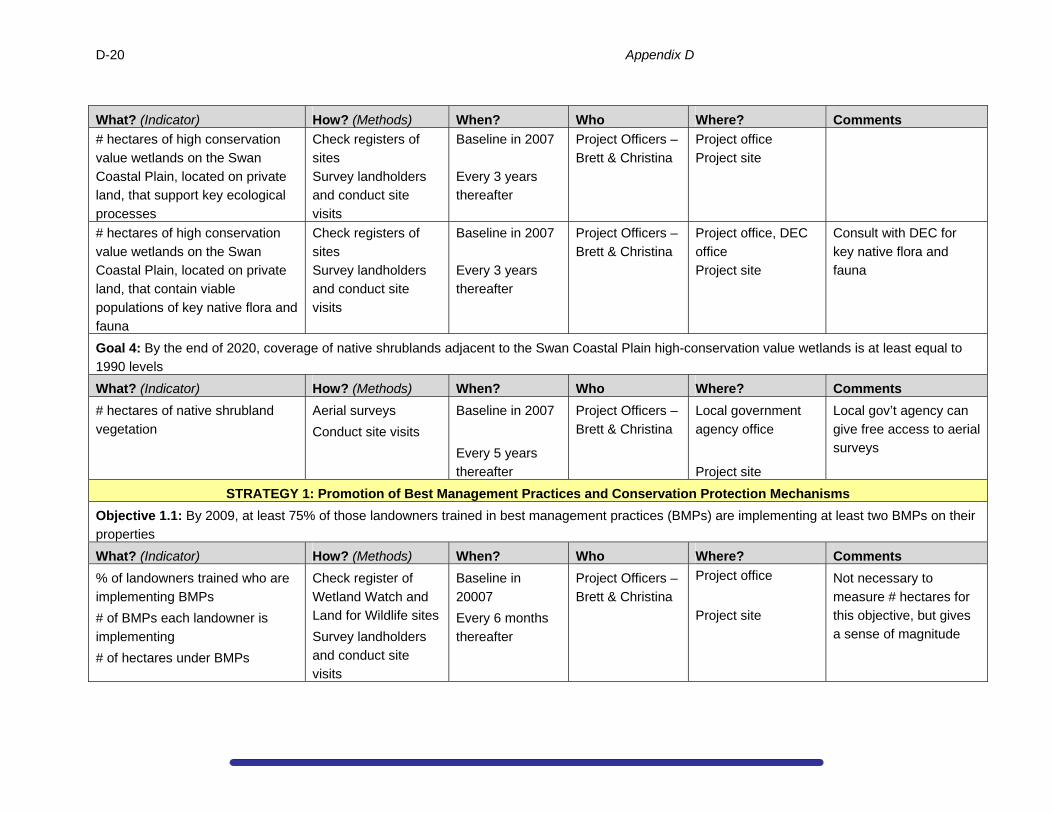
D-20 Appendix D
What? (Indicator) How? (Methods) When? Who Where? Comments
# hectares of high conservation
value wetlands on the Swan
Coastal Plain, located on private
land, that support key ecological
processes
Check registers of
sites
Survey landholders
and conduct site
visits
Baseline in 2007
Every 3 years
thereafter
Project Officers –
Brett & Christina
Project office
Project site
# hectares of high conservation
value wetlands on the Swan
Coastal Plain, located on private
land, that contain viable
populations of key native flora and
fauna
Check registers of
sites
Survey landholders
and conduct site
visits
Baseline in 2007
Every 3 years
thereafter
Project Officers –
Brett & Christina
Project office, DEC
office
Project site
Consult with DEC for
key native flora and
fauna
Goal 4: By the end of 2020, coverage of native shrublands adjacent to the Swan Coastal Plain high-conservation value wetlands is at least equal to
1990 levels
What? (Indicator) How? (Methods) When? Who Where? Comments
# hectares of native shrubland
vegetation
Aerial surveys
Conduct site visits
Baseline in 2007
Every 5 years
thereafter
Project Officers –
Brett & Christina
Local government
agency office
Project site
Local gov’t agency can
give free access to aerial
surveys
STRATEGY 1: Promotion of Best Management Practices and Conservation Protection Mechanisms
Objective 1.1: By 2009, at least 75% of those landowners trained in best management practices (BMPs) are implementing at least two BMPs on their
properties
What? (Indicator) How? (Methods) When? Who Where? Comments
% of landowners trained who are
implementing BMPs
# of BMPs each landowner is
implementing
# of hectares under BMPs
Check register of
Wetland Watch and
Land for Wildlife sites
Survey landholders
and conduct site
visits
Baseline in
20007
Every 6 months
thereafter
Project Officers –
Brett & Christina
Project office
Project site
Not necessary to
measure # hectares for
this objective, but gives
a sense of magnitude
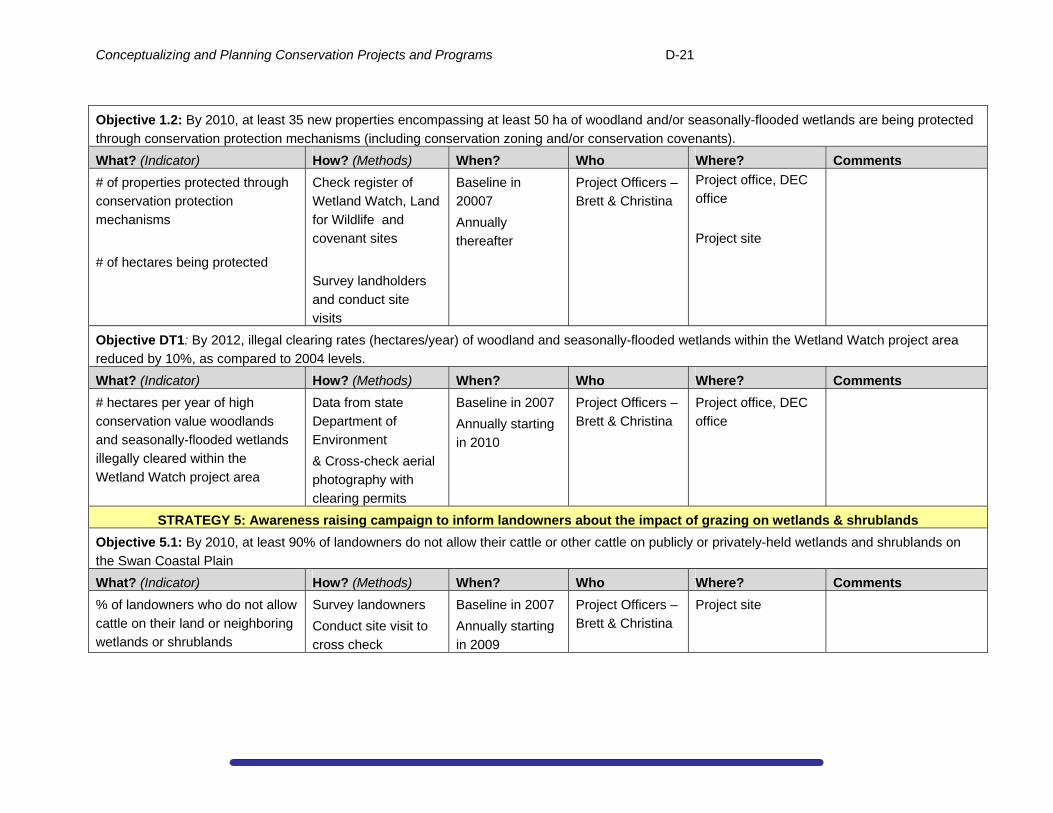
Conceptualizing and Planning Conservation Projects and Programs D-21
Objective 1.2: By 2010, at least 35 new properties encompassing at least 50 ha of woodland and/or seasonally-flooded wetlands are being protected
through conservation protection mechanisms (including conservation zoning and/or conservation covenants).
What? (Indicator) How? (Methods) When? Who Where? Comments
# of properties protected through
conservation protection
mechanisms
# of hectares being protected
Check register of
Wetland Watch, Land
for Wildlife and
covenant sites
Survey landholders
and conduct site
visits
Baseline in
20007
Annually
thereafter
Project Officers –
Brett & Christina
Project office, DEC
office
Project site
Objective DT1: By 2012, illegal clearing rates (hectares/year) of woodland and seasonally-flooded wetlands within the Wetland Watch project area
reduced by 10%, as compared to 2004 levels.
What? (Indicator) How? (Methods) When? Who Where? Comments
# hectares per year of high
conservation value woodlands
and seasonally-flooded wetlands
illegally cleared within the
Wetland Watch project area
Data from state
Department of
Environment
& Cross-check aerial
photography with
clearing permits
Baseline in 2007
Annually starting
in 2010
Project Officers –
Brett & Christina
Project office, DEC
office
STRATEGY 5: Awareness raising campaign to inform landowners about the impact of grazing on wetlands & shrublands
Objective 5.1: By 2010, at least 90% of landowners do not allow their cattle or other cattle on publicly or privately-held wetlands and shrublands on
the Swan Coastal Plain
What? (Indicator) How? (Methods) When? Who Where? Comments
% of landowners who do not allow
cattle on their land or neighboring
wetlands or shrublands
Survey landowners
Conduct site visit to
cross check
Baseline in 2007
Annually starting
in 2009
Project Officers –
Brett & Christina
Project site
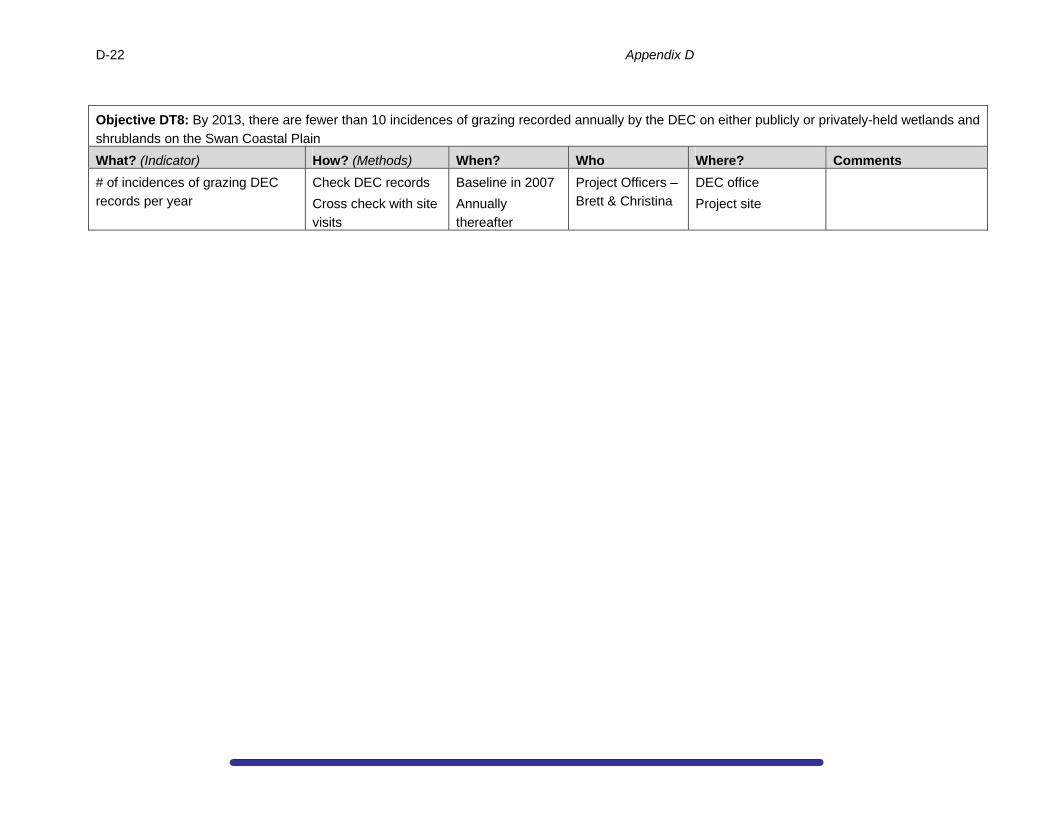
D-22 Appendix D
Objective DT8: By 2013, there are fewer than 10 incidences of grazing recorded annually by the DEC on either publicly or privately-held wetlands and
shrublands on the Swan Coastal Plain
What? (Indicator) How? (Methods) When? Who Where? Comments
# of incidences of grazing DEC
records per year
Check DEC records
Cross check with site
visits
Baseline in 2007
Annually
thereafter
Project Officers –
Brett & Christina
DEC office
Project site