Embed Size (px)
Citation preview

ENERGY AUDIT – FINAL REPORT
LAWRENCE TOWNSHIP LAWRENCEVILLE FIRE COMPANY
64 PHILLIPS AVENUE LAWRENCE TOWNSHIP, NJ 08648
ATTN: MR. TREY KEYMOORE
CEG PROPOSAL NO. 9C08127
CONCORD ENGINEERING GROUP
520 SOUTH BURNT MILL ROAD VOORHEES, NJ 08043 TELEPHONE: (856) 427-0200 FACSIMILE: (856) 427-6529 WWW.CEG-INC.NET
CONTACT: RAYMOND JOHNSON Cell: (609) 760-4057

Lawrence Township Lawrenceville Fire Co. Energy Audit
June 29, 2009 Page 1 of 31
Table of Contents I. Executive Summary........................................................................................................3
II. Introduction………………………………………………………………………….....5
III. Method of Analysis…………………………………………………………………….6
IV. Historic Energy Consumption/Cost……………………………………………………7
a. Energy Usage / Tariffs b. Energy Use Index c. EPA Energy Star Benchmarking System
V. Facility Description...……………………………………………………………….....12
VI. Major Equipment List…….…………………………………………………………....14
VII. Energy Conservation Measures………………………………………………………..15
VIII. Renewable / Distributed Energy Measures…………………………………………….26
IX. Energy Purchasing and Procurement Strategy…………………………………………27
X. Installation Funding Options…………………………………………………………...30
XI. Additional Recommendations………………………………………………………….31
Appendix A – Detailed Energy Usage and Costing Data
Appendix B – Detailed Cost Breakdown per ECM
Appendix C – New Jersey Smart Start® Program Incentives
Appendix D – Major Equipment List
Appendix E – Investment Grade Lighting Audit
Appendix F – T5HO Maintenance Savings Calculator
Appendix G – Programmable Thermostat
Appendix H – Renewable / Distributed Energy Measures Calculations

Lawrence Township Lawrenceville Fire Co. Energy Audit
June 29, 2009 Page 2 of 31
REPORT DISCLAIMER
The information contained within this report, including any attachment(s), is intended solely for use by the named addressee(s). If you are not the intended recipient, or a person designated as responsible for delivering such messages to the intended recipient, you are not authorized to disclose, copy, distribute or retain this report, in whole or in part, without written authorization from Concord Engineering Group, Inc., 520 S. Burnt Mill Road, Voorhees, NJ 08043.
This report may contain proprietary, confidential or privileged information. If you have received this report in error, please notify the sender immediately. Thank you for your anticipated cooperation.

Lawrence Township Lawrenceville Fire Co. Energy Audit
June 29, 2009 Page 3 of 31
I. EXECUTIVE SUMMARY
This report presents the findings of an energy audit conducted for:
Lawrence Township Lawrenceville Fire Company 64 Phillips Avenue Lawrenceville, NJ 08648 Municipal Contact Person: Trey Keymoore
Facility Contact Person: Joseph Sliwinski This audit was performed in connection with the New Jersey Clean Energy Local Government Energy Audit Program. These energy audits are conducted to promote the office of Clean Energy’s mission, which is to use innovation and technology to solve energy and environmental problems in a way that improves the State’s economy. This can be achieved through the wiser and more efficient use of energy. The annual energy costs at this facility are as follows: Electricity $ 17,501 Natural Gas $ 13,078_ Total $ 30,579 The potential annual energy cost savings are shown below in Table 1. Be aware that the measures are not additive because of the interrelation of several of the measures. The cost of each measure for this level of auditing is ± 20% until detailed engineering, specifications, and hard proposals are obtained.
Table 1 Energy Conservation Measures (ECM’s)
ECM NO. DESCRIPTION COST ANNUAL
SAVINGS
SIMPLE PAYBACK(YEARS)
1 Lighting Upgrade - Garage/Engine Bay $3,712 $593 6.3
2 Lighting Upgrade – Office/Lounge and Hall $8,148 $3,381 2.4
3 Lighting Controls – Office/Lounge $990 $480 2.06
4 AHU Replacement – Hall Units $8,900 $1,624 5.48
5 A/C Upgrade – Condensing Unit Replacement $54,732 $2,671 20.5
6 Programmable Thermostats $1,800 $3,130 0.6

Lawrence Township Lawrenceville Fire Co. Energy Audit
June 29, 2009 Page 4 of 31
The estimated demand and energy savings are shown below in Table 2. The information in this table corresponds to the ECM’s in Table 1.
Table 2 Estimated Energy Savings
Concord Engineering Group (CEG) strongly recommends the implementation of all ECM’s that provide a calculated simple payback at or under seven (7) years. The potential energy and cost savings from these ECM’s are too great to pass upon. The following Energy Conservation Measures are recommended for the Lawrenceville Fire Company:
ECM #1: Lighting Upgrade - Garage/Engine Bay
ECM #2: Lighting Upgrade – Office/Lounge and Hall
ECM #3: Lighting Controls – Office/Lounge
ECM #4: AHU Replacement – Hall Units
ECM #6: Programmable Thermostats
ECM NO. DESCRIPTION
ANNUAL UTILITY REDUCTION
ELECT DEMAND
(KW)
ELECT CONSUMPTION
(KWH)
NAT GAS (THERMS)
1 Lighting Upgrade - Garage/Engine Bay 1.76 3,660 -
2 Lighting Upgrade – Office/Lounge and Hall 10.03 20,871 -
3 Lighting Controls – Office/Lounge - 2,963 -
4 AHU Replacement – Hall Units - 10,024 -
5 A/C Upgrade – Condensing Unit Replacement - 16,487 -
6 Programmable Thermostats - 7,340 1,500

Lawrence Township Lawrenceville Fire Co. Energy Audit
June 29, 2009 Page 5 of 31
II. INTRODUCTION
This comprehensive energy audit covers the 15,845 square foot Fire Company that includes administrative offices, fire hall, restrooms and engine bays. The first task was to collect and review one year worth of utility energy data for electricity and natural gas. This information was used to analyze operational characteristics, calculate energy benchmarks for comparison to industry averages, estimate savings potential, and establish a baseline to monitor the effectiveness of implemented measures. A computer spreadsheet was used to enter, sum, and calculate benchmarks and to graph utility information (see Appendix A). The Energy Use Index (EUI) is expressed in British Thermal Units/square foot/year (BTU/ft2/yr) and can be used to compare energy consumption to similar building types or to track consumption from year to year in the same building. The EUI is calculated by converting annual consumption of all fuels to BTU’s then dividing by the area (gross square footage) of the building. EUI is a good indicator of the relative potential for energy savings. A comparatively low EUI indicates less potential for large energy savings. The gross square footage of the building was provided by the township, in the absence of blueprints. A building profile was created that included age, occupancy, description, and existing conditions of Architectural and Mechanical Systems. The profile noted the major energy consuming equipment or systems and components that are inherently inefficient. Also, by reviewing the mechanical and electrical drawings and equipment schedules, questions regarding the lighting systems/controls, HVAC zone controls, or setback operations were noted. The site visit was spent inspecting the actual systems and answering specific questions from the preliminary review. The building manager provided occupancy schedules, O & M practices, the building energy management program, and other information that has an impact on energy consumption. The post-site work included evaluation of the information gathered during the site visit, researching possible conservation opportunities, organizing the audit into a comprehensive report, and making recommendations on mechanical, lighting and building envelope improvements.

Lawrence Township Lawrenceville Fire Co. Energy Audit
June 29, 2009 Page 6 of 31
III. METHOD OF ANALYSIS The first step in the energy analysis is the site survey. The auditor walks the entire site to inventory the building envelope (roof, windows, etc.), the heating, ventilation, and air conditioning equipment (HVAC), the lighting equipment, other facility-specific equipment, and to gain an understanding of how each facility is used. The collected data is then processed using engineering calculations, Microsoft Excel spread sheets and Trane Trace 700™ building simulation software that calculate the anticipated energy usage. The actual energy usage is entered directly from the utility bills. The anticipated energy usage is compared to the actual usage. If necessary, corrections are made to the site-collected data until the anticipated energy usage matches the actual usage. This process develops an end-use baseline for all of the fuels used at the facility. This baseline is used to calculate the energy savings for the measures that are recommended in this report. The savings in this report are not duplicative. The savings for each recommendation may actually be higher if the individual recommendations were installed instead of the entire project. For example, the lighting module calculates the change in wattage and multiplies it by the new operating hours instead of the existing operating hours (if there was a change in the hours at all). The lighting controls module calculates the change in hours and multiplies it by the new system wattage instead of the existing wattage. Therefore, if you chose to install the recommended lighting system but not the lighting controls, the savings achieved with the new lighting system would actually be higher because there would have been no reduction in the hours of use. The same principal follows for heating, cooling, and temperature recommendations – even with fuel switching. If there are recommendations to change the temperature settings to reduce fuel use, then the savings for the heating/cooling equipment recommendations are reduced, as well. Thermal recommendations (insulation, windows, etc.) are evaluated by taking the difference in the thermal load due to reduced heat transfer. Again, the “thermal load” is the thermal load after the other recommendations have been accounted for. Lastly, installation costs, refer to Appendix B, are then applied to each recommendation and simple paybacks are calculated. Costs are derived from Means Cost Data, other industry publications, and local contractors and suppliers. The NJ SmartStart Building® program incentives (refer to Appendix C) are calculated for the appropriate ECM’s and subtracted from the installed cost prior to calculation of the simple payback. In addition, where applicable, maintenance cost savings are estimated and applied to the net savings.

Lawrence Township Lawrenceville Fire Co. Energy Audit
June 29, 2009 Page 7 of 31
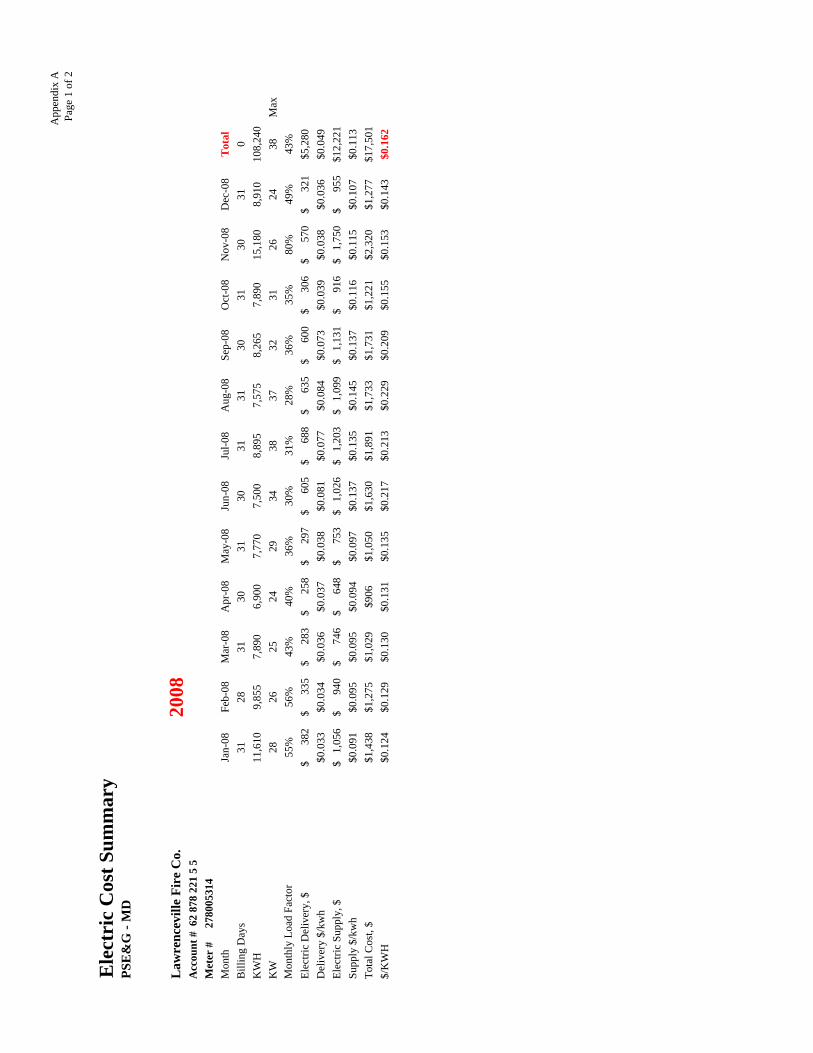
IV. HISTORIC ENERGY CONSUMPTION/COST A. Energy Usage / Tariffs Electric Table 3 and Figure 1 represent the electrical usage for the surveyed facility from January-08 to December-08. Public Service Electric and Gas Company (PSE&G) provides electricity to the facility under the ED / GLP rate. This electric rate has a component for consumption that is measured in kilowatt-hours (kWh). It is calculated by multiplying the wattage of the equipment times the hours that it operates. For example, a 1,000 Watt lamp operating for 5 hours would measure 5,000 Watt-hours. Since one kilowatt is equal to 1,000 Watts, the measured consumption would be 5 kWh. The basic usage charges are shown as generation service and delivery charges along with several non-utility generation charges. Rates used in this report reflect the most current rate structure available. Natural Gas Table 4 and Figure 2 show the natural gas energy usage for the surveyed fire house from January-08 to December-08. PSE&G supplies the natural gas to the facility under the GSGH Multi Family rate. Below is the average unit cost for the utilities at this facility. Description Average
Electricity 16.2¢/kWh Natural Gas $1.45/Therm

Lawrence Township Lawrenceville Fire Co. Energy Audit
June 29, 2009 Page 8 of 31
Table 3 Electricity Billing Data
MONTH OF USE CONSUMPTION KWH DEMAND TOTAL BILL
1/08 11,610 28 $1,438 2/08 9,855 26 $1,275 3/08 7,890 25 $1,029 4/08 6,900 24 $906 5/08 7,770 29 $1,050 6/08 7,500 34 $1,630 7/08 8,895 38 $1,891 8/08 7,575 37 $1,733 9/08 8,265 32 $1,731 10/08 7,890 31 $1,221 11/08 15,180 26 $2,320 12/08 8,910 24 $1,277 Totals 108,240 38 Max $17,501
Figure 1
Electricity Usage Profile
Lawrenceville Fire Co.Electric Usage Profile
January through December of 2008
0
2,000
4,000
6,000
8,000
10,000
12,000
14,000
16,000
Jan
Feb Mar AprMay Ju
n Jul
Aug Sep OctNov Dec
Month
Usa
ge (k
Wh)
0
5
10
15
20
25
30
35
40
45
Dem
and
(kW
)
2008 KWH 2008 KW

Lawrence Township Lawrenceville Fire Co. Energy Audit
June 29, 2009 Page 9 of 31
Table 4 Natural Gas Billing Data
MONTH OF USE CONSUMPTION (THERMS) TOTAL BILL
1/08 1,885.4 $2,602 2/08 1,689.7 $2,496 3/08 1,197.8 $1,894 4/08 463.3 $730 5/08 176.2 $317 6/08 108.4 $206 7/08 116.0 $236 8/08 114.3 $183 9/08 127.7 $192 10/08 303.2 $410 11/08 1,153.1 $1,531 12/08 1,672.1 $2,280 Totals 9,007 $13,078
Figure 2 Natural Gas Usage Profile
Lawrenceville Fire Co.Gas Usage Profile
January through December of 2008
0
200
400
600
800
1000
1200
1400
1600
1800
2000
Jan
Feb
Mar Apr
May Jun Jul
Aug Sep Oct
Nov Dec
Month
Ther
ms
Utility Usage

Lawrence Township Lawrenceville Fire Co. Energy Audit
June 29, 2009 Page 10 of 31
B. Energy Use Index (EUI) The Oak Ridge National Laboratory (ORNL) Buildings Technology Center under a contract with the U.S. Department of Energy maintains a Benchmarking Building Energy Performance Program. Their website allows the user to determine how well the client’s building energy use intensity (EUI) compares with similar facilities throughout the U.S. and in your specific region or state.
FootageSquareBuildinghkBtuinUsageGashkBtuinUsageElectricEUIBuilding )//( +
=
Electric = ((108,240 kWh) * (1000 W/kW) * (3.414 Btu/h / 1 W))/ (1000 Btu/h / 1 kBtu/h)
= 369,531 kBtu/h Gas = ((9,007 therms) * (100,000 Btu/h / 1 Therm)) / (1000 Btu/h / 1 kBtu/h) = 900,700 kBtu/h
SFhkBtu
SFhkBtuhkBtuEUIBuilding
845,15/231,270,1
845,15)/700,900/531,369(=
+=
Lawrenceville Fire Company EUI = 80.17 kBtu/SF
Figure 3 Energy Use Intensity Distributions:
EUI = 80.17

Lawrence Township Lawrenceville Fire Co. Energy Audit
June 29, 2009 Page 11 of 31
C. EPA Energy Benchmarking System The United States Environmental Protection Agency (EPA) in an effort to promote energy management has created a system for benchmarking energy use amongst various end users. The benchmarking tool utilized for this analysis is entitled Portfolio Manager. The Portfolio Manager tool allows you to track and assess energy consumption via the template forms located on the ENERGY STAR website (www.energystar.gov). The importance of benchmarking for local government municipalities is becoming more important as utility costs continue to increase and more emphasis is being placed throughout multiple arenas on carbon reduction, greenhouse gas emissions and other environmental impacts. In accordance with the Local Government Energy Audit Program, CEG has created an Energy Start account for the municipal in order to allow the municipal access to monitoring their yearly energy usage as it compares to facilities of similar type. The account can be accessed at the following address, the username and password are also listed below:
https://www.energystar.gov/istar/pmpam/index.cfm?fuseaction=login.login
Username: Lawrencetwp Password: lgeaceg2009
Specific building types are detailed on the ENERGY STAR website. Non-typical buildings are covered by an “Other” category. The Lawrence Township Fire Houses fall under this “Other” category. The “Other” category is used if your building type or a section of the building is not represented by one of the specific categories. An Energy Performance Rating cannot be calculated if more then 10% of a building is classified as “Other.” The majority of the Public Works Garage would be classified as “Other” and therefore cannot be given an Energy Performance Rating. The EUI calculated in the previous section is a good indicator of the energy performance of the Lawrence Road Company in the absence of the Energy Star Portfolio Manager Program. The EUI distribution, figure 3, is specific for fire houses and police stations. The fire company has an EUI of 80.17 which is low for this type of facility. The lower the EUI the less energy the facilty uses per squarefoot. A low EUI indicates a more efficient building. The facility runs very efficiently for its size due to the low permanant staff size stationed at the facility on a day to day basis. There is still room for improvement making the facility more energy efficient and saving more on the utility costs.

Lawrence Township Lawrenceville Fire Co. Energy Audit
June 29, 2009 Page 12 of 31
V. FACILITY DESCRIPTION
Lawrence Township’s Lawrenceville Fire Company consists of offices, engine bays, a hall and members lounge and meeting area; totaling approximately 15,845 SF. The engine garage is a metal frame building with well insulated walls and ceiling. The remainder of the building making up the offices, lounge and hall is a two story and constructed of typical brick and block construction. The first section of the facility was built in 1964 with an addition in 1988. The Fire House is normally occupied by a few people for 8 hours a day during the week. Lawrenceville is a volunteer fire company that only fully operates when an emergency occurs in their response area. Additionally, there is a fire hall that is rented out once or twice a month throughout the year.
Heating System
The two story office and lounge area is heated by York air handling units with natural gas fired furnaces. Forced hot air is ducted throughout this part of the facility. There are ten (10) of these units in various sizes serving the space. All units are individually ducted to their point of termination.
The engine bay is heated by six (6) Modine Gas fired furnaces that are ceiling mounted. Three of the units have a 200 MBH capacity and three (3) have a 75 MBH capacity.
The hall of the fire house is heated by horizontal York air handling units located above the drop ceiling. These units serve the heating needs in the space with an electric heating element.
Domestic Hot Water
Domestic hot water needs for the facility are provided by a Bradford White 50 gallon hot water heater. This units has an input of 40 MBh.
Cooling System
The two story office and lounge area is cooled by the same York Air handling units that provide heating for the space. These parts of the building are cooled by multiple air handling units that are ducted throughout the facility. There are ten (10) air handling units in various sizes serving the above mentioned space. Each unit has its own condensing unit located on the exterior of the facility.
The engine room is not air conditioned.
The hall of the fire house is cooled by horizontal, York air handling units mounted above the drop ceiling. These air handling units provide all cooling needs for the space. Condensing units are roof mounted on a 1 story roof adjacent to the hall.

Lawrence Township Lawrenceville Fire Co. Energy Audit
June 29, 2009 Page 13 of 31
Controls System
There are local thermostats located throughout the facility that control the various heating and air conditioning systems. The heating set points were set at 70ºF to maintain a reasonable working temperature throughout the facility. Cooling set points were not observed at the time of the survey. The use of programmable thermostats was absent from the fire house. The heating and air conditioning set points are manually changed based upon the occupancy of the building.
Lighting All areas throughout the facility with the exception of the engine bay are lighted with standard T-12 Fluorescent fixtures. Fixture types vary throughout the facility from 2’x4’ lay-in fixtures to standard 1&2-lamp 4’ fixtures commonly found in storage areas and stairwells. Standard switching is used throughout; no observation of lighting controls was noted. The engine bays are lit with 250 watt Metal Halide High Bay fixtures. There are sixteen (16) of these units in the engine bay and would be ideal candidates for T-5 F-Bay lighting. Standard switching is utilized for operation.

Lawrence Township Lawrenceville Fire Co. Energy Audit
June 29, 2009 Page 14 of 31
VI. MAJOR EQUIPMENT LIST
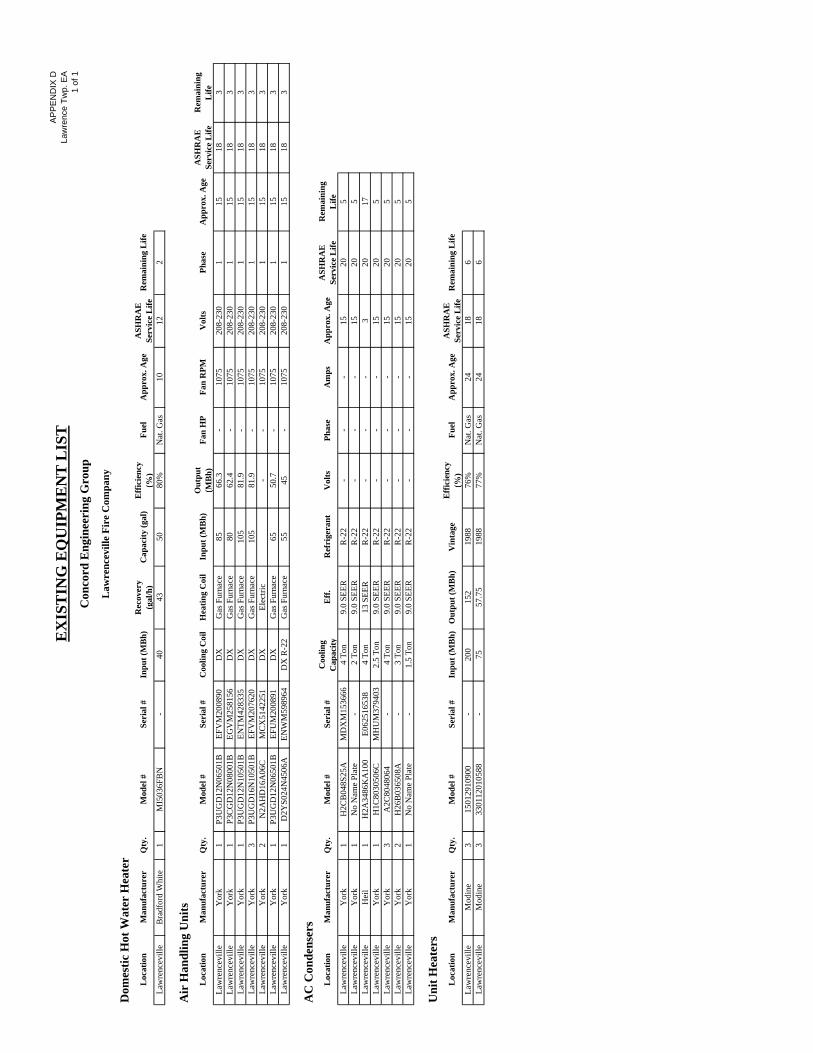
Following the completion of the field survey a detailed equipment list was created. The equipment within this list is considered major energy consuming equipment whose replacement could yield substantial energy savings. Additionally, the list shows the major equipment in the facility and all pertinent information utilized in energy savings calculations. An approximate age was assigned to the equipment if a manufactures date was not shown on the equipment’s nameplate. The ASHRAE service life for the equipment along with the remaining useful life is also shown in the Appendix.
Refer to Appendix D for the Major Equipment List for this facility.
.

Lawrence Township Lawrenceville Fire Co. Energy Audit
June 29, 2009 Page 15 of 31
VII. ENERGY CONSERVATION MEASURES
ECM #1: Lighting Upgrade – Garage / Engine Bay Description: The medium-bay areas which consist of the Engine Bay are poorly lit with a standard Metal Halide system that is plagued by flickering, dim light and distracting humming from the existing ballasts. The existing inefficient lighting system is antiquated and not providing adequate lighting levels for the personnel to work efficiently. CEG recommends upgrading to an energy-efficient T-5 lighting system that includes new lighting fixtures with electronic ballasts. The T-5 HO (HO meaning High Output) lamps are rated for 30,000 hours versus the 10,000 hours of the Metal Halide lamps so there would be a savings in replacement cost and labor. The operating hours of this portion of the facility are approximately 2080 hours per year. In addition, the T-5 HO lamps have better lighting quality and lumen maintenance. This measure replaces all the Metal Halide fixtures in the Engine Bay with a well-designed T-5 lighting system. Energy Savings Calculations: A detailed Investment Grade Lighting Audit can be found in Appendix E, Line No. 1 that outlines the proposed retrofits, costs, savings, and payback periods. NJ Smart Start® Program Incentives are calculated as follows: From Appendix C, the replacement of a Metal Halide fixture to a T-5 or T-8 HO fixture warrants the following incentive: $50 per fixture. Actual incentive value may vary pending application review.
( )150$#StartSmart ×=® fixturesHalideMetalofIncentive
( ) 800$50$16StartSmart =×=® Incentive A detailed maintenance savings calculation can be found in Appendix F. The calculation details the estimated cost of the metal halide system as well as the T5HO system.

Lawrence Township Lawrenceville Fire Co. Energy Audit
June 29, 2009 Page 16 of 31
Energy Savings Summary:
ECM #1 - ENERGY SAVINGS SUMMARY Installation Cost ($): $4,800 NJ Smart Start Equipment Incentive ($): ($800) Maintenance Savings ($): ($288) Net Installation Cost ($): $3,712 Total Energy Savings ($ / yr): $593.05 Simple Payback (yrs): 6.3

Lawrence Township Lawrenceville Fire Co. Energy Audit
June 29, 2009 Page 17 of 31
ECM #2: Lighting Upgrade – Office / Lounge and Hall Description: New fluorescent lamps and ballasts are available as direct replacements for the existing lamps and ballasts. A simple change from the old to the new can provide substantial savings. A typical drop-ceiling lay in fixture with four, 4-foot lamps (34 Watt lamps) has a total wattage of about 154 Watts. By retrofitting with new lamps, reflector and electronic ballasts the total wattage would be reduced to about 91 Watts per fixture and the space light levels and light quality would increase by about 15% and 35%, respectively. CEG recommends a replacement of the existing fixtures containing T12 lamps and magnetic ballasts with fixtures containing T8 lamps and electronic ballasts. The new energy efficient, T8 fixtures will provide adequate lighting and will save the Owner on electrical costs due to the better performance of the electronic ballasts. In addition to functional cost savings, the fixture replacement will also provide operational cost savings. The operational cost savings will be realized through the lesser number of lamps that will be required to be replaced per year. The expected lamp life of a T8 lamp, approximately 30,000 burn-hours, in comparison to the existing T12 lamps, approximately 20,000 burn-hours, will provide the Owner with fewer lamps to replace per year. Based on the operating hours of this portion of the facility, approximately 2080 hours per year, the Owner will be changing approximately 33% less lamps per year. Energy Savings Calculations: A detailed Investment Grade Lighting Audit can be found in Appendix E that outlines the proposed retrofits, costs, savings, and payback periods. This ECM also includes replacing all incandescent lamps with their compact fluorescent equivalent. NJ Smart Start® Program Incentives are calculated as follows: From Appendix C, the replacement of a T-12 fixture to a T-5 or T-8 fixture warrants the following incentive: T-5 or T-8 (1-2 lamp) = $25 per fixture; T-5 or T-8 (3-4 lamp) = $30 per fixture.
( ) ( )30$43#25$21#StartSmart ×−+×−=® fixtureslampoffixtureslampofIncentive
( ) ( ) 850,2$30$8025$18StartSmart =×+×=® Incentive Maintenance Savings are calculated as follows:
( ) LaboronInstallatilampperreductionlampsofSavingsenanceMa +××= $%#int
( ) ( ) ( ) 760,1$8020$00.2$%2532043int =×+××=− reductionfixtureslampSavingsenanceMa
( ) ( ) ( ) 216$920$00.2$%503621int =×+××=− reductionfixtureslampSavingsenanceMa

Lawrence Township Lawrenceville Fire Co. Energy Audit
June 29, 2009 Page 18 of 31
Energy Savings Summary:
ECM #2 - ENERGY SAVINGS SUMMARY Installation Cost ($): $12,974 NJ Smart Start Equipment Incentive ($): ($2,850) Maintenance Savings ($): ($1,976) Net Installation Cost ($): $8,148 Total Energy Savings ($ / yr): $3,381 Simple Payback (yrs): 2.4

Lawrence Township Lawrenceville Fire Co. Energy Audit
June 29, 2009 Page 19 of 31
ECM #3: Lighting Controls – Office / Lounge Description: In some areas the lighting is left on unnecessarily. Many times this is due to the idea that it is better to keep the lights on rather than to continuously switch them on and off. The on/off dilemma was studied and it was found that the best option is to turn the lights off whenever possible. Although this does reduce the lamp life, the energy savings far outweigh the lamp replacement costs. The cutoff for when to turn the lights off is around two minutes. If the lights can be off for only a two minute interval, then it pays to shut them off.
Lighting controls come in many forms. Sometimes an additional switch is all it would take. Occupancy sensors detect motion and will switch the lights on when the room is occupied. They can either be mounted in place of the current wall switch, or they can be mounted on the ceiling to cover large areas. Lastly, photocells are a lighting control that sense light levels and will turn the lights off when there is adequate daylight. These are mostly used outside, but they are becoming much more popular in energy-efficient office designs as well. To determine an estimated savings for lighting controls, we used ASHRAE 90.1-2004 (NJ Energy Code). Appendix G of the referenced standard, states that occupancy sensors have a 10% power adjustment factor for daytime occupancies for buildings over 5,000 SF. CEG recommends the installation of dual technology occupancy sensors in all areas of the facility other then the Engine Garage and the Hall. (Approximately 7,922 SF). Energy Savings Calculations:
From Appendix E of this report, we calculated the lighting power density (Watts/ft2) of the existing offices, locker rooms, storage rooms, small shops, etc. to be 1.80 Watts/SF. Ten percent of this value is the resultant energy savings due to installation of occupancy sensors: Savings = 10% x 1.80 Watts/SF x 7,922 SF x 2,080 hrs/yr. = 2965 kWh x $0.162/kWh
Savings = $480 / yr
Installation cost per dual-technology sensor (Basis: Sensorswitch or equivalent) is $75/unit including material and labor. The SmartStart Buildings® incentive is $20 per control which equates to an installed cost of $55/unit. Total number of rooms to be retrofitted is 18. Total cost to install sensors is $55/unit x 18 units = $990.

Lawrence Township Lawrenceville Fire Co. Energy Audit
June 29, 2009 Page 20 of 31
Energy Savings Summary:
ECM #3 - ENERGY SAVINGS SUMMARY Installation Cost ($): $1,350 NJ Smart Start Equipment Incentive ($): ($360) Maintenance Savings ($): ($0) Net Installation Cost ($): $990 Total Energy Savings ($ / yr): $480 Simple Payback (yrs): 2.06

Lawrence Township Lawrenceville Fire Co. Energy Audit
June 29, 2009 Page 21 of 31
ECM #4: AHU Replacement – Hall Units Description: This ECM will replace the two (2) existing air handling units serving the hall area. The current two (2) York air handling units use an electric heating coil to condition the air in the space. Due to the presence of natural gas on site CEG recommends the replacement of these electric units with gas fired units similar to the units serving the remainder of the facility. Electric heating elements are technically 100% efficient but due to the high cost of electric these units become incredibly expensive to operate. The prices can be compared on a $/MBtu basis where electricity costs $0.047 /MBtu versus natural gas at $0.0129 /MBtu. The following calculations show the potential energy savings from this ECM. Replacement of the existing AHU’s with York 80 MBH Natural Gas input, 90% + thermal efficiency or equivalent was used for the basis of design. Energy Savings Calculations:
Heating Degree Days = 5,325°F – day/yr.
Total room area to be retrofitted = 5,220 SF (Assuming a 60’x 30’ room with a 9’ ceiling)
Uavg. = 0.0714 Btu/hr – ft2 - °F (Average U-Value of the walls ceiling and floor)
Annual Energy Savings (Heating) = 24 hrs/day * Room Area * (Uavg) * HDD Annual Energy Savings (Heating) = 24 hrs/day * 5,220 Sf * (0.0714) * 5,325 HDD Annual Energy Savings (Heating) = 47,632 MBTu Electric Heating Cost = 47,632MBTu * $0.047 /MBtu = $2,238 Natural Gas Heating Cost = 47,632MBTu * $0.0129 /MBtu = $614 Heating Savings = $2,238 - $614 = $1,624

Lawrence Township Lawrenceville Fire Co. Energy Audit
June 29, 2009 Page 22 of 31
Energy Savings Summary:
ECM #4 - ENERGY SAVINGS SUMMARY Installation Cost ($): $9,500 NJ Smart Start Equipment Incentive ($): ($600) Maintenance Savings ($): ($0) Net Installation Cost ($): $8,900 Total Energy Savings ($ / yr): $1,624 Simple Payback (yrs): 5.48

Lawrence Township Lawrenceville Fire Co. Energy Audit
June 29, 2009 Page 23 of 31
ECM #5: Air Conditioning Upgrade – Condensing Units Replacement
Description: Nine (9) of the ten (10) air handling units providing air conditioning for the interior spaces have outdated inefficient condensing units. These units are at the end of their expected service life and are very inefficient. As outlined in Chapter 36 of the 2007 ASHRAE Applications Handbook, the estimated service life for air-cooled condensers and coils is 20 years. This energy conservation measure would replace the evaporator coil in each air handler unit along with a new high-efficiency condenser unit. Basis of design for replacement is York LX series condensing units and matching cased evaporator coils or equivalent. Energy Savings Calculations:
UnitsofNoCoolingofHrsFactorLoadAvgSEEROldSEERNew
BtuTonBTUCoolingTonsSavingsEnergy ...
)()1000()/000,12((
×××−
÷×=
Existing Condensing Units Rated Capacity = Various Tonnage See Appendix D Condenser Unit Efficiency = 9.0 SEER Cooling Season Hrs. of Operation = 1,800 hrs/yr. Average Cost of Electricity - $0.162/kWh
Proposed High-Efficiency Condensing Unit Rated Capacity = Various Tonnage See Appendix D New Condenser Unit Efficiency = 14.5 SEER Example For One (1) 4-Ton Unit Replacement
1800,115.0
)95.14()1000()/000,124((
×××−
÷×=
SEERSEERBtuTonBTUTonsSavingsEnergy
Cost Savings = 2,356 kWh x $0.162/kWh = $382 / Yr. Refer to Appendix B for the detailed cost breakdown of all condensing units and their associated installation costs.

Lawrence Township Lawrenceville Fire Co. Energy Audit
June 29, 2009 Page 24 of 31
Energy Savings Summary:
ECM #5 - ENERGY SAVINGS SUMMARY Installation Cost ($): $56,813 NJ Smart Start Equipment Incentive ($): ($2,081) Maintenance Savings ($): ($0) Net Installation Cost ($): $54,732 Total Energy Savings ($ / yr): $2,671 Simple Payback (yrs): 20.5

Lawrence Township Lawrenceville Fire Co. Energy Audit
June 29, 2009 Page 25 of 31
ECM #6: Programmable Thermostat Description: Throughout the building there are standard, manual wall thermostats for various HVAC units and local control with adjustable settings on the unit ventilators. These old, pneumatic indoor temperature controls are inaccurate due to temperature drift, age, and not having been re-calibrated. These units also do not have night time setback features. This energy conservation measure would replace the various HVAC unit thermostats and unit ventilator local controls with programmable 7-day thermostats and night time setback control. Based on the following setpoints,
Occupied Heating = 70° F Occupied Cooling = 76° F Unoccupied Heating = 60° F Unoccupied Cooling = 85° F
CEG recommends replacement of the existing remote thermostats with Honeywell RTH7500D 7-day programmable thermostat or equivalent. Energy Savings Calculations: The energy savings of a 7-day programmable thermostat was calculated by using Energy Star Life Cycle Cost Estimate software for qualified programmable thermostats. The referenced calculator can be found at www.energystar.gov. Refer to Appendix G for the detailed calculation. CEG recommends the installation of one (1) programmable thermostat per air handling unit, total of ten (10) units. Calculated energy savings = $313/Unit Cost of a 7-day programmable thermostat (installed) = $180/unit Simple Payback = 0.6 Years Energy Savings Summary:
ECM #6 - ENERGY SAVINGS SUMMARY Installation Cost ($): $1,800 NJ Smart Start Equipment Incentive ($): ($0) Maintenance Savings ($): ($0) Net Installation Cost ($): $1,800 Total Energy Savings ($ / yr): $3,130 Simple Payback (yrs): 0.6

Lawrence Township Lawrenceville Fire Co. Energy Audit
June 29, 2009 Page 26 of 31
VIII. RENEWABLE/DISTRIBUTED ENERGY MEASURES Globally, renewable energy has become a priority affecting international and domestic energy policy. The State of New Jersey has taken a proactive approach, and has recently adopted in its Energy Master Plan a goal of 30% renewable energy by 2020. To help reach this goal New Jersey created the Office of Clean Energy under the direction of the Board of Public Utilities and instituted a Renewable Energy Incentive Program to provide additional funding to private and public entities for installing qualified renewable technologies. A renewable energy source can greatly reduce a building’s operating expenses while producing clean environmentally friendly energy. CEG has assessed the feasibility of installing renewable energy technologies for Lawrence Township, and concluded that there is potential for solar energy generation. Solar energy produces clean energy and reduces a building’s carbon footprint. This is accomplished via photovoltaic panels which will be mounted on all south and southwestern facades of the building. Flat roof, as well as sloped areas can be utilized; flat areas will have the panels turned to an optimum solar absorbing angle. (A structural survey of the roof would be necessary before the installation of PV panels is considered). Parking lots can also be utilized for the installation of a solar array. A truss system can be installed that is high enough to park a vehicle under the array, this way no parking lot area is lost. The state of NJ has instituted a program in which one Solar Renewable Energy Certificate (SREC) is given to the Owner for every 1000 kWh of generation. SREC’s can be sold anytime on the market at their current market value. The value of the credit varies upon the current need of the power companies. The average value per credit is around $350, this value was used in our financial calculations. This equates to $0.35 per kWh generated. CEG has reviewed the existing area of the building and its grounds for the building being audited for the purposes of determining the potential for the installation of a PV system. An area of 1,650 S.F. can be utilized for the PV system in the Fire House’s parking lot. A depiction of the area utilized is shown in Appendix H. Using this square footage it was determined that a system size of 25 kilowatts could be installed. A system of this size has an estimated kilowatt hour production of 44,087 KWh annually, reducing the overall utility bill by 40% percent. A detailed financial analysis can be found in Appendix H. This analysis illustrates the payback of the system over a 25 year period. The eventual degradation of the solar panels and the price of accumulated SREC’s are factored into the payback. Wind energy production is another option available through the Renewable Energy Incentive Program. Small wind turbines can be utilized to produce clean energy on a per building basis. Cash incentives are available per kWh of electric usage. CEG has reviewed the applicability of wind energy for Lawrence Township and has determined it is not a viable option. Low average wind speeds for the area are not adequate for wind turbine generation. Typical wind turbines start producing energy at 8 mph wind speeds. Lawrence Township averages 4 mph wind speeds making this application impractical.

Lawrence Township Lawrenceville Fire Co. Energy Audit
June 29, 2009 Page 27 of 31
IX. ENERGY PURCHASING AND PROCUREMENT STRATEGY Load Profile: Load Profile analysis was performed to determine the seasonal energy usage of the facility. Irregularities in the load profile will indicate potential problems within the facility. Consequently based on the profile a recommendation will be made to remedy the irregularity in energy usage. For this report, the facility’s energy consumption data was gathered in table format and plotted in graph form to create the load profile. Refer to Section IV, Figures 1 and 2 included within this report to reference the respective electricity and natural gas usage load profile for January 2008 through December 2008. Electricity: Section IV, Figure 1 demonstrates a typical cooling profile, (June - August), however, there are kilowatt-hour peaks in November and December that represent more hours the facility is being used during these times. The majority of the utility consumption within the facility is steady throughout the year which creates a flat base-load. The base-load shaping is important because a flat consumption profiles will yield more competitive pricing. Natural Gas: Section IV, Figure 2 demonstrates a typical heating load (November –March), and complimentary cooling load (April –October). Consequently there is a clear separation between summer and winter loads consistent with Wholesale Energy Pricing. Heating loads carry a much higher average cost because of the higher demand for natural gas during the winter. Tariff Analysis: Electricity: Lawrence Township (LT) receives electrical service through Public Service Electric and Gas Company (PSE&G) on a GLP or ED (General Lighting and Power) rate. This utility tariff is for delivery service for general purposes at secondary distribution voltages. The rate schedule has a Delivery Charge, Societal Benefits Charge, Non-utility Generation Charge, Securitization Charge, System Control Charge, Customer Account Services Charge, Standby Fee, Base Rate Distribution Adjustment Charge, Solar Pilot Recovery Charge and RGGI Charge. The customer can elect to have the Commodity Charge serviced through the utility or by a Third Party Supplier (TPS).

Lawrence Township Lawrenceville Fire Co. Energy Audit
June 29, 2009 Page 28 of 31
Natural Gas: LT receives natural gas service through Public Service Electric and Gas Company (PSE&G) on a GSGH utility rate class, when not receiving commodity by a Third Party Supplier. This utility tariff is for firm delivery service for general purposes. This rate schedule has a Delivery Charge, Balancing Charge, Societal Benefits Charge, Realignment Adjustment Charge, Margin Adjustment Charge, RGGI Charge and Customer Account Service Charge. The customer can elect to have the Commodity Charge serviced through the utility or by a Third Party Supplier (TPS). It is pertinent to note, should the TPS not deliver, the customer may receive service from PSE&G under Emergency Sales Service. Emergency Sales Service carries an extremely high penalty cost of service. Imbalances occur when Third Party Suppliers are used to supply natural gas, full-delivery is not made, and when a new supplier is contracted or the customer returns to the utility. It is important when utilizing a Third Party Supplier, that an experienced regional supplier is used. Otherwise, imbalances can occur, jeopardizing economics and scheduling. Recommendations: CEG recommends a global approach that will be consistent with all facilities within Lawrence Township. CEG’s primary observation is seen in Natural Gas. The average price of commodity per dth (dekatherm) for all buildings is $.103. Energy commodities are among the most volatile of all commodities, however at this point and time, energy is extremely competitive. Lawrence could see significant savings if it were to take advantage of these current market prices quickly, before energy increases. Based on last year’s historical consumption January – December 2008, and current natural gas rates, estimated savings of over $14,000 per year are seen. (Note: Savings were calculated using Lawrence Township Average Annual Consumption and a variance of $.038 / therm utilizing a fixed one-year commodity contract). CEG recommends aggregating the entire natural gas load to gain the most optimal energy costs. CEG recommends advisement for alternative sourcing and supply of energy on a “managed approach”. CEG’s secondary recommendation coincides with Lawrence Township’s electric costs. CEG recognized the electric cost is not competitive with current market prices. Based on the current market, Lawrence Township is paying approximately $.0344 per unit above market in the PSE&G territory, and CEG recommends further advisement on these prices. Lawrence Township should also consider procuring energy on its own. CEG recommends alternative sourcing strategies. CEG recommends that Lawrence Township schedule a meeting with their current utility providers to review their utility charges and current tariff structures for electricity and natural gas. This meeting would provide insight regarding alternative procurement options that are currently available. Through its meeting with the Local Distribution Company (LDC), Lawrence Township will learn more about the competitive supply process. Lawrence Township can acquire a list of approved Third Party Suppliers from the New Jersey Board of Public Utilities website at www.nj.gov/bpu, and should also consider using a billing-auditing service to further analyze the utility invoices, manage the data and use the data to manage ongoing demand-side

Lawrence Township Lawrenceville Fire Co. Energy Audit
June 29, 2009 Page 29 of 31
management projects. Furthermore, CEG recommends special attention to credit mechanisms, imbalances, balancing charges and commodity charges when meeting with their utility representative. In addition, Lawrence Township should also ask the utility representative about alternative billing options. Some utilities allow for consolidated billing options when utilizing the service of a Third Party Supplier.

Lawrence Township Lawrenceville Fire Co. Energy Audit
June 29, 2009 Page 30 of 31
X. INSTALLATION FUNDING OPTIONS CEG has reviewed various funding options for the Owner to utilize in subsidizing the costs for installing the energy conservation measures noted within this report. Below are a few alternative funding methods:
A. Performance Contracting – Performance Contracting is an agreement between a
local government and a private energy services company (ESCO) that uses future energy savings to pay for the entire cost of a building’s energy efficiency retrofits/upgrades. A local government contracts with an ESCO, then the ESCO purchases, installs and maintains energy-saving equipment. According to State Assembly Bill # 1185, a local government may enter into guaranteed energy savings contracts within a 15-year period. An independent energy auditor must prepare the investment grade audit and perform the measurement/verification of the savings.
B. Municipal Bonds – Municipal bonds are a bond issued by a city or other local government, or their agencies. Potential issuers of municipal bonds include cities, counties, redevelopment agencies, school districts, publicly owned airports and seaports, and any other governmental entity (or group of governments) below the state level. Municipal bonds may be general obligations of the issuer or secured by specified revenues. Interest income received by holders of municipal bonds is often exempt from the federal income tax and from the income tax of the state in which they are issued, although municipal bonds issued for certain purposes may not be tax exempt.
C. County Improvement Authority – Several local governments in New Jersey have received funding for energy projects through their County Improvement Authority.
CEG recommends the Owner review the use of the above-listed funding options in addition to utilizing their standard method of financing for facilities upgrades in order to fund the proposed energy conservation measures.

Lawrence Township Lawrenceville Fire Co. Energy Audit
June 29, 2009 Page 31 of 31
XI. ADDITIONAL RECOMMENDATIONS The following recommendations include no cost/low cost measures, Operation & Maintenance (O&M) items, and water conservation measures with attractive paybacks. These measures are not eligible for the Smart Start Buildings incentives from the office of Clean Energy but save energy none the less.
A. Chemically clean the condenser and evaporator coils periodically to optimize efficiency. Poorly maintained heat transfer surfaces can reduce efficiency 5-10%.
B. Maintain all weather stripping on windows and doors.
C. Use cog-belts instead of v-belts on all belt-driven fans, etc. These can reduce electrical consumption of the motor by 2-5%.
D. Reduce lighting in specified areas where the foot candle levels are above 70 in private offices and above 30 in corridor, lobbies, etc.
E. Provide more frequent air filter changes to decrease overall fan horsepower requirements and maintain better IAQ.
F. Recalibrate existing sensors serving the office spaces
G. Install a Vending Miser system to turn off the vending machines in the lunch room when not in use.
H. Clean all light fixtures to maximize light output.
I. Confirm that outside air economizers on the rooftop units that serve the Office Areas are functioning properly to take advantage of free cooling.
App
endi
x A
Page
1 o
f 2
Ele
ctri
c C
ost S
umm
ary
PSE
&G
- M
D
Law
renc
evill
e Fi
re C
o.A
ccou
nt #
62
878
221
5 5
Met
er #
2
7800
5314
Mon
thJa
n-08
Feb-
08M
ar-0
8A
pr-0
8M
ay-0
8Ju
n-08
Jul-0
8A
ug-0
8Se
p-08
Oct
-08
Nov
-08
Dec
-08
Tot
alB
illin
g D
ays
3128
3130
3130
3131
3031
3031
0K
WH
11,6
109,
855
7,89
06,
900
7,77
07,
500
8,89
57,
575
8,26
57,
890
15,1
808,
910
108,
240
KW
2826
2524
2934
3837
3231
2624
38M
axM
onth
ly L
oad
Fact
or55
%56
%43
%40
%36
%30
%31
%28
%36
%35
%80
%49
%43
%El
ectri
c D
eliv
ery,
$38
2$
335
$
28
3$
258
$
29
7$
605
$
68
8$
635
$
60
0$
306
$
57
0$
321
$
$5
,280
Del
iver
y $/
kwh
$0.0
33$0
.034
$0.0
36$0
.037
$0.0
38$0
.081
$0.0
77$0
.084
$0.0
73$0
.039
$0.0
38$0
.036
$0.0
49El
ectri
c Su
pply
, $1,
056
$
940
$
74
6$
648
$
75
3$
1,02
6$
1,
203
$
1,09
9$
1,
131
$
916
$
1,
750
$
955
$
$1
2,22
1Su
pply
$/k
wh
$0.0
91$0
.095
$0.0
95$0
.094
$0.0
97$0
.137
$0.1
35$0
.145
$0.1
37$0
.116
$0.1
15$0
.107
$0.1
13To
tal C
ost,
$$1
,438
$1,2
75$1
,029
$906
$1,0
50$1
,630
$1,8
91$1
,733
$1,7
31$1
,221
$2,3
20$1
,277
$17,
501
$/K
WH
$0.1
24$0
.129
$0.1
30$0
.131
$0.1
35$0
.217
$0.2
13$0
.229
$0.2
09$0
.155
$0.1
53$0
.143
$0.1
62
2008

App
endi
x A
Page
2 o
f 2
Sum
mar
y of
Nat
ural
Gas
Cos
tPS
E&
G -
GSG
H M
ulti
Fam
ily
Law
renc
evill
e Fi
re C
o.A
ccou
nt #
62
878
221
5 5
Met
er #
2597
634
Mon
thJa
n-08
Feb-
08M
ar-0
8A
pr-0
8M
ay-0
8Ju
n-08
Jul-0
8A
ug-0
8Se
p-08
Oct
-08
Nov
-08
Dec
-08
Tot
alB
illin
g D
ays
3128
3130
3130
3131
3031
3031
Tota
l MC
F1,
829
1,64
01,
162
449
171
105
112
110
123
293
1,11
51,
620
8,73
2B
TU F
acto
r1.
031.
031.
031.
031.
031.
031.
031.
041.
031.
031.
031.
0312
Ther
ms (
Bur
ner T
ip)
1885
.416
89.7
1197
.846
3.3
176.
210
8.4
116.
011
4.3
127.
730
3.2
1153
.116
72.1
9007
.0To
tal D
istri
butio
n C
ost
$745
$668
$473
$149
$63
$42
$45
$44
$48
$101
$461
$674
3,51
4C
ost p
er T
herm
$0.3
95$0
.395
$0.3
95$0
.321
$0.3
56$0
.392
$0.3
86$0
.387
$0.3
78$3
7.34
0$0
.400
$0.4
03$0
.390
Tota
l Com
mod
ity C
ost
$1,8
57$1
,827
$1,4
21$5
81$2
54$1
64$1
91$1
39$1
44$3
09$1
,070
$1,6
069,
564
Cos
t per
The
rm$0
.98
$1.0
8$1
.19
$1.2
5$1
.44
$1.5
1$1
.64
$1.2
2$1
.13
$1.0
2$0
.93
$0.9
6$1
.06
Tota
l Cos
t$2
,602
$2,4
96$1
,894
$730
$317
$206
$236
$183
$192
$410
$1,5
31$2
,280
$13,
078
Cos
t per
The
rm$1
.380
$1.4
77$1
.581
$1.5
76$1
.798
$1.9
01$2
.029
$1.6
06$1
.507
$1.3
54$1
.328
$1.3
64$1
.452
.= U
tility
Info
rmat
ion
Not
Pro
vide
d
2008

APPENDIX BPage 1 of 2
Qty Unit Cost $ Material $ Labor $ Total $Lighting Retrofit 16 $300 $200 $100 $4,800Total Cost $200 $100 $4,800Utility Incentive - NJ Smart Start ($50 per fixture) ($800)Total Cost Less Incentive $4,000
Qty Unit Cost $ Material $ Labor $ Total $Lighting Retrofit 153 - $0 $0 $12,974Total Cost $0 $0 $12,974Utility Incentive - NJ Smart Start ($25 per 1-2 lamp fixture; $30 per 3-4 lamp fixture) ($2,850)Total Cost Less Incentive $10,124
* See Appendix E for detailed cost per fixture type.
Qty Unit Cost $ Material $ Labor $ Total $Dual - Technology Sensor 18 $75 $1,350 $0 $1,350Total Cost $1,350 $0 $1,350Utility Incentive - NJ Smart Start ($360)Total Cost Less Incentive ($20 per Sensor) $990
Qty Unit Cost $ Material $ Labor $ Total $Demolish Exist Furnace; Typ. 2 2 $300 $0 $600 $600New Sealed Combustion Hi-Eff Furnace; 2 $2,850 $3,800 $1,900 $5,700York 80 MBH input, 90%+ EfficiencyNew Gas Piping (Est. 150 Ft) LS $2,000 $1,000 $1,000 $2,000PVC Combustion Air & Vent Piping 2 $600 $900 $300 $1,200Total Cost $5,700 $3,800 $9,500Utility Incentive - NJ Smart Start ($300 per Furnace) ($600)Total Cost Less Incentive $8,900
DETAILED COST BREAKDOWN PER ECMCONCORD ENGINEERING GROUP
LAWRENCEVILLE TOWNSHIP FIRE COMPANY
ECM 1 LIGHTING UPGRADE - GARAGE / ENGINE BAY AREA
ECM 2 LIGHTING UPGRADE - OFFICE/LOUNGE AREA
ECM 3 LIGHTING CONTROLS - OFFICE/LOUNGE AREA
ECM 4 AHU REPLACEMENT - HALL UNITS
*Gas Piping is assumed to be routed from Kitchen gas piping

APPENDIX BPage 2 of 2
Qty Unit Cost $ Material $ Labor $ Total $Demolish Exist Evap Coil; Typ. 9 9 $65 $0 $585 $585Demolish Exist Refrig Piping; Typ. 9 9 $200 $0 $1,800 $1,800New Evap Coil, Condensing Unit; 2 $3,525 $2,350 $1,175 $7,050York LX Series 14.5 SEER R-410a 2-TonNew Evap Coil, Condensing Unit; 1 $3,788 $2,525 $1,263 $3,788York LX Series 14.5 SEER R-410a 2.5-TonNew Evap Coil, Condensing Unit; 2 $5,115 $3,410 $1,705 $10,230York LX Series 14.5 SEER R-410a 3-TonNew Evap Coil, Condensing Unit; 4 $5,190 $3,460 $1,730 $20,760York LX Series 14.5 SEER R-410a 4-TonNew Refrigerant Line Sets (Est. 150 Ft) 9 $1,310 $6,120 $5,670 $11,790Condensing Unit Pads 9 $90 $540 $270 $810Total Cost $18,405 $14,198 $56,813Utility Incentive - NJ Smart Start ($73 per ton) ($2,081)Total Cost Less Incentive $54,732
Qty Unit Cost $ Material $ Labor $ Total $Programable T-stat 10 $120 $1,200 $600 $1,800Total Cost $1,200 $600 $1,800Utility Incentive - N/A $0Total Cost Less Incentive $1,800
ECM 5 AIR CONDITIONING UPGRADE - CONDENSING UNITS AND EVAPORATOR COILS
ECM 6 PROGRAMMABLE THERMOSTATS

APPENDIX C Lawrence Twp. Energy Audit
Concord Engineering Group, Inc. 520 BURNT MILL ROAD VOORHEES, NEW JERSEY 08043 PHONE: (856) 427-0200 FAX: (856) 427-6508
SmartStart Building Incentives The NJ SmartStart Buildings Program offers financial incentives on a wide variety of building system equipment. The incentives were developed to help offset the initial cost of energy-efficient equipment. The following tables show the current available incentives as of January, 2009:
Electric Chillers Water-Cooled Chillers $12 - $170 per ton
Air-Cooled Chillers $8 - $52 per ton
Gas Cooling Gas Absorption Chillers $185 - $400 per ton
Gas Engine-Driven Chillers
Calculated through custom measure path)
Desiccant Systems
$1.00 per cfm – gas or electric
Electric Unitary HVAC
Unitary AC and Split Systems $73 - $93 per ton
Air-to-Air Heat Pumps $73 - $92 per ton Water-Source Heat Pumps $81 per ton Packaged Terminal AC &
HP $65 per ton
Central DX AC Systems $40- $72 per ton Dual Enthalpy Economizer
Controls $250
Ground Source Heat Pumps
Closed Loop & Open Loop $370 per ton
Gas Heating
Gas Fired Boilers < 300 MBH $300 per unit
Gas Fired Boilers ≥ 300 - 1500 MBH $1.75 per MBH
Gas Fired Boilers ≥1500 - ≤ 4000 MBH $1.00 per MBH
Gas Fired Boilers > 4000 MBH
(Calculated through Custom Measure Path)
Gas Furnaces $300 - $400 per unit

APPENDIX C Lawrence Twp. Energy Audit
Variable Frequency Drives Variable Air Volume $65 - $155 per hp Chilled-Water Pumps $60 per hp
Compressors $5,250 to $12,500 per drive
Natural Gas Water Heating
Gas Water Heaters ≤ 50 gallons $50 per unit
Gas-Fired Water Heaters >50 gallons $1.00 - $2.00 per MBH
Gas-Fired Booster Water Heaters $17 - $35 per MBH
Premium Motors
Three-Phase Motors $45 - $700 per motor
Prescriptive Lighting T-5 and T-8 Lamps
w/Electronic Ballast in Existing Facilities
$10 - $30 per fixture, (depending on quantity)
Hard-Wired Compact Fluorescent $25 - $30 per fixture
Metal Halide w/Pulse Start $25 per fixture LED Exit Signs $10 - $20 per fixture
T-5 and T-8 High Bay Fixtures $16 - $284 per fixture
Lighting Controls – Occupancy Sensors
Wall Mounted $20 per control Remote Mounted $35 per control Daylight Dimmers $25 per fixture
Occupancy Controlled hi-low Fluorescent Controls $25 per fixture controlled
Lighting Controls – HID or Fluorescent Hi-Bay Controls
Occupancy hi-low $75 per fixture controlled Daylight Dimming $75 per fixture controlled
Other Equipment Incentives
Performance Lighting
$1.00 per watt per SF below program incentive threshold, currently 5%
more energy efficient than ASHRAE 90.1-2004 for New Construction and Complete Renovation
Custom Electric and Gas Equipment Incentives not prescriptive
AP
PE
ND
IX D
Law
renc
e Tw
p. E
A1
of 1
Dom
estic
Hot
Wat
er H
eate
rL
ocat
ion
Man
ufac
ture
rQ
ty.
Mod
el #
Seri
al #
Inpu
t (M
Bh)
Rec
over
y (g
al/h
)C
apac
ity (g
al)
Eff
icie
ncy
(%)
Fuel
App
rox.
Age
ASH
RA
E
Serv
ice
Life
Rem
aini
ng L
ife
Law
renc
evill
eB
radf
ord
Whi
te1
MI5
036F
BN
-40
4350
80%
Nat
. Gas
1012
2
Air
Han
dlin
g U
nits
Loc
atio
nM
anuf
actu
rer
Qty
.M
odel
#Se
rial
#C
oolin
g C
oil
Hea
ting
Coi
lIn
put (
MB
h)O
utpu
t (M
Bh)
Fan
HP
Fan
RPM
Vol
tsPh
ase
App
rox.
Age
ASH
RA
E
Serv
ice
Life
Rem
aini
ng
Life
Law
renc
evill
eY
ork
1P3
UG
D12
N06
501B
EFV
M20
0890
DX
Gas
Fur
nace
8566
.3-
1075
208-
230
115
183
Law
renc
evill
eY
ork
1P3
CG
D12
N08
001B
EGV
M25
8156
DX
Gas
Fur
nace
8062
.4-
1075
208-
230
115
183
Law
renc
evill
eY
ork
1P3
UG
D12
N10
501B
ENTM
4283
35D
XG
as F
urna
ce10
581
.9-
1075
208-
230
115
183
Law
renc
evill
eY
ork
3P3
UG
D16
N10
501B
EFV
M20
7620
DX
Gas
Fur
nace
105
81.9
-10
7520
8-23
01
1518
3La
wre
ncev
ille
Yor
k2
N2A
HD
16A
06C
MC
X51
4225
1D
XEl
ectri
c-
-10
7520
8-23
01
1518
3La
wre
ncev
ille
Yor
k1
P3U
GD
12N
0650
1BEF
UM
2008
91D
XG
as F
urna
ce65
50.7
-10
7520
8-23
01
1518
3La
wre
ncev
ille
Yor
k1
D2Y
S024
N45
06A
ENW
M59
8964
DX
R-2
2G
as F
urna
ce55
45-
1075
208-
230
115
183
AC
Con
dens
ers
Loc
atio
nM
anuf
actu
rer
Qty
.M
odel
#Se
rial
#C
oolin
g C
apac
ityE
ff.
Ref
rige
rant
Vol
tsPh
ase
Am
psA
ppro
x. A
geA
SHR
AE
Se
rvic
e L
ifeR
emai
ning
L
ifeLa
wre
ncev
ille
Yor
k1
H2C
B04
8S25
AM
DX
M15
3666
4 To
n9.
0 SE
ERR
-22
--
-15
205
Law
renc
evill
eY
ork
1N
o N
ame
Plat
e-
2 To
n9.
0 SE
ERR
-22
--
-15
205
Law
renc
evill
eH
eil
1H
2A34
86K
A10
0E0
6251
6538
4 To
n13
SEE
RR
-22
--
-3
2017
Law
renc
evill
eY
ork
1H
1C80
3050
6CM
HU
M37
9403
2.5
Ton
9.0
SEER
R-2
2-
--
1520
5La
wre
ncev
ille
Yor
k3
A2C
8048
064
-4
Ton
9.0
SEER
R-2
2-
--
1520
5La
wre
ncev
ille
Yor
k2
H26
B03
6508
A-
3 To
n9.
0 SE
ERR
-22
--
-15
205
Law
renc
evill
eY
ork
1N
o N
ame
Plat
e-
1.5
Ton
9.0
SEER
R-2
2-
--
1520
5
Uni
t Hea
ters
Loc
atio
nM
anuf
actu
rer
Qty
.M
odel
#Se
rial
#In
put (
MB
h)O
utpu
t (M
Bh)
Vin
tage
Eff
icie
ncy
(%)
Fuel
App
rox.
Age
ASH
RA
E
Serv
ice
Life
Rem
aini
ng L
ife
Law
renc
evill
eM
odin
e3
1501
2910
900
-20
015
219
8876
%N
at. G
as24
186
Law
renc
evill
eM
odin
e3
3301
1201
0588
-75
57.7
519
8877
%N
at. G
as24
186
Law
renc
evill
e Fi
re C
ompa
ny
EX
IST
ING
EQ
UIP
ME
NT
LIS
TC
onco
rd E
ngin
eeri
ng G
roup

AP
PE
ND
IX E
Pag
e 1
of 2
9C08
127
DA
TE
: 05/
20/2
009
Law
renc
e Tw
p. E
nerg
y A
udit
K
WH
CO
ST:
$0.1
62A
ddre
ss:
64 P
hilli
ps A
ve.
Law
renc
e Tw
p.15
,845
EX
IST
ING
LIG
HT
ING
PR
OPO
SED
LIG
HT
ING
SA
VIN
GS
Line
Fixt
ure
No.
Fi
xtur
eY
early
Wat
tsTo
tal
kWh/
Yr
Yea
rlyN
o.
Ret
ro-U
nit
Wat
tsTo
tal
kWh/
Yr
Yea
rlyU
nit C
ost
Tota
lkW
kWh/
Yr
Yea
rlyY
early
No.
Loca
tion
eFix
tseT
ype
Usa
geU
sed
kWFi
xtur
es$
Cos
trF
ixts
rDes
crip
tion
Use
dkW
Fixt
ures
$ C
ost
(IN
STA
LLED
)C
ost
Savi
ngs
Savi
ngs
$ Sa
ving
sPa
ybac
k
1En
gine
Bay
16H
igh-
Bay
Met
al H
alid
e Fi
xtur
e20
8029
24.
6797
17.7
6$1
,574
.28
163-
Lam
p T-
5 H
O
Coo
per F
-Bay
182
2.91
6056
.96
$981
.23
$300
.00
$4,8
00.0
01.
7636
60.8
$593
.05
8.09
2Eq
uipm
ent M
ez.
48'
2-L
ampT
-12
No
Lens
M
agne
tic
Bal
last
2080
210
0.84
1747
.2$2
83.0
58
4' 1
-Lam
p T-
8 C
oope
r Met
alux
, El
ectro
nic
Bal
last
300.
2449
9.2
$80.
87$1
00.0
0$8
00.0
00.
6012
48$2
02.1
83.
96
3En
gine
Bay
St
orag
e5
4' 2
-Lam
p T-
12
N
o Le
ns
Mag
netic
B
alla
st20
8078
0.39
811.
2$1
31.4
15
4' 1
-Lam
p T-
8 C
oope
r Met
alux
, El
ectro
nic
Bal
last
300.
1531
2$5
0.54
$100
.00
$500
.00
0.24
499.
2$8
0.87
6.18
43
4' 2
-Lam
p T-
12
N
o Le
ns
Mag
netic
B
alla
st20
8078
0.23
486.
72$7
8.85
34'
1-L
amp
T-8
Coo
per M
etal
ux,
Elec
troni
c B
alla
st30
0.09
187.
2$3
0.33
$100
.00
$300
.00
0.14
299.
52$4
8.52
6.18
51
8' 2
-Lam
pT-1
2
N
o Le
ns
Mag
netic
B
alla
st20
8021
00.
2143
6.8
$70.
762
4' 1
-Lam
p T-
8 C
oope
r Met
alux
, El
ectro
nic
Bal
last
300.
0612
4.8
$20.
22$1
00.0
0$2
00.0
00.
1531
2$5
0.54
3.96
612
2'x4
' 4-L
amp
T-12
Pr
ism
Len
s
Mag
netic
B
alla
st20
8015
41.
8538
43.8
4$6
22.7
012
2'x4
' 3-L
amp
T-8
Pris
m L
ens
Elec
troni
c B
alla
st
Coo
per M
etal
ux
911.
0922
71.3
6$3
67.9
6$1
40.0
0$1
,680
.00
0.76
1572
.48
$254
.74
6.59
725
120
W In
cand
esce
nt
Hig
h-ha
t20
8012
03.
0062
40$1
,010
.88
2530
W C
FL L
amp
300.
7515
60$2
52.7
2$4
.88
$122
.00
2.25
4680
$758
.16
0.16
8C
oat R
oom
575
W In
cand
esce
nt H
igh -
hat
2080
750.
3878
0$1
26.3
65
18 W
CFL
Lam
p18
0.09
187.
2$3
0.33
$3.7
5$1
8.75
0.29
592.
8$9
6.03
0.20
9M
en's
Roo
m3
2'x4
' 4-L
amp
T-12
Pr
ism
Len
s
Mag
netic
B
alla
st20
8015
40.
4696
0.96
$155
.68
3
2'x4
' 3-L
amp
T-8
Pris
m L
ens
Elec
troni
c B
alla
st
Coo
per M
etal
ux
910.
2756
7.84
$91.
99$1
40.0
0$4
20.0
00.
1939
3.12
$63.
696.
59
10W
omen
's R
oom
32'
x4' 4
-Lam
p T-
12
Pris
m L
ens
M
agne
tic
Bal
last
2080
154
0.46
960.
96$1
55.6
83
2'x4
' 3-L
amp
T-8
Pris
m L
ens
Elec
troni
c B
alla
st
Coo
per M
etal
ux
910.
2756
7.84
$91.
99$1
40.0
0$4
20.0
00.
1939
3.12
$63.
696.
59
11K
itche
n4
2'x4
' 4-L
amp
T-12
Pr
ism
Len
s
Mag
netic
B
alla
st20
8015
40.
6212
81.2
8$2
07.5
74
2'x4
' 3-L
amp
T-8
Pris
m L
ens
Elec
troni
c B
alla
st
Coo
per M
etal
ux
910.
3675
7.12
$122
.65
$140
.00
$560
.00
0.25
524.
16$8
4.91
6.59
Are
a B
ehin
d H
all
92'
x4' 4
-Lam
p T-
12
Pris
m L
ens
M
agne
tic
Bal
last
2080
154
1.39
2882
.88
$467
.03
9
2'x4
' 3-L
amp
T-8
Pris
m L
ens
Elec
troni
c B
alla
st
Coo
per M
etal
ux
910.
8217
03.5
2$2
75.9
7$1
40.0
0$1
,260
.00
0.57
1179
.36
$191
.06
6.59
12En
tranc
e an
d St
airs
22'
x4' 4
-Lam
p T-
12
Pris
m L
ens
M
agne
tic
Bal
last
2080
154
0.31
640.
64$1
03.7
82
2'x4
' 3-L
amp
T-8
Pris
m L
ens
Elec
troni
c B
alla
st
Coo
per M
etal
ux
910.
1837
8.56
$61.
33$1
40.0
0$2
80.0
00.
1326
2.08
$42.
466.
59
Laun
dry
460
W In
cand
esce
nt20
8060
0.24
499.
2$8
0.87
413
W C
FL L
amp
130.
0510
8.16
$17.
52$2
.92
$11.
680.
1939
1.04
$63.
350.
18
Stai
rs
Hal
l
Bui
ldin
g SF
:
INV
EST
ME
NT
GR
AD
E L
IGH
TIN
G A
UD
IT
CO
NC
OR
D E
NE
RG
Y S
ER
VIC
ES
Proj
ect:
City
:
CE
G J
ob #
:"L
awre
ncev
ille
Fire
Com
pany
"
Pag
e 1

AP
PE
ND
IX E
Pag
e 2
of 2
13G
ame
room
1575
W In
cand
esce
nt H
igh-
hat
2080
751.
1323
40$3
79.0
815
18 W
CFL
Lam
p18
0.27
561.
6$9
0.98
$3.7
5$5
6.25
0.86
1778
.4$2
88.1
00.
20
14M
eetin
g R
oom
62'
x4' 4
-Lam
p T-
12
Pris
m L
ens
M
agne
tic
Bal
last
2080
154
0.92
1921
.92
$311
.35
6
2'x4
' 3-L
amp
T-8
Pris
m L
ens
Elec
troni
c B
alla
st
Coo
per M
etal
ux
910.
5511
35.6
8$1
83.9
8$1
40.0
0$8
40.0
00.
3878
6.24
$127
.37
6.59
15H
allw
ay10
2'x4
' 4-L
amp
T-12
Pr
ism
Len
s
Mag
netic
B
alla
st20
8015
41.
5432
03.2
$518
.92
10
2'x4
' 3-L
amp
T-8
Pris
m L
ens
Elec
troni
c B
alla
st
Coo
per M
etal
ux
910.
9118
92.8
$306
.63
$140
.00
$1,4
00.0
00.
6313
10.4
$212
.28
6.59
16O
ffic
e 1
22'
x4' 4
-Lam
p T-
12
Pris
m L
ens
M
agne
tic
Bal
last
2080
154
0.31
640.
64$1
03.7
82
2'x4
' 3-L
amp
T-8
Pris
m L
ens
Elec
troni
c B
alla
st
Coo
per M
etal
ux
910.
1837
8.56
$61.
33$1
40.0
0$2
80.0
00.
1326
2.08
$42.
466.
59
17O
ffic
e 2
22'
x4' 4
-Lam
p T-
12
Pris
m L
ens
M
agne
tic
Bal
last
2080
154
0.31
640.
64$1
03.7
82
2'x4
' 3-L
amp
T-8
Pris
m L
ens
Elec
troni
c B
alla
st
Coo
per M
etal
ux
910.
1837
8.56
$61.
33$1
40.0
0$2
80.0
00.
1326
2.08
$42.
466.
59
18O
ffic
e 3
22'
x4' 4
-Lam
p T-
12
Pris
m L
ens
M
agne
tic
Bal
last
2080
154
0.31
640.
64$1
03.7
82
2'x4
' 3-L
amp
T-8
Pris
m L
ens
Elec
troni
c B
alla
st
Coo
per M
etal
ux
910.
1837
8.56
$61.
33$1
4.00
$28.
000.
1326
2.08
$42.
460.
66
19C
hief
's O
ffic
e4
2'x4
' 4-L
amp
T-12
Pr
ism
Len
s
Mag
netic
B
alla
st20
8015
40.
6212
81.2
8$2
07.5
74
2'x4
' 3-L
amp
T-8
Pris
m L
ens
Elec
troni
c B
alla
st
Coo
per M
etal
ux
910.
3675
7.12
$122
.65
$140
.00
$560
.00
0.25
524.
16$8
4.91
6.59
20W
eigh
t Roo
m9
2'x4
' 4-L
amp
T-12
Pr
ism
Len
s
Mag
netic
B
alla
st20
8015
41.
3928
82.8
8$4
67.0
39
2'x4
' 3-L
amp
T-8
Pris
m L
ens
Elec
troni
c B
alla
st
Coo
per M
etal
ux
910.
8217
03.5
2$2
75.9
7$1
40.0
0$1
,260
.00
0.57
1179
.36
$191
.06
6.59
21M
en's
Roo
m2
2'x4
' 4-L
amp
T-12
Pr
ism
Len
s
Mag
netic
B
alla
st20
8015
40.
3164
0.64
$103
.78
2
2'x4
' 3-L
amp
T-8
Pris
m L
ens
Elec
troni
c B
alla
st
Coo
per M
etal
ux
910.
1837
8.56
$61.
33$1
40.0
0$2
80.0
00.
1326
2.08
$42.
466.
59
22W
omen
's R
oom
22'
x4' 4
-Lam
p T-
12
Pris
m L
ens
M
agne
tic
Bal
last
2080
154
0.31
640.
64$1
03.7
82
2'x4
' 3-L
amp
T-8
Pris
m L
ens
Elec
troni
c B
alla
st
Coo
per M
etal
ux
910.
1837
8.56
$61.
33$1
40.0
0$2
80.0
00.
1326
2.08
$42.
466.
59
23B
unk
Roo
m6
60 W
Inca
ndes
cent
2080
600.
3674
8.8
$121
.31
613
W C
FL L
amp
130.
0816
2.24
$26.
28$2
.92
$17.
520.
2858
6.56
$95.
020.
18
24B
reak
Roo
m4
2'x4
' 4-L
amp
T-12
Pr
ism
Len
s
Mag
netic
B
alla
st20
8015
40.
6212
81.2
8$2
07.5
74
2'x4
' 3-L
amp
T-8
Pris
m L
ens
Elec
troni
c B
alla
st
Coo
per M
etal
ux
910.
3675
7.12
$122
.65
$140
.00
$560
.00
0.25
524.
16$8
4.91
6.59
25R
adio
Roo
m4
2'x4
' 4-L
amp
T-12
Pr
ism
Len
s
Mag
netic
B
alla
st20
8015
40.
6212
81.2
8$2
07.5
74
2'x4
' 3-L
amp
T-8
Pris
m L
ens
Elec
troni
c B
alla
st
Coo
per M
etal
ux
910.
3675
7.12
$122
.65
$140
.00
$560
.00
0.25
524.
16$8
4.91
6.59
Tot
als
164
23.7
749
433.
3$8
,008
.19
169
11.9
724
901.
8$4
,034
.09
$17,
774.
2011
.79
2453
1.5
$3,9
74.1
14.
47
Pag
e 2

Appendix FPage 1 of 2
Insert Logo Here
InputOutput
Annual Maintenance Cost Estimator: Existing System
Customer Information Facility InformationProject Name:
Lawrenceville Fire CompanyContact: Annual Operating Hours 2,080
Chris Cipriani
System Information
Description of System Existing Metal Halide SystemQuantity 16
Type of Lamp HID, 250W MHLamp Life (hrs) 10000
Cost of Lamp 22.44$ Number of Lamps Per Fixture 1
L b C t t S t R l L 95 00$Labor Cost to Spot Relamp per Lamp 95.00$
Annual Lamp Maintenance Cost 352.32$ Quantity of Lamps Replaced Annually 3
Ballast Type Electronic HIDBallast Life (hrs) 80000
Cost of Ballast 80.00$Cost of Ballast 80.00$ Number of Ballasts Per Fixture 1
Labor Cost Change a Ballast 150.00$
Annual Ballast Maintenance Cost 0Quantity of Ballasts Replaced Annually 0
Annual Maintenance Cost of System 352.32$
Note: These are estimated savings only based on a number of variables and assumptions that could change over time. The actual savings derived may be higher or lower.

Appendix FPage 2 of 2
Insert Logo Here
InputOutput
Annual Maintenance Cost Estimator: Existing System
Customer Information Facility InformationProject Name:
Lawrenceville Fire CompanyContact: Annual Operating Hours 2,080
Chris Cipriani
System Information
Description of System T5HO ReplacementQuantity 16
Type of Lamp Fluorescent, T5 HOLamp Life (hrs) 30000
Cost of Lamp 6.20$ Number of Lamps Per Fixture 3
L b C t t S t R l L 35 00$Labor Cost to Spot Relamp per Lamp 35.00$
Annual Lamp Maintenance Cost 123.60$ Quantity of Lamps Replaced Annually 3
Ballast Type Instant Start LPFBallast Life (hrs) 80000
Cost of Ballast 25.00$Cost of Ballast 25.00$ Number of Ballasts Per Fixture 1
Labor Cost Change a Ballast 150.00$
Annual Ballast Maintenance Cost 0Quantity of Ballasts Replaced Annually 0
Annual Maintenance Cost of System 123.60$
Note: These are estimated savings only based on a number of variables and assumptions that could change over time. The actual savings derived may be higher or lower.

Appendix GPage 1 of 2
Number of Units 1 24 Hour Typical Usage Patterns* Initial Cost per ENERGY STAR Unit (retail price) $180 Weekday WeekendInitial Cost per Conventional Unit (retail price) $73 Nighttime Set-Back/Set-Up Hours 16 24Unit Fuel Cost (Cooling) ($/kWh) $0.162 Daytime Set-Back/Set-Up Hours 0 0Unit Fuel Cost (Heating) ($/Therm) $1.29 Hours without Set-Back/Set-Up 8 0
Typical Indoor Temperature w/o Set-Back 70 Typical Indoor Temperature w/o Set-Up 76Nighttime Set-Back Temperature (Average) 60 Nighttime Set-Up Temperature (Average) 85Daytime Set-Back Temperature (Average) 60 Daytime Set-Up Temperature (Average) 85Heating System Type
1 ENERGY STAR Unit(s) 1 Conventional Unit(s)
Cooling System Type
Savings with ENERGY STAR
Annual and Life Cycle Costs and Savings for 1 Programmable Thermostat(s)
*All temperatures are in degrees Fahrenheit. Setpoint is defined as the temperature setting for any given time period. Set-back temperature is defined as the lower setpoint temperature for the energy-savings periods during the heating season, generally nighttime and daytime. Set-up temperature is defined as the higher setpoint temperature for the energy-savings periods during the cooling season, generally nighttime and daytime.
Life Cycle Cost Estimate for
Heating Season* Cooling Season*
Enter your own values in the gray boxes or use our default values.
City
This energy savings calculator was developed by the U.S. EPA and U.S. DOE and is provided for estimating purposes only. Actual energy savings may vary based on use and other factors.
1 ENERGY STAR Qualified Programmable Thermostat(s)
Choose your city from the drop-down menu NJ-Newark
Gas Boiler Central AC
Annual Energy CostsHeating Energy Cost $653 $847 $194
Heating Energy Consumption (MBTU) 51 66 15Cooling Energy Cost $206 $325 $119
Cooling Energy Consumption (MBTU) 4.3 6.8 3Total $859 $1,172 $313
Life Cycle CostsEnergy Costs $9,549 $13,029 $3,480
Heating Energy Costs $7,262 $9,414 $2,152Heating Energy Consumption (MBTU) 758 983 225
Cooling Energy Costs $2,287 $3,615 $1,328Cooling Energy Consumption (MBTU) 65 102 38
Purchase Price for 1 Unit(s) $180 $73 -$107Total $9,729 $13,102 $3,373
Simple payback of initial cost (years) 0.3
Initial cost difference $107Life cycle savings $3,480Net life cycle savings (life cycle savings - additional cost) $3,373Life cycle energy saved (MBTU)-includes both Heating and Cooling 262Simple payback of additional cost (years) 0.3Life cycle air pollution reduction (lbs of CO2) 37,348Air pollution reduction equivalence (number of cars removed from the road for a year) 3Air pollution reduction equivalence (acres of forest) 4Savings as a percent of retail price 1874%
Summary of Benefits for 1 Programmable Thermostat(s)
( ) ( )
Choose your city from the drop-down menu NJ-Newark
Gas Boiler Central AC

Appendix GPage 2 of 2
Category Data Source
Heating/Cooling System EfficienciesGas Furnace 84.0 LBNL 2004, Average of ENERGY STAR and ConventionalGas Boiler 82.5 LBNL 2004, Average of ENERGY STAR and ConventionalOil Furnace 84.0 LBNL 2004, Average of ENERGY STAR and ConventionalOil Boiler 82.5 LBNL 2004, Average of ENERGY STAR and Conventional
Baseline Energy Consumption (MBTU)Gas Furnace 54.1 DOE 2001Gas Boiler 56.1 DOE 2001Oil Furnace 68.7 DOE 2001Oil Boiler 71.2 DOE 2001Central Air Conditioner 9.5 DOE 2001
Reference Degree Days (Heating/Cooling)Gas Furnace 4,255 DOE 2001Gas Boiler 4,255 DOE 2001Oil Furnace 5,339 DOE 2001Oil Boiler 5,339 DOE 2001Central Air Conditioner 1701 DOE 2001
Typical Indoor Temperature (Heating Season) 70 ENERGY STAR Programmable Thermostat Eligibility Criteria. Pre-programmed settings for heating include a morning and evening temperature ≤70°F and an adjustment of at least 8°F (≤62°F) during daytime and nighttime.
Typical Indoor Temperature (Cooling Season) 78 ENERGY STAR Programmable Thermostat Eligibility Criteria. Pre-programmed settings for cooling include a morning and evening temperature ≥78°F and an adjustment of at least 7°F (≥85°F) during daytime and an adjustment of at least 4°F (≥82°F) at nighttime.
Energy PricesNatural Gas ($/Therm) $1.2700 $/Therm EIA 2008Fuel Oil ($/Gallon) $2.6800 $/gal EIA 2008Electric Price (Residential) $0.1059 $/kWh EIA 2008
UsageNighttime Hours 8 Default shipped setting, ENERGY STAR specificationDaytime Hours 10 Default shipped setting, ENERGY STAR specification
Carbon Dioxide Emissions FactorsOil Carbon Emission Factor 161.27 lbs CO2/MBtu EPA 2007Gas Carbon Emission Factor 116.97 lbs CO2/MBtu EPA 2007Electricity Carbon Emission Factor 1.54 lbs CO2/kWh EPA 2008
Thermostat SavingsSavings per Degree of Setback (Heating Season) 3% Industry Data 2004Savings per Degree of Setback (Cooling Season) 6% Industry Data 2004
Thermostat Lifetime 15 years LBNL 2007
Initial CostENERGY STAR Programmable Thermostat $92 Industry Data 2008Conventional Thermostat $73 Industry Data 2008
CO2 EquivalentsAnnual CO2 sequestration per forested acre 9,700 lbs CO2/acre-yr EPA 2007Annual CO2 emissions for "average" passenger car 12,037 lbs CO2/acre-yr EPA 2007
Discount RateCommercial and Residential Discount Rate (real) 4% A real discount rate of 4 percent is assumed, which is roughly
equivalent to the nominal discount rate of 7 percent (4 percent real discount rate + 3 percent inflation rate).
Assumptions for Programmable Thermostats
Value

APP
EN
DIX
HPa
ge 1
of 3
Law
renc
evill
e Fi
re C
ompa
ny P
V F
inan
cial
sSe
lf Fi
nanc
ed 7
0%-2
0 Y
ear
Ter
m-7
.0%
Inte
rest
Rat
e
Tota
l Pro
ject
Cos
t$2
06,4
73Sy
stem
Siz
e (k
W)
25.8
1Ta
x R
ate
0.0%
Util
ity R
ate
($/k
Wh)
$0.1
750
Net
Pro
ject
Cos
t$2
06,4
73U
tility
Rat
e In
flatio
n3.
00%
Perc
ent F
inan
ced
70%
REC
Val
ue ($
/kW
h)$0
.350
Cap
ital O
utla
y$6
1,94
2Te
rm (y
ears
)20
Fina
ncin
g Pr
inci
pal
$144
,531
Rat
e7.
0%
Yea
r0
12
34
56
78
910
1112
Sola
r Gen
erat
ion
(kW
h)44
,087
43,8
6743
,647
43,4
2943
,212
42,9
9642
,781
42,5
6742
,354
42,1
4241
,932
41,7
22U
tility
Rat
e pe
r kW
h $0
.175
$0.1
80$0
.186
$0.1
91$0
.197
$0.2
03$0
.209
$0.2
15$0
.222
$0.2
28$0
.235
$0.2
42
Fede
ral T
ax C
redi
t$0
Cas
h ef
fect
of d
epre
ciat
ion
$0$0
$0$0
$0$0
Avo
ided
Util
ity P
mnt
(fro
m S
olar
Gen
erat
ion)
$7,7
15$7
,907
$8,1
03$8
,305
$8,5
11$8
,723
$8,9
39$9
,162
$9,3
89$9
,623
$9,8
62$1
0,10
7R
even
ue fr
om R
EC S
ale
$15,
430
$15,
353
$15,
277
$15,
200
$15,
124
$15,
049
$14,
973
$14,
898
$14,
824
$14,
750
$14,
676
$14,
603
Subt
otal
$23,
146
$23,
260
$23,
380
$23,
505
$23,
635
$23,
771
$23,
913
$24,
060
$24,
213
$24,
372
$24,
538
$24,
709
Fina
nce
paym
ent
($13
,643
)($
13,6
43)
($13
,643
)($
13,6
43)
($13
,643
)($
13,6
43)
($13
,643
)($
13,6
43)
($13
,643
)($
13,6
43)
($13
,643
)($
13,6
43)
Inte
rest
exp
ense
($10
,117
)($
9,87
0)($
9,60
6)($
9,32
4)($
9,02
1)($
8,69
8)($
8,35
2)($
7,98
1)($
7,58
5)($
7,16
1)($
6,70
7)($
6,22
2)O
pera
tions
& M
aint
enan
ce$0
$0$0
$0$0
$322
$335
$349
$363
$377
$392
$408
Subt
otal
($10
,117
)($
9,87
0)($
9,60
6)($
9,32
4)($
9,02
1)($
8,37
5)($
8,01
6)($
7,63
3)($
7,22
2)($
6,78
4)($
6,31
5)($
5,81
4)
Net
Sav
ings
$13,
029
$13,
390
$13,
774
$14,
181
$14,
614
$15,
396
$15,
896
$16,
427
$16,
991
$17,
589
$18,
223
$18,
896
Taxe
s on
net s
avin
gs (n
o ta
x on
prin
cipl
e pa
ymen
t)$0
$0$0
$0$0
$0$0
$0$0
$0$0
$0N
et sa
ving
s afte
r tax
es$1
3,02
9$1
3,39
0$1
3,77
4$1
4,18
1$1
4,61
4$1
5,39
6$1
5,89
6$1
6,42
7$1
6,99
1$1
7,58
9$1
8,22
3$1
8,89
6Pr
inci
pal P
aym
ent
($3,
526)
($3,
772)
($4,
036)
($4,
319)
($4,
621)
($4,
945)
($5,
291)
($5,
661)
($6,
058)
($6,
482)
($6,
935)
($7,
421)
Net
Cas
h Fl
ow A
fter T
axes
($61
,942
)$9
,503
$9,6
18$9
,737
$9,8
62$9
,993
$10,
451
$10,
605
$10,
766
$10,
933
$11,
107
$11,
287
$11,
475
Cum
ulat
ive
savi
ngs b
efor
e ta
xes
$13,
029
$26,
418
$40,
192
$54,
373
$68,
987
$84,
383
$100
,279
$116
,707
$133
,698
$151
,286
$169
,509
$188
,404
Yea
r13
1415
1617
1819
2021
2223
2425
Sola
r Gen
erat
ion
(kW
h)41
,513
41,3
0641
,099
40,8
9440
,689
40,4
8640
,283
40,0
8239
,882
39,6
8239
,484
39,2
8639
,090
Util
ity R
ate
per k
Wh
$0.2
50$0
.257
$0.2
65$0
.273
$0.2
81$0
.289
$0.2
98$0
.307
$0.3
16$0
.326
$0.3
35$0
.345
$0.3
56
Fede
ral T
ax C
redi
tSu
btot
alA
void
ed U
tility
Pm
nt (f
rom
Sol
ar G
ener
atio
n)$1
0,35
8$1
0,61
5$1
0,87
9$1
1,14
9$1
1,42
7$1
1,71
0$1
2,00
1$1
2,30
0$1
2,60
5$1
2,91
9$1
3,24
0$1
3,56
9$1
3,90
6R
even
ue fr
om R
EC sa
le$1
4,53
0$1
4,45
7$1
4,38
5$1
4,31
3$1
4,24
1$1
4,17
0$1
4,09
9$1
4,02
9$1
3,95
9$1
3,88
9$1
3,81
9$1
3,75
0$1
3,68
1Su
btot
al$2
4,88
8$2
5,07
2$2
5,26
4$2
5,46
2$2
5,66
8$2
5,88
1$2
6,10
1$2
6,32
8$2
6,56
4$2
6,80
7$2
7,05
9$2
7,31
9$2
7,58
7
Fina
nce
paym
ent
($13
,643
)($
13,6
43)
($13
,643
)($
13,6
43)
($13
,643
)($
13,6
43)
($13
,643
)($
13,6
43)
$0$0
$0$0
$0In
tere
st e
xpen
se($
5,70
3)($
5,14
7)($
4,55
2)($
3,91
6)($
3,23
5)($
2,50
6)($
1,72
7)($
893)
$0$0
$0$0
$0O
pera
tions
& M
aint
enan
ce$4
24$4
41$4
59$4
77$4
96$5
16$5
37$5
58$5
81$6
04$6
28$6
53$6
79Su
btot
al($
5,27
8)($
4,70
5)($
4,09
3)($
3,43
8)($
2,73
8)($
1,99
0)($
1,19
0)($
334)
$581
$604
$628
$653
$679
Net
Sav
ings
$19,
609
$20,
367
$21,
171
$22,
024
$22,
929
$23,
891
$24,
911
$25,
994
$27,
145
$27,
411
$27,
687
$27,
972
$28,
267
Taxe
s on
net s
avin
gs (n
o ta
x on
prin
cipl
e pa
ymen
t)$0
$0$0
$0$0
$0$0
$0$0
$0$0
$0$0
Net
savi
ngs a
fter t
axes
$19,
609
$20,
367
$21,
171
$22,
024
$22,
929
$23,
891
$24,
911
$25,
994
$27,
145
$27,
411
$27,
687
$27,
972
$28,
267
Prin
cipa
l Pay
men
t($
7,94
0)($
8,49
6)($
9,09
1)($
9,72
7)($
10,4
08)
($11
,137
)($
11,9
16)
($12
,750
)$0
$0$0
$0$0
Net
Cas
h Fl
ow A
fter T
axes
$11,
669
$11,
871
$12,
080
$12,
297
$12,
522
$12,
754
$12,
995
$13,
244
$27,
145
$27,
411
$27,
687
$27,
972
$28,
267
Cum
ulat
ive
savi
ngs b
efor
e ta
xes
$208
,014
$228
,381
$249
,552
$271
,576
$294
,505
$318
,396
$343
,307
$369
,301
$396
,446
$423
,857
$451
,544
$479
,516
$507
,783
Inte
rnal
Rat
e of
Ret
urn
Afte
r Tax
es17
%N
PV o
f Afte
r Tax
Cas
h Fl
ows
$62,
345
NPV
Dis
coun
t Rat
e8.
00%
Thes
e Fi
gure
s are
est
imat
es fo
r dis
cuss
ion
only
.

PV F
INA
NC
IAL
SC
onco
rd E
ngin
eeri
ng G
roup
APP
EN
IDX
HPa
ge 2
of 3
Law
renc
evill
e Fi
re C
ompa
ny P
V F
inan
cial
sPu
rcha
se
Tota
l Pro
ject
Cos
t$2
06,4
73Sy
stem
Siz
e (k
W)
25.8
1Ta
x R
ate
0.0%
Util
ity R
ate
($/k
Wh)
$0.1
750
Net
Pro
ject
Cos
t$2
06,4
73U
tility
Rat
e In
flatio
n3.
00%
REC
Val
ue ($
/kW
h) y
ear 1
-25
$0.3
50C
apita
l Out
lay
$206
,473
Yea
r0
12
34
56
78
910
1112
Sola
r Gen
erat
ion
(kW
h)44
,087
43,8
6743
,647
43,4
2943
,212
42,9
9642
,781
42,5
6742
,354
42,1
4241
,932
41,7
22U
tility
Rat
e pe
r kW
h $0
.175
$0.1
80$0
.186
$0.1
91$0
.197
$0.2
03$0
.209
$0.2
15$0
.222
$0.2
28$0
.235
$0.2
42
Cap
ital O
utla
y($
206,
473)
Tax
Cre
dit
$0C
ash
effe
ct o
f dep
reci
atio
n$0
$0$0
$0$0
$0A
void
ed U
tility
Pm
nt (f
rom
Sol
ar G
ener
atio
n)$7
,715
$7,9
07$8
,103
$8,3
05$8
,511
$8,7
23$8
,939
$9,1
62$9
,389
$9,6
23$9
,862
$10,
107
Rev
enue
from
REC
Sal
e$1
5,43
0$1
5,35
3$1
5,27
7$1
5,20
0$1
5,12
4$1
5,04
9$1
4,97
3$1
4,89
8$1
4,82
4$1
4,75
0$1
4,67
6$1
4,60
3Su
btot
al$2
3,14
6$2
3,26
0$2
3,38
0$2
3,50
5$2
3,63
5$2
3,77
1$2
3,91
3$2
4,06
0$2
4,21
3$2
4,37
2$2
4,53
8$2
4,70
9
Ope
ratio
ns &
Mai
nten
ance
$0$0
$0$0
$0$3
22$3
35$3
49$3
63$3
77$3
92$4
08Su
btot
al$0
$0$0
$0$0
$322
$335
$349
$363
$377
$392
$408
Net
Sav
ings
($20
6,47
3)$2
3,14
6$2
3,26
0$2
3,38
0$2
3,50
5$2
3,63
5$2
4,09
4$2
4,24
8$2
4,40
9$2
4,57
6$2
4,75
0$2
4,93
0$2
5,11
8Ta
xes o
n ne
t sav
ings
$0$0
$0$0
$0$0
$0$0
$0$0
$0$0
Net
Sav
ings
afte
r tax
es($
206,
473)
$23,
146
$23,
260
$23,
380
$23,
505
$23,
635
$24,
094
$24,
248
$24,
409
$24,
576
$24,
750
$24,
930
$25,
118
Cum
ulat
ive
Savi
ngs
($20
6,47
3)($
183,
327)
($16
0,06
7)($
136,
687)
($11
3,18
2)($
89,5
46)
($65
,453
)($
41,2
04)
($16
,796
)$7
,780
$32,
530
$57,
460
$82,
578
Yea
r13
1415
1617
1819
2021
2223
2425
Sola
r Gen
erat
ion
(kW
h)41
,513
41,3
0641
,099
40,8
9440
,689
40,4
8640
,283
40,0
8239
,882
39,6
8239
,484
39,2
8639
,090
Util
ity R
ate
per k
Wh
$0.2
50$0
.257
$0.2
65$0
.273
$0.2
81$0
.289
$0.2
98$0
.307
$0.3
16$0
.326
$0.3
35$0
.345
$0.3
56
Avo
ided
Util
ity P
mnt
(fro
m S
olar
Gen
erat
ion)
$10,
358
$10,
615
$10,
879
$11,
149
$11,
427
$11,
710
$12,
001
$12,
300
$12,
605
$12,
919
$13,
240
$13,
569
$13,
906
Rev
enue
from
REC
sale
$14,
530
$14,
457
$14,
385
$14,
313
$14,
241
$14,
170
$14,
099
$14,
029
$13,
959
$13,
889
$13,
819
$13,
750
$13,
681
Subt
otal
$24,
888
$25,
072
$25,
264
$25,
462
$25,
668
$25,
881
$26,
101
$26,
328
$26,
564
$26,
807
$27,
059
$27,
319
$27,
587
Ope
ratio
ns &
Mai
nten
ance
$424
$441
$459
$477
$496
$516
$537
$558
$581
$604
$628
$653
$679
Subt
otal
$424
$441
$459
$477
$496
$516
$537
$558
$581
$604
$628
$653
$679
Net
Sav
ings
$25,
312
$25,
514
$25,
723
$25,
940
$26,
164
$26,
397
$26,
638
$26,
887
$27,
145
$27,
411
$27,
687
$27,
972
$28,
267
Taxe
s on
net s
avin
gs$0
$0$0
$0$0
$0$0
$0$0
$0$0
$0$0
Net
savi
ngs a
fter t
axes
$25,
312
$25,
514
$25,
723
$25,
940
$26,
164
$26,
397
$26,
638
$26,
887
$27,
145
$27,
411
$27,
687
$27,
972
$28,
267
Cum
ulat
ive
Savi
ngs
$107
,890
$133
,403
$159
,126
$185
,066
$211
,230
$237
,627
$264
,264
$291
,151
$318
,296
$345
,707
$373
,394
$401
,367
$429
,633
Afte
r Tax
IRR
11.0
%N
PV o
f Net
Sav
ings
Afte
r Tax
es$5
2,54
4N
PV D
isco
unt R
ate
8.00
%

PV FINANCIALSConcord Engineering Group
APPENDIX HPage 3 of 3
Building Roof Area (sq ft) Panel Qty Panel Sq
Ft
Panel Total Sq
Ft
Total KW
Total Annual
kWh
Panel Weight (33
lbs)W/SQFT
Lawrenceville Fire Company 1650 Sunpower
SPR230 112 14.7 1,650 25.81 44,087 3,703 15.64
.= Proposed PV Layout
Notes:1. Estimated kWH based on 4.68 hours full output per day per 365 day year. Actual kWH will vary day to day.