Embed Size (px)
Citation preview
Concrete Composite Cross-section
Response for Pushover Analysis
Asian Center for Engineering Computations and Software
Asian Institute of Technology, Thailand
Karachi, Pakistan
December ____, 2007
Presented By:
Naveed Anwar, D.Eng.
Objectives
• To present a unified approach in determining the
cross-sectional parameters needed for carrying-
out pushover analysis.
• To discuss the methodology that will handle
various factors such as the effects of pre-stress,
differential creep, shrinkage, confinement, staged
construction, strain hardening, tension stiffening,
relaxation and bond slippage etc., in a single
consistent computational procedure.
• To discuss cross-section capacity at specified
failure criteria.
Contents
• About Pushover Analysis
• Performance Based Design
• Action Deformation Curve
• Determining Cross Section Response
• Ductility and Stiffness
• Conclusions
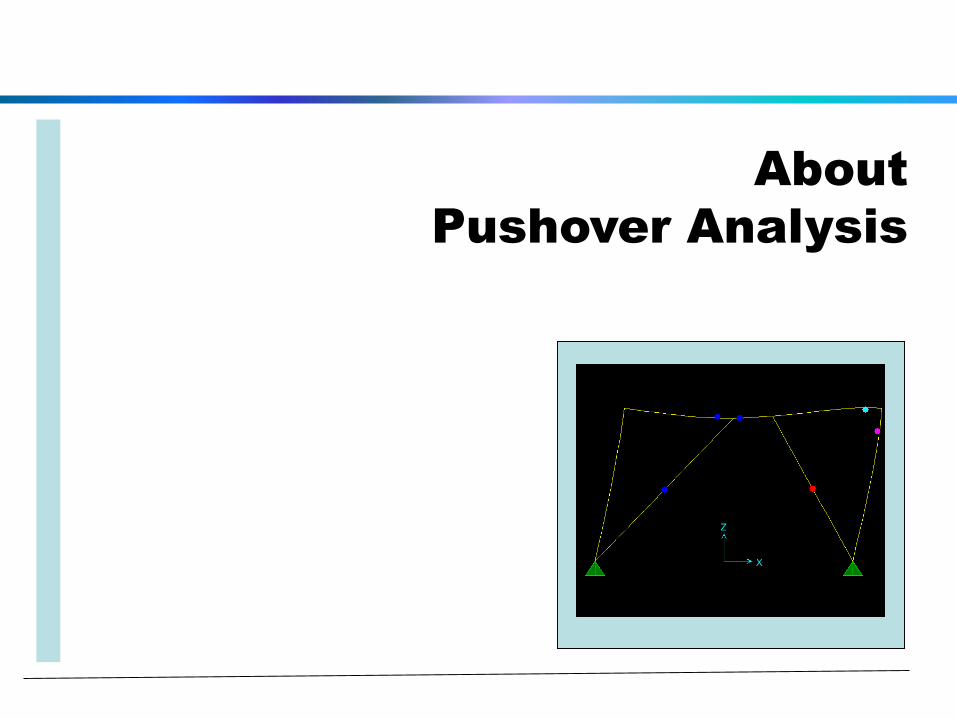
About
Pushover Analysis
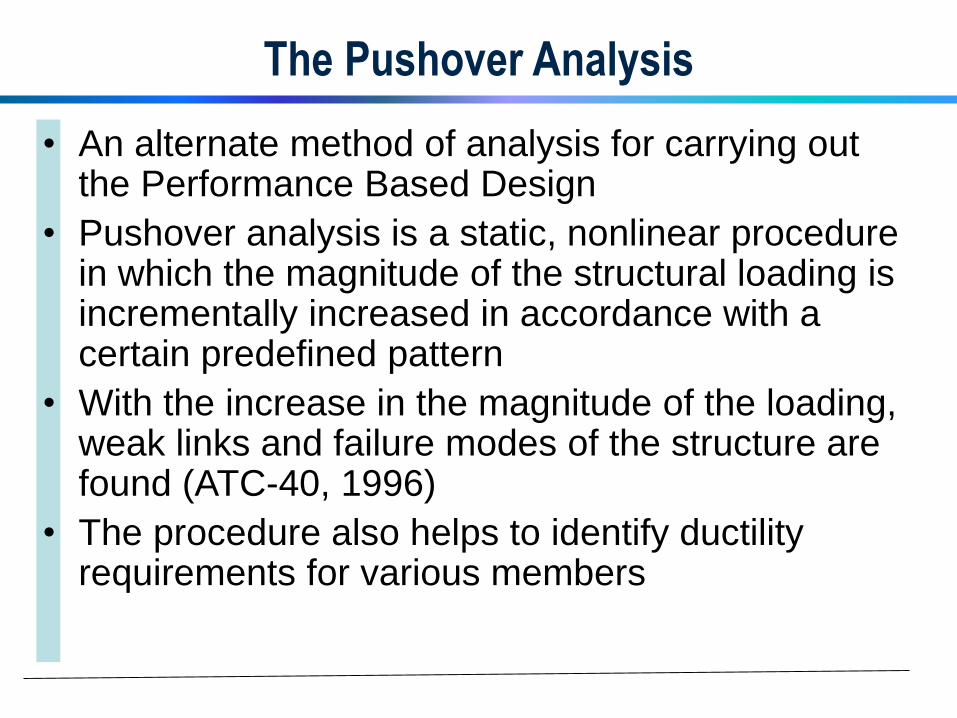
The Pushover Analysis
• An alternate method of analysis for carrying out the Performance Based Design
• Pushover analysis is a static, nonlinear procedure in which the magnitude of the structural loading is incrementally increased in accordance with a certain predefined pattern
• With the increase in the magnitude of the loading, weak links and failure modes of the structure are found (ATC-40, 1996)
• The procedure also helps to identify ductility requirements for various members

The Pushover Analysis
• The loading is monotonic with the effects of the cyclic
behavior and load reversals being estimated
• Pushover analysis is carried out after the Linear
Analysis has been done and Serviceability and Strength
design has been completed
• Pushover analysis is most suitable for determining the
performance, specially for lateral loads such as
Earthquake or even wind
• Static pushover analysis is an attempt by the structural
engineering profession to evaluate the real strength of
the structure and it promises to be a useful and
effective tool for performance based design.
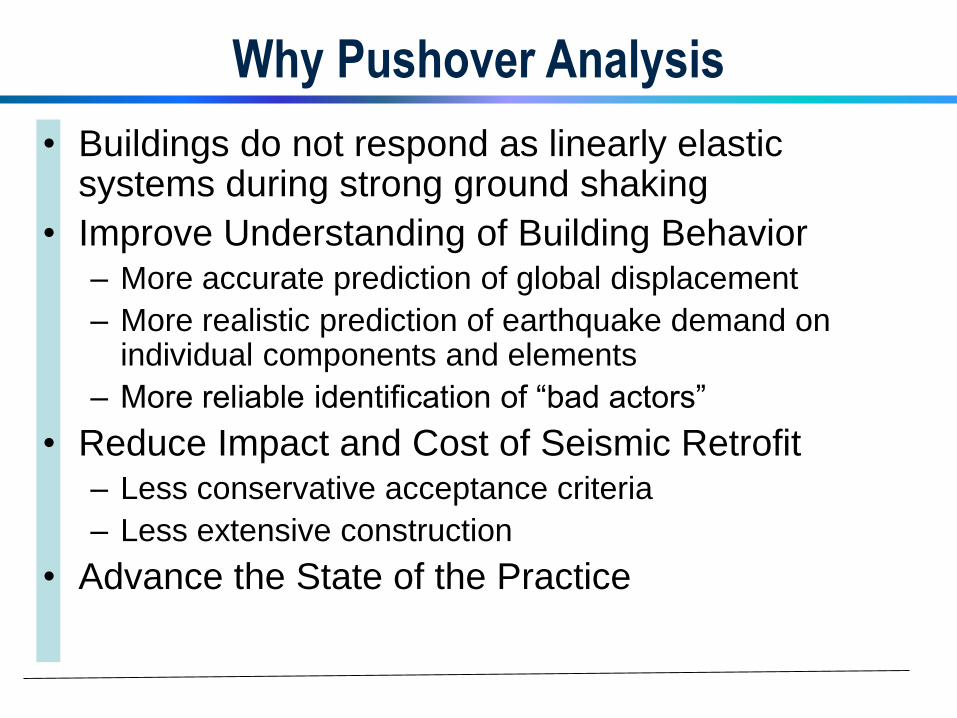
Why Pushover Analysis
• Buildings do not respond as linearly elastic systems during strong ground shaking
• Improve Understanding of Building Behavior– More accurate prediction of global displacement
– More realistic prediction of earthquake demand on individual components and elements
– More reliable identification of “bad actors”
• Reduce Impact and Cost of Seismic Retrofit– Less conservative acceptance criteria
– Less extensive construction
• Advance the State of the Practice
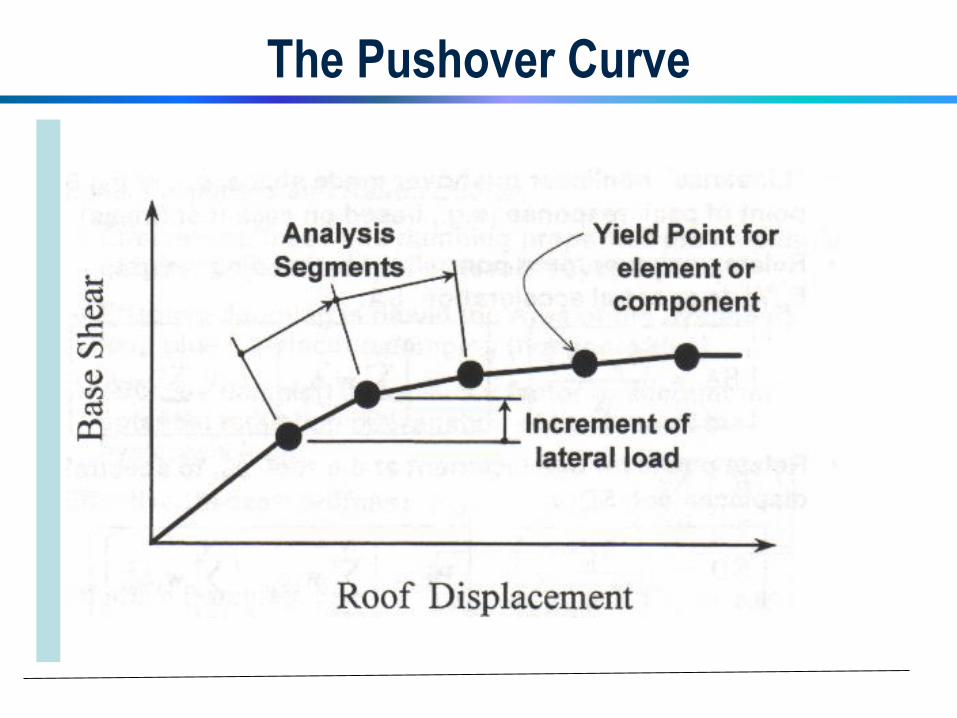
The Pushover Curve
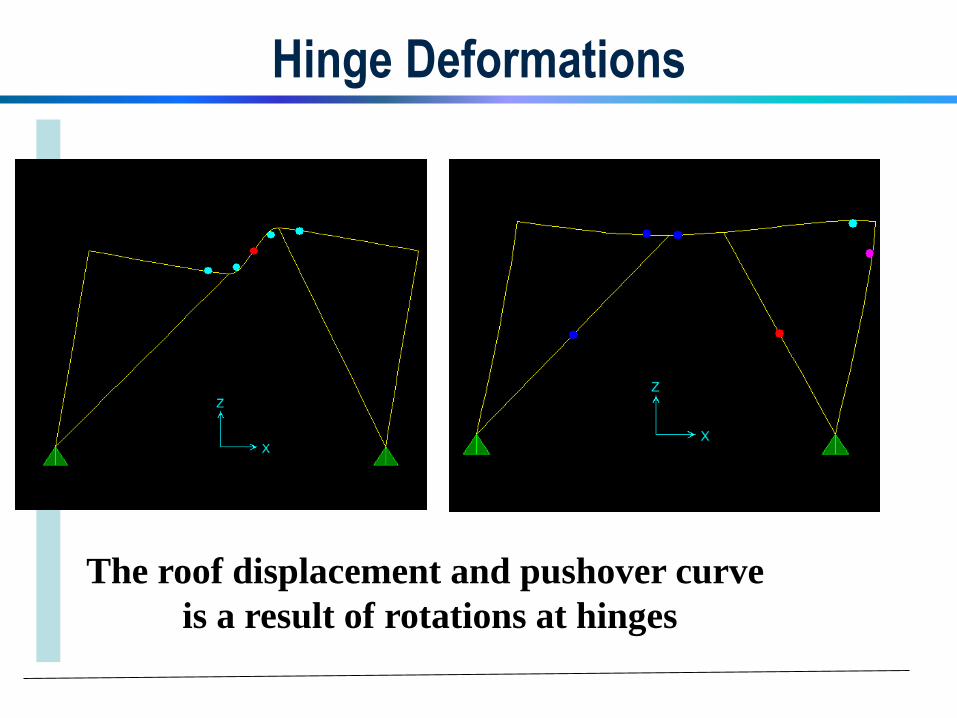
Hinge Deformations
The roof displacement and pushover curve
is a result of rotations at hinges
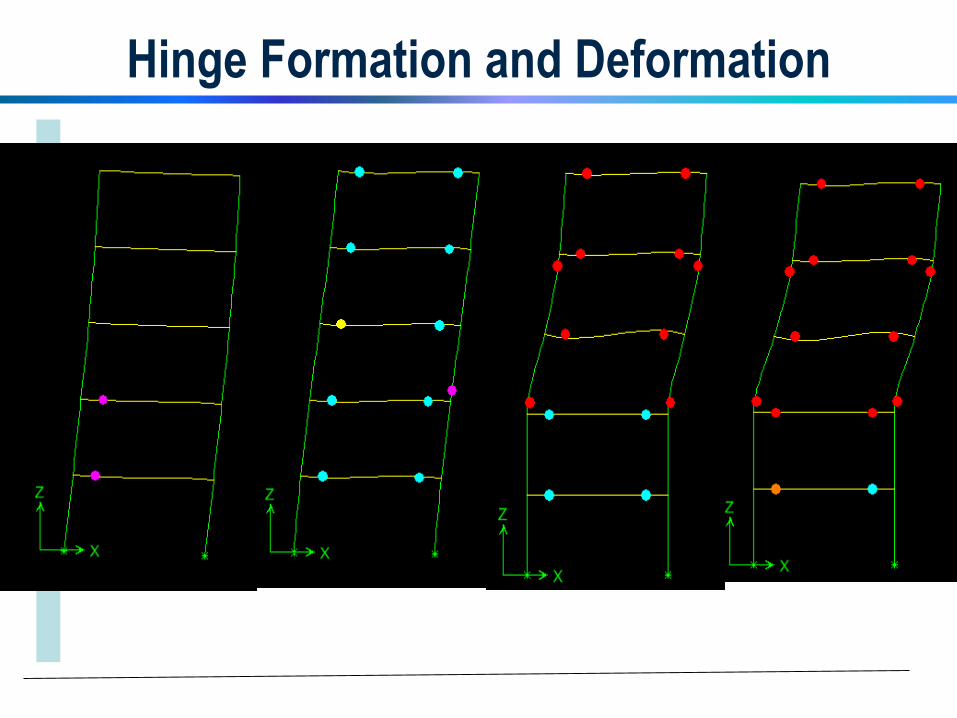
Hinge Formation and Deformation

Pushover Modeling (Elements)
S.N.
Structural
Member
Type
Deformation Type of Hinge
1 Truss Yielding and Buckling Axial hinge
2 3D Beam Major direction
Flexural and Shear
M-M hinge, Shear (V)
hinge
3 3D Column P-M-M Interaction and
ShearP-M-M hinge
4 Panel Zone Shear Yielding Shear hinge
5In-Fill
Panel Shear Failure Shear hinge
6 Shear Wall P-M-Shear InteractionP-M hinge, Shear
hinge
7 Spring For foundation
modelingNon-linear spring
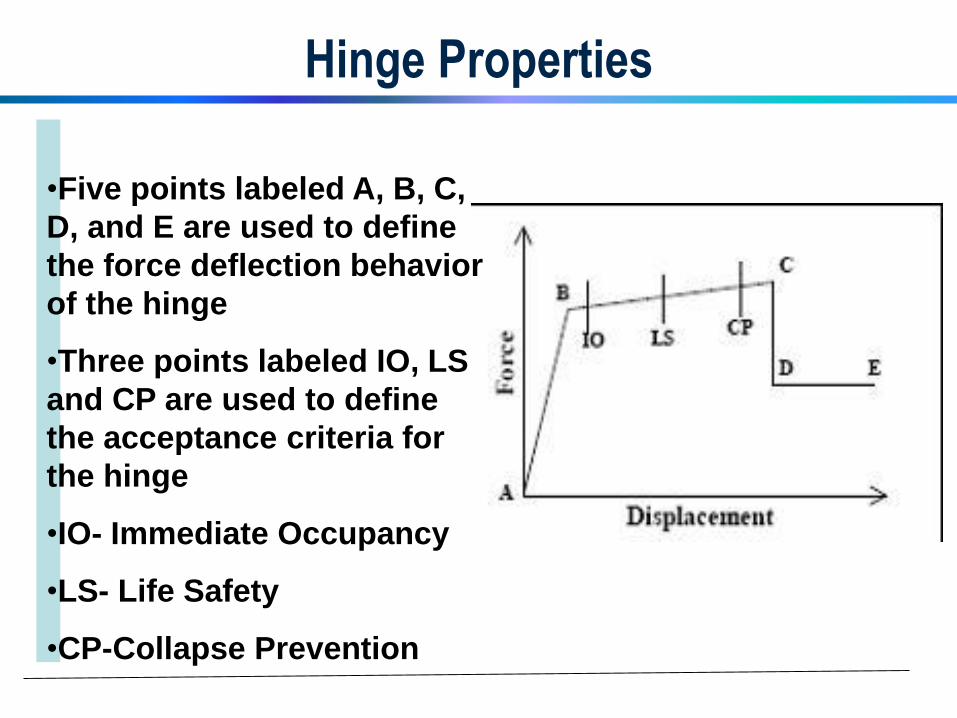
Hinge Properties
•Five points labeled A, B, C,
D, and E are used to define
the force deflection behavior
of the hinge
•Three points labeled IO, LS
and CP are used to define
the acceptance criteria for
the hinge
•IO- Immediate Occupancy
•LS- Life Safety
•CP-Collapse Prevention
Hinge Properties
• Point A is always the origin
• Point B represents yielding. No deformation occurs in the hinge up to point B, regardless of the deformation value specified for point B. The displacement (rotation) at point B will be subtracted from the deformations at points C, D, and E. Only the plastic deformation beyond point B will be exhibited by the hinge
• Point C represents the ultimate capacity for Pushover analysis
• Point D represents a residual strength for Pushover analysis
• Point E represents total failure. Beyond point E the hinge will drop load down to point F (not shown) directly below point E on the horizontal axis. To prevent this failure in the hinge, specify a large value for the deformation at point E
Hinge Properties
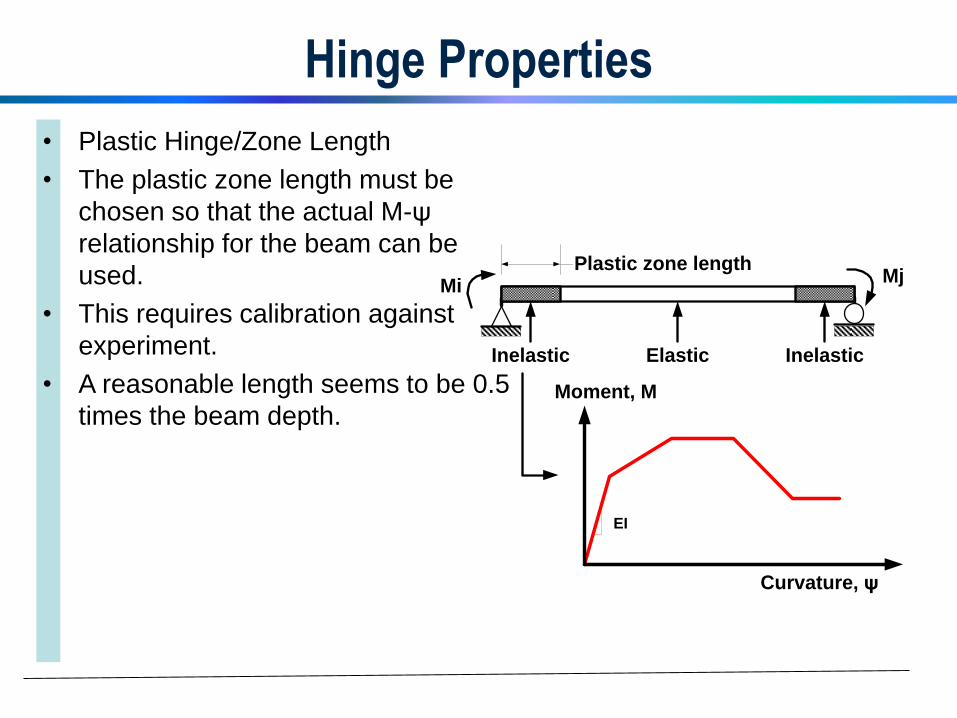
• Plastic Hinge/Zone Length
• The plastic zone length must be
chosen so that the actual M-ψ
relationship for the beam can be
used.
• This requires calibration against
experiment.
• A reasonable length seems to be 0.5
times the beam depth.
Elastic
MiMj
Inelastic
Plastic zone length
Inelastic
EI
Moment, M
Curvature, ψ

Hinge Properties
• Plastic Hinge/Zone Length – For a reinforced concrete cantilever column. Paulay and Priestley
(“Seismic Design of Reinforced Concrete and Masonry Buildings”, Wiley, 1992, p. 142) suggest the following plastic zone length:
• Lp = 0.08H + 0.15d fy
• where: – Lp = plastic zone length
– H = cantilever height
– d = reinforcing bar diameter
– fy = steel yield strength
– (all in kip-inch units)
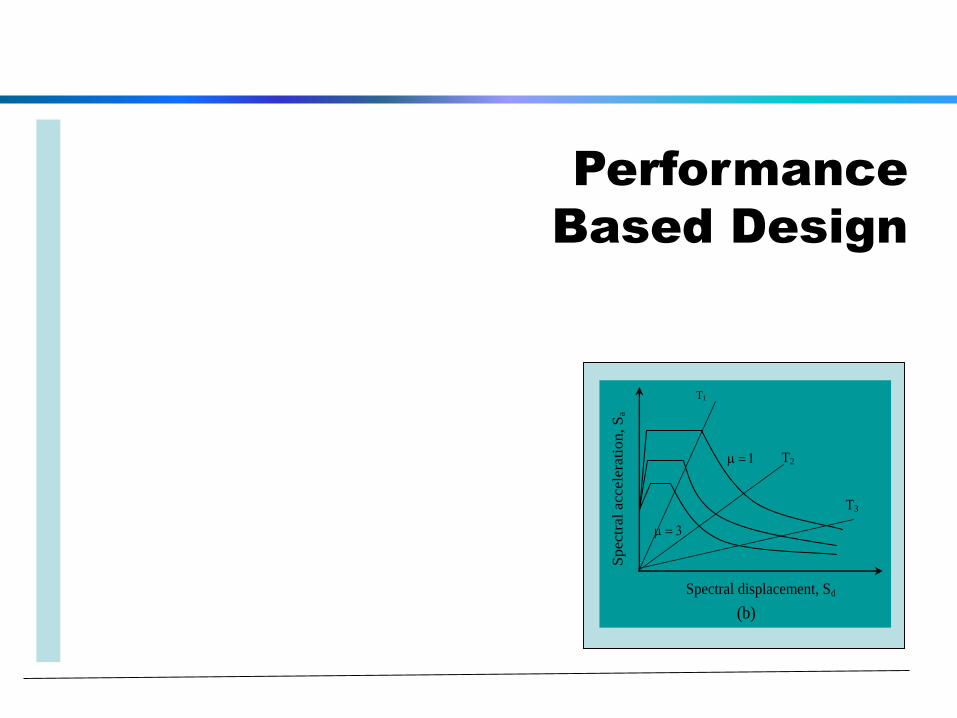
Performance
Based Design
Spectr
al
accele
rati
on, S
a
Period, T
Spectr
al
accele
rati
on, S
a
Spectral displacement, Sd
T1
T2
T3
(a) (b)
Performance Based Design
• Performance is generally of concern for lateral
loads such as earthquake and wind.
• The main factor that affects performance is the
ductility of the members on the critical load path.
• In frame structures, the design of the joints
between columns and beams is critical. The
performance of shear walls is also of great
importance for lateral load demands.
Performance Based Design
• The performance based design is basically a
comparison between the performance curve of
the section, member or entire structure against
the demand curve for the section, member or the
structure as a whole.
• Performance design ensures that structure as a
whole reaches a specified demand level.
• Performance design can include, both service
and strength design levels.
Seismic Performance
• The Seismic Performance evaluation or design
ensures that the structure can “Perform Well”
during a specified earthquake based on specified
criteria
• The Seismic Performance of a structure can be
evaluated by using a Static-Nonlinear Pushover
Analysis
• Pushover Analysis relies on properties and
performance of Plastic Hinges located in
structural model
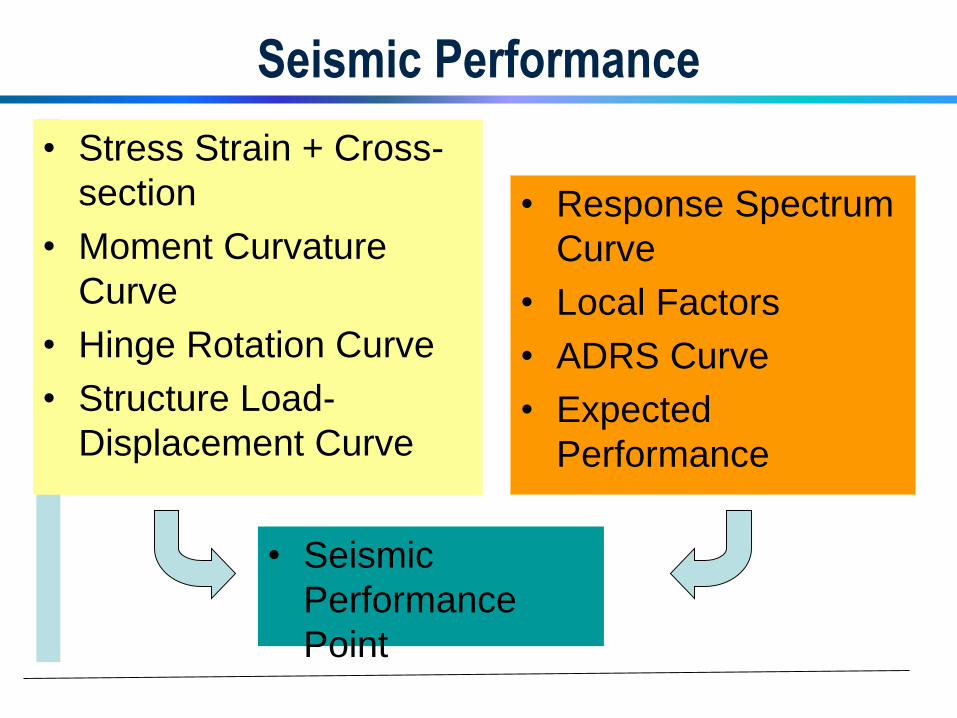
Seismic Performance
• Stress Strain + Cross-
section
• Moment Curvature
Curve
• Hinge Rotation Curve
• Structure Load-
Displacement Curve
• Response Spectrum
Curve
• Local Factors
• ADRS Curve
• Expected
Performance
• Seismic
Performance
Point
Performance Design
Time Period
Spectr
al
Accele
ration
Spectral Displacement
ADRS
Spectr
al
Accele
ration
Spectral Displacement
Performance Point
Base
Shear,
V
Displacement,
Pushover Curve
Base
Shear,
V
Earthquake Response Spectra
F2
F1
Base Shear, V
Plastic
Hinge
dL A
A
B
D
Section A-A
Strain
Str
ess
Concrete
Strain
Str
ess
Steel
Rotation
Mom
ent
Curvature
Mom
ent
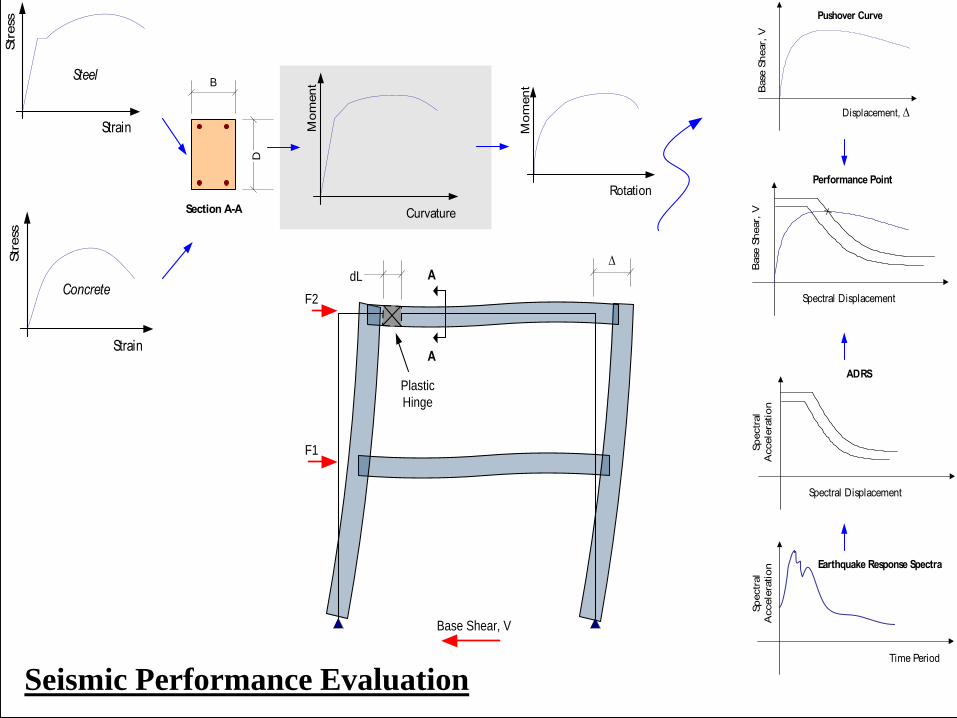
Seismic Performance Evaluation
Performance Curve
• The nonlinear response is described with the pushover curve, which plots the base shear versus the roof displacement.
• This pushover curve can be transformed into the “capacity spectrum” using the structure’s original elastic dynamic properties.
• This capacity spectrum is represented in the Acceleration Displacement Response Spectrum (ADRS) format, using spectral displacement and spectral acceleration.
• The response spectrum or so-called demand spectrum for considered ground motions could also be plotted in the ADRS format.
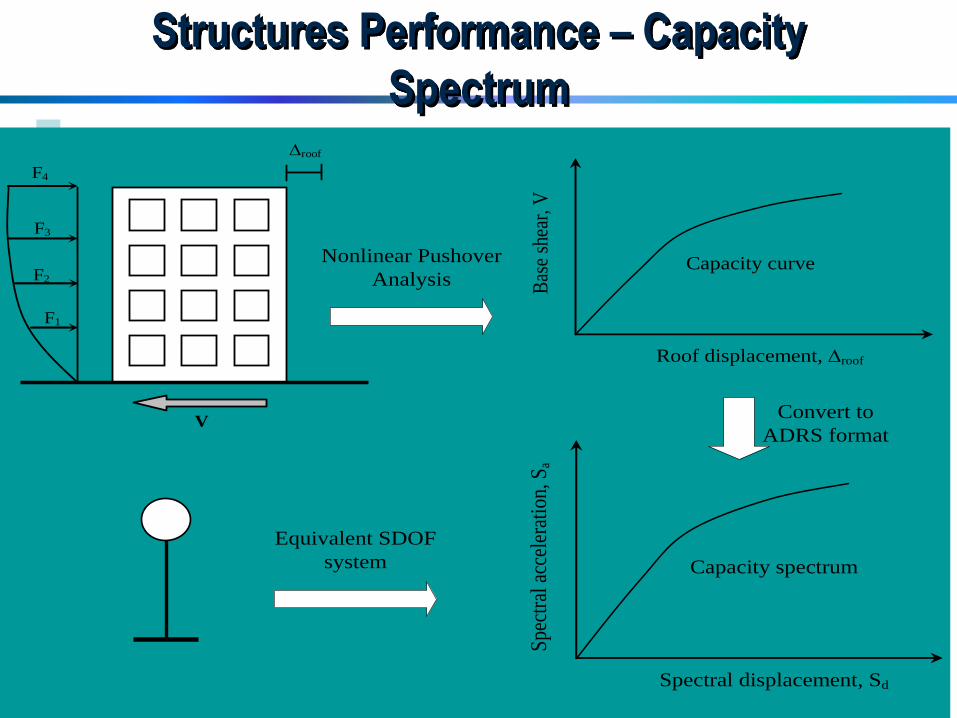
roof
F1
F2
F3
F4
V
Nonlinear Pushover
Analysis
Convert to
ADRS format
Equivalent SDOF
system
Spe
ctra
l ac
cele
rati
on, S
a
Spectral displacement, Sd
Capacity spectrum
Bas
e sh
ear,
V
Roof displacement, roof
Capacity curve
Structures Performance – Capacity
Spectrum
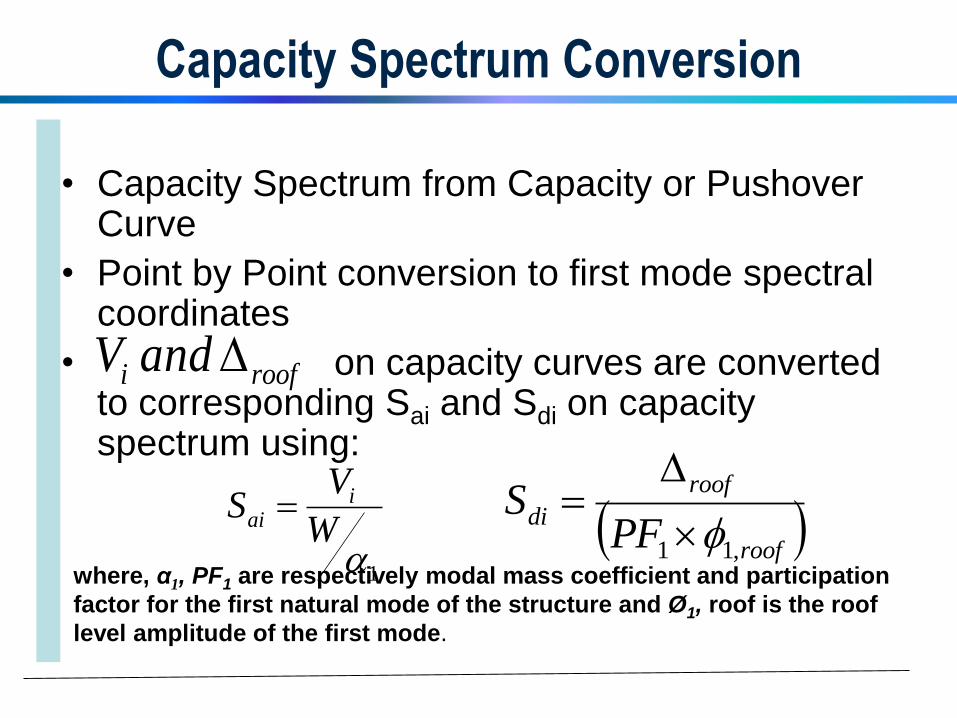
Capacity Spectrum Conversion
• Capacity Spectrum from Capacity or Pushover Curve
• Point by Point conversion to first mode spectral coordinates
• on capacity curves are converted to corresponding Sai and Sdi on capacity spectrum using:
roofi andV
1W
VS i
ai roof
roof
diPF
S,11
where, α1, PF1 are respectively modal mass coefficient and participation
factor for the first natural mode of the structure and Ø1, roof is the roof
level amplitude of the first mode.
Spectr
al
accele
rati
on, S
a
Period, T
Spectr
al
accele
rati
on, S
a
Spectral displacement, Sd
T1
T2
T3
(a) (b)
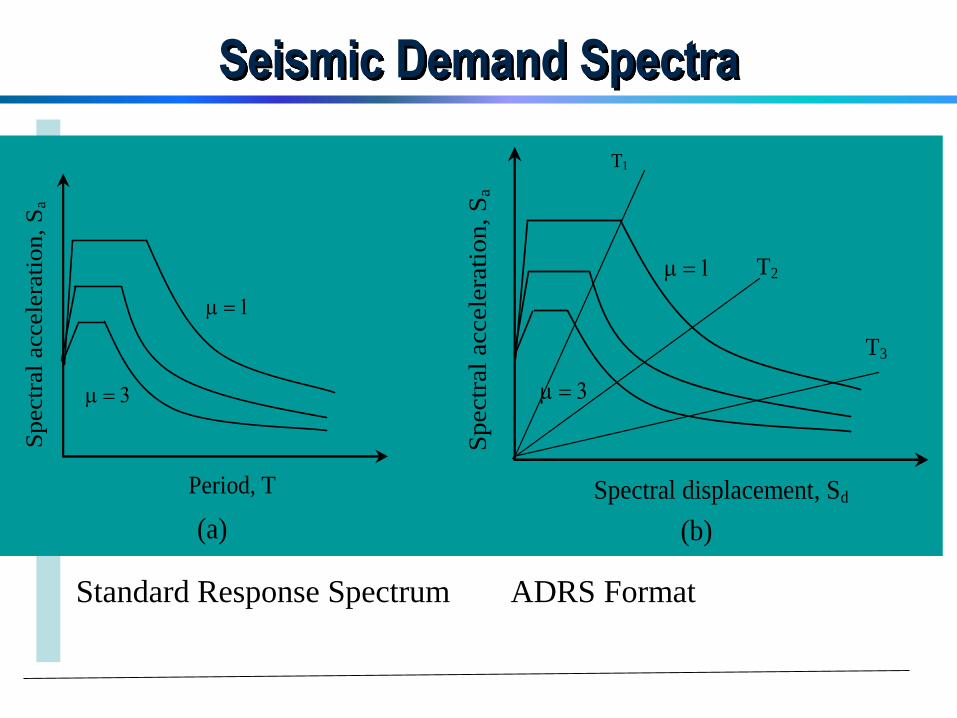
Seismic Demand Spectra
Standard Response Spectrum ADRS Format
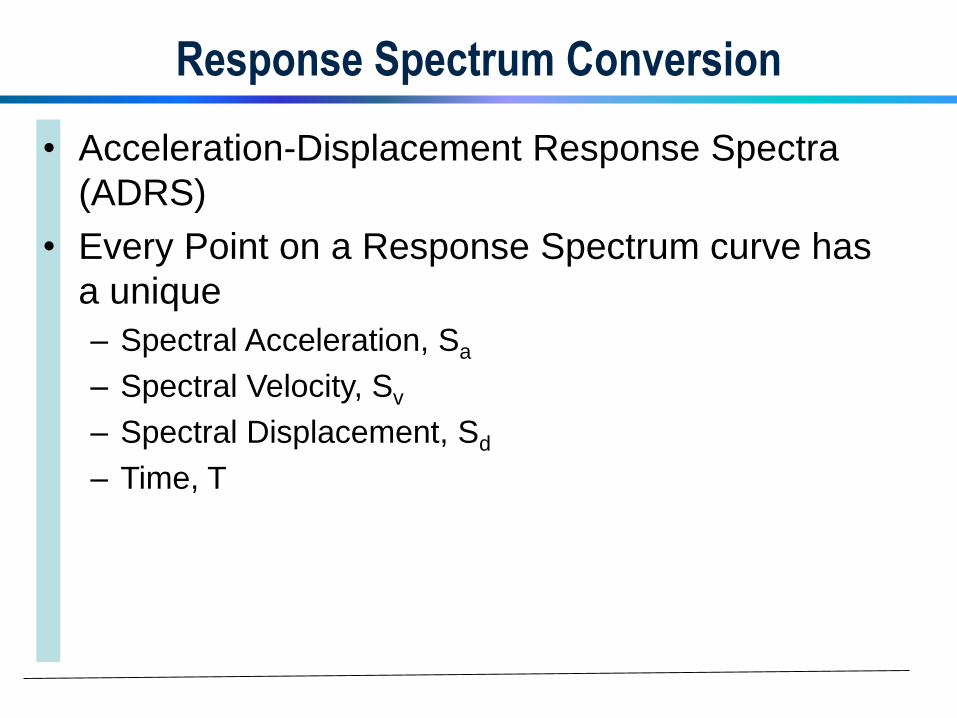
Response Spectrum Conversion
• Acceleration-Displacement Response Spectra
(ADRS)
• Every Point on a Response Spectrum curve has
a unique
– Spectral Acceleration, Sa
– Spectral Velocity, Sv
– Spectral Displacement, Sd
– Time, T
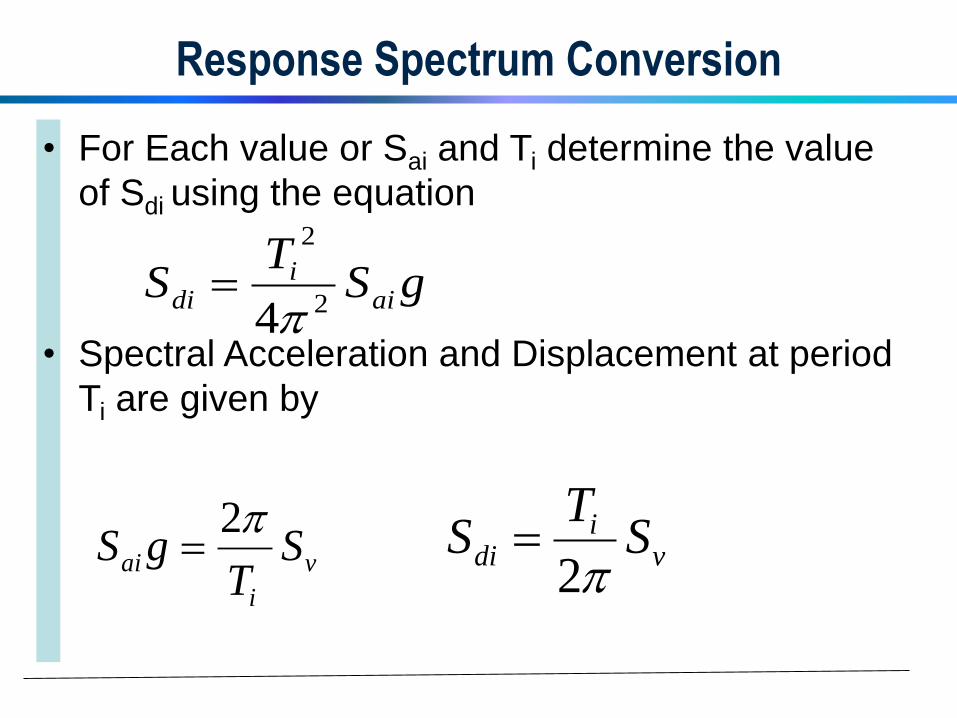
Response Spectrum Conversion
• For Each value or Sai and Ti determine the value
of Sdi using the equation
• Spectral Acceleration and Displacement at period
Ti are given by
gST
S aii
di 2
2
4
v
i
ai ST
gS2
vi
di ST
S2
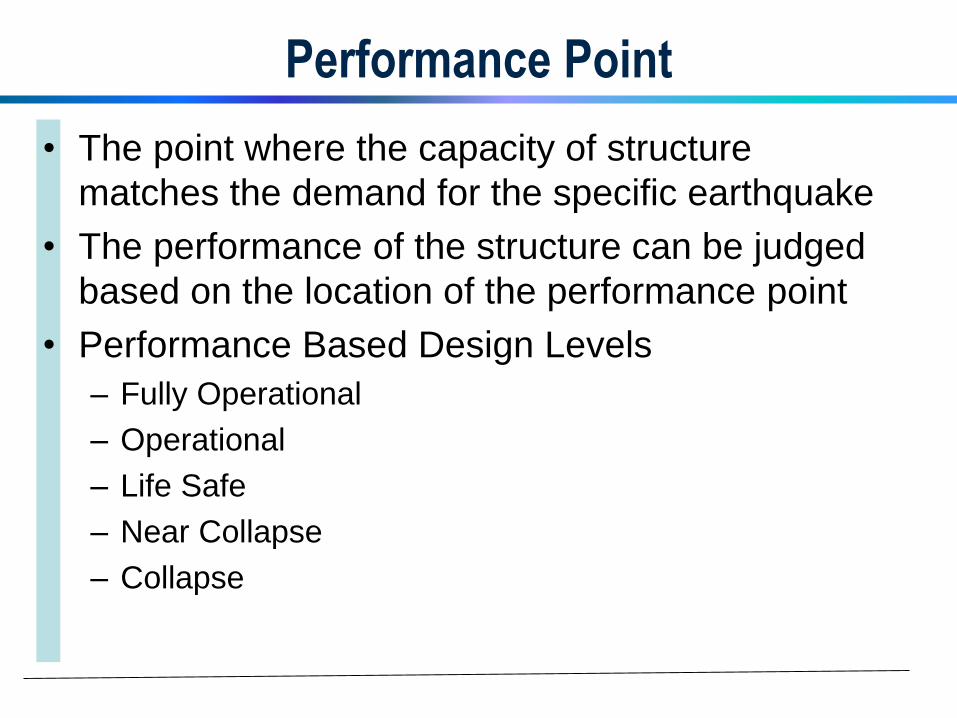
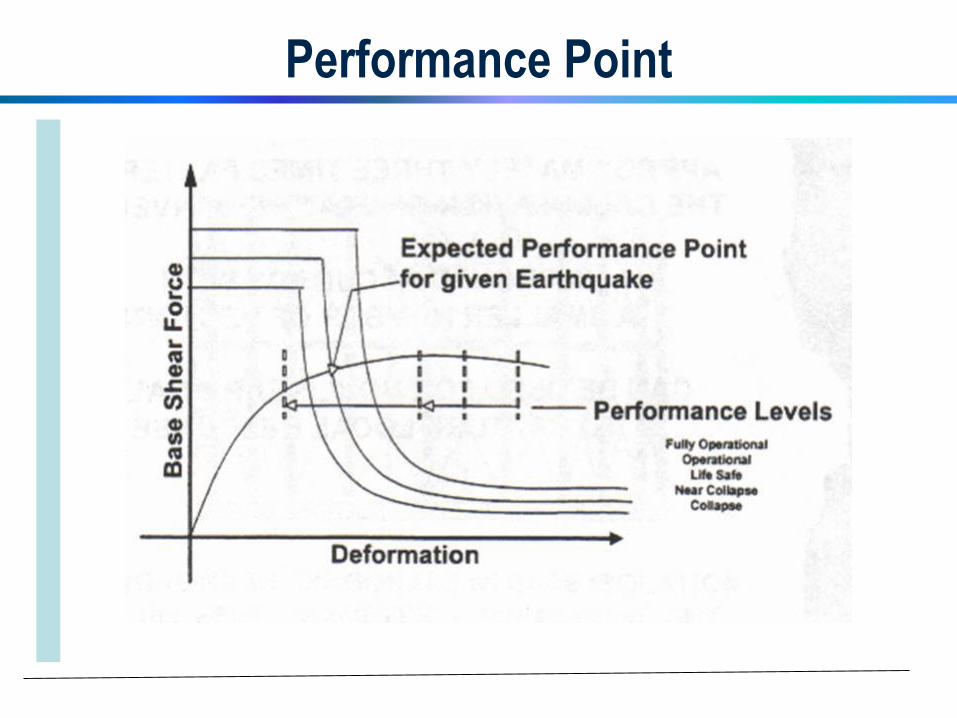
Performance Point
• The point where the capacity of structure
matches the demand for the specific earthquake
• The performance of the structure can be judged
based on the location of the performance point
• Performance Based Design Levels
– Fully Operational
– Operational
– Life Safe
– Near Collapse
– Collapse
Performance Point
Action
Deformation Curve
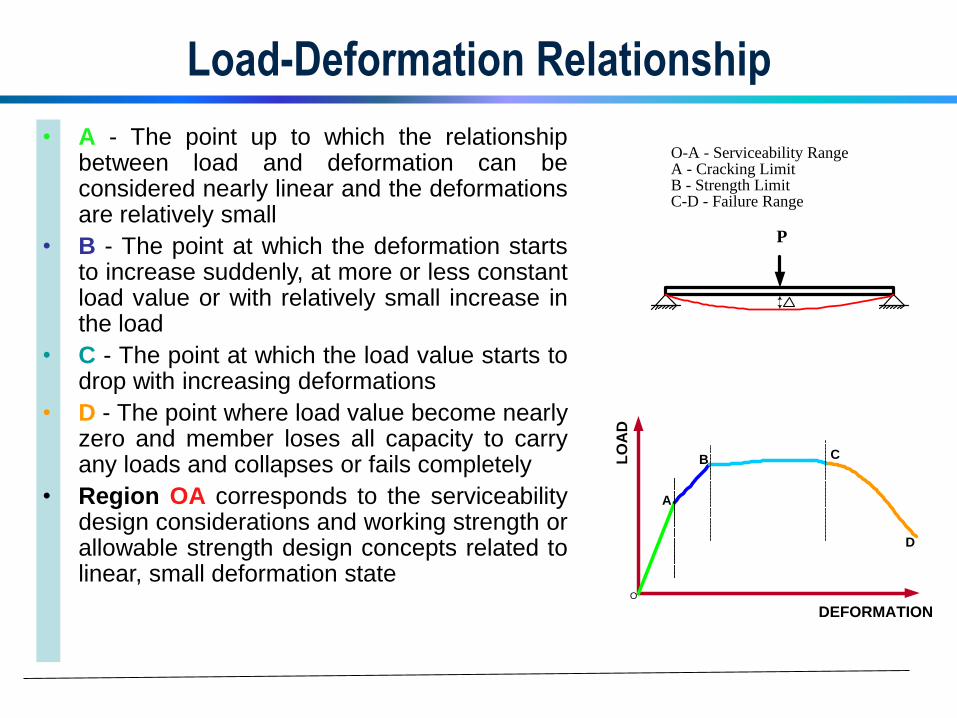
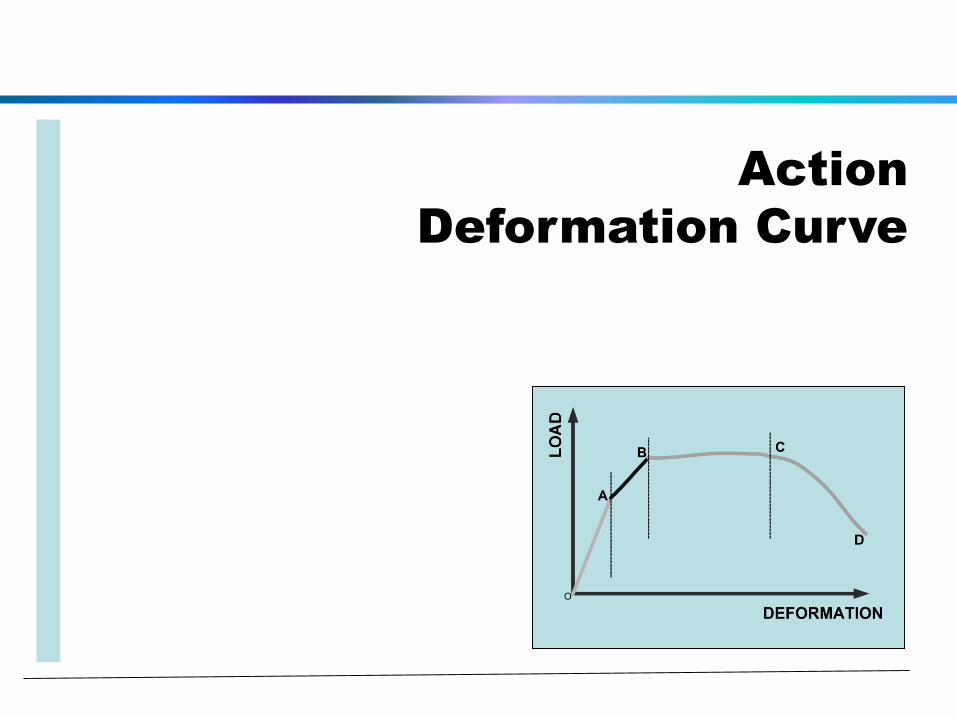
Load-Deformation Relationship
• A - The point up to which the relationshipbetween load and deformation can beconsidered nearly linear and the deformationsare relatively small
• B - The point at which the deformation startsto increase suddenly, at more or less constantload value or with relatively small increase inthe load
• C - The point at which the load value starts todrop with increasing deformations
• D - The point where load value become nearlyzero and member loses all capacity to carryany loads and collapses or fails completely
• Region OA corresponds to the serviceabilitydesign considerations and working strength orallowable strength design concepts related tolinear, small deformation state
DEFORMATION
LO
AD
PA
B C
D
O-A - Serviceability RangeA - Cracking LimitB - Strength LimitC-D - Failure Range
O
DEFORMATIONL
OA
D
PA
B C
D
O-A - Serviceability RangeA - Cracking LimitB - Strength LimitC-D - Failure Range
O
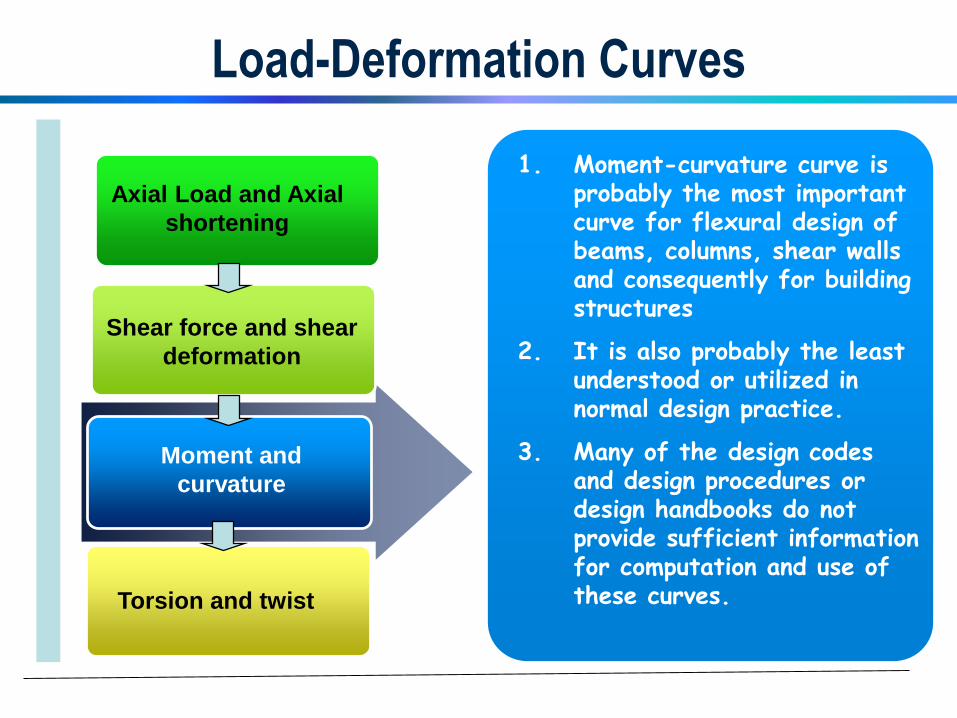
Load-Deformation Curves
1. Moment-curvature curve is probably the most important curve for flexural design of beams, columns, shear walls and consequently for building structures
2. It is also probably the least understood or utilized in normal design practice.
3. Many of the design codes and design procedures or design handbooks do not provide sufficient information for computation and use of these curves.
Axial Load and Axial
shortening
Shear force and shear
deformation
Moment and
curvature
Torsion and twist
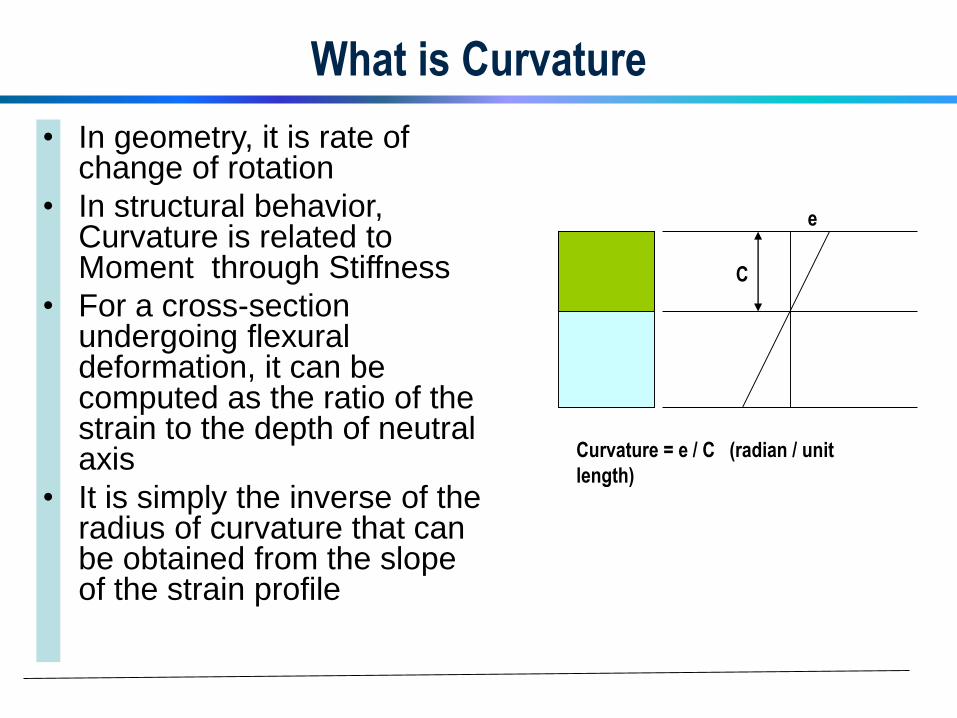
What is Curvature
• In geometry, it is rate of change of rotation
• In structural behavior, Curvature is related to Moment through Stiffness
• For a cross-section undergoing flexural deformation, it can be computed as the ratio of the strain to the depth of neutral axis
• It is simply the inverse of the radius of curvature that can be obtained from the slope of the strain profile
Curvature = e / C (radian / unit
length)
C
e
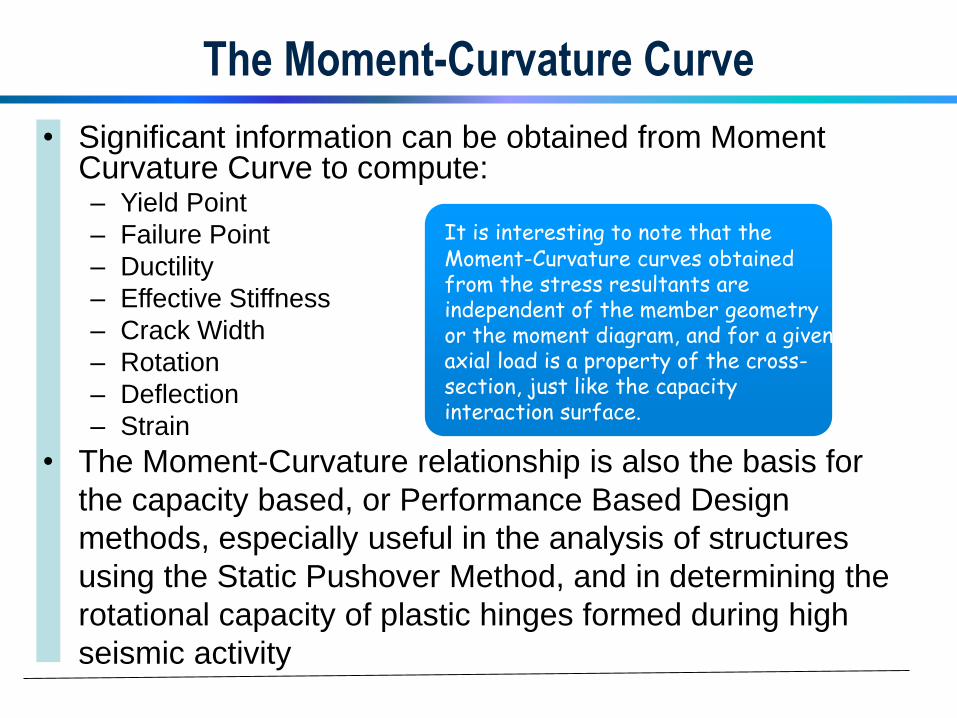
The Moment-Curvature Curve
• Significant information can be obtained from Moment Curvature Curve to compute:– Yield Point
– Failure Point
– Ductility
– Effective Stiffness
– Crack Width
– Rotation
– Deflection
– Strain
• The Moment-Curvature relationship is also the basis for
the capacity based, or Performance Based Design
methods, especially useful in the analysis of structures
using the Static Pushover Method, and in determining the
rotational capacity of plastic hinges formed during high
seismic activity
It is interesting to note that the Moment-Curvature curves obtained from the stress resultants are independent of the member geometry or the moment diagram, and for a given axial load is a property of the cross-section, just like the capacity interaction surface.
Determining
Cross Section Response

The Response and Design
Building Response
Member Response
Section Response
Material Response
Building Analysis
Member Actions
Cross-section Actions
Material Stress/StrainLoad Capacity
Applied Loads
Fro
m L
oad
s to
Str
esse
s
Fro
m S
tra
ins
to R
esp
on
se

General Cross-sections
• Based on Material– Un-reinforced, Reinforced, Prestressed Concrete
– Fiber Reinforced Concrete, Ferrocement
– Steel-Concrete Composite
– Hot Rolled Steel, Cold formed Steel
– Structural Timber
• Based on Geometry– Circular, Elliptical, Rectangular, Flanged, Polygonal
– Hollow, Solid, Voided
– Symmetrical, Unsymmetrical, Asymmetrical
• Based on Compressed Zone (for steel sections)– Slender Sections/Thin Walled Sections
– Compact Sections
– Plastic Sections
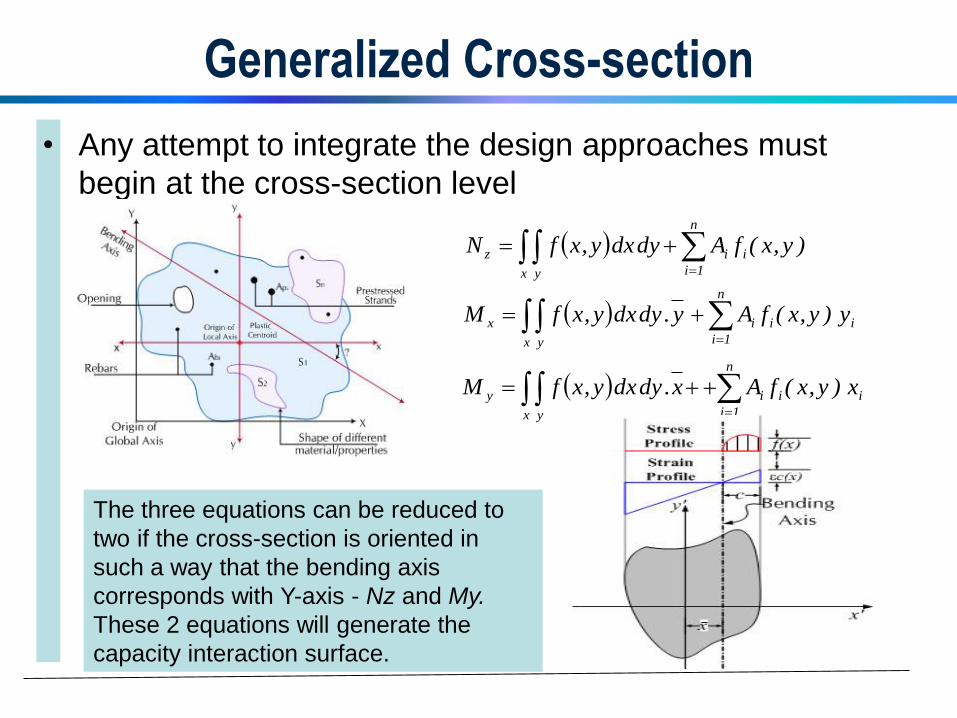
Generalized Cross-section
• Any attempt to integrate the design approaches must
begin at the cross-section level
x y
n
1i
iiz )y,x(fAdydxy,xfN
i
n
1i
ii
x y
x y)y,x(fAy.dydxy,xfM
i
n
1i
ii
x y
y x)y,x(fAx.dydxy,xfM
The three equations can be reduced to
two if the cross-section is oriented in
such a way that the bending axis
corresponds with Y-axis - Nz and My.
These 2 equations will generate the
capacity interaction surface.
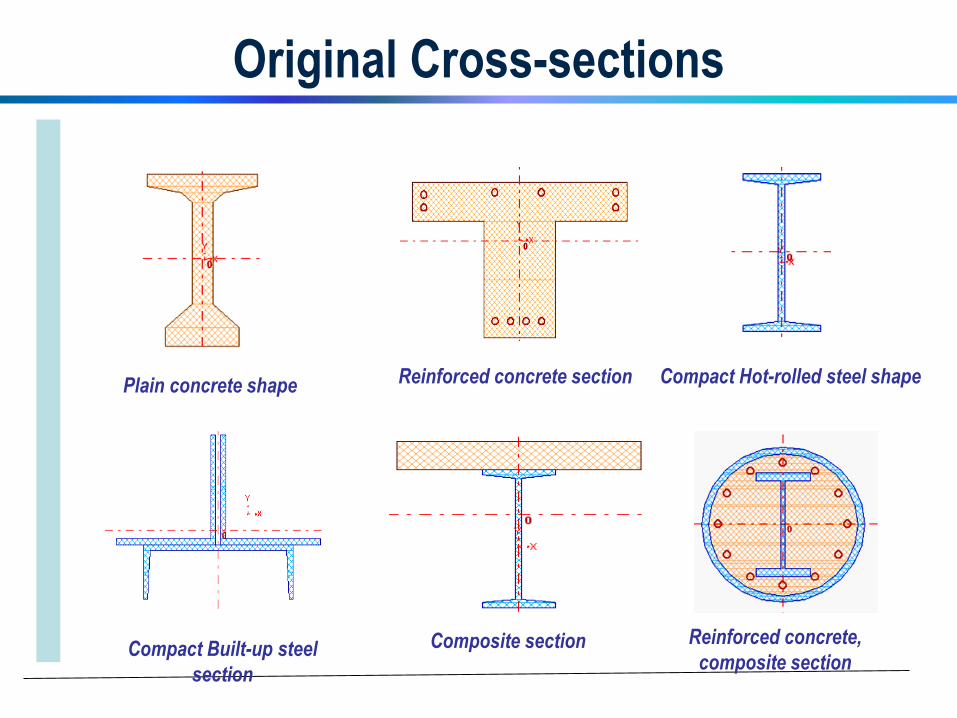
Original Cross-sections
Plain concrete shape Reinforced concrete section Compact Hot-rolled steel shape
Compact Built-up steel
section
Reinforced concrete,
composite sectionComposite section
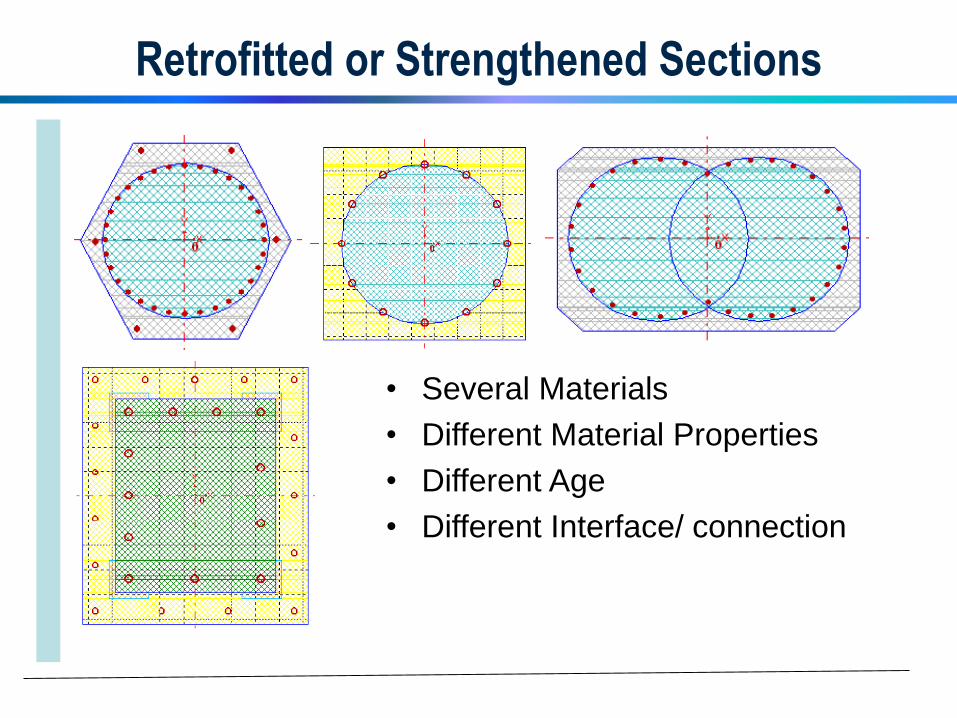
Retrofitted or Strengthened Sections
• Several Materials
• Different Material Properties
• Different Age
• Different Interface/ connection
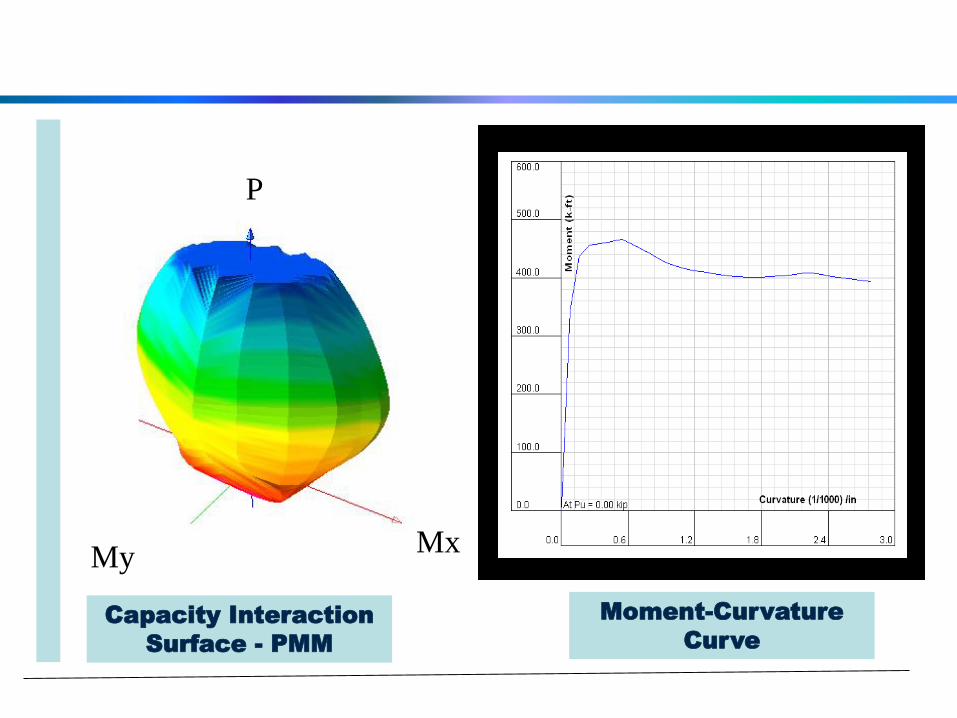
MxMy
P
Capacity Interaction
Surface - PMM
Moment-Curvature
Curve
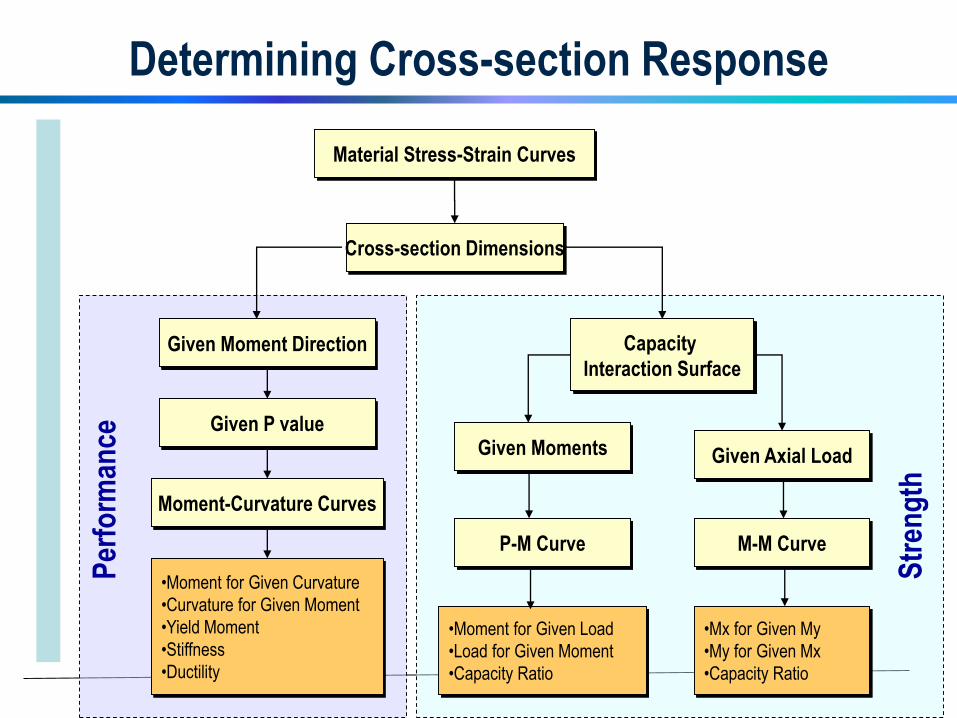
Determining Cross-section Response
Material Stress-Strain Curves
Cross-section Dimensions
Capacity
Interaction Surface
M-M Curve
Moment-Curvature Curves
P-M Curve
Given P value
Given Moment Direction
Given Moments Given Axial Load
•Moment for Given Curvature
•Curvature for Given Moment
•Yield Moment
•Stiffness
•Ductility
•Moment for Given Load
•Load for Given Moment
•Capacity Ratio
•Mx for Given My
•My for Given Mx
•Capacity Ratio
Per
form
ance
Str
eng
th
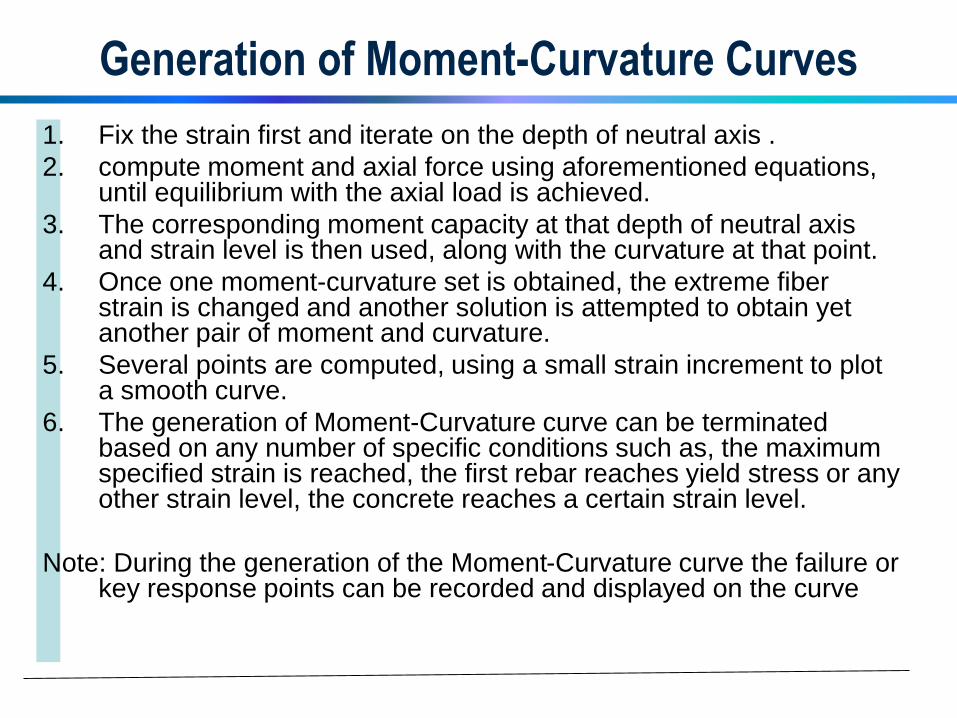
Generation of Moment-Curvature Curves
1. Fix the strain first and iterate on the depth of neutral axis .
2. compute moment and axial force using aforementioned equations, until equilibrium with the axial load is achieved.
3. The corresponding moment capacity at that depth of neutral axis and strain level is then used, along with the curvature at that point.
4. Once one moment-curvature set is obtained, the extreme fiber strain is changed and another solution is attempted to obtain yet another pair of moment and curvature.
5. Several points are computed, using a small strain increment to plot a smooth curve.
6. The generation of Moment-Curvature curve can be terminated based on any number of specific conditions such as, the maximum specified strain is reached, the first rebar reaches yield stress or any other strain level, the concrete reaches a certain strain level.
Note: During the generation of the Moment-Curvature curve the failure or key response points can be recorded and displayed on the curve
Ductility
and Stiffness
Lo
ad
Deformation
Dy Du
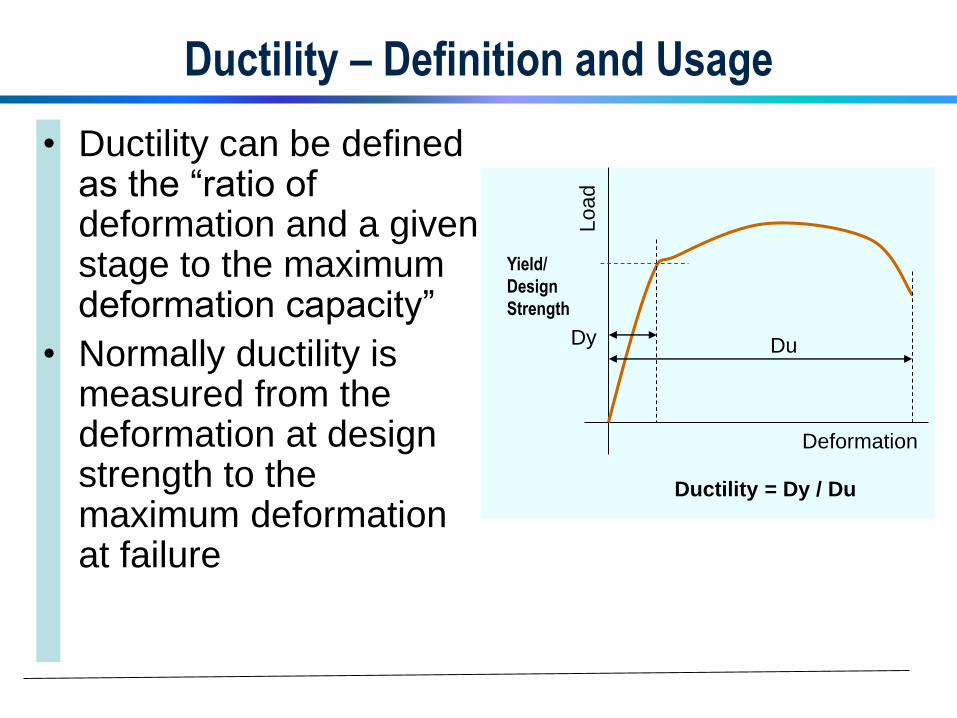
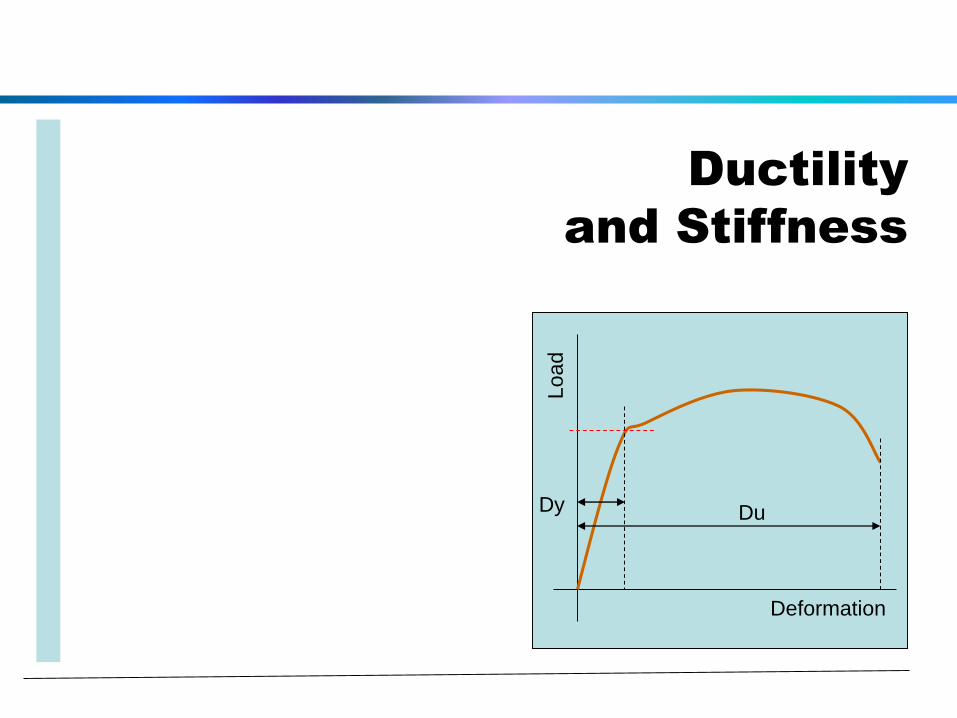
Ductility – Definition and Usage
• Ductility can be defined as the “ratio of deformation and a given stage to the maximum deformation capacity”
• Normally ductility is measured from the deformation at design strength to the maximum deformation at failure
Yield/
Design
Strength
Lo
ad
Deformation
Dy Du
Ductility = Dy / Du
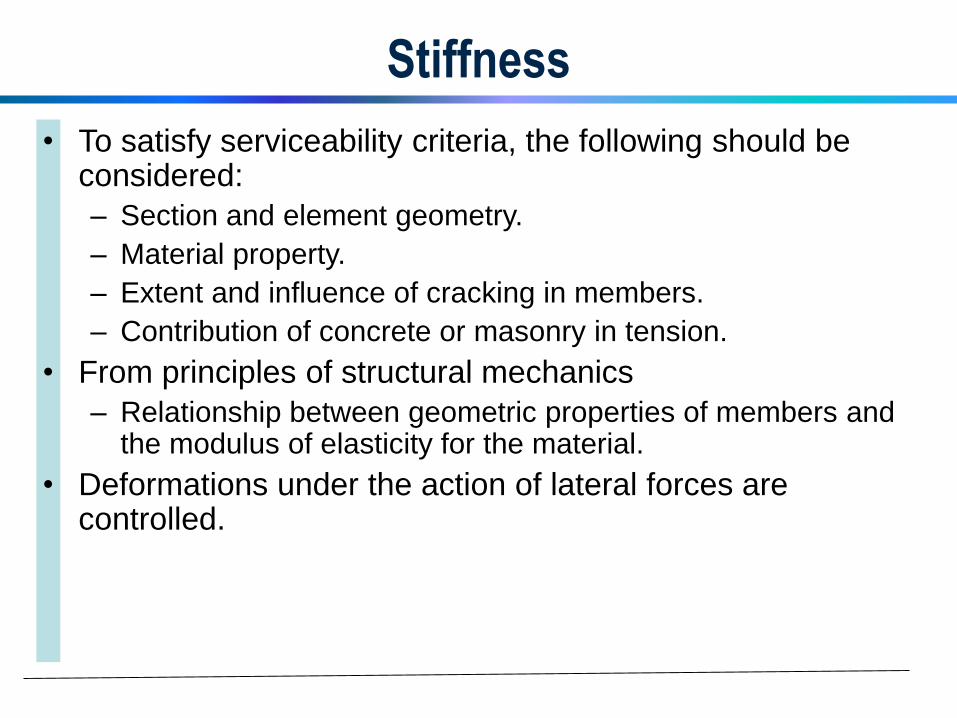
Stiffness
• To satisfy serviceability criteria, the following should be considered:
– Section and element geometry.
– Material property.
– Extent and influence of cracking in members.
– Contribution of concrete or masonry in tension.
• From principles of structural mechanics
– Relationship between geometric properties of members and the modulus of elasticity for the material.
• Deformations under the action of lateral forces are controlled.
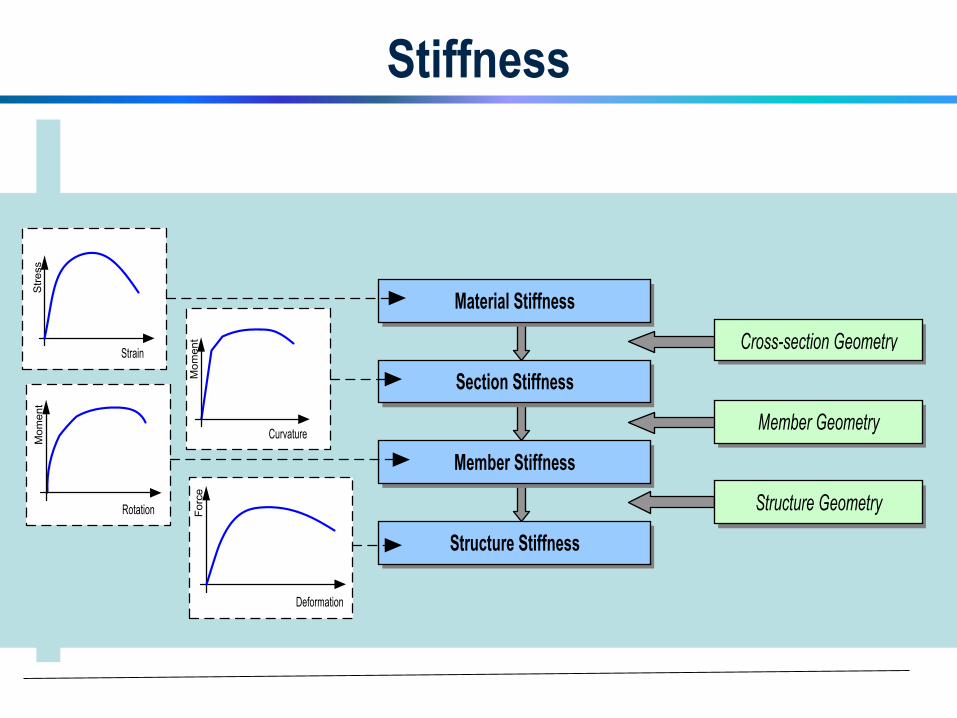
Stiffness
Deformation
Fo
rce
Curvature
Mo
me
nt
Section Stiffness
Member Stiffness
Structure Stiffness
Material Stiffness
Structure Geometry
Member Geometry
Cross-section Geometry
Rotation
Mo
me
nt
Strain
Str
ess

Effective Stiffness
• Cross-section stiffness “EI” is only valid in the linear-elastic range.
• However, stiffness can indirectly (and more accurately) be determined from the slope of the M-φ curve, termed as “effective stiffness.”
• Effective stiffness includes effect of cracking, the stiffness contribution due to reinforcement and the change in the modulus of elasticity of concrete and steel due to certain level of strain.
Moment-Curvature
Relationship
Effective Stiffness
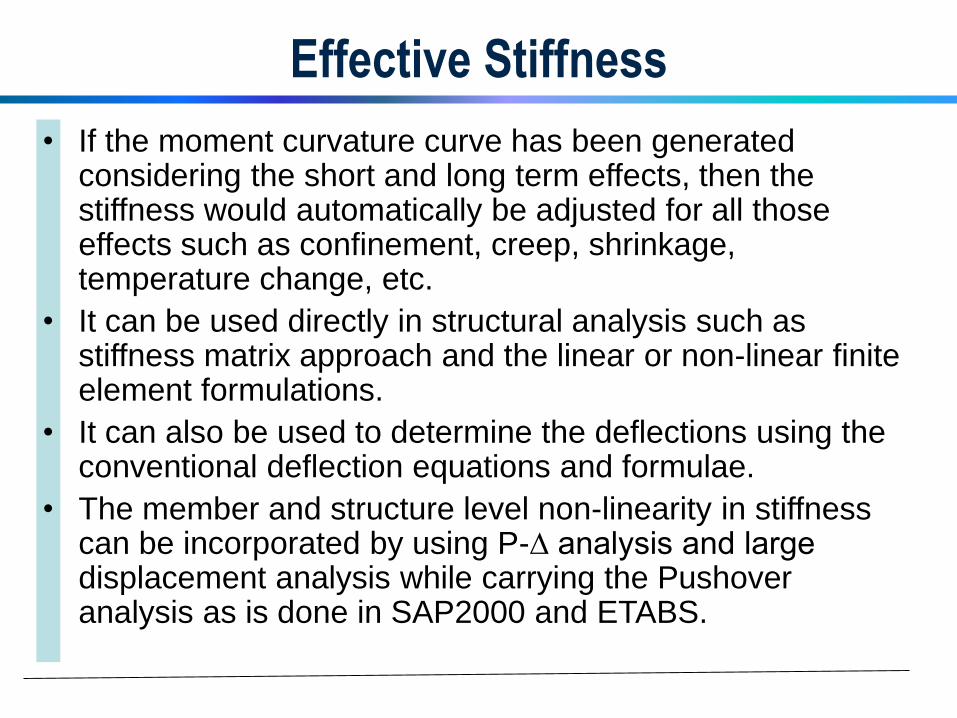
• If the moment curvature curve has been generated considering the short and long term effects, then the stiffness would automatically be adjusted for all those effects such as confinement, creep, shrinkage, temperature change, etc.
• It can be used directly in structural analysis such as stiffness matrix approach and the linear or non-linear finite element formulations.
• It can also be used to determine the deflections using the conventional deflection equations and formulae.
• The member and structure level non-linearity in stiffness can be incorporated by using P-∆ analysis and large displacement analysis while carrying the Pushover analysis as is done in SAP2000 and ETABS.
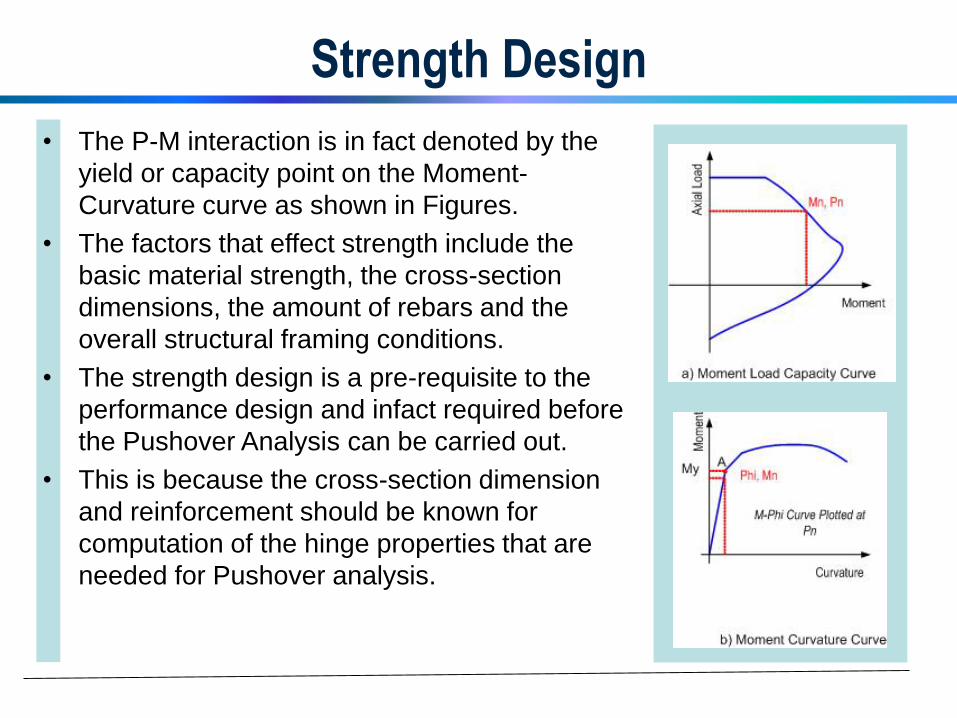
Strength Design
• The P-M interaction is in fact denoted by the
yield or capacity point on the Moment-
Curvature curve as shown in Figures.
• The factors that effect strength include the
basic material strength, the cross-section
dimensions, the amount of rebars and the
overall structural framing conditions.
• The strength design is a pre-requisite to the
performance design and infact required before
the Pushover Analysis can be carried out.
• This is because the cross-section dimension
and reinforcement should be known for
computation of the hinge properties that are
needed for Pushover analysis.
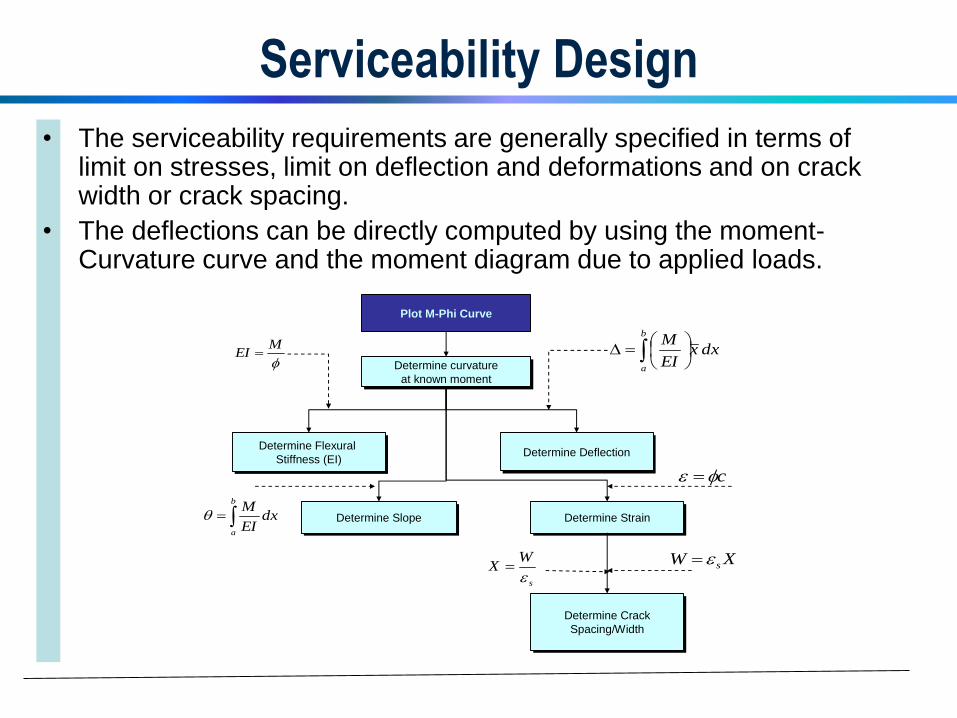
Serviceability Design
• The serviceability requirements are generally specified in terms of limit on stresses, limit on deflection and deformations and on crack width or crack spacing.
• The deflections can be directly computed by using the moment-Curvature curve and the moment diagram due to applied loads.
Plot M-Phi Curve
Determine curvature
at known moment
Determine curvature
at known moment
Determine Flexural
Stiffness (EI)
Determine Flexural
Stiffness (EI)
Determine SlopeDetermine Slope
Determine DeflectionDetermine Deflection
Determine StrainDetermine Strain
Determine Crack
Spacing/Width
Determine Crack
Spacing/Width
MEI
dxEI
Mb
a
dxxEI
Mb
a
c
XW s
s
WX
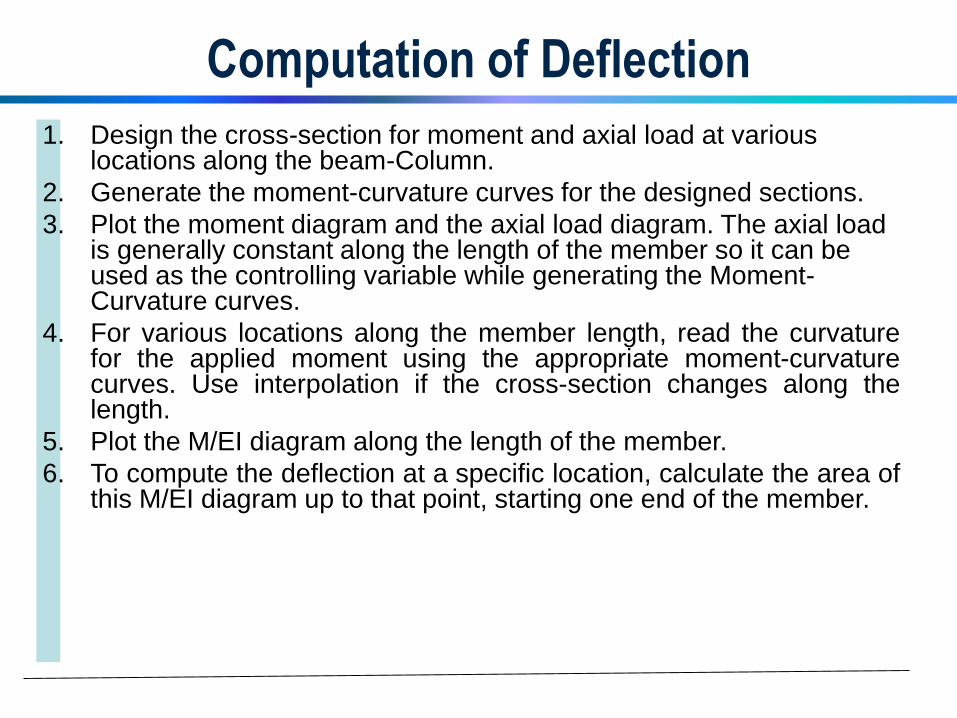
Computation of Deflection
1. Design the cross-section for moment and axial load at various locations along the beam-Column.
2. Generate the moment-curvature curves for the designed sections.
3. Plot the moment diagram and the axial load diagram. The axial load is generally constant along the length of the member so it can be used as the controlling variable while generating the Moment-Curvature curves.
4. For various locations along the member length, read the curvaturefor the applied moment using the appropriate moment-curvaturecurves. Use interpolation if the cross-section changes along thelength.
5. Plot the M/EI diagram along the length of the member.
6. To compute the deflection at a specific location, calculate the area ofthis M/EI diagram up to that point, starting one end of the member.
Conclusion
Conclusion
• The cross-sections and their properties are key
components in almost all aspects of theoretical
formulation, computer applications, practical
analysis and design.
• The cross section property of general section is
made up of several shapes and different
materials and requires good theoretical
knowledge and aid of computing tools.