Embed Size (px)
Citation preview
SHRP-C-662
Concrete Microscopy
D.M. RoyM.W. Grutzeck
B.E. Scheetz
Materials Research LaboratoryThe Pennsylvania State University
University Park, Pennsylvania
• G.M. IdomNeils Thaulow
* K.T. Andersen
G.M. Idom Consult A/SBlokken 44 Birkerod
Denmark
Strategic Highway Research ProgramNational Research Council
Washington, DC 1993
SHRP-C-662Contract C-201
Program Manager: Don M. Harriott
Project Manager: Inam JawedProduction Editor: Marsha Barrett .
Program Area Secretary: Ann Saccomano
June 1993
key words:cementconcretefluorescence
microscopymicrostructure
sample preparationthin section
Strategic Highway Research ProgramNational Academy of Sciences2101 Constitution Avenue N.W.
Washington, DC 20418
(202) 334-3774
The publication of this report does not necessarily indicate approval or endorsement of the findings, opinions,conclusions, or recommendations either inferred or specifically expressed herein by the National Academy ofSciences, the United States Government, or the American Association of State Highway and TransportationOfficials or its member states.
© 1993 National Academy of Sciences
350/NAP/693

Acknowledgmentsm
The research described herein was supported by the Strategic Highway Research Program(SHRP). SHRP is a unit of the National Research Council that was authorized by section128 of the Surface Transportation and Uniform Relocation Assistance Act of 1987.
iii
Contents
°o°
Acknowledgments ................................................. in
Abstract ........................................................ vii
1 Introduction ................................................... 1
Background ................................................. 1
2 Preparation of Fluorescent, Concrete Thin-Sections ......................... 3Instrumentation ............................................... 5Examination of Fluorescent Thin-Sections ............................ 8References ................................................. 11
3 Examination of SHRP 1-19 Concrete Samples ........................... 13Introduction ................................................ 13
Samples .................................................. 13Microstructural Data .......................................... 14
Stereological Measurements ..................................... 15General Examination .......................................... 16Alternate Methods ............................................ 19References ................................................. 20
4 Discussion .................................................. 21References ................................................. 22
" Appendix A Figures ............................................... 23
Appendix B Tables ................................................ 77
Appendix C Nordtest 677-87 Concrete, Hardened; Water-Cement Ratio .......... 101
V
Abstract
Concrete microstructure can be evaluated using both thin and polished sections. Methodsdescribed in this report were developed as a supplement to ASTM 856 procedures. The useof an epoxy resin containing a fluorescent dye tended to enhance the ability to viewporosity and mechanical features such as interface porosity and cracking. Relationships offormulation and microstructure for a series of nineteen concrete samples are presented(SHRP $89-1 to $89-19). The proposed methods are useful to the highway engineer on avariety of levels. A less skilled operator can use the epoxy impregnation technique fordevelopmental and forensic purposes, to more easily observe effects of making andformulation on homogeneity, and the relationship of cracking and secondary hydrationproducts in deteriorated concrete, respectively. The determination of water/cement ratio ismore difficult inasmuch as it is done visually by comparing the fluorescence intensity of theunknown with a series of known standards.
vii
Executive Summary
Optical and electron microscopy are valuable research tools for the study of concretemicrostructure. ASTM-C-856 already has a standard practice in place giving details of howto use optical techniques for examination of hardened concrete. The supplemental methodsdescribed in the accompanying report were also used to examine hardened concretespecimens, $89-1 to $89-19. Although most of the report emphasizes data obtained usingepoxy impregnated thin sections, alternate methods have also been explored (polishedimpregnated samples were examined in reflected fluorescent light and in the SEM).
Either thin sections dr polished sections of concrete impregnated with an epoxy dye revealenhanced inherent porosity of the paste, interface porosity and effects of cracking. Inaddition, water/cement (w/c) ratio can be determined by comparing paste porosity with aseries of carefully prepared standard samples.
Impregnation is achieved using a combination of thin epoxy mixed with a fluorescent dye.The sample is evacuated with a vacuum pump for -2 hours after which the epoxy isallowed to wet the sample and fill the pores/cracks. After the epoxy hardens one can eitherpolish the sample for reflected light and SEM examination or prepare a -20/zm thick thinsection for transmitted light examination. Whereas the reflected light sample may be easierto make, it transmits light through translucent grains in the sample. The thin section sampleis harder to make but it is more satisfactory for w/c determination because a uniformthickness thin sectioning results in uniformity and reproducibility of the amount oftransmitted light.
Concrete microstructure is quite variable, and at least qualitatively, it can be correlated with" the nature of the starting materials and the original formulation of the concrete. For
example, a formulation with a higher w/c ratio than a companion concrete revealed a higher, porosity in thin section and higher relief in polished section (the higher w/c matrix was just
not as strong).
The examination of concrete microstructure, whether in thin section or reflected light/SEM,is a powerful one, useful to the highway engineer on a number of levels. For forensicpurposes, it can be used to actually see why a concrete has deteriorated. In terms ofdeveloping a new concrete formulation or mixing procedure, the method can give theengineer information on homogeneity, relationship of porosity to interracial characteristics,overall crack development, etc. These are easy to evaluate and do not require much more
ix
training than that currently described in ASTM-C-856. However, on a more sophisticatedlevel, the determination of w/c ratio is much more difficult. In this instance, theinvestigator must compare the fluorescence of known standards with that of the unknown.
1Introduction
ASTM C 856 details a standard practice for petrographic examination of hardened concrete.It contains sections detailing microscopic methods to be used to examine polished sectionsand thin sections. It is a useful technique but one which is learned over long periods oftime and examination of many specimens. ASTM states: "It is assumed that theexamination will be made by persons qualified to operate the equipment used and to recordand interpret the results obtained."
The methods and examples presented in the following report are a refinement of Romer'soriginal work on fluorescent impregnation microscopy, and a such are directly related to theobjectives of ASTM C 856. Fluorescent microscopy is a method by which the investigatoris aided in his examination procedure by the impregnation of pores and voids by afluorescent epoxy. When viewed under fluorescent light, features such as porosity andcracks are enhanced by the fluorescence of the dye used to impregnate the sample.
Proponents of the method include Bert Romer (Switzerland), Hollis Walker (USA) andGunnar Idorn (Denmark). The following report was prepared with the cooperation ofGMIC. The report is divided into three sections. The first deals with the method itself,i.e., the preparation of fluorescent thin sections, the equipment required, and some of thebasic principles needed to examine the thin section. The second section of the reportdescribes the results of using various methods to study a series of concrete specimensprepared in this study (SHRP 1-19). The final section is a discussion section giving bothpros and cons of the method as a potential tool for the highway engineer.
Background
Thin sections have been used by petrographers and petrologists to study rocks for morethan 150 years. One of the major advantages of this method, is that it provides anopportunity to both identify the individual mineral constituents and at the same time studytheir mutual interrelationships (fabric), their morphology and their amounts.
Not surprisingly, the use of petrographic thin-sections has gained increasing recognitionwithin the field of concrete petrography. The first concrete thin-sections were hand-madeand generally quite large, having a uniform thickness falling between 0.02-0.03 man (20-30
microns). Thin-sectioning techniques have been improved, and several laboratories nowmanufacture thin sections of the desired thickness on automatic lapping machines (Ahmed,1983).
Another major step forward was the introduction of the fluorescent impregnation method(Wilk et al., 1974) by which concrete is impregnated with a fluorescent epoxy prior togrinding. By excitation of the fluorescent epoxy in the concrete with ultra-violet or bluelight, it became possible to observe even very small porosities and defects in the concrete(Walker and Marshall, 1979; Walker, 1979; Gudmundson et al., 1981; Wilk andDubrolubov, 1984; Anderson and Thaulow, 1990).
The fluorescence method was further refined when it was demonstrated that it is possible to
obtain reasonably accurate figures for the water-cement ratio used in the concrete (Walker'searly work), by visual estimation of the brightness of the hardened cement paste whenviewed in fluorescent light. This method was refined and quantified by Thaulow et al.,1982 and Damgaard Jensen, 1983. It is now a standard practice in several Europeancountries to determine the w/c ratio of hardened concrete using fluorescent thin-sections. In
addition, the preparation of fluorescent thin-sections has recently been approved as a Nordictest method, by Denmark, Norway, Sweden, Finland and Iceland (Nordtest 677-87,"Concrete, Hardened; Water-Cement Ratio," see Appendix C).
Today, about 6000-7000 fluorescent concrete thin-sections are prepared annually inDenmark alone for use in quality control, damage analyses and research. Practically noneof these thin-sections are prepared solely for the determination of the water-cement ratio ofthe cement paste since the determination of the w/c ratio only represents a small part of theinformation which can be obtained from the study of fluorescent concrete thin-sections
(Damgaard Jensen, 1985; Soers, 1985; Thaulow et al., 1989). For detailed evaluations ofthe method see Walker, 1979, and Mayfield, 1990. Both give statistics for fluorescent
microscopy examination of thin and reflected light samples, respectively.
2
2
Preparation of Fluorescent Concrete Thin-Sections
Most of the equipment required for the preparation of thin-sections from concrete, is similarto the instrumentation used in the preparation of ordinary petrographic thin-sections. A
large variety of brands, including self-made machinery, are currently used in the USA andEurope for the preparation of thin-sections. Consequently, a detailed description of theseitems is beyond the scope of this report. Interested readers are referred to ASTM C 856 orother publications dealing with thin-section preparation. However, these lists must besupplemented with a few additional items in order to ensure the optimum quality of thefluorescent thin-sections. These items include:
A desiccator with an attached vacuum pump,A diamond grinding wheel (15-20 #m diamonds),An epoxy resin, preferably low viscosity, andFluorescent dye.
Before preparation of the thin-section, it is important to select a proper volume of concretefor the thin-sectioning.
This selection should depend both on the representativeness of the cores/samples, and onthe features which are being examined. If surface cracking and carbonation are to beinvestigated, it would be logical to thin-section exposed surfaces of the concrete. Theidentification of alkali-silica reactions and reacting aggregate particles usually requires thatthe thin-section be located a couple of centimeters away from the exposed surface of the
. concrete as general experience shows that these reactions tend to be weaker at thenear-surface regions of the concrete.
The chosen area should be included in a rectangular piece of concrete, normally with thesize: 45x30x20 mm, which is cut from the specimen with a rock saw. The cutting shouldbe done with care in order to avoid the introduction of fine cracking and other flaws in the
specimen.
The cut concrete specimen is then immersed in pure ethanol and allowed to reside there forapproximately 12 hours. The ethanol replaces some of the water in the concrete whichreduces the tendency of cracking in the concrete during the subsequent drying procedure.
The concrete specimen is then placed in a vacuum chamber equipped with a hot plate forfinal drying. It is important that this drying occurs at 30°-35°C (85°-95°F) as excessiveheating will introduce undesirable microcracking in the specimen.
The specimen should be allowed to dry for approximately 2 hours.
The specimen is then placed in a small vessel, with the side to be mounted on the glassslide facing downwards, ready for the first vacuum impregnation with epoxy.
The epoxy should be of a low viscosity type in order to promote the penetration of theepoxy into the concrete. Likewise, the epoxy must be intermixed with precisely 1.1% byweight of a fluorescent dye. However, this may vary from epoxy to epoxy and dye to dyedepending on the combination chosen by the investigator.
It is very important that the dosage of dye per volume of epoxy is accurately measured aseven small variations in the concentration will seriously affect the determination of the w/cratios on the finished thin-sections.
For the same reasons, one should ensure that the epoxy/dye mixture is completely
homogenized. It is thus common practice to stir the mixture with a magnetic stirrer for atleast 24 hours before use.
Once ready for use, the epoxy is poured into the small vessel, containing the specimen.The vessel is subsequently placed in a vacuum chamber and the specimen is allowed tosoak at < 0.1 mbar pressure for 1 hour while the samples are still submerged in epoxy, airis then allowed to re-enter the chamber.
The penetration depth of the epoxy depends largely on the viscosity of the epoxy used andon the permeability of the concrete. It is normally observed that the concrete will beimpregnated to a depth of approximately 1-2 ram. High strength concretes with a low w/cratio and concretes with mineral admixtures such as silica fume are normally more difficult
to impregnate adequately.
Following impregnation, the side opposite to the selected large face of the specimen isglued to a glass plate with an ultraviolet (UV) hardening glue.
The glass plate should be of appropriate size so that it fits the clamping device of thegrinding equipment.
The next step is to prepare the selected face of the concrete specimen for mounting on theobject glass.
The epoxy covering the exposed large face of the concrete specimen is carefully removedby mounting the glass plate which was glued to the specimen in the petrographic lappingmachine and subsequently grinding the opposite face carefully in order to obtain acompletely level surface. The finishing operation should be performed on a 15-20 #mdiamond disc.
4

It is important that loose abrasives are never used during these operations as the grit tend tostick to the impregnating epoxy in the concrete. It must also be emphasized that the finaloperations of the grinding procedure be performed as fast as possible as carbonation of thefreshly ground surface might otherwise occur.
The specimen is cleaned and allowed to dry before it is re-impregnated with fluorescentepoxy. This impregnation should also include the recently ground surface. It is
- recommended that excess epoxy be scraped off the ground surface while it is still softleaving a layer approximately 1-2 mm thick, as this will facilitate the final polishing of thisface.
The excess epoxy on the ground face is carefully removed after it has hardened bypolishing on the diamond disc. Caution should be exercised during this grinding operationas the removal of too much material will leave too little impregnated concrete for the
finishing operations. However, should this happen, one can recover the sample byre-impregnating the concrete and repeating the grinding of the face.
After cleaning and drying of the ground surface, a glass slide is mounted to the surfaceusing an epoxy glue.
The specimen is now cut with a fine diamond saw parallel to the recently mounted slideapproximately 1 mm from the slide. Once cut, the piece containing the auxiliary glass plateis saved/discarded.
The slide on the specimen is now mounted in a specimen holder on the lapping machineand ground down to a thickness of approximately 100/zm. The final polishing of thethin-section down to a thickness of 20 #m is performed by hand on the diamond disc. Thispart of the preparation requires great skill as the thin-section might otherwise end up beingtoo thin, wedge shaped or feathered.
The polished face is covered with a cover glass by applying one drop of epoxy to the centerof the concrete and carefully pressing the cover glass down vertically on the drop. It isimportant that no air bubbles are trapped underneath the cover glass as this would seriouslyreduce the quality of the thin-section.
Many of the above procedures resemble the procedures followed during the preparation ofgeological thin-sections. The major difficulties in preparing thin-sections from concrete arenormally associated with tearing out the cement paste, especially around voids in theconcrete and/or achieving an equal thickness over the entire thin-section. The latterproblem can be especially difficult to avoid when thin-sections are prepared from concretescontaining hard and dense aggregates.
Instrumentation
Evidently, the petrographic microscope plays a central role in the examination of theconcrete thin-section. A detailed treatment of the construction and function of the
petrographic microscope can be found in other textbooks and will only be treated briefly inthis report. The modifications of the standard petrographic microscope which are requiredin order to use the fluorescent light illumination technique are rather few and uncostly andwill be treated during the description of the fluorescence technique.
Figure 1 is a schematic drawing of a "Leitz" petrographic microscope. The figure showsthe most basic features and the light path in the instrument. The thin-section is placed onthe rotating stage just below the objective. Light passes via a circular hole in the stage, upthrough the semi-transparent thin-section and further through the magnifying lens, theobjective. Several objectives are mounted on a circular revolving nose which makes itpossible to shift between several magnifications. It is thus possible to examine thethin-section in magnifications ranging from 25x to approximately 600x.
The light source needs to be more powerful than normally employed in petrographicmicroscopes if examination in fluorescent light is desired. It normally suffices to use a100-W halogen lamp.
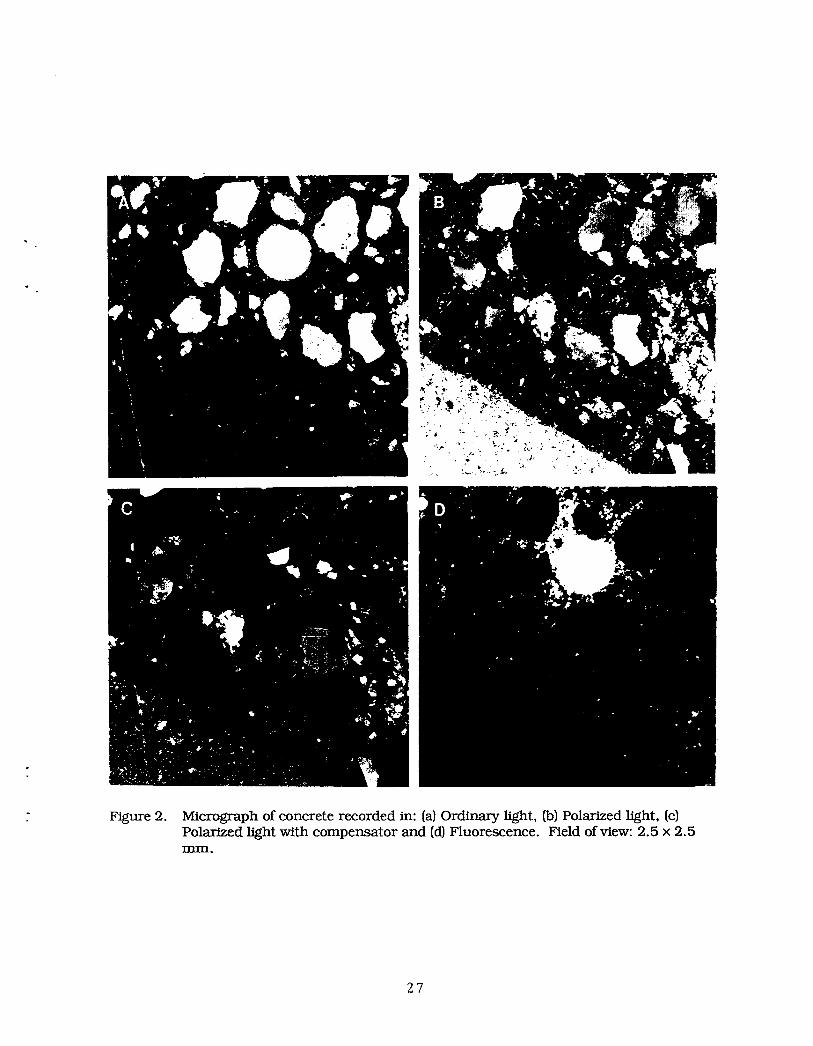
Examination of the thin-sections can be performed in four different modes:
Ordinary light,Polarized light,Polarized light with compensator, andFluorescence.
Ordinary light examination as illustrated in Figure 2a, is achieved by allowing the lightfrom the light source to pass unhindered through the thin-section. Examination of theconcrete in this mode makes all of the constituents of the concrete appear in their natural
"transmitted light" color. Thus, quartz will appear white due to its lack of color, whilefly-ash can show various shades from almost colorless to deep brown. The hardenedcement paste normally has a buff colored appearance. Most minerals do, unfortunately,appear colorless in transmitted light in thin-section which often makes their distinctiondifficult. However, due to the crystalline characteristics of most minerals, it is possible tomake further identifications by the use of polarizing light microscopy. Polarized lightmode, shown in Figure 2b, is obtained by inserting a polarizing filter in the light ray before
it passes through the thin-section. This filter, normally called the "polarizer" causes lightfrom the lamp to oscillate in one direction, denoted "North-South" (N-S). Another -_polarizing filter, the "analyzer", is inserted in the light ray after it has passed through thethin-section only allowing light oscillating in the East-West (E-W) direction to pass through .3
to the observer.
Thus, if light is allowed to pass uninterrupted from the polarizer to the analyzer, that is, ifthe thin-section is removed, the image seen in the eye pieces will be completely dark as all
light passing through from the polarizer is absorbed by the analyzer.
However, the image will not be dark when the thin-section is inserted in the light pathbetween the polarizer and the analyzer if birefringent material is present. When the lightwhich has been forced to oscillate in one direction by the polarizer, passes through a
6
crystalline solid in the thin-section, such as quartz, or calcite in a limestone aggregate, theray will be split into two oscillation directions. At the same time one of the rays will bedelayed with respect to the other due to differences in refractive index. The actualmechanisms for this optical behavior of crystalline solids is rather complicated and thereader who wants further knowledge about these topics is referred to the crystal opticalliterature, for instance Phillips (1971). However, by treating the light emanating from thecrystalline materials in the thin-section with the analyzer, a distinct coloration ofbirefringent minerals can be seen in the eyepiece. These colors assist the petrographer indistinguishing between the different crystalline solids in the thin-section. Materials whichare either glassy, amorphous or belong to the cubic crystal system, do not alter the behaviorof the polarized ray during passage. These materials will appear completely dark whenviewed in polarized light; they are isotropic.
The difference between observation in polarized light and in polarized light with a
compensator is that the compensator adds or subtracts a well known "retardation" to therays emitted from the thin-section. This is seen in the microscope as a rather spectacularcoloration of the polarized image, Figure 2c. This method is only used as an aid in theidentification of minerals during examination in polarized light.
So far, only the examination devices available on the standard petrographic microscope,have been described. Application of the fluorescence method for the determination of w/cratios and for the detection of flaws and inhomogeneities in the concrete requires a fewadditional accessories.
First, a monochromatic light source is required which is able to induce fluorescence in the
epoxy in the thin-sections. The light should be monochromatic as excess light has to befiltered away after passage through the thin-section. The monochromatic illumination isobtained by inserting a filter designed to pass ultraviolet light (BG 12), in the light pathbefore it enters the thin-section. This UV filter allows the passage of light with a wave
length around 350 nm. Due to the large absorption of light during passage of the bluefilter, it is necessary to use a powerful light source with an intensity around 100 W.
The fluorescent dye in the epoxy is excited by the UV light and emits yellow light with apeak intensity a little above 530 nrn. By insertion of a yellow filter (K510 or K530) in thelight path above the thin-section which absorbs all light with a wave length beyond 510 to530 nm, the excessive UV light from the light source is filtered away. The resultant imagein the eyepieces thus comprises the light emitted from the fluorescent epoxy only. Asporous areas in the thin-section contain a higher portion of fluorescent epoxy, it follows thatporous areas in the concrete thin-section appear bright while dense areas appear dark. Thisis shown in Figure 2d.
From the above principles it is evident that features such as microcracks, air voids, porouspaste-aggregate interfaces etc. will appear bright yellow when viewed in fluorescent light.The coarse aggregates and the sand particles in the concrete are normally so dense that theyappear dark green in fluorescence. An aggregate with zero porosity should theoretically becompletely dark, but in practice it may appear dark green.
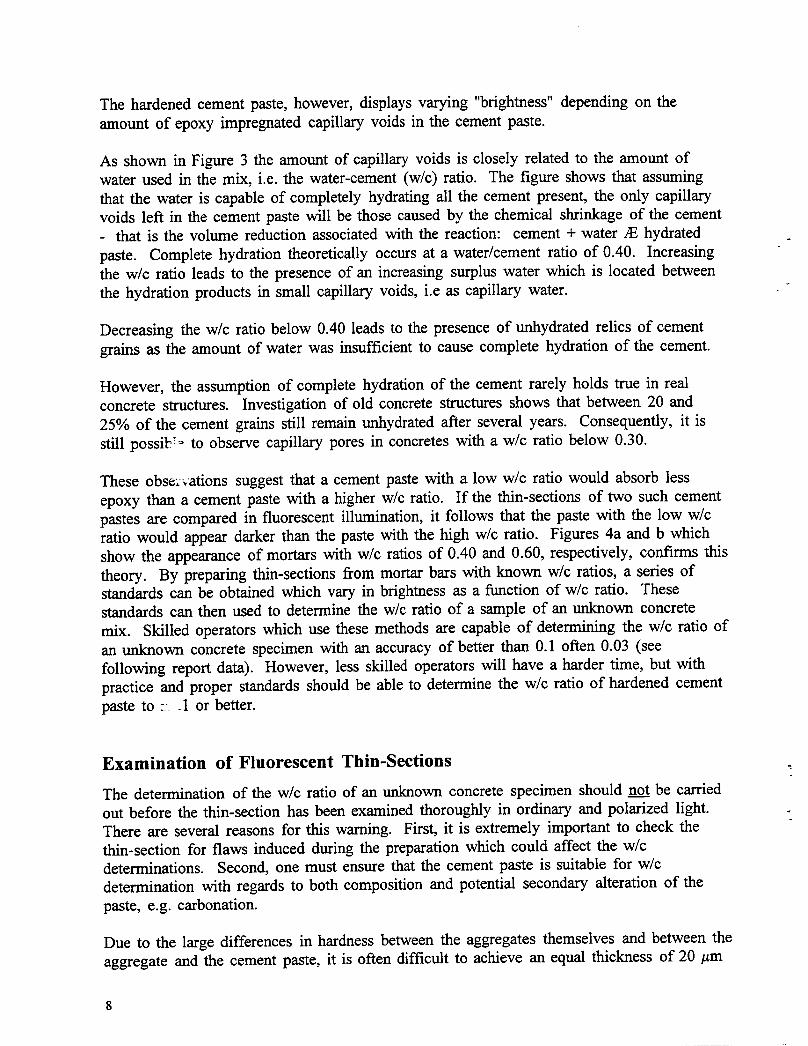
The hardened cement paste, however, displays varying "brightness" depending on theamount of epoxy impregnated capillary voids in the cement paste.
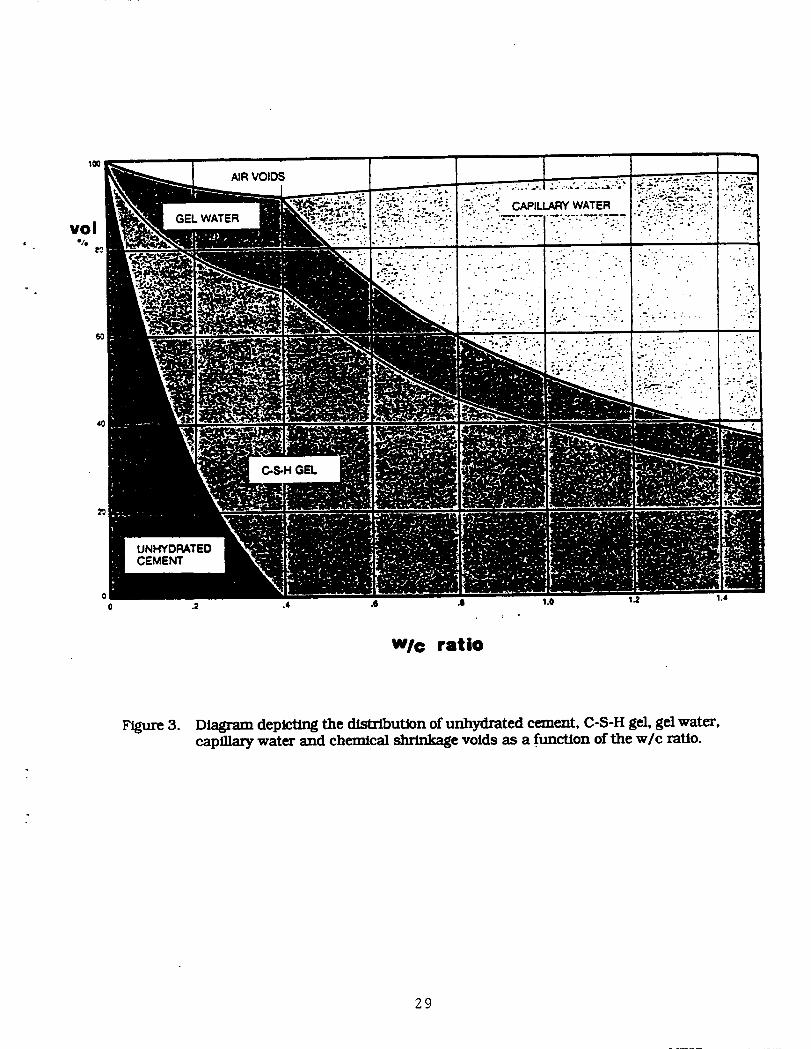
As shown in Figure 3 the amount of capillary voids is closely related to the amount ofwater used in the mix, i.e. the water-cement (w/c) ratio. The figure shows that assumingthat the water is capable of completely hydrating all the cement present, the only capillaryvoids left in the cement paste will be those caused by the chemical shrinkage of the cement- that is the volume reduction associated with the reaction: cement + water/E hydratedpaste. Complete hydration theoretically occurs at a water/cement ratio of 0.40. Increasingthe w/c ratio leads to the presence of an increasing surplus water which is located betweenthe hydration products in small capillary voids, i.e as capillary water.
Decreasing the w/c ratio below 0.40 leads to the presence of unhydrated relics of cementgrains as the amount of water was insufficient to cause complete hydration of the cement.
However, the assumption of complete hydration of the cement rarely holds true in realconcrete structures. Investigation of old concrete structures shows that between 20 and25% of the cement grains still remain unhydrated after several years. Consequently, it isstill possi_ _ to observe capillary pores in concretes with a w/c ratio below 0.30.
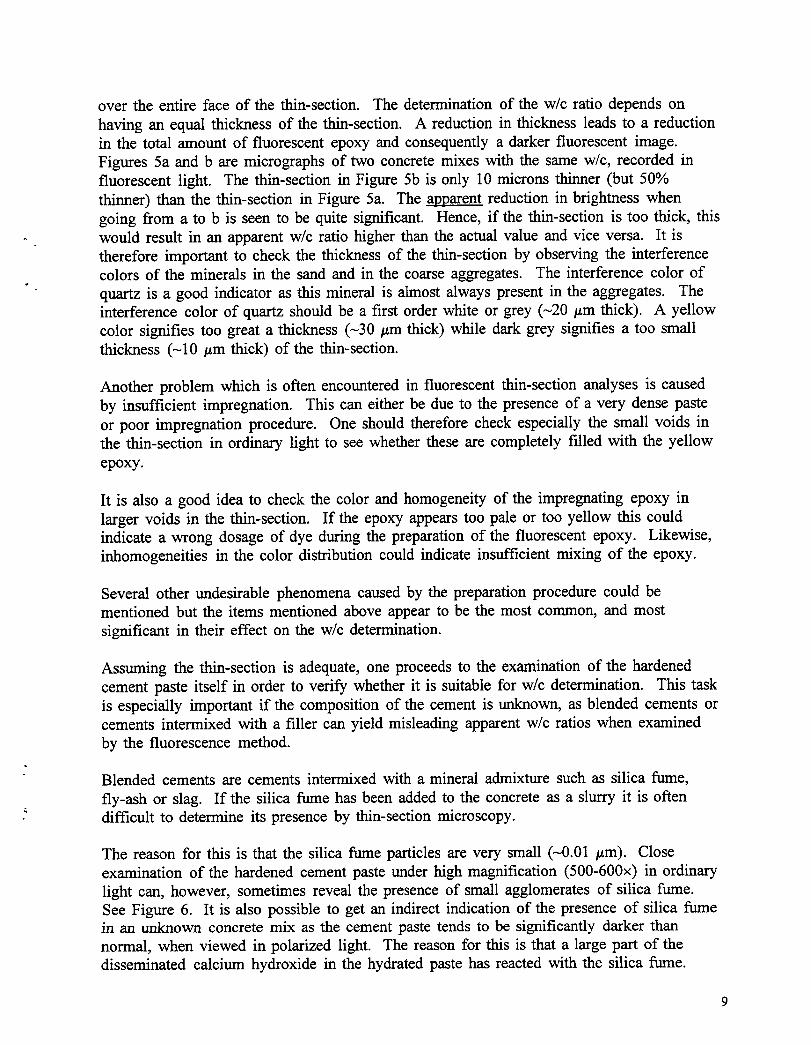
These obsezvations suggest that a cement paste with a low w/c ratio would absorb lessepoxy than a cement paste with a higher w/c ratio. If the thin-sections of two such cementpastes are compared in fluorescent illumination, it follows that the paste with the low w/cratio would appear darker than the paste with the high w/c ratio. Figures 4a and b whichshow the appearance of mortars with w/c ratios of 0.40 and 0.60, respectively, confirms thistheory. By preparing thin-sections from mortar bars with known w/c ratios, a series ofstandards can be obtained which vary in brightness as a function of w/c ratio. Thesestandards can then used to determine the w/c ratio of a sample of an unknown concretemix. Skilled operators which use these methods are capable of determining the w/c ratio ofan unknown concrete specimen with an accuracy of better than 0.1 often 0.03 (seefollowing report data). However, less skilled operators will have a harder time, but withpractice and proper standards should be able to determine the w/c ratio of hardened cementpaste to ::_ .1 or better.
Examination of Fluorescent Thin-Sections
The determination of the w/c ratio of an unknown concrete specimen should not be carriedout before the thin-section has been examined thoroughly in ordinary and polarized light.There are several reasons for this warning. First, it is extremely important to check thethin-section for flaws induced during the preparation which could affect the w/cdeterminations. Second, one must ensure that the cement paste is suitable for w/cdetermination with regards to both composition and potential secondary alteration of thepaste, e.g. carbonation.
Due to the large differences in hardness between the aggregates themselves and between theaggregate and the cement paste, it is often difficult to achieve an equal thickness of 20 #m
over the entire face of the thin-section. The determination of the w/c ratio depends on
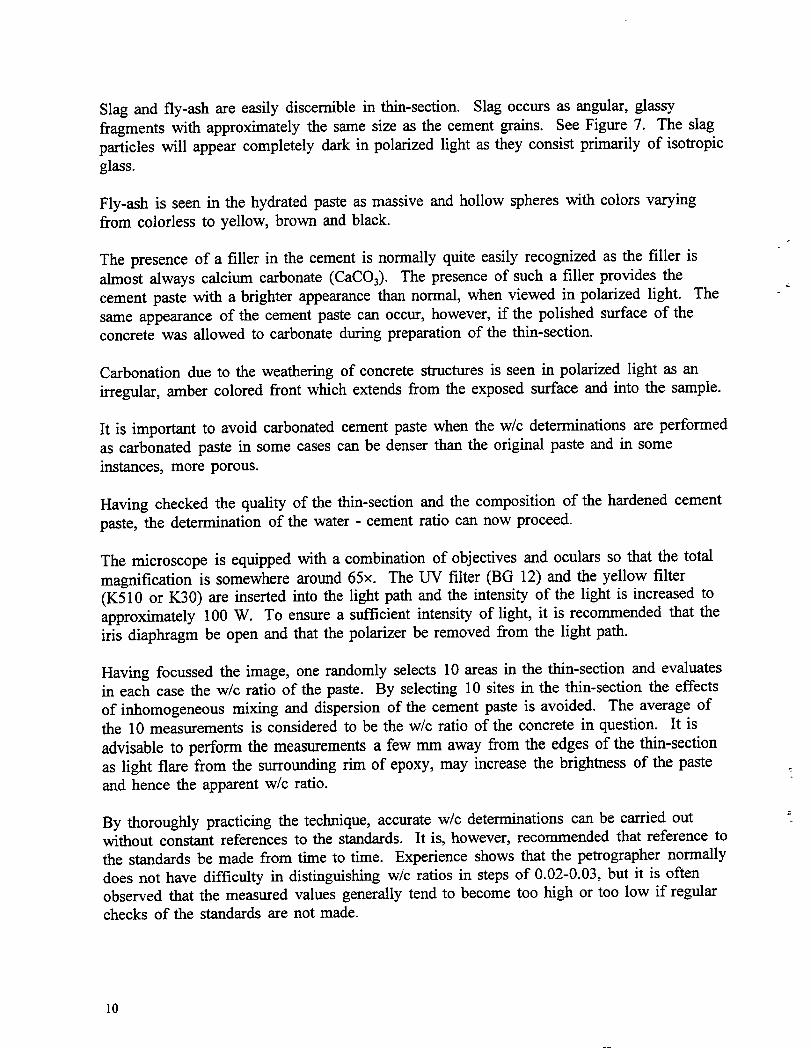
having an equal thickness of the thin-section. A reduction in thickness leads to a reductionin the total amount of fluorescent epoxy and consequently a darker fluorescent image.Figures 5a and b are micrographs of two concrete mixes with the same w/c, recorded influorescent light. The thin-section in Figure 5b is only 10 microns thinner (but 50%thinner) than the thin-section in Figure 5a. The apparent reduction in brightness whengoing from a to b is seen to be quite significant. Hence, if the thin-section is too thick, thiswould result in an apparent w/c ratio higher than the actual value and vice versa. It istherefore important to check the thickness of the thin-section by observing the interferencecolors of the minerals in the sand and in the coarse aggregates. The interference color of
" " quartz is a good indicator as this mineral is almost always present in the aggregates. Theinterference color of quartz should be a first order white or grey (-20/_m thick). A yellowcolor signifies too great a thickness (-30/_m thick) while dark grey signifies a too smallthickness (-10 #m thick) of the thin-section.
Another problem which is often encountered in fluorescent thin-section analyses is causedby insufficient impregnation. This can either be due to the presence of a very dense pasteor poor impregnation procedure. One should therefore check especially the small voids inthe thin-section in ordinary light to see whether these are completely filled with the yellowepoxy.
It is also a good idea to check the color and homogeneity of the impregnating epoxy inlarger voids in the thin-section. If the epoxy appears too pale or too yellow this couldindicate a wrong dosage of dye during the preparation of the fluorescent epoxy. Likewise,inhomogeneities in the color distribution could indicate insufficient mixing of the epoxy.
Several other undesirable phenomena caused by the preparation procedure could bementioned but the items mentioned above appear to be the most common, and mostsignificant in their effect on the w/c determination.
Assuming the thin-section is adequate, one proceeds to the examination of the hardenedcement paste itself in order to verify whether it is suitable for w/c determination. This taskis especially important if the composition of the cement is unknown, as blended cements orcements intermixed with a filler can yield misleading apparent w/c ratios when examinedby the fluorescence method.
Blended cements are cements intermixed with a mineral admixture such as silica fume,
fly-ash or slag. If the silica fume has been added to the concrete as a slurry it is oftendifficult to determine its presence by thin-section microscopy.
The reason for this is that the silica fume particles are very small (-0.01 /_m). Closeexamination of the hardened cement paste under high magnification (500-600x) in ordinarylight can, however, sometimes reveal the presence of small agglomerates of silica fume.See Figure 6. It is also possible to get an indirect indication of the presence of silica fumein an unknown concrete mix as the cement paste tends to be significantly darker thannormal, when viewed in polarized light. The reason for this is that a large part of thedisseminated calcium hydroxide in the hydrated paste has reacted with the silica fume.
Slag and fly-ash are easily discernible in thin-section. Slag occurs as angular, glassyfragments with approximately the same size as the cement grains. See Figure 7. The slagparticles will appear completely dark in polarized light as they consist primarily of isotropicglass.
Fly-ash is seen in the hydrated paste as massive and hollow spheres with colors varyingfrom colorless to yellow, brown and black.
The presence of a filler in the cement is normally quite easily recognized as the filler isalmost always calcium carbonate (CaCO3). The presence of such a filler provides thecement paste with a brighter appearance than normal, when viewed in polarized light. Thesame appearance of the cement paste can occur, however, if the polished surface of theconcrete was allowed to carbonate during preparation of the thin-section.
Carbonation due to the weathering of concrete structures is seen in polarized light as anirregular, amber colored front which extends from the exposed surface and into the sample.
It is important to avoid carbonated cement paste when the w/c determinations are performedas carbonated paste in some cases can be denser than the original paste and in someinstances, more porous.
Having checked the quality of the thin-section and the composition of the hardened cementpaste, the determination of the water - cement ratio can now proceed.
The microscope is equipped with a combination of objectives and oculars so that the totalmagnification is somewhere around 65x. The UV filter (BG 12) and the yellow filter(K510 or K30) are inserted into the light path and the intensity of the light is increased toapproximately 100 W. To ensure a sufficient intensity of light, it is recommended that theiris diaphragm be open and that the polarizer be removed from the light path.
Having focussed the image, one randomly selects 10 areas in the thin-section and evaluatesin each case the w/c ratio of the paste. By selecting 10 sites in the thin-section the effectsof inhomogeneous mixing and dispersion of the cement paste is avoided. The average ofthe 10 measurements is considered to be the w/c ratio of the concrete in question. It isadvisable to perform the measurements a few mm away from the edges of the thin-section
as light flare from the surrounding rim of epoxy, may increase the brightness of the paste -_and hence the apparent w/c ratio.
By thoroughly practicing the technique, accurate w/c determinations can be carried outwithout constant references to the standards. It is, however, recommended that reference tothe standards be made from time to time. Experience shows that the petrographer normallydoes not have difficulty in distinguishing w/c ratios in steps of 0.02-0.03, but it is oftenobserved that the measured values generally tend to become too high or too low if regularchecks of the standards are not made.
10
References
W.U. Ahmed, Improvements in Sample Preparation Technique For Microscopic Analysesof Clinker and related materials" Proceedings of The 5 International Conference onCement Microscopy, Nashville Tennessee, USA, 1983.
K.T. Andersen and N. Thaulow, "The study of Alkali-Silica reactions in Concrete by TheUse of Fluorescent Thin-Sections" Symposium on Petrography Applied to Concrete,ASTM, St. Louis, June 1989.
A. Damgaard Jensen, "Investigation of Concrete by Analyses of Thin-sections" IABSESymposium on Strengthening of Building Structures, Venice, 1983.
A. Damgaard Jensen, "Strukturanalyse af Beton" (Structural Analyses of Concrete), BetonTeknik, Cto, Denmark, 1985. (in Danish)
H. Gudmundsson, S. Chatterji, A. Damgaard Jensen, N. Thaulow and P. Christensen,"Quantitative Microscopy as a Tool For The Quality Control of Concrete" Proceedingsof The 3 International Conference on Cement Microscopy, Nashville Tennessee, USA,1981.
B. Mayfield (1990), "The Quantitative Evaluation of the Water/Cement Ratio UsingFluorescence Microscopy," Magazine Concrete Research, 42, 45-49 (1990).
Nordtest 677-87, "Concrete, Hardened: Water-Cement Ratio," Nr. 677-87.
W.R. Phillips W. R., "Mineral Optics - Principles and Techniques," Freeman, 1971.
E. Soers, "Preliminary Results on a Petrographical Examination of Alkali-Silica Reactionsin Belgium" Proceedings of The 10 International Conference on Cement Microscopy,San Antonio, Texas, USA, 1988.
N. Thaulow, A. Damgaard Jensen, S. Chatterji, P. Christensen and H. Gudmundsson,"Estimation of The Compressive Strength of Concrete Samples by Means ofFluorescence Microscopy" Nordisk Betong, No 2,4, 1982.
N. Thaulow, K.T. Andersen and J. Holm, "Petrographic Examination and ChemicalAnalyses of The Lucinda Jetty Prestressed Concrete Roadway", 8 InternationalConference on Alkali-Aggregate Reaction, Kyoto, Japan, 1989.
H.N. Walker and B.F. Marshall, "Methods and Equipment Used in Preparing andExamining Fluorescent Ultrathin Sections of Portland Cement Concrete," Cement,Concrete and Aggregates, CCAGDP 1 (1), 3-9, 1979.
H.N. Walker, "Evaluation and Adaptation of the Dubrulov and Romer Method ofMicroscopic Examination of Hardened Concrete," VA Highway and TransportationResearch Council, Charlottesville, VA, April 1979, VHTRC 79-R42 (60 pp).
11
W. Wilk, G. Dubrolubov and B. Romer, "Development in Quality Control of Concrete",TRR 504, Transportation Research Board, 1974.
W. Wilk and G. Dubrolubov, "Microscopic Quality Control of Concrete DuringConstruction" Proceedings of the 6th International Conference on cement Microscopy,New Mexico, 1984.
12
3
.. Examination of SHRP 1-19 Concrete Samples
Introduction
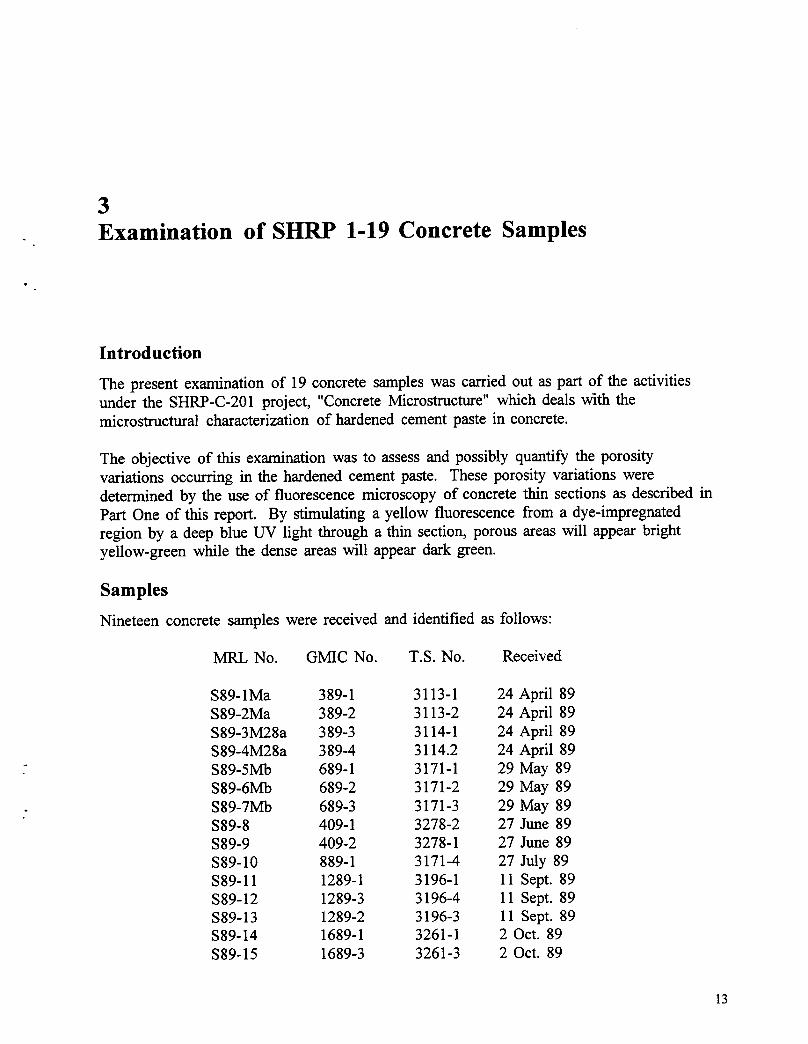
The present examination of 19 concrete samples was carried out as part of the activitiesunder the SHRP-C-201 project, "Concrete Microstructure" which deals with themicrostructural characterization of hardened cement paste in concrete.
The objective of this examination was to assess and possibly quantify the porosityvariations occurring in the hardened cement paste. These porosity variations weredetermined by the use of fluorescence microscopy of concrete thin sections as described inPart One of this report. By stimulating a yellow fluorescence from a dye-impregnatedregion by a deep blue U'V light through a thin section, porous areas will appear brightyellow-green while the dense areas will appear dark green.
Samples
Nineteen concrete samples were received and identified as follows:
MRL No. GMIC No. T.S. No. Received
S89-1Ma 389-1 3113-1 24 April 89$89-2Ma 389-2 3113-2 24 April 89S89-3M28a 389-3 3114-1 24 April 89S89-4M28a 389-4 3114.2 24 April 89$89-5Mb 689-1 3171-1 29 May 89$89-6Mb 689-2 3171-2 29 May 89$89-7Mb 689-3 3171-3 29 May 89$89-8 409-1 3278-2 27 June 89$89-9 409-2 3278-1 27 June 89$89-10 889-1 3171-4 27 July 89$89-11 1289-1 3196-1 11 Sept. 89$89-12 1289-3 3196-4 11 Sept. 89$89-13 1289-2 3196-3 11 Sept. 89$89-14 1689-1 3261-1 2 Oct. 89$89-15 1689-3 3261-3 2 Oct. 89
13
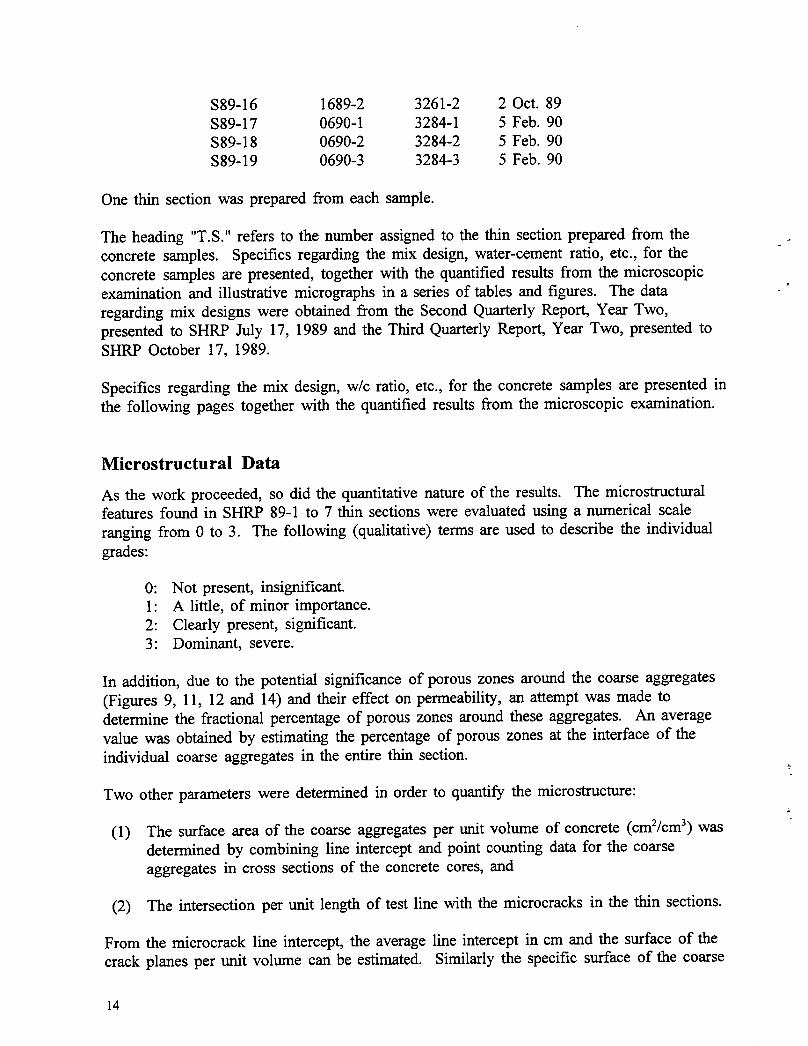
$89-16 1689-2 3261-2 2 Oct. 89$89-17 0690-1 3284-1 5 Feb. 90$89-18 0690-2 3284-2 5 Feb. 90$89-19 0690-3 3284-3 5 Feb. 90
One thin section was prepared from each sample.
The heading "T.S." refers to the number assigned to the thin section prepared from the ..concrete samples. Specifics regarding the mix design, water-cement ratio, etc., for theconcrete samples are presented, together with the quantified results from the microscopicexamination and illustrative micrographs in a series of tables and figures. The data
regarding mix designs were obtained from the Second Quarterly Report, Year Two,presented to SHRP July 17, 1989 and the Third Quarterly Report, Year Two, presented toSHRP October 17, 1989.
Specifics regarding the mix design, w/c ratio, etc., for the concrete samples are presented inthe following pages together with the quantified results from the microscopic examination.
Microstructural Data
As the work proceeded, so did the quantitative nature of the results. The microstructuralfeatures found in SHRP 89-1 to 7 thin sections were evaluated using a numerical scale
ranging from 0 to 3. The following (qualitative) terms are used to describe the individualgrades:
0: Not present, insignificant.1: A little, of minor importance.2" Clearly present, significant.3: Dominant, severe.
In addition, due to the potential significance of porous zones around the coarse aggregates
(Figures 9, 11, 12 and 14) and their effect on permeability, an attempt was made todetermine the fractional percentage of porous zones around these aggregates. An averagevalue was obtained by estimating the percentage of porous zones at the interface of theindividual coarse aggregates in the entire thin section.
Two other parameters were determined in order to quantify the microstructure:
(1) The surface area of the coarse aggregates per unit volume of concrete (cm2/cm3) wasdetermined by combining line intercept and point counting data for the coarseaggregates in cross sections of the concrete cores, and
(2) The intersection per unit length of test line with the microcracks in the thin sections.
From the microcrack line intercept, the average line intercept in cm and the surface of the
crack planes per unit volume can be estimated. Similarly the specific surface of the coarse
14
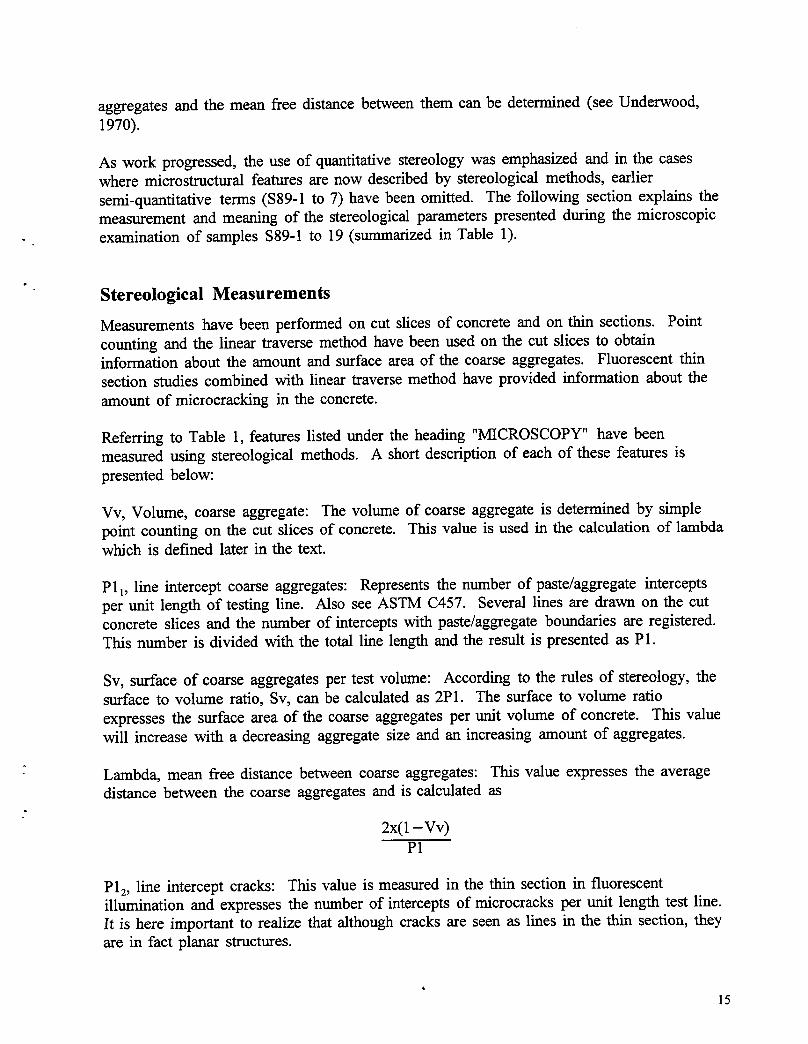
aggregates and the mean free distance between them can be determined (see Underwood,1970).
As work progressed, the use of quantitative stereology was emphasized and in the caseswhere microstructural features are now described by stereological methods, earlier
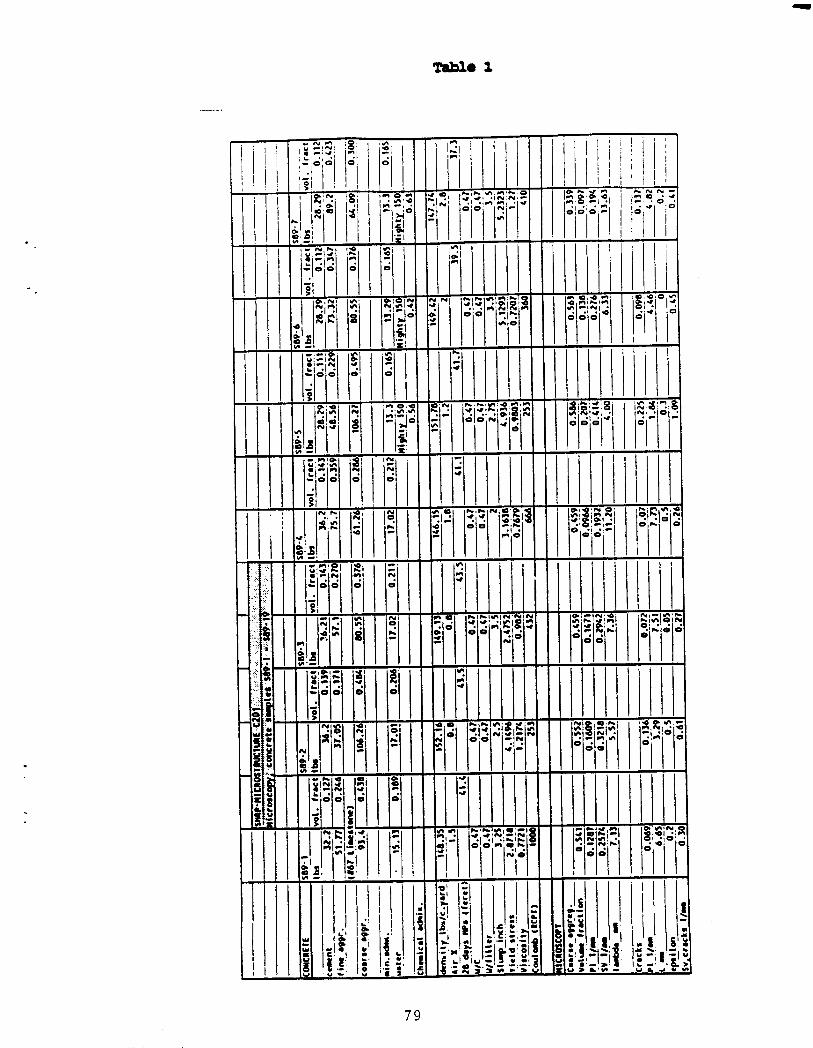
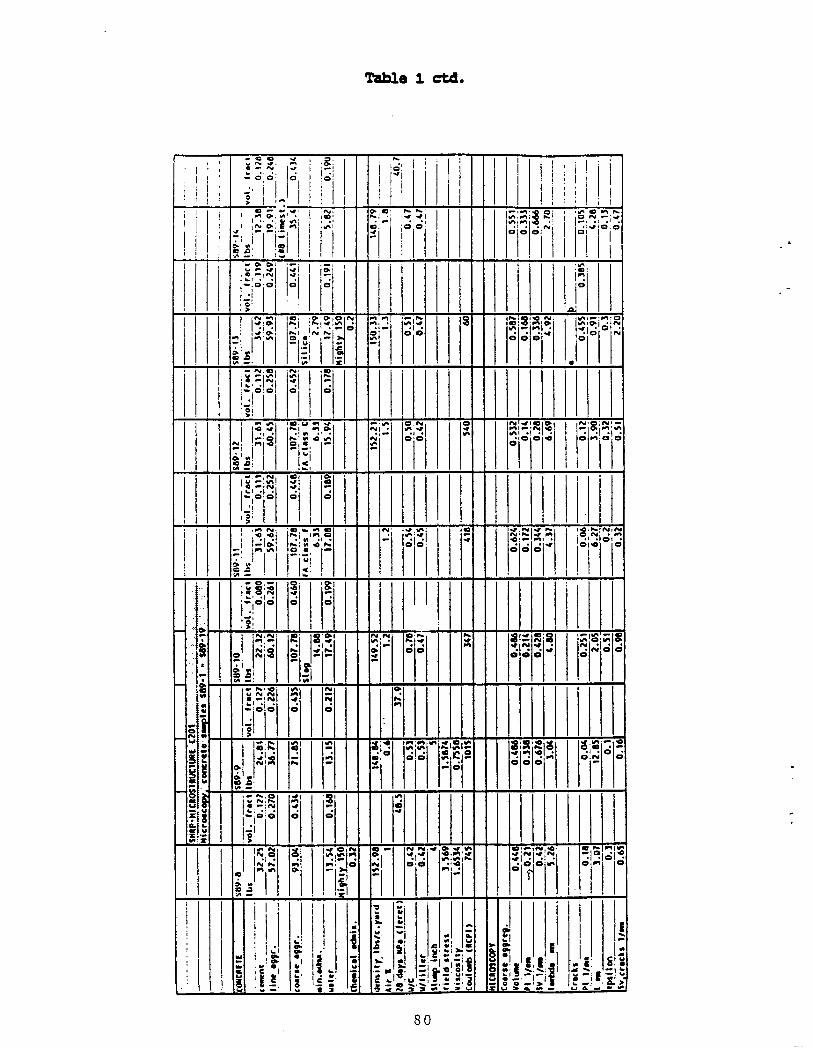
semi-quantitative terms ($89-1 to 7) have been omitted. The following section explains themeasurement and meaning of the stereological parameters presented during the microscopicexamination of samples $89-1 to 19 (summarized in Table 1).
Stereological Measurements
Measurements have been performed on cut slices of concrete and on thin sections. Pointcounting and the linear traverse method have been used on the cut slices to obtaininformation about the amount and surface area of the coarse aggregates. Fluorescent thinsection studies combined with linear traverse method have provided information about theamount of microcracking in the concrete.
Referring to Table 1, features listed under the heading "MICROSCOPY" have beenmeasured using stereological methods. A short description of each of these features ispresented below:
Vv, Volume, coarse aggregate: The volume of coarse aggregate is determined by simplepoint counting on the cut slices of concrete. This value is used in the calculation of lambdawhich is defined later in the text.
Pll, line intercept coarse aggregates: Represents the number of paste/aggregate interceptsper unit length of testing line. Also see ASTM C457. Several lines are drawn on the cutconcrete slices and the number of intercepts with paste/aggregate boundaries are registered.This number is divided with the total line length and the result is presented as P1.
Sv, surface of coarse aggregates per test volume: According to the rules of stereology, thesurface to volume ratio, Sv, can be calculated as 2P1. The surface to volume ratioexpresses the surface area of the coarse aggregates per unit volume of concrete. This valuewill increase with a decreasing aggregate size and an increasing amount of aggregates.
Lambda, mean free distance between coarse aggregates: This value expresses the averagedistance between the coarse aggregates and is calculated as
2x(1 -Vv)P1
P12, line intercept cracks: This value is measured in the thin section in fluorescentillumination and expresses the number of intercepts of microcracks per unit length test line.It is here important to realize that although cracks are seen as lines in the thin section, theyare in fact planar structures.
4
15
L, mean free distance between cracks: Expresses the average distance between cracks perunit volume of mortar; that is, exclusive of coarse aggregates. The value is calculated as:
(1-Vv aggregates)P1
The value is normalized per volume mortar as this operation makes the L values fromdifferent concrete mixes straightforward comparable.
Epsilon, cracks: This value represents the fraction of the paste/aggregate interface whichappears porous or cracked when viewed in thin section in fluorescent light. This value hasbeen established by measuring the length of the periphery of the individual coarse aggregateparticles in thin section and subsequently by measuring the length of the porous or crackedpaste/aggregate interface.
General Examination
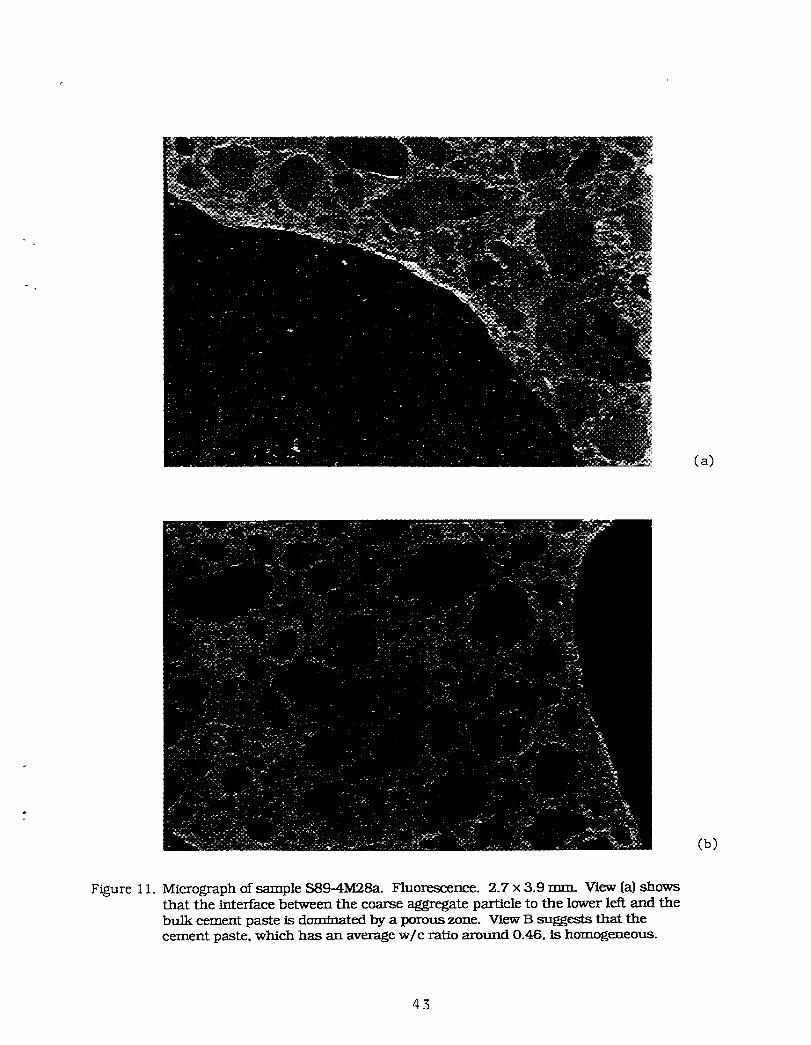
Samples $89: 1Ma, 2Ma, 3M28a and 4M28a
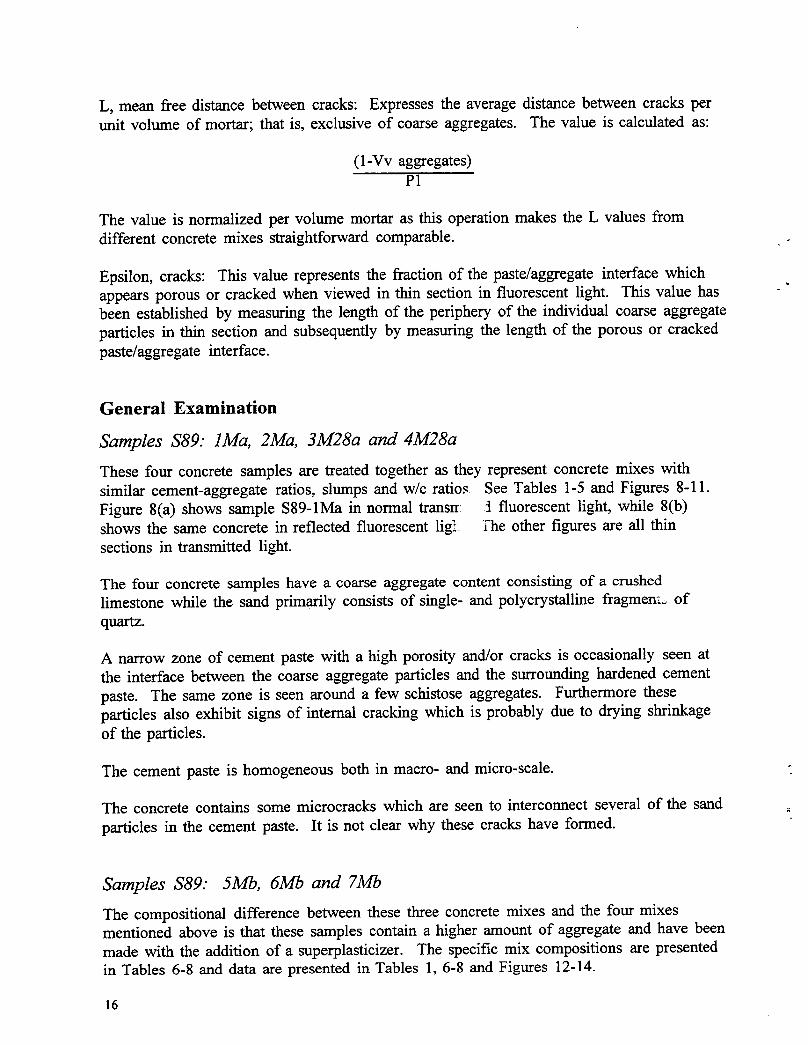
These four concrete samples are treated together as they represent concrete mixes withsimilar cement-aggregate ratios, slumps and w/c ratios See Tables 1-5 and Figures 8-11.Figure 8(a) shows sample S89-1Ma in normal transrr: :1 fluorescent light, while 8(b)shows the same concrete in reflected fluorescent lig_ i_he other figures are all thinsections in transmitted light.
The four concrete samples have a coarse aggregate content consisting of a crushedlimestone while the sand primarily consists of single- and polycrystalline fragmenz_ ofquartz.
A narrow zone of cement paste with a high porosity and/or cracks is occasionally seen atthe interface between the coarse aggregate particles and the surrounding hardened cementpaste. The same zone is seen around a few schistose aggregates. Furthermore theseparticles also exhibit signs of internal cracking which is probably due to drying shrinkageof the particles.
The cement paste is homogeneous both in macro- and micro-scale.
The concrete contains some microcracks which are seen to interconnect several of the sand
particles in the cement paste. It is not clear why these cracks have formed.
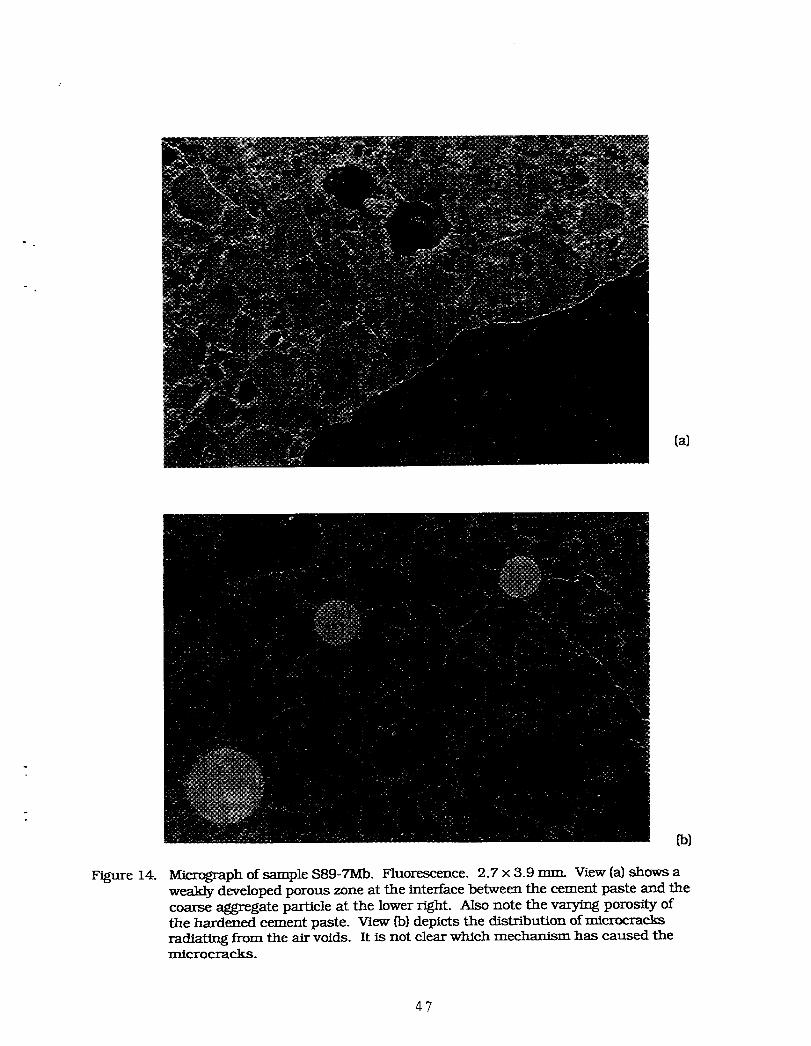
Samples $89: 5Mb, 6Mb and 7Mb
The compositional difference between these three concrete mixes and the four mixesmentioned above is that these samples contain a higher amount of aggregate and have beenmade with the addition of a superplasticizer. The specific mix compositions are presentedin Tables 6-8 and data are presented in Tables 1, 6-8 and Figures 12-14.
16
Examination of the hardened cement paste in fluorescent light shows that sample No. 5Mbin particular possesses a rather inhomogeneous microstructure. Also, the w/c ratio for thissample was measured as 0.42 although the accompanying mix specifications states a w/c of0.47. Concrete $89-6Mb in transmitted fluorescent light (Fig. 13a) as well as in reflectedfluorescent light (Fig. 13b) both show a homogeneous microstructure.
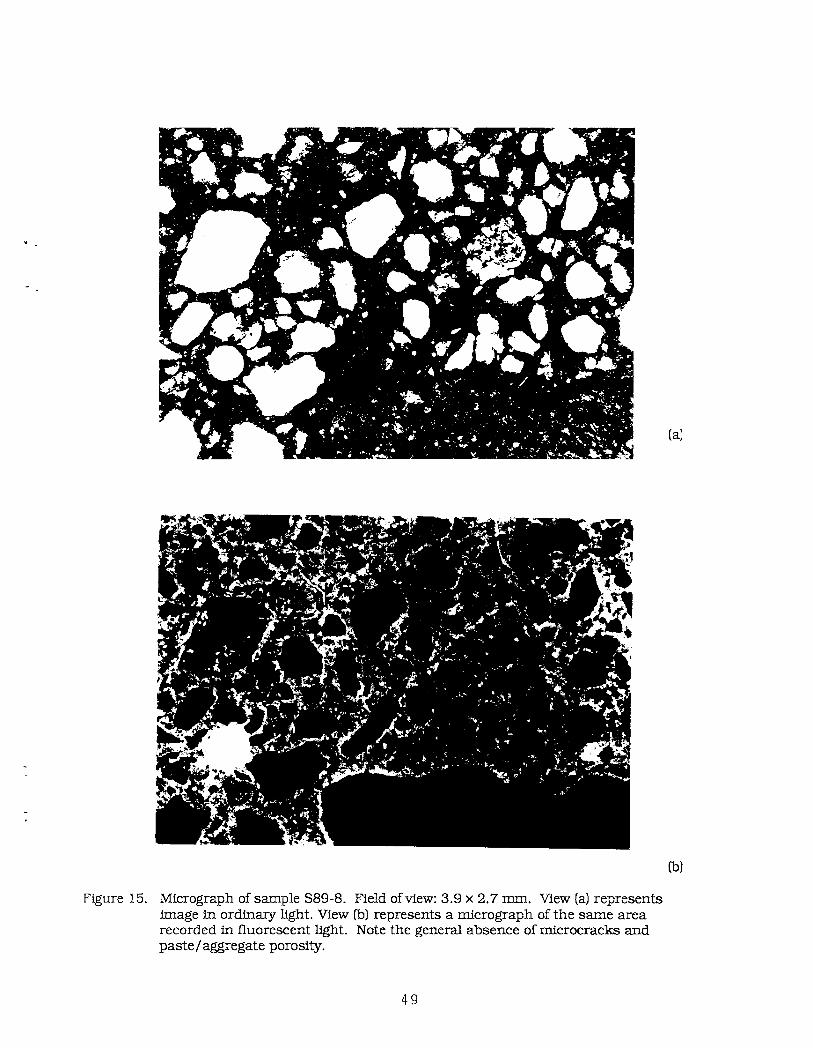
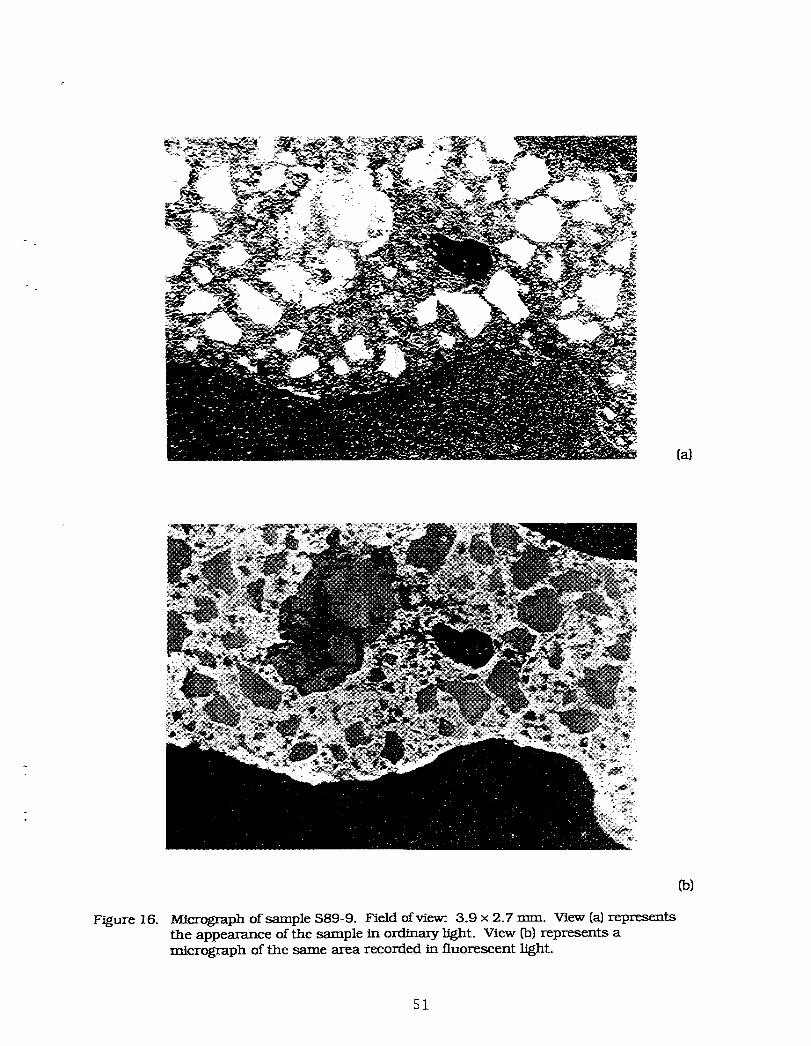
Samples $89: 8 and 9 (Tables 1, 9, 10, Figures 15, 16)
These two samples represent concrete mixes with differing water-cement ratios, 0.42 and" 0.53, respectively. It should be noted that a superplasticizer has been added to sample
$89-8 (Figure 15). These two concrete samples are generally quite homogeneous as viewedin thin section (Figures 15, 16) but it is noted that sample $89-9 (see Figure 16) containssignificantly fewer microcracks and porous paste/aggregate interfaces than the rest of theconcrete samples examined, despite its higher w/c ratio.
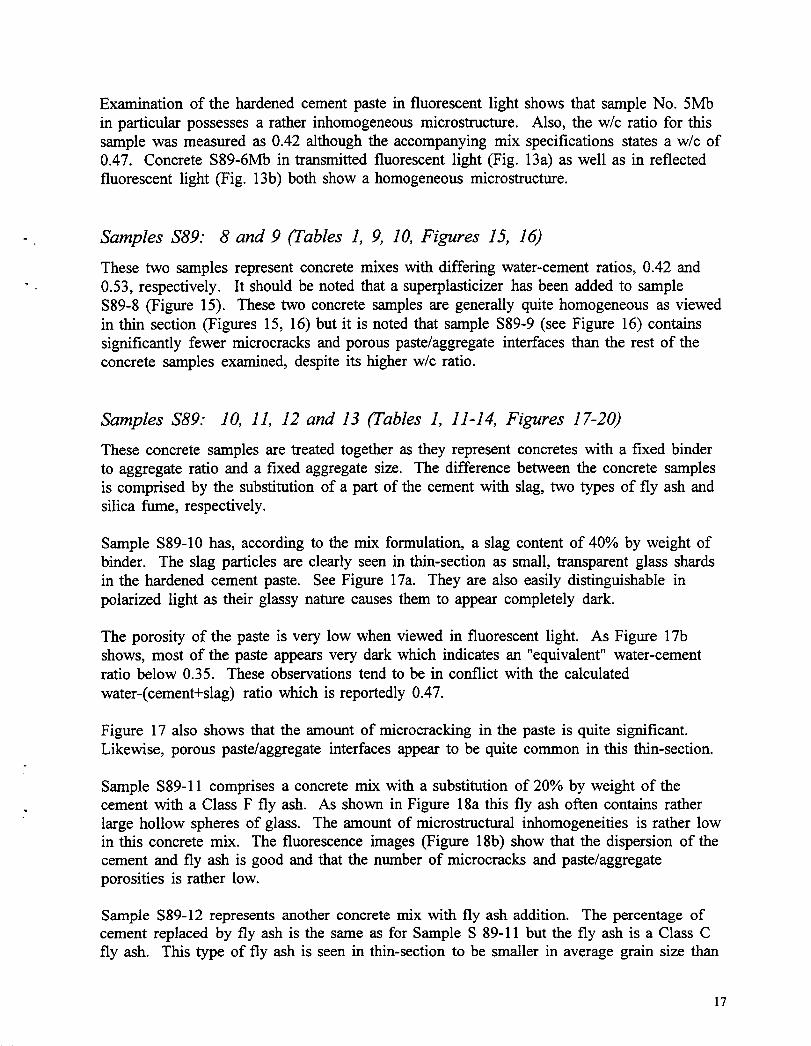
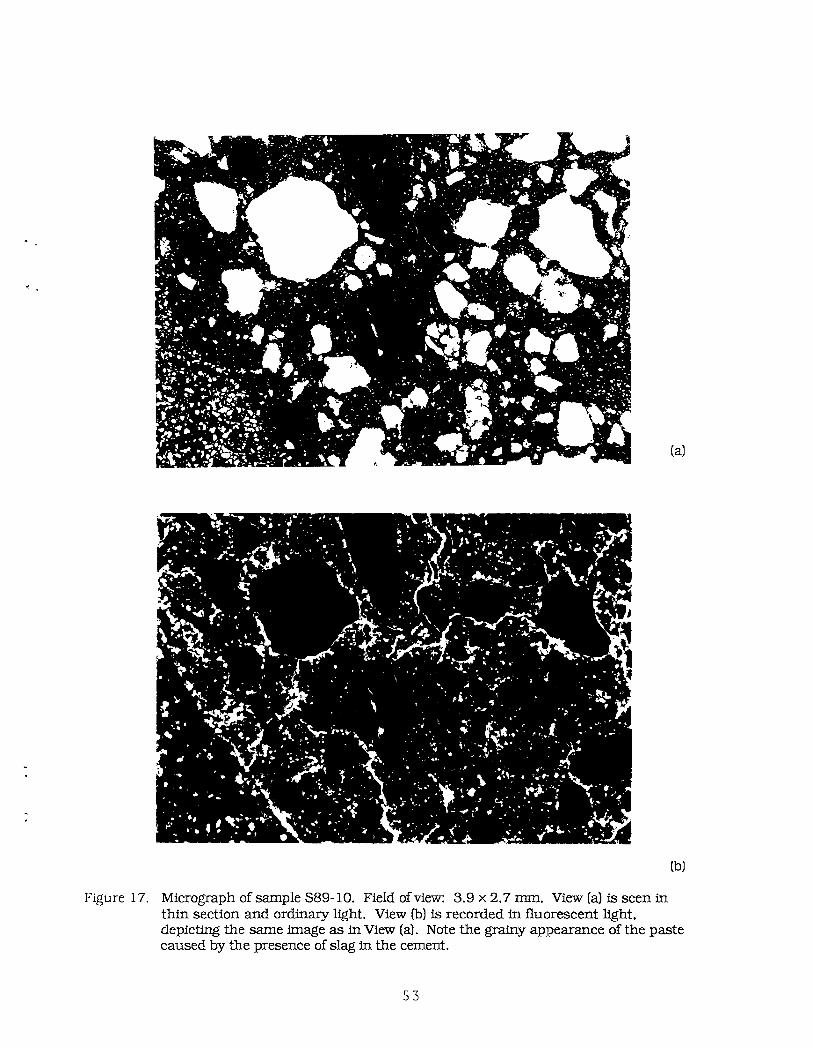
Samples $89: 10, 11, 12 and 13 (Tables 1, 11-14, Figures 17-20)
These concrete samples are treated together as they represent concretes with a fixed binderto aggregate ratio and a fixed aggregate size. The difference between the concrete samplesis comprised by the substitution of a part of the cement with slag, two types of fly ash andsilica fume, respectively.
Sample $89-10 has, according to the mix formulation, a slag content of 40% by weight ofbinder. The slag particles are clearly seen in thin-section as small, transparent glass shardsin the hardened cement paste. See Figure 17a. They are also easily distinguishable inpolarized light as their glassy nature causes them to appear completely dark.
The porosity of the paste is very low when viewed in fluorescent light. As Figure 17bshows, most of the paste appears very dark which indicates an "equivalent" water-cementratio below 0.35. These observations tend to be in conflict with the calculated
water-(cement+slag) ratio which is reportedly 0.47.
Figure 17 also shows that the amount of microcracking in the paste is quite significant.Likewise, porous paste/aggregate interfaces appear to be quite common in this thin-section.
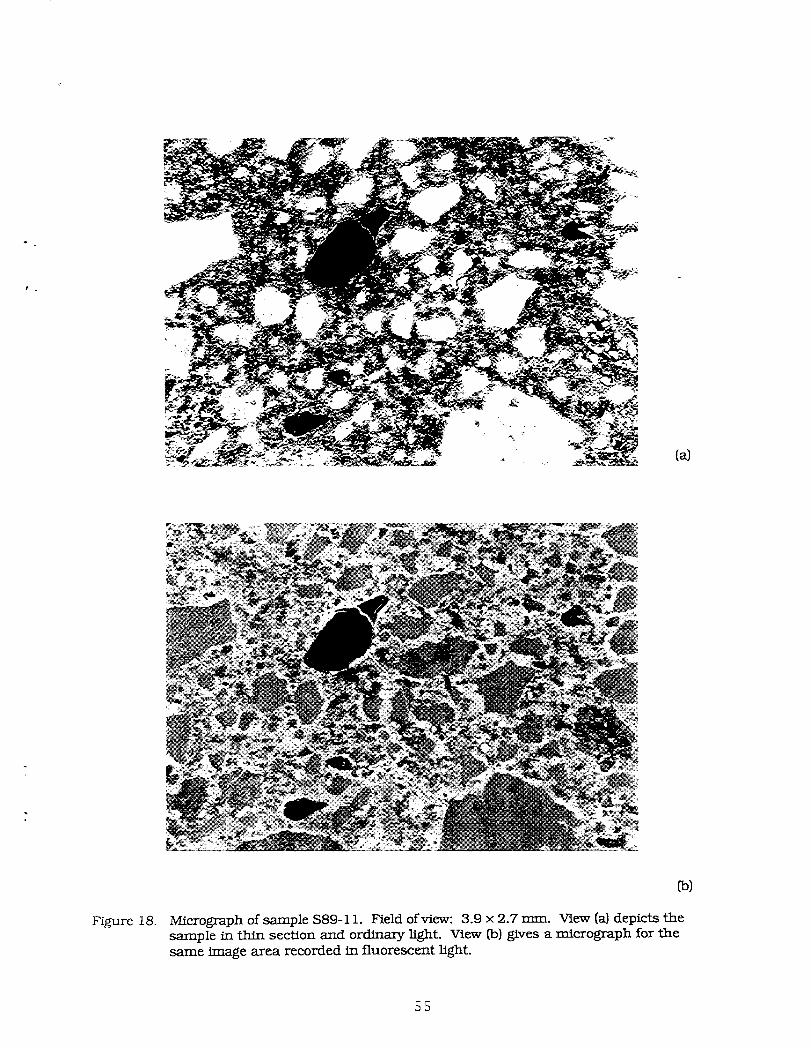
Sample $89-11 comprises a concrete mix with a substitution of 20% by weight of thecement with a Class F fly ash. As shown in Figure 18a this fly ash often contains ratherlarge hollow spheres of glass. The amount of microstructural inhomogeneities is rather lowin this concrete mix. The fluorescence images (Figure 18b) show that the dispersion of thecement and fly ash is good and that the number of microcracks and paste/aggregateporosities is rather low.
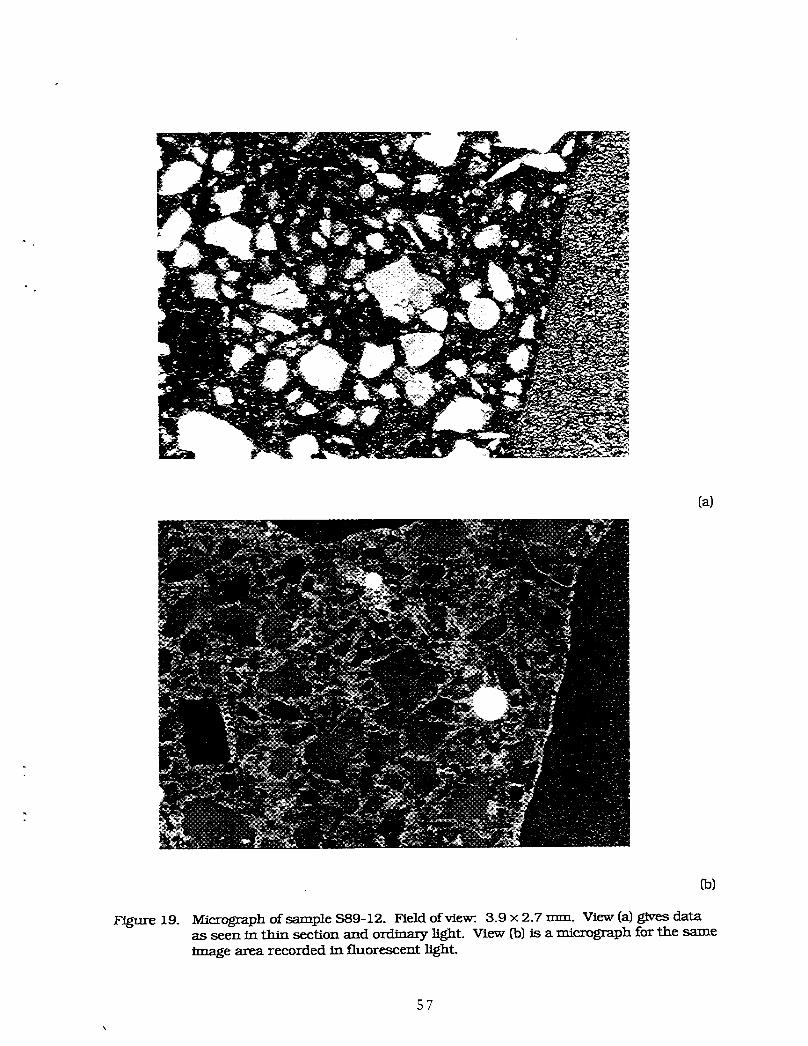
Sample $89-12 represents another concrete mix with fly ash addition. The percentage ofcement replaced by fly ash is the same as for Sample S 89-11 but the fly ash is a Class Cfly ash. This type of fly ash is seen in thin-section to be smaller in average grain size than
17
the Class F fly ash, previously examined. Likewise, a larger portion of this fly ash isconstituted by massive spheres of glass as seen in Figure 19a. Under fluorescent light, themicrostructure of this concrete mix resembles the microstructure of Sample S 89-11, that is,a rather homogeneous dispersion of the binder and a low amount of microcracks andpaste/aggregate porosities, see Figure 19b.
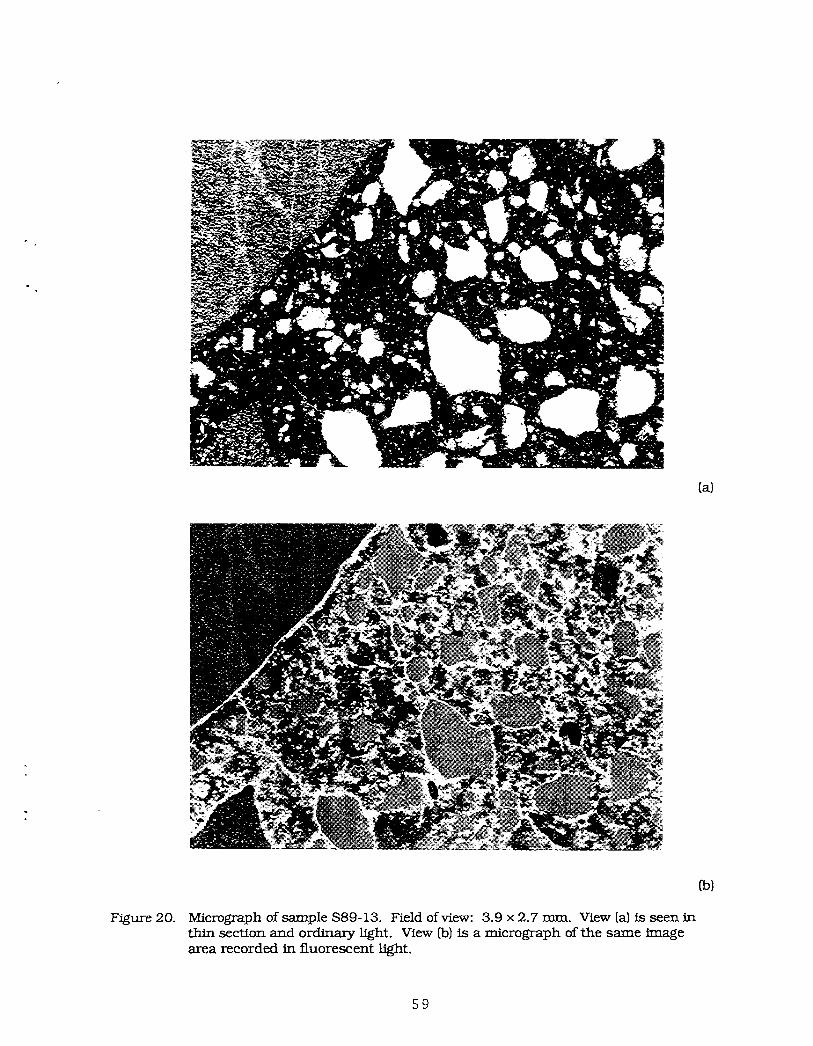
Sample $89-13 has been prepared with silica fume constituting 7.5% by weight of thebinder material (silica fume+cement). During examination of concrete with silica fumeadded, it is normally observed that the cement paste achieves a hazy appearance whenexamined in thin-section in polarized light. Likewise, the hardened cement paste normallyappears dark due to the removal of the disseminated calcium hydroxide in the paste. Infact, in this way the slag and silica fume pastes bear a greater resemblance to each otherthan to the other materials. A certain lack of Ca(OH)2 in the paste is observed in thethin-section prepared from Sample $89-13. See Figure 20a. However, as the paste did notappear particularly hazy and as it was not possible to detect any agglomerations of silicafume in the paste, even at high magnifications, it was not possible to obtain a positiveidentification of silica fume by the thin-section technique. The fluorescent examinationrevealed a fair amount of micro cracks in the paste and porosities at the paste aggregateinterface. See Figure 20b.
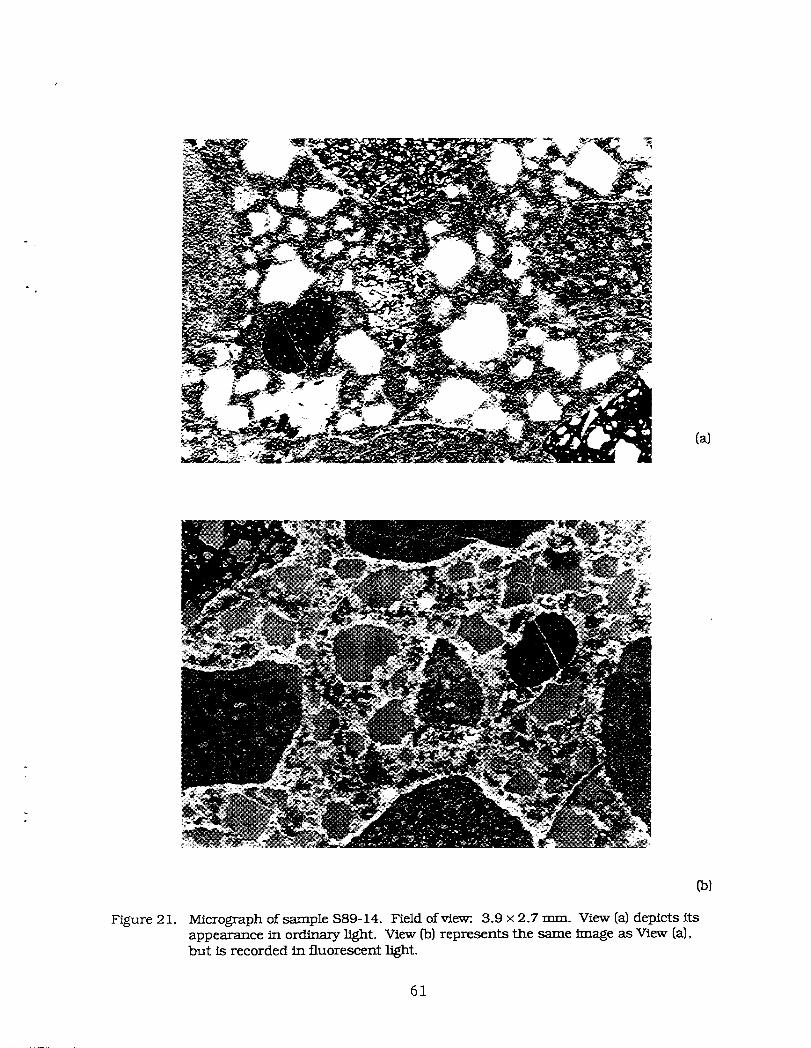
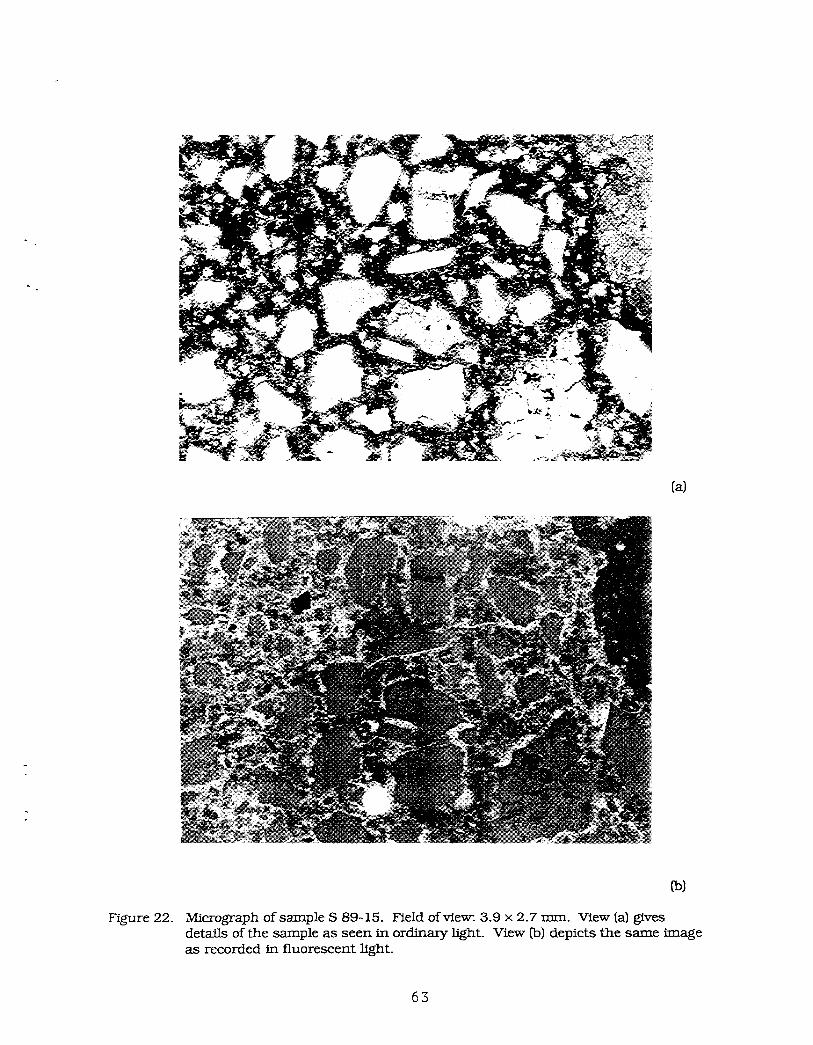
Samples $89: 14, 15 & 16 (Tables 15-17, Figures 21-23)
These samples represent concrete mixes where the normal coarse, #67 limestone aggregatehas been substituted with #8 limestone aggregate, #67 siliceous gravel and #8 siliceousgravel, respectively.
The differences between the microstructure of the hardened cement paste in the threesamples are generally very small (Figures 21-23). They all exhibit a minor amount ofmicrocracking and porosities at the paste-aggregate interface and the light variations in thedispersion of the cementitious particles in the paste do in all three incidents classify them as"grade 1" in terms of micro-inhomogeneity.
Hence, it does not appear that the reduction of the aggregate size and/or the change tosiliceous gravel has any noticeable effect on the microstructure of the concrete samples.
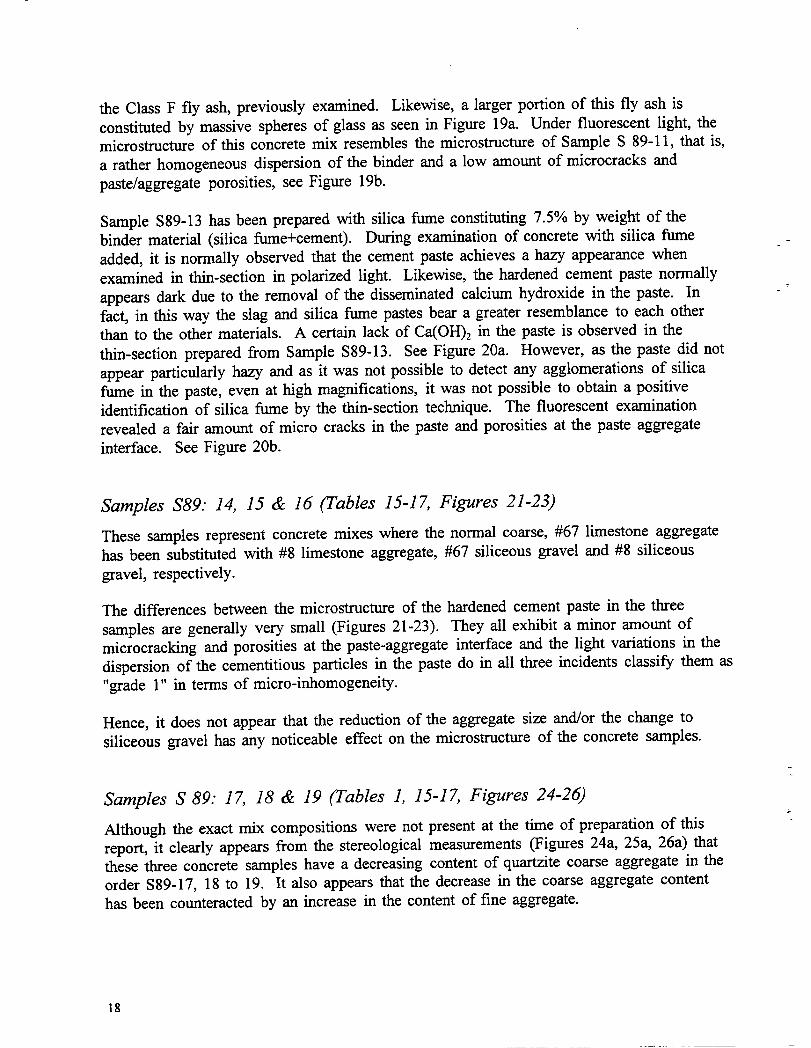
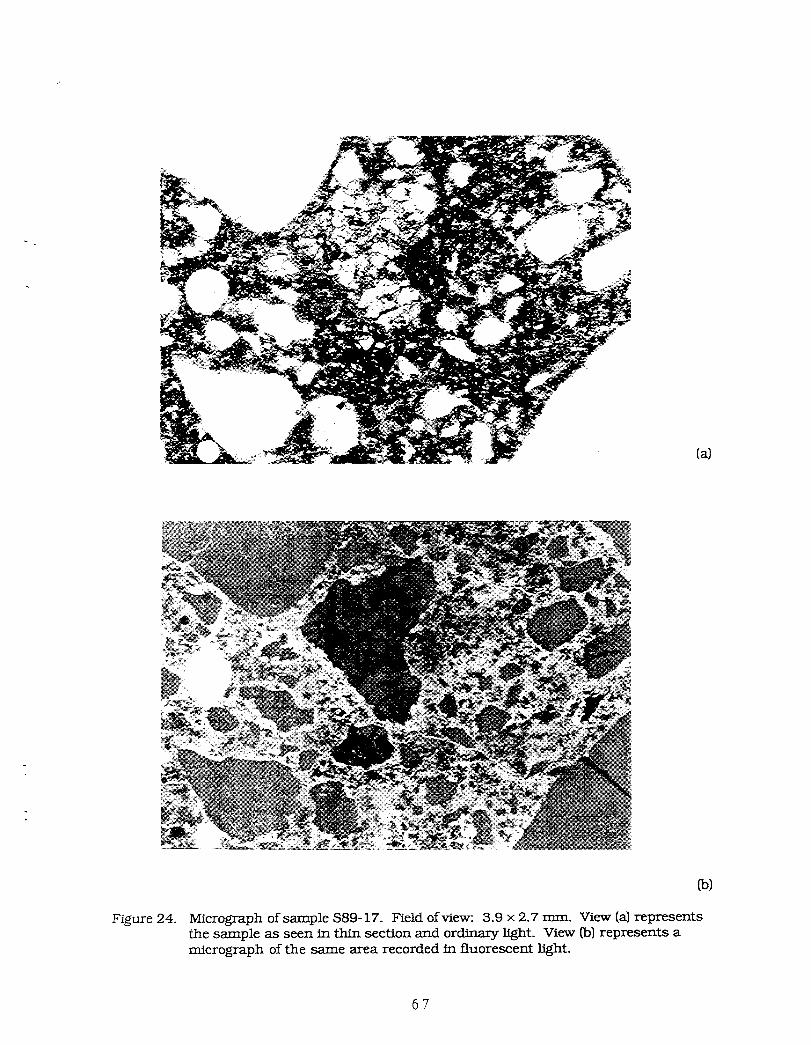
Samples S 89: 17, 18 & 19 (Tables 1, 15-17, Figures 24-26)
Although the exact mix compositions were not present at the time of preparation of thisreport, it clearly appears from the stereological measurements (Figures 24a, 25a, 26a) thatthese three concrete samples have a decreasing content of quartzite coarse aggregate in theorder $89-17, 18 to 19. It also appears that the decrease in the coarse aggregate contenthas been counteracted by an increase in the content of fine aggregate.
18
The fluorescence studies (Figures 24b, 25b, 26b) show that the samples have been preparedwith different water-cement ratios as sample $89-17 has a w/c of 0.40-0.45, 18 has a w/caround 0.35 and 19 has a w/c of approximately 0.35-0.40.
The frequency of microcracking and porous zones along the paste/aggregate interfacesappear within the normal range when compared to the samples earlier examined.
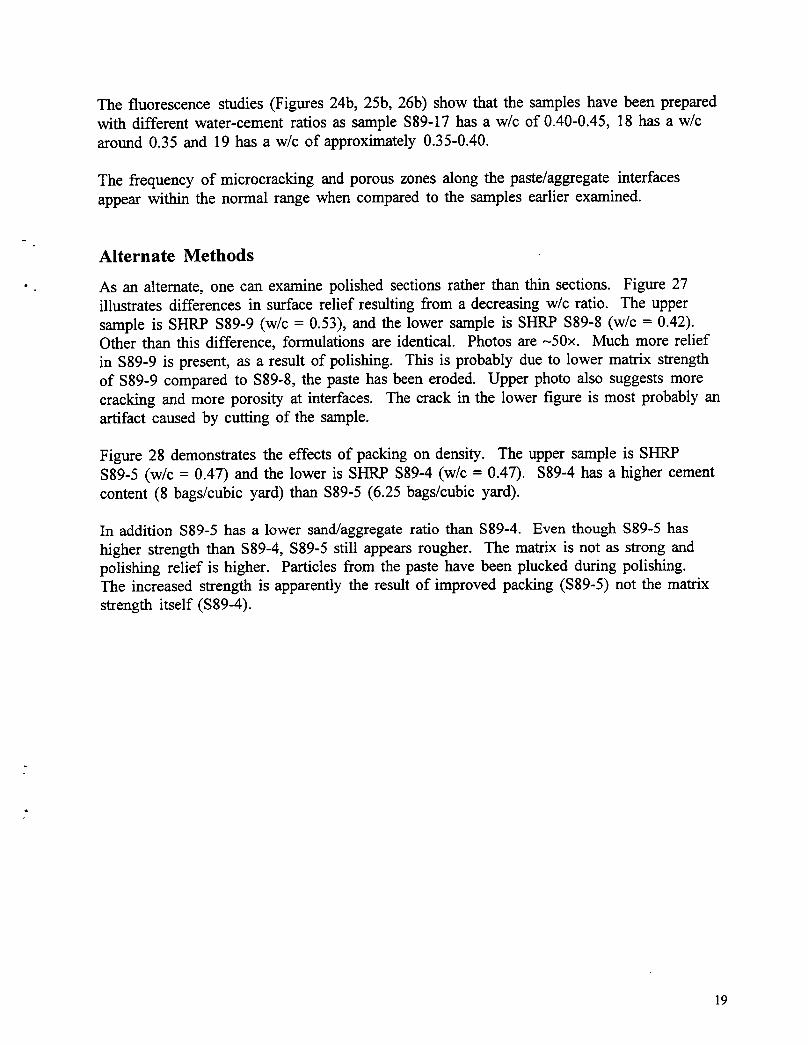
Alternate Methods
• As an alternate, one can examine polished sections rather than thin sections. Figure 27illustrates differences in surface relief resulting from a decreasing w/c ratio. The upper
sample is SHRP $89-9 (w/c = 0.53), and the lower sample is SHRP $89-8 (w/c = 0.42).Other than this difference, formulations are identical. Photos are -50x. Much more reliefin $89-9 is present, as a result of polishing. This is probably due to lower matrix strengthof $89-9 compared to $89-8, the paste has been eroded. Upper photo also suggests morecracking and more porosity at interfaces. The crack in the lower figure is most probably anartifact caused by cutting of the sample.
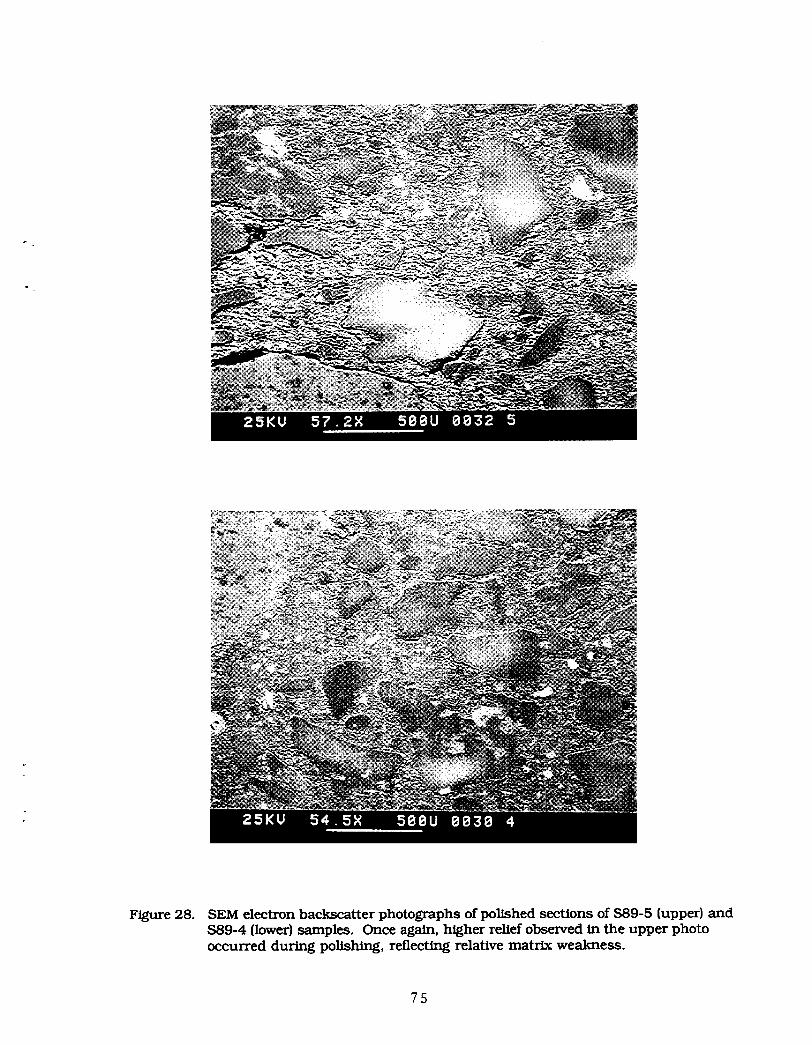
Figure 28 demonstrates the effects of packing on density. The upper sample is SHRP$89-5 (w/c = 0.47) and the lower is SHRP $89-4 (w/c = 0.47). $89-4 has a higher cementcontent (8 bags/cubic yard) than $89-5 (6.25 bags/cubic yard).
In addition $89-5 has a lower sand/aggregate ratio than $89-4. Even though Sg9-5 hashigher strength than $89-4, $89-5 still appears rougher. The matrix is not as strong andpolishing relief is higher. Particles from the paste have been plucked during polishing.The increased strength is apparently the result of improved packing ($89-5) not the matrixstrength itself ($89-4).
19
References
E.E. Underwood, Quantitative Stereology, Addison-Wesley Publishing Company, Reading,MA (1970), 274 pp.
2o
4
. Discussion
The investigation of concrete in thin section is a powerful tool both for development andforensic applications. But, because it is a "learned" technique, at present it cannot be fullyimplemented by an unskilled operator.
Standards are necessary and difficult to make. Thin sections must always be exactly thesame thickness over the entire section and from sample to sample. The preparation andpolishing is an art in itself. Great care must be exercised to prevent the inadvertentintroduction of microcracks (see for example, Struble's papers NBS IR 88-3702 and NBS87-3504).
However, once these hurdles are overcome, the technique can be very useful. It can beused to evaluate homogeneity of mixing, dispersion of aggregates, effectiveness ofsuperplasticizers, etc. The ability to better observe alkali silicates, carbonation, sulfateattack, microcracking, etc., is self evident. Our recommendation is to implement thetechnique, but develop automated computer-assisted data interpretation as much as possible.
Preliminary observations were made on some of the fluorescent epoxy impregnatedspecimens in reflected light. Although some features show up well, the amount ofinformation does not appear to be equal to that in the thin sections. However, theconcurrent examination of the polished sections can provide some important information onrelative matrix strength related to variations in w/c and packing.
21
References
L. Struble and E. Byrd, "Epoxy Impregnation of Hardened Cement Pastes forCharacterization of Microstructure," NBSIR 87-3504 (1986).
L. Struble and P. Stutzrnan, "Epoxy Impregnation Procedure for Hardened Cement
Samples," N-BSIR 88-3702 (1988).
22

Appendix Ao
- Figures
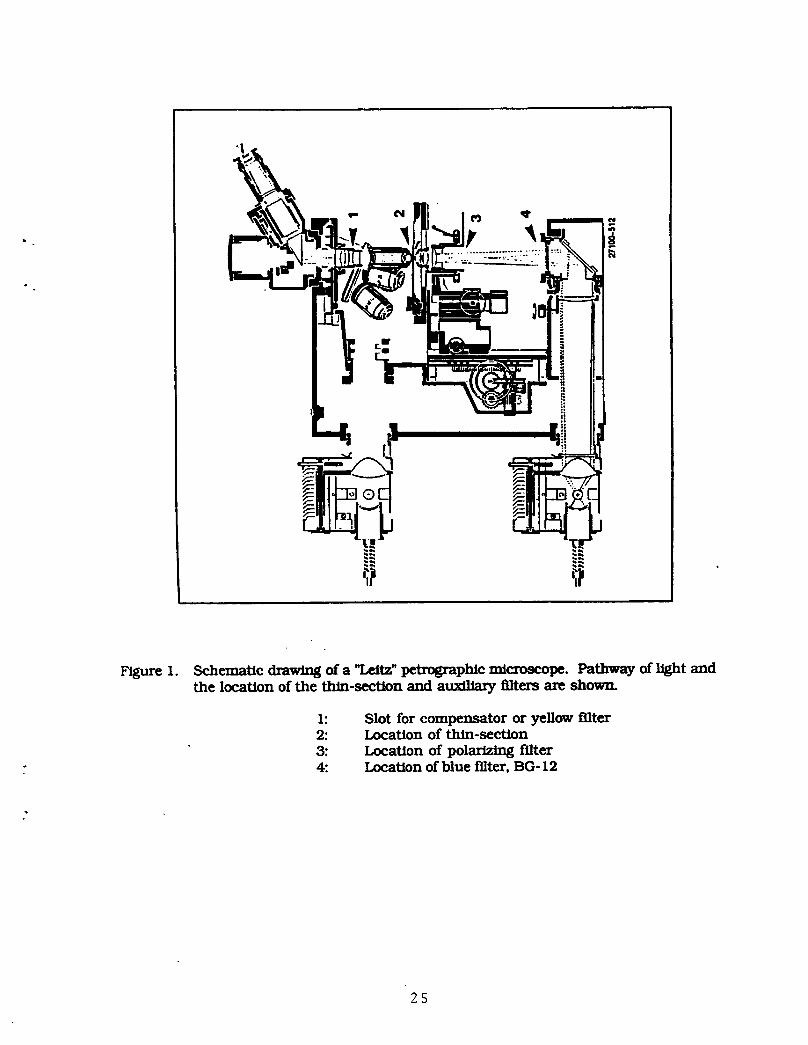
Figure 1. Schematic draw_g of a "Leltz" petrographic microscope. Pathway of llght andthe location of the thin-section and auditory filters are shown.
1: Slot for compensator or yellow filter2: Location of thin-section3: Location of polarlzLng filter4: Location of blue filter, BG-12
2S
o
Figure 2. Micrograph of concrete recorded in: (a) Ordinary light, (b) Polarized light, (c)
Polarlzed light with compensator and (d) Fluorescence. Field of view: 2.5 x 2.5ITIm.
27
100
vol• °/o
00 .2 .4 .e .8 1.0 1.2 1.4
wit ratio
Figure 3. Diagrnm depicting the distribution of unhydrated cement, C-S-H gel, gel water,capillary water and chemical shrlvkage voids as a function of the w/c ratio.
?9
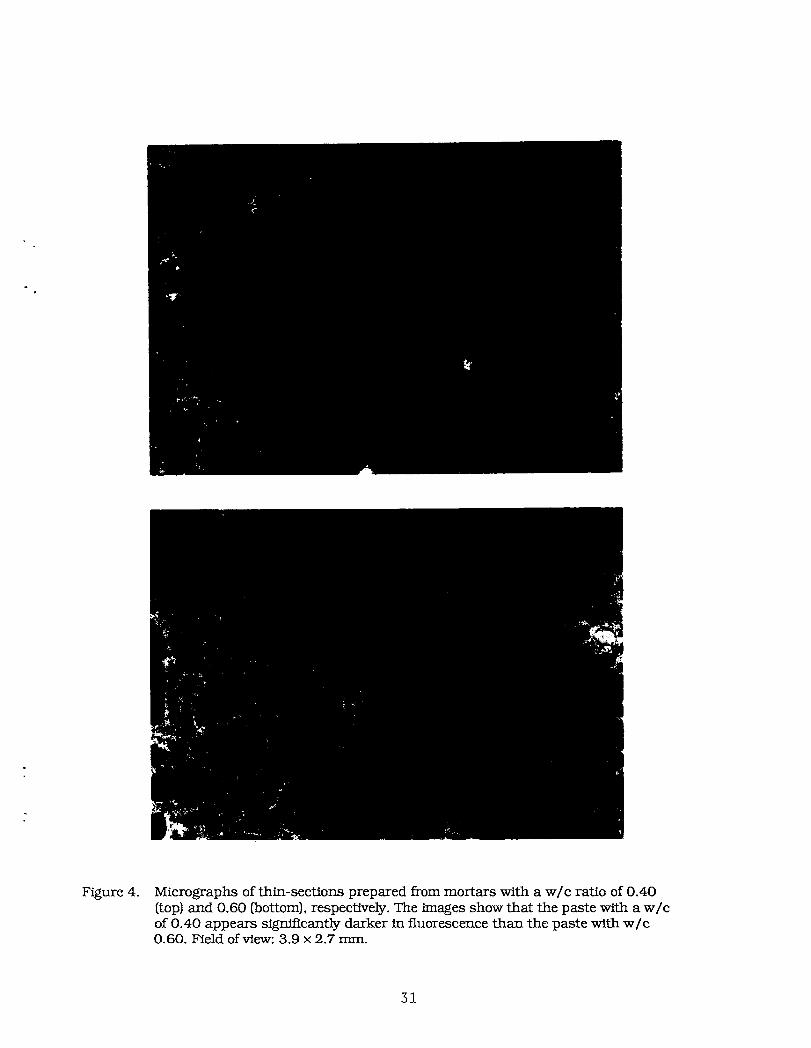
Figure 4. Micrographs of thin-sections prepared from mortars with a w/c ratio of 0.40(top) and 0.60 (bottom), respectively. The images show that the paste with a w/cof 0.40 appears significantly darker in fluorescence than the paste with w/c0.60. Field of view: 3.9 x 2.7 ram.
31
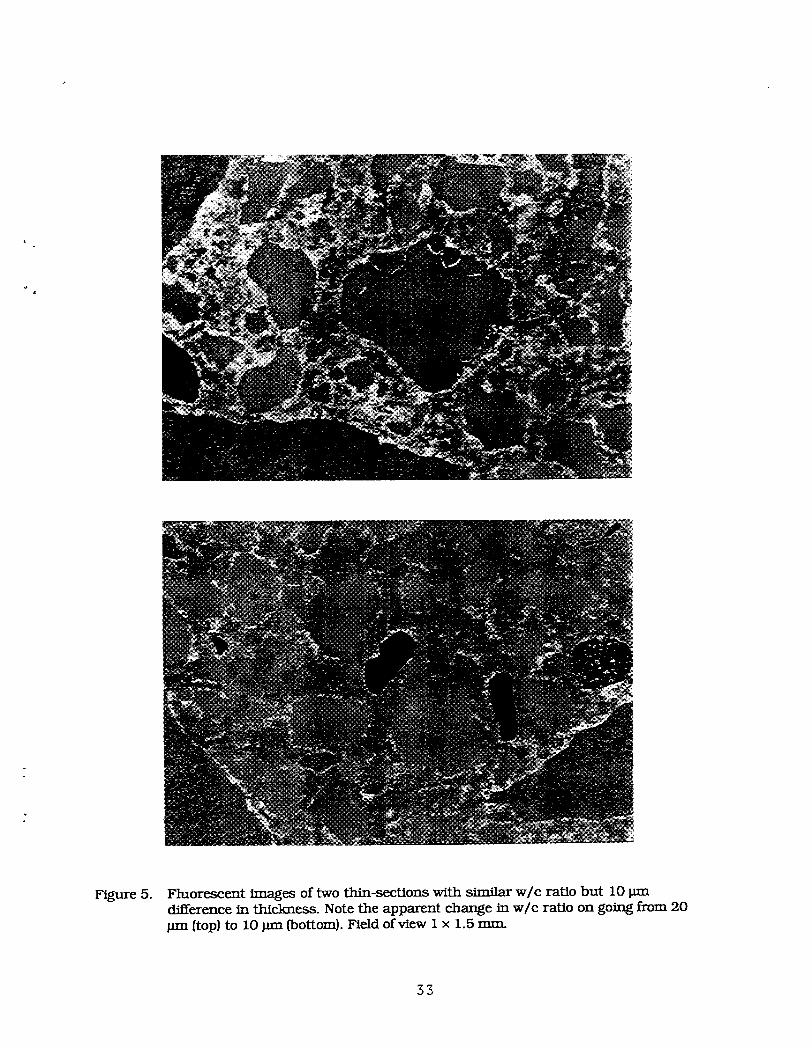
Figure 5. Fluorescent images of two thin-sections with similar w/c ratio but 10 !_mdifference in thickness. Note the apparent change in w/c ratio on going from 20!Jrn (top) to 10 !Jrn (bottom). Field of view 1 x 1.5 mm
35
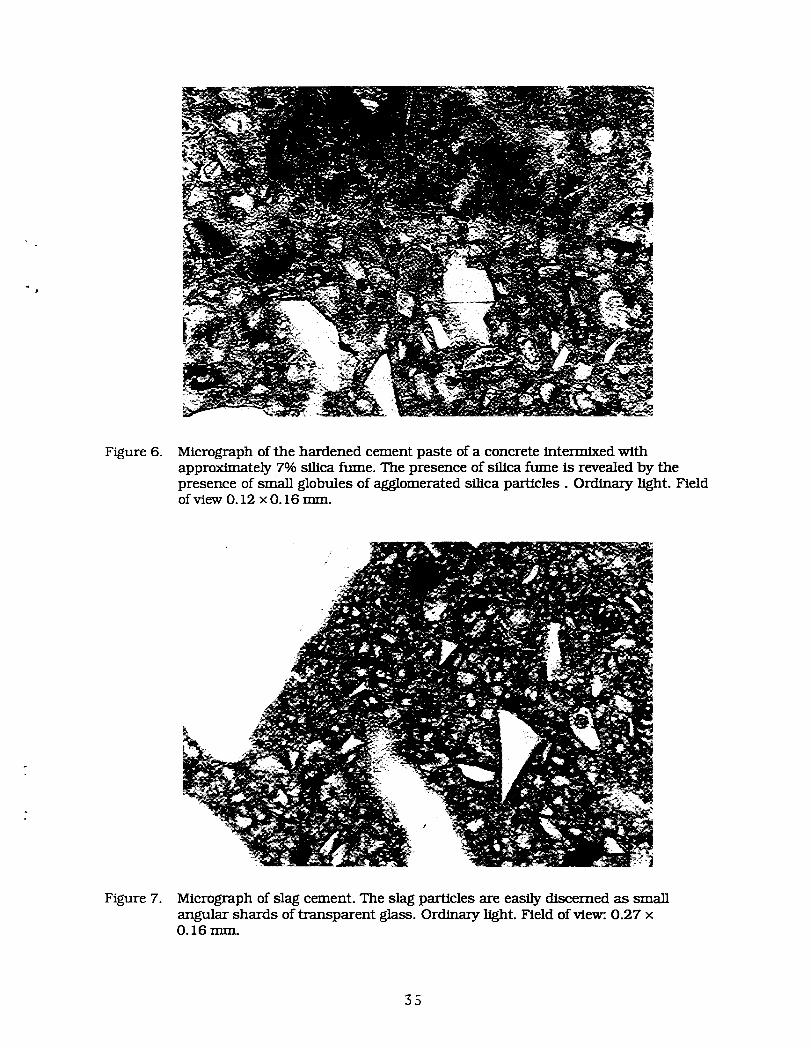
Figure 6. Micrograph of the hardened cement paste of a concrete intermixed withapproximately 7% silica fume. The presence of silica fiJme is revealed by thepresence of small globules of agglomerated silica particles. Ordinary light. Fieldof view 0.12 x 0.16 ram.
Figure 7. Micrograph of slag cement. The slag particles arc easily discerned as smallangular shards of transparent glass. Ordinary light. Field of vie_. 0.27 ×0.16 ram.
3S
(a)
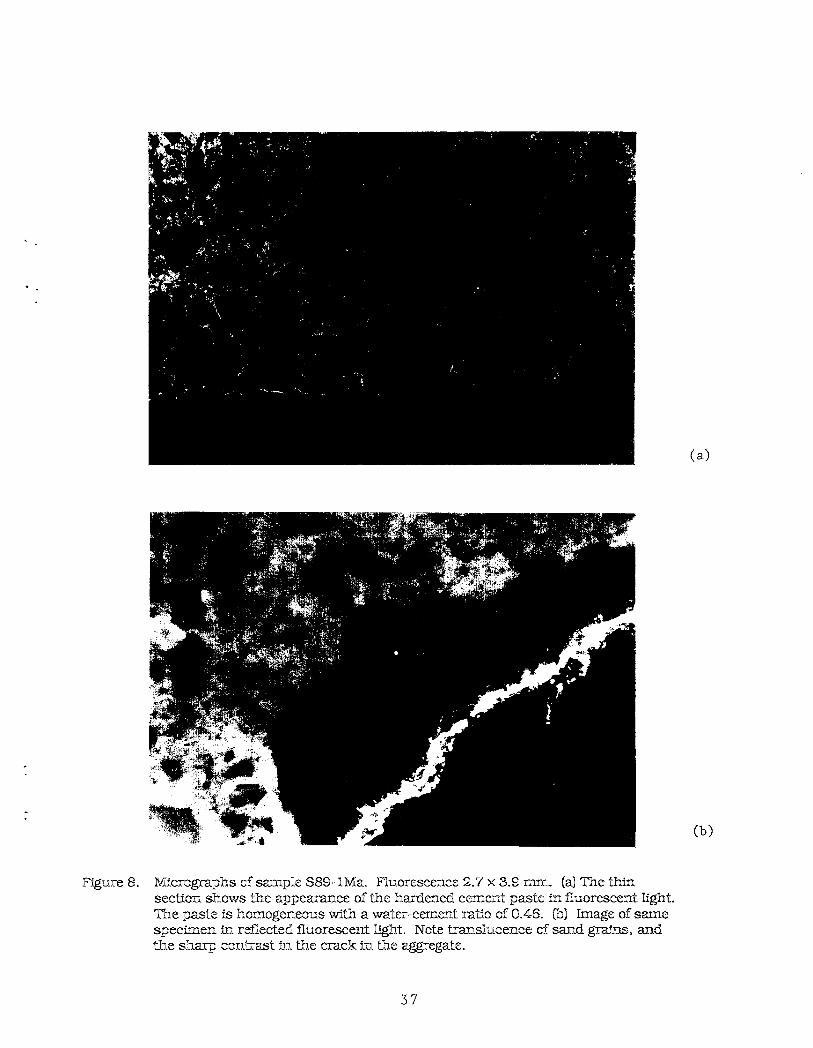
Figu_-e 8. Micrographs cf sm_pie $89- IMa. Fluorescence 2.7 x 3.£ rnn-_. (a] Thesection shows +._heappearance of the hardened cement paste in fluorescent light.
The paste is homogeneous with a water-cement ratio of 0.48. [5] Image of samespecimen in reflected fluorescent light. Note ira_.slucence cf sand graf_.nso and_5ne sha_-C can_ast in the crack in the aggregate.
37
(a)
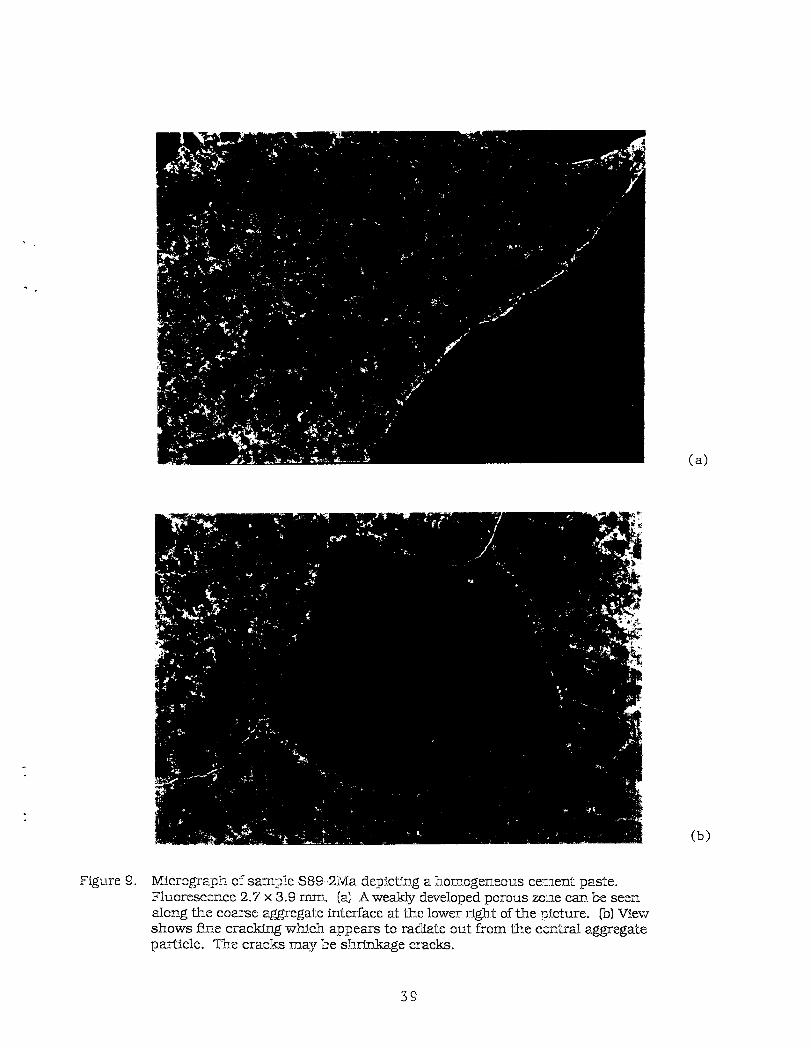
Figure 9. Micrograp__ cf sample $89-2Ma depicting a homogeneous ce_._ent paste.Fluorescence 2.7 x 3.9 rp_.. (a] A weakly deveIoped porous zo:._e cm_..be seengong the coarse aggregaLe interface at the lower right of the !_icture. (5) Viev¢shows i'iw,e cracking which appears to ra¢liate out from tke cv._tr_ aggregateparticle. Tb.e cracks may be shrinkage cracks.
39
(a)
(b)
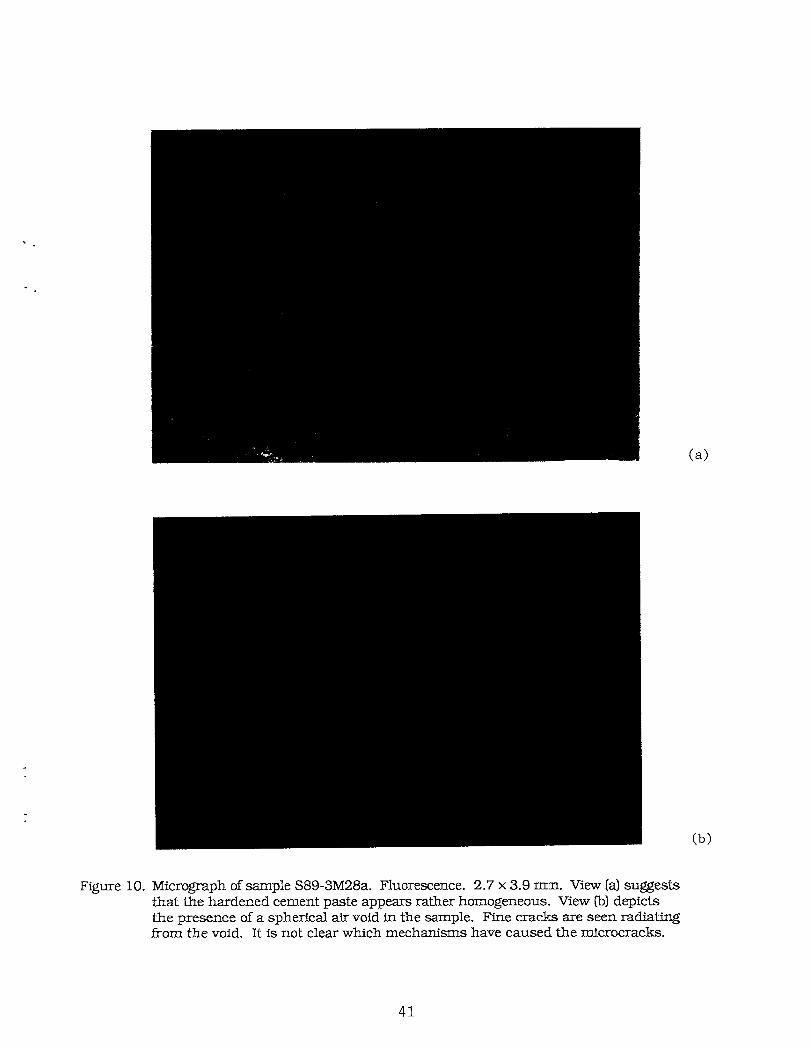
Figure 10. Micrograph of sample S89-3M28a. Fluorescence. 2.7 x 3.9 Emil. View (a) suggeststhat the hardened cement paste appears rather homogeneous. View (b) depictsthe presence of a spherical air void in the sample. Fine cracks are seen radiatingfrom the void. It is not clear which mechanisms have caused the microcracks.
41
(a)
(b)
Figure i I. Micrograph of sample S89-4M28a. Fluorescence. 2.7 x 3.9 ram. View (a) showsthat the interface between the coarse aggregate particle to the lower left and thebulk cement paste is dominated by a porous zone. View B suggests that thecement paste, which has an average w/c ratio around 0.46, is homogeneous.
43
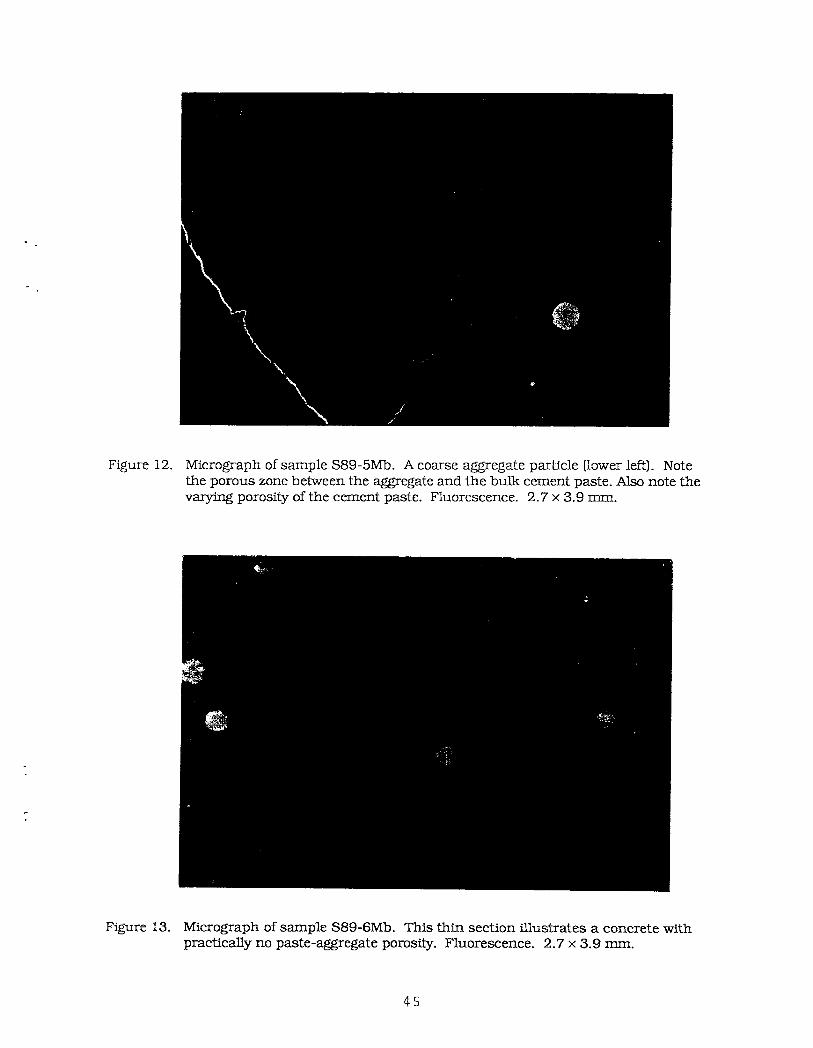
Figure 12. Micrograph of sample $89-5Mb. A coarse aggregate particle (lower left]. Notethe porous zone between the aggregate and the bulk cement paste. Also note thevarying porosity of the cement paste. Fluorescence. 2.7 x 3.9 mm.
Figure 13. Micrograph of sample $89-6Mb. This thin section illustrates a concrete with
practically no paste-aggregate porosity. Fluorescence. 2.7 x 3.9 ram.
45
(a)
(b)
Figure 14. Micrograph of s_mple $89-7Mb. Fluorescence. 2.7 x 3.9 turn_ View (a) shows aweakly developed porous zone at the interface between the cement paste and thecoarse aggregate particle at the lower right. Also note the varying porosity ofthe hardened cement paste. View (b) depicts the distribution of microcracksradiating from the air voids. It is not clear which mechanism has caused themicrocracks.
47
Ca3
Figure 15. Micrograph of sample $89-8. Field of view: 3.9 x 2.7 ram. View (a) representsimage in ordinary light. View (5) represents a micrograph of the same arearecorded in fluorescent light. Note the general absence of microcracks andpaste/aggregate porosity.
49
(a)
(b)
Figure 16. Micrograph ofs_mple $89-9. Field of view: 3.9 x 2.7 n_,u. View (a) representsthe appearance of the sample in ordinary light. View (b) represents amicrograph of the s_me area recorded in fluorescent light.
51
(a)
tbJ
Figure 17. Micrograph of sample $89-10. Field of view: 3.9 x 2.7 ram. View (a) is seen inthin section and ordinary light. View (5) is recorded in fluorescent light,depicting the same image as in View (a). Note the grainy appearance of the pastecaused by the presence of slag in the cement.
$3
(a)
(b)
Figure 18. Micrograph ofs_mple $89-11. Field of view: 3.9 x 2.7 ram. View (a) depicts thesample in thin section and ordinary light. View (b) gives a micrograph for thesame image area recorded in fluorescent light.
55
Ca)
Figure 19. Micrograph of s_mple $89-12. Field of view:. 3.9 x 2.7 turn View (a) gives dataas seen in thin section and ordinary light. View Co)is a micrograph for the s_rne
image area recorded in fluorescent light.
$7
!
(a)
Co)
Figure 20. Micrograph of sample $89-13. Field of view: 3.9 x 2.7 ram. View (a) is seen inthin section and ordinary light. View (b) is a micrograph of the same imagearea recorded in fluorescent light.
59
Ca)
Figure 21. Micrograph of sample $89-14. Field of view. 3.9 x 2.7 rnrn. View (a) depicts itsappearance in ordinary light. View (b) represents the same image as View (a),but is recorded in fluorescent light.
61
(a)
I,
_b)
Figure 22. Microgrraph ofssmple S 89-15. Field of view: 3.9 x 2.7 rrrm View (a) givesdetails of the sample as seen in ordinary light. View [b) depicts the s_me imageas recorded in fluorescent light.
63

+"++ Ca)
(b)
Figure 23. Micrograph of smmple $89-16. Field of view:. 3.9 x 2.7 ram. View (a) representsthe sample as seen in thin section recorded in ordinary light. View (b)represents the s_me s_mple recorded in fluorescent light.
65
Ca)
Figure 24. Micrograph of sample $89-17. Field of view: 3.9 x 2.7 mm View (a) representsthe sample as seen in thin section and ordinary light. View (b) represents amicrograph of the s_me area recorded in fluorescent light.
67
Ca)
_b)
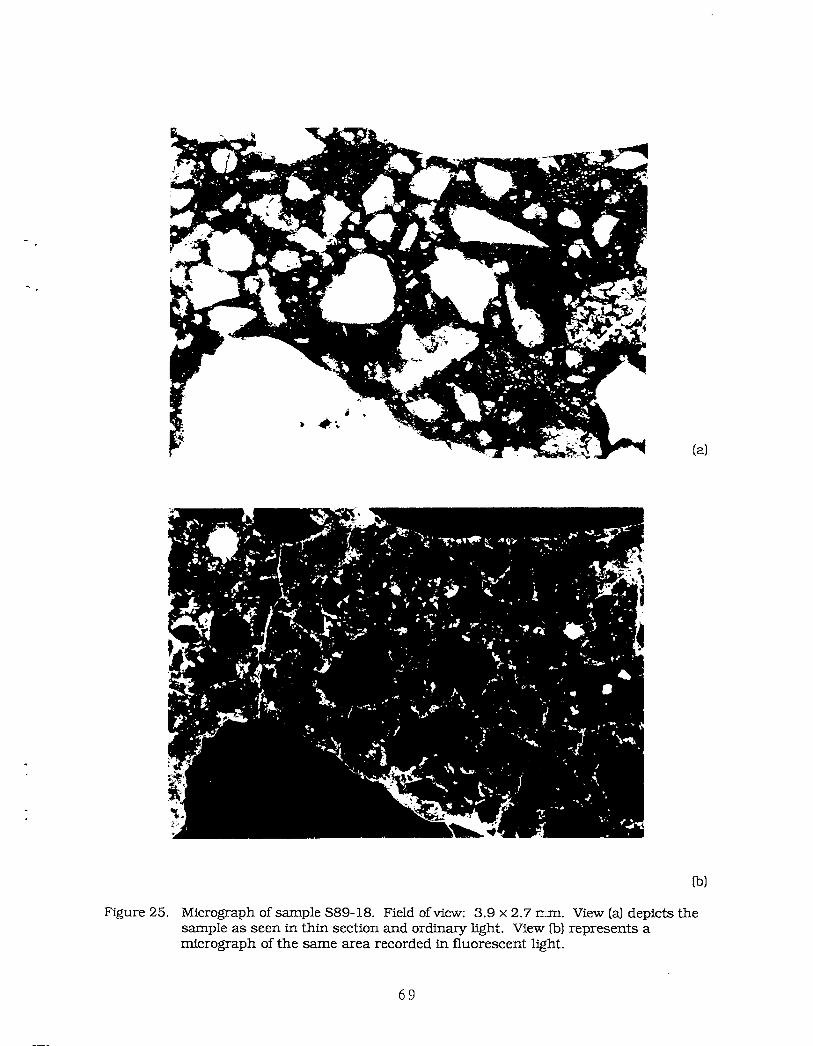
Figure 25. Micrograph of sample $89-18. Field of view: 3.9 x 2.7 rr_m. View (a) depicts thesample as seen in thin section and ordinary light. View (b) represents amicrograph of the same area recorded in fluorescent light.
69
i (a)
(b)
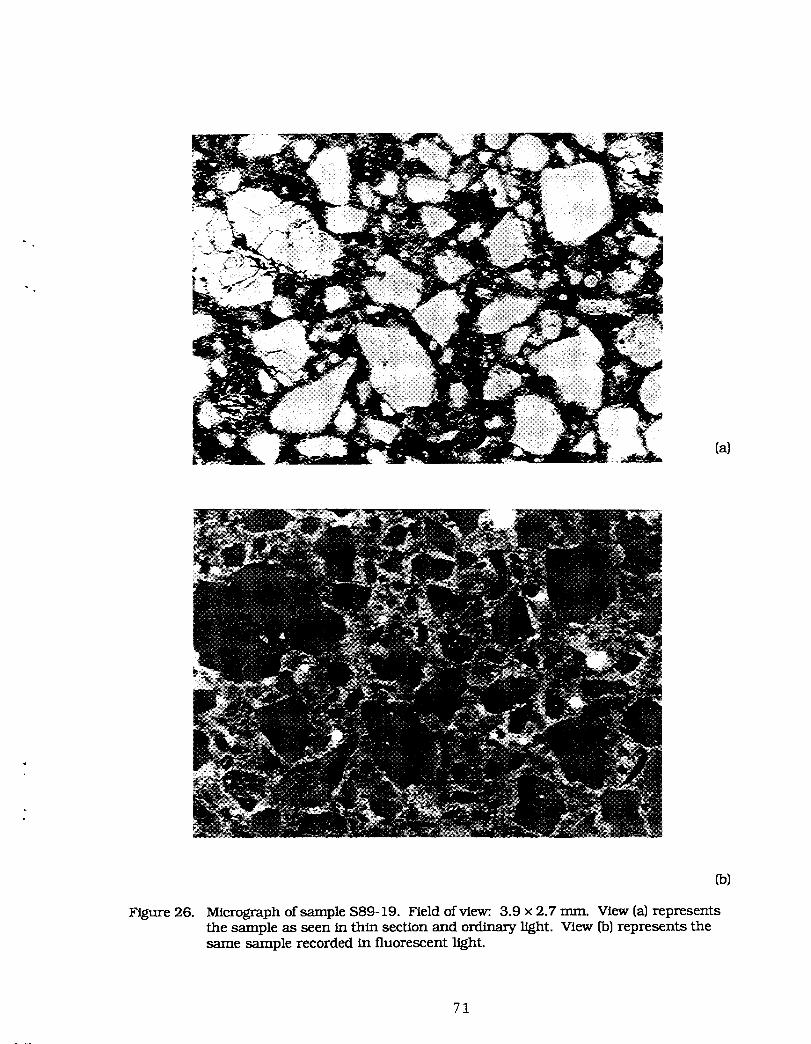
Figure 26. Micrograph of sample S89-19. Field of view: 3.9 x 2.7 mm. View (a) representsthe sample as seen in thin section and ordinary light. View (b) represents thesame sample recorded in fluorescent light.
71
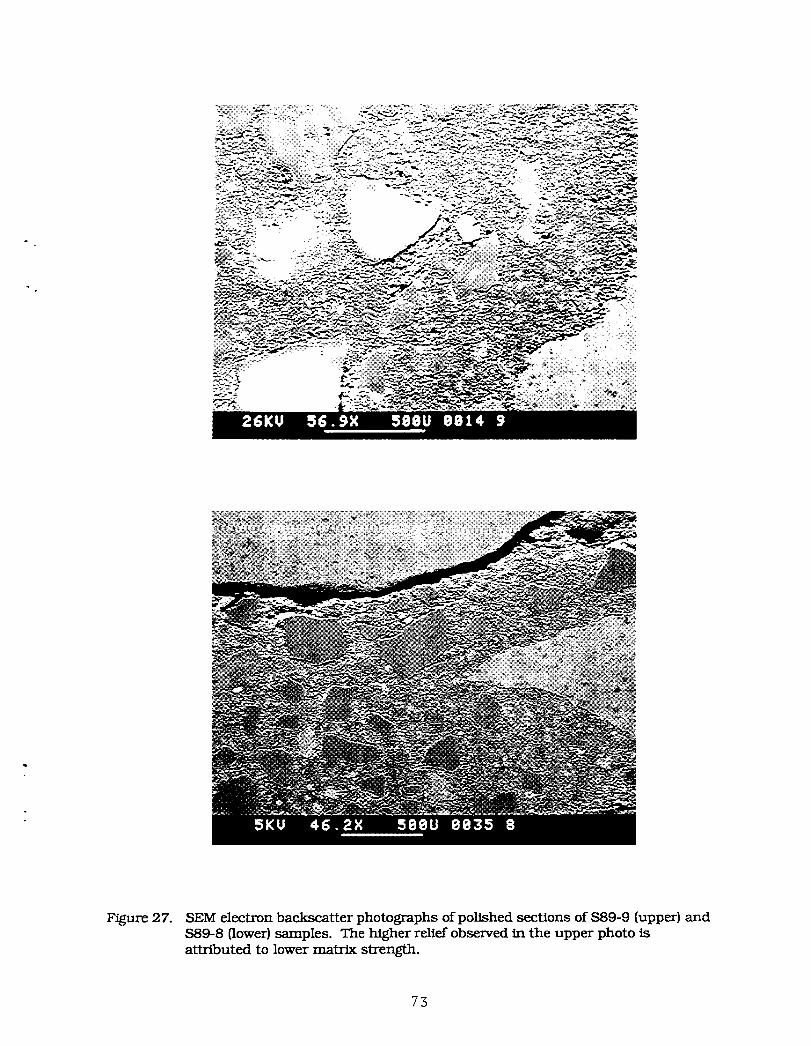
Figure 27. SEM electron backscatter photographs of polished sections of $89-9 (upper) and$89-8 flower) samples. The higher relief observed in the upper photo isattributed to lower matrix strength.
75
o
Figure 28. SEM electron backscatter photographs of polished sections of $89-5 (upper) and$89-4 (lower) samples. Once again, higher relief observed in the upper photooccurred during polishing, reflecting relative matrix weakness.
75

Appendix B
Tables
q
"_'a,l_e I,
79
T'_:_le 1 ct.d.
80
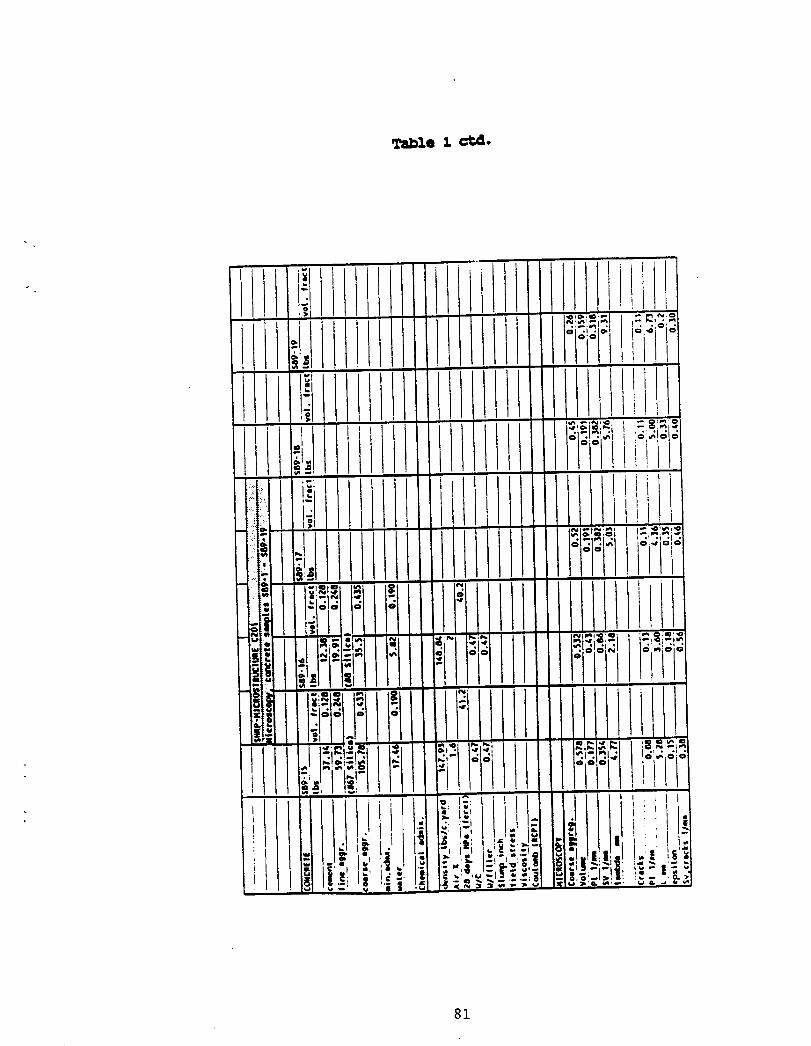
Table I ct4.
! I 'I
l
i II. i,I i III,IIII ,Llliil!l !,lIIlJLi IL!ii'i'Ii!l!j llIll
Ii!IIIibil L l1I;i IIIIIi!ll*I 'w_, , * ,0 O'O
°°°- I I I'"
81
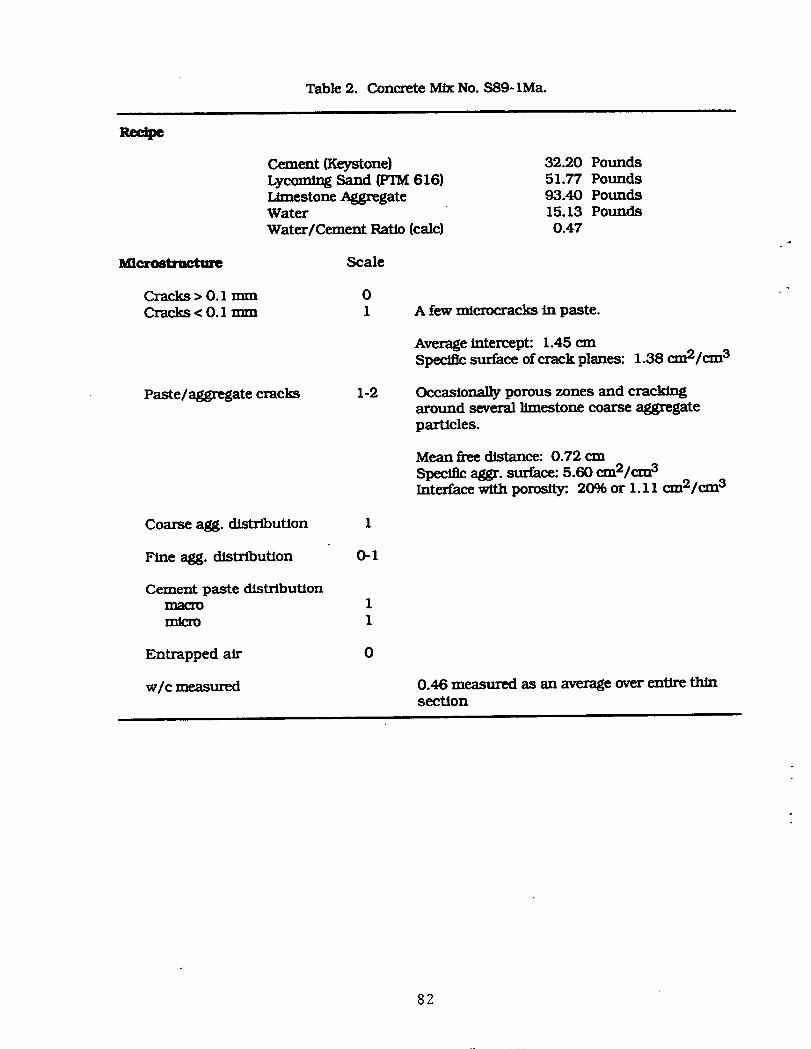
Table 2. Concrete Mix No. $89-1Ma.
Cement (Keystone) 32.20 PoundsLycornlrlg Sand (PTM 616) 51.77 PoundsLimestone Aggregate 93.40 PoundsWater 15.13 PoundsWater/Cement Ratio (calc) 0.47
Mleromractm_ Scale
Cracks > 0.1 mm 0Cracks < 0.1 mm 1 A few microcracks in paste.
Average intercept: 1.45 cmSpecific surface of crack planes: 1.38 cm2/_c_n3
Paste/aggregate cracks 1-2 Occaslon_l]y porous zones and crackingaround several llmestone coarse aggregateparticles.
Mean free distance: 0.72 em
Specific aggr. surface: 5.60 cm2/cm 3Interface with porosity. 20% or I. 11 cm2/c yn3
Coarse agg. distribution 1
Fine agg. distribution 0-1
Cement paste distributionmacro 1
1
Entrapped air 0
w/c measured 0.46 measured as an average over entire thinsection
8?.
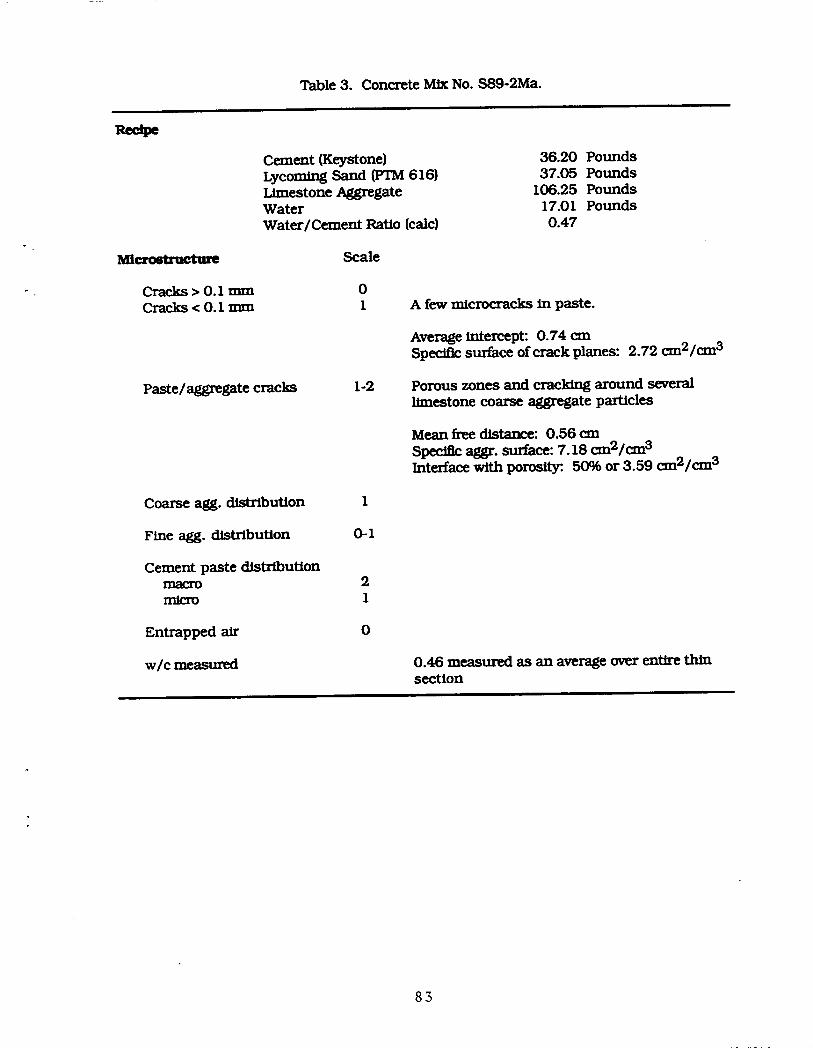
Table 3. Concrete Mix No. $89-2Ma.i
Cement (Keystone) 36.20 PoundsLycom|ng Sand (PTM 616) 37.05 PoundsT,Iroestone Aggl_gate 106.25 PoundsWater 17.01 PoundsWater/Cement Ratio (calc) 0.47
Mleroo_arQetm_ Scale
"- Cracks > 0.1 mm 0
Cracks < 0. I mm I A few microcracks in paste.
Average intercept: 0.74 cmSpecific surface of crack planes: 2.72 cm2/cm 3
Paste/aggregate cracks 1-2 Porous zones and cracking around severallimestone coarse aggregate particles
Mean free distance: 0.56 em
Specific aggr. surface: 7.18 cm2/c_13Interface with porosity. 50% or 3.59 cm 2/cm 3
Coarse agg. distribution 1
Fine agg, distribution 0-1
Cement paste distributionmacro 2rmcm 1
Entrapped air 0
w/c measured 0.46 measur_ as an average over entire thinsection
83
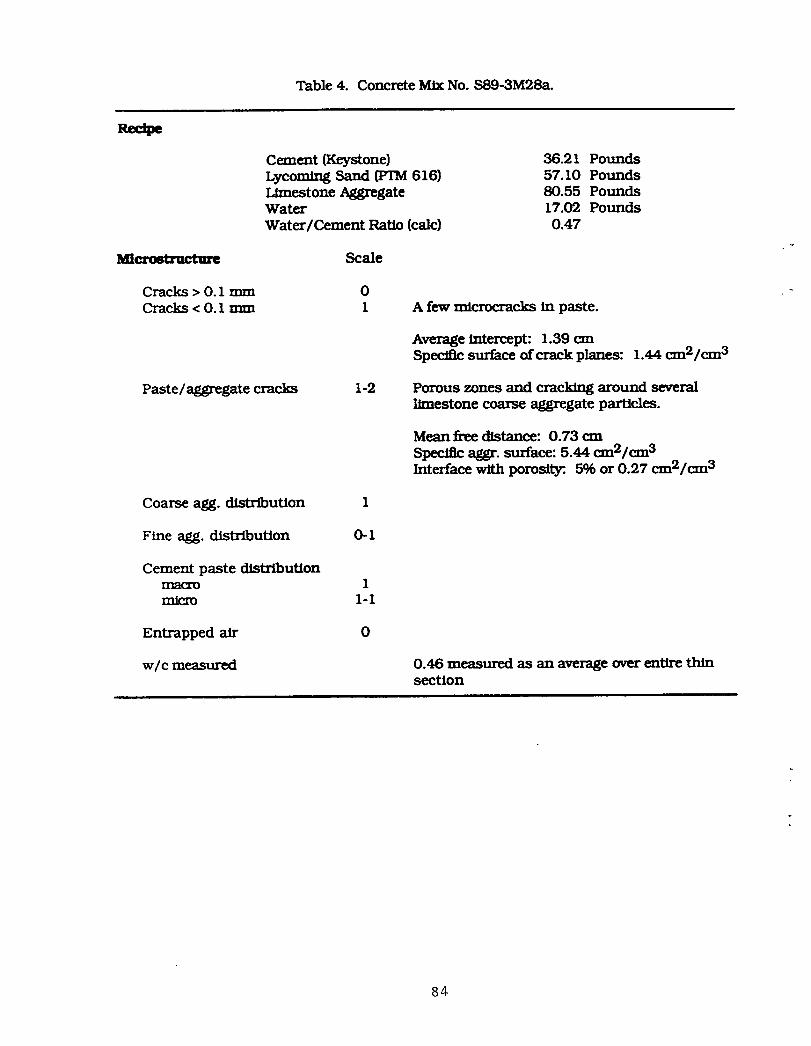
Table 4. Concrete Mix No. S89-3M28a.
Recipe
C_ent (Keystone) 36.21 PoundsLycoming Sand (FrM 616) 57.10 PoundsLimestone Aggregate 80.55 PoundsWater 17.02 Pounds
Water/Cement Ratio (calc) 0.47
Mlerc_x_'tm_ Scale
Cracks > 0.1 mm 0 - "
Cracks < 0.1 mm 1 A few microcracks in paste.
Average intercept: 1.39 cmSper_flc surface of crack planes: 1.44 cm2/cm 3
Paste/aggregate cracks 1-2 Porous zones and cracking around severallimestone coarse aggregate particles.
Mean free distance: 0.73 cmSpecific aggr. surface: 5.44 cm2/cm 3Interface with porosity:. 5% or 0.27 cm2/cm 3
Coarse agg. distribution I
Fine agg. distribution 0-1
Cement paste distributionmacro Imtero 1-1
Entrapped air 0
w/c measured 0.46 measured as an average over entire thinsection
84
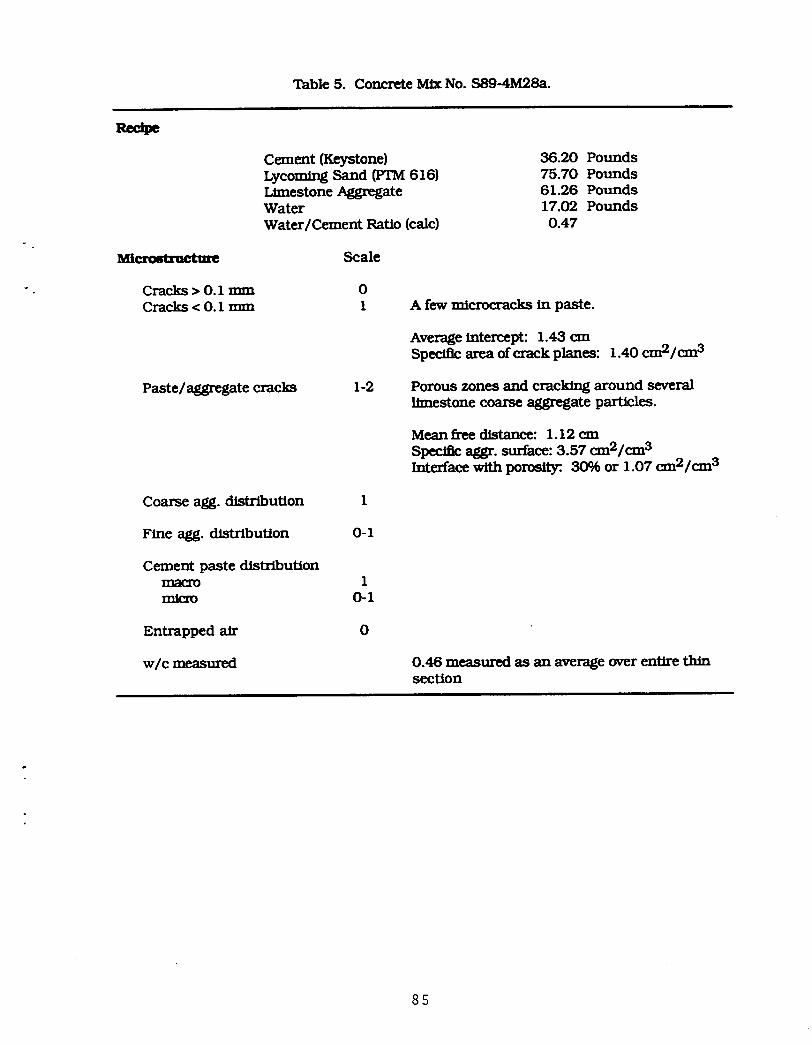
Table 5. Concrete Mix No. S89-4M28a.
Rpe
Cement (Keystone) 36.20 PoundsLycomi_g Sand (FIM 616) 75.70 PoundsLimestone Aggregate 61.26 PoundsWater 17.02 PoundsWater/Cement Ratio (calc) 0.47
Mi_ Scale
Cracks > 0.1 mm 0Cracks < 0.1 mm 1 A few microcracks in paste.
Average intercept: 1.43Speolflc area of crack planes: 1.40 cm2/rm 3
Paste/aggregate cracks 1-2 Porous zones and cracking around severallimestone coarse aggregate particles.
Mesnfree distance: 1.12 cm
Specific aggr. surface: 3.57 cm2/cm 3Interface with porosity=. 30% or 1.07 cm2/cm 3
Coarse agg. distribution 1
Fine agg. distribution 0-I
Cement paste distributionmacro 1micro 0-1
Entrapped air 0
w/c measured 0.46 measured as an average over entire thinsection
8S
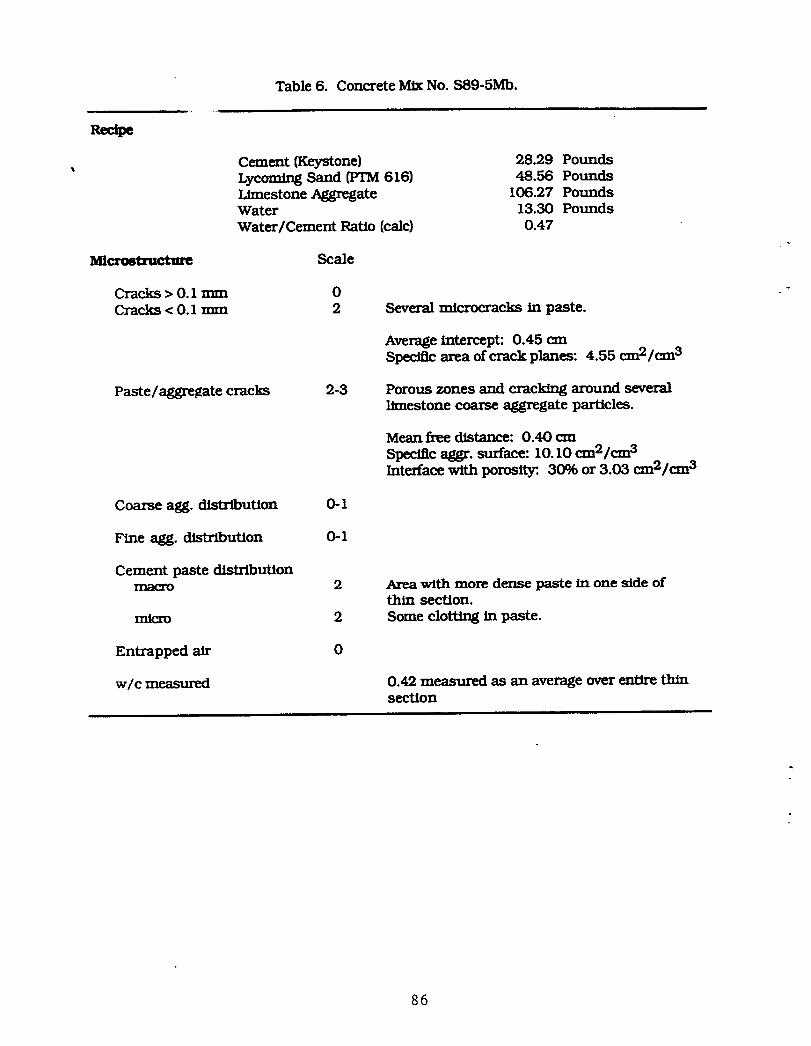
Table 6. Concrete Mix No. $89-5Mb.
Rec
Cement (Keystone) 28.29 PoundsLycoming Sand _ 616) 48.56 PoundsLimestone Aggregate 106.27 PoundsWater 13.30 PoundsWater/Cement Ratio (calc) 0.47
Mlcrostructure Scale
Cracks > 0.1 mm 0 "Cracks < 0.1 mm 2 Several microcracks in paste.
Average intercept: 0.45Specific area of crack planes: 4.55 em2/cm3
Paste/aggregate cracks 2-3 Porous zones and cracking around several]_nestone coarse aggregate particles.
Mean free distance: 0.40 cm
Specific aggr. surface: 10.10 cm2/c_3Interface with porosiW. 30% or 3.03 cm2/cwn3
Coarse agg. distribution 0-1
Fine agg. distribution 0-1
Cement paste distributionrrm<wo 2 Area with more dense paste in one side of
thin section.micro 2 Some clotting in paste.
Entrapped air 0
w/c measured 0.42 measured as an average over entire thinsectioni
86
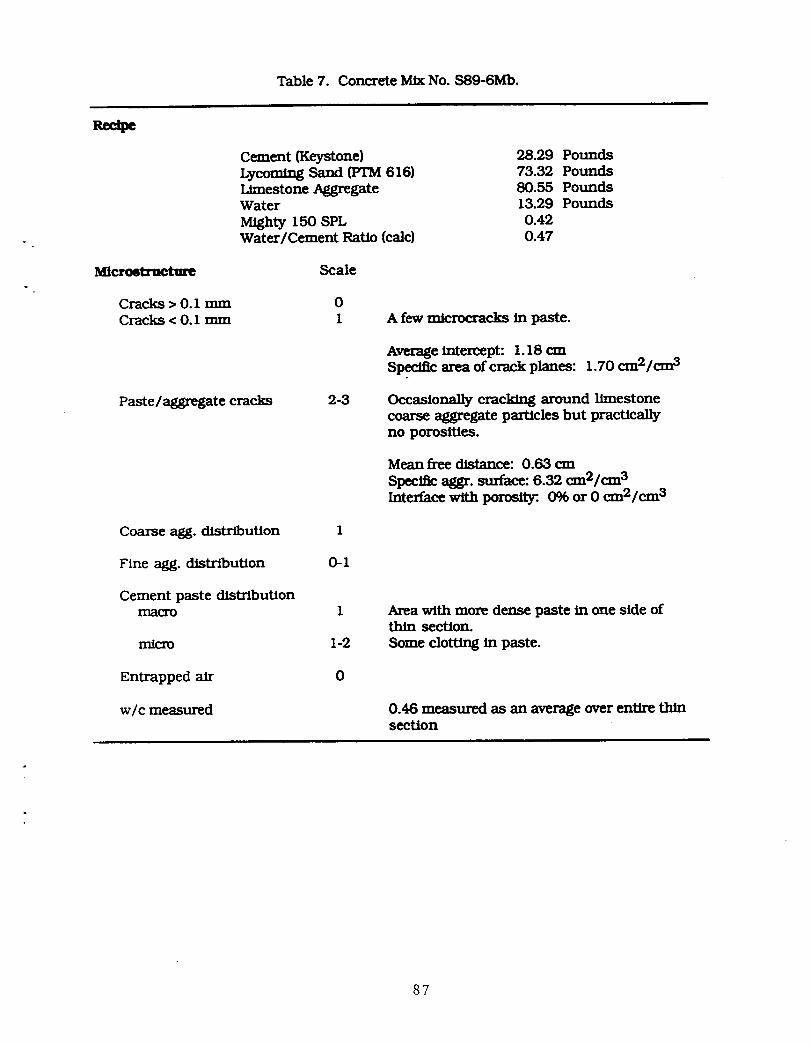
Table 7. Concrete Mix No. $89-6Mb.
P.ec
Cement {Keystone) 28.29 PoundsLycoming Sand (PTM 616) 73.32 PoundsLimestone Aggregate 80.55 PoundsWater 13.29 Pounds
Mighty 150 SPL 0.42_ Water/Cement Ratio (calc) 0.47
Microstraetu_ Scale° .
Cracks > 0.1 mm 0Cracks < 0.I mm 1 A few micro_-acks in paste.
Average intercept: 1.18 c_nSpecific area of crack planes: 1.70 cm2/_cwn3
Paste/aggregate cracks 2-3 Occasionally cracking around limestonecoarse aggregate particles but practicallyno porosities.
Mean free distance: 0.63 cm
Specific aggr. surface: 6.32 cm2/cm 3Interface with porosity= 0% or 0 cm 2/cm 3
Coarse agg. distribution 1
Fine agg. distribution 0-I
Cement paste distributionmacro 1 Area with more dense paste in one side of
thin section.micro 1-2 Some clotting in paste.
Entrapped air 0
w/c measured 0.46 measured as an average over entire thinsection
87
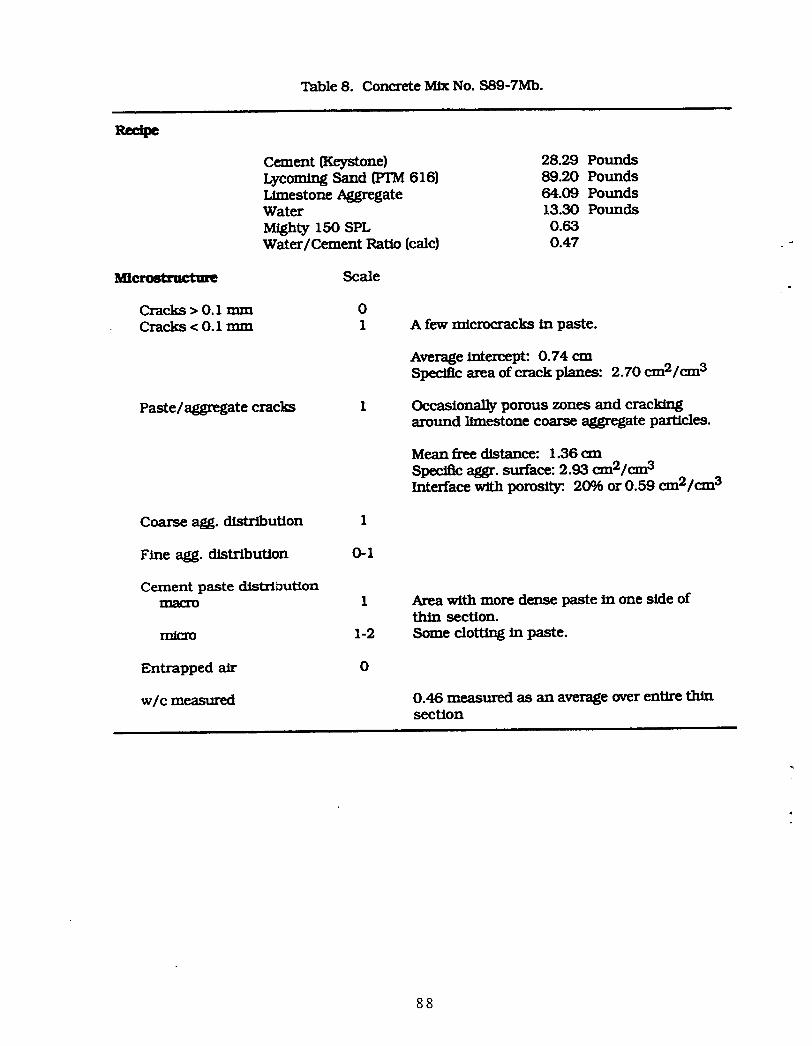
Table 8. Concrete Mix No. $89-7Mb.
Cement (Keystone) 28.29 PoundsLycomlng Sand (PTIVI616) 89.20 PoundsLimestone Aggregate 64.09 PoundsWater 13.30 Pounds
Mighty 150 SPL 0.63Water/Cement Ratio (calc) 0.47
Mlcrostruet_e Scale
Cracks > 0.1 rnrn 0Cracks < 0.1 rnrn 1 A few microcracks in paste.
Average intercept: 0.74 cmSpecific area of crack planes: 2.70 cm2/e_rn 3
Paste/aggregate cracks 1 Occasion_11y porous zones and crackingaround limestone coarse aggregate particles.
Mean free distance: 1.36 cmSpecific aggr. surface: 2.93 _2/cm3Interface with porosity. 20% or 0.59 _c_rn2/_c_n3
Coarse agg. distribution 1
Fine agg. distribution 0-1
Cement paste tlJ-qtrlt_ution1 Area with more dense paste in one side of
thin section.micro 1-2 Some dotting in paste.
Entrapped air 0
w/c measured 0.46 measured as an average over entire thinsection
88
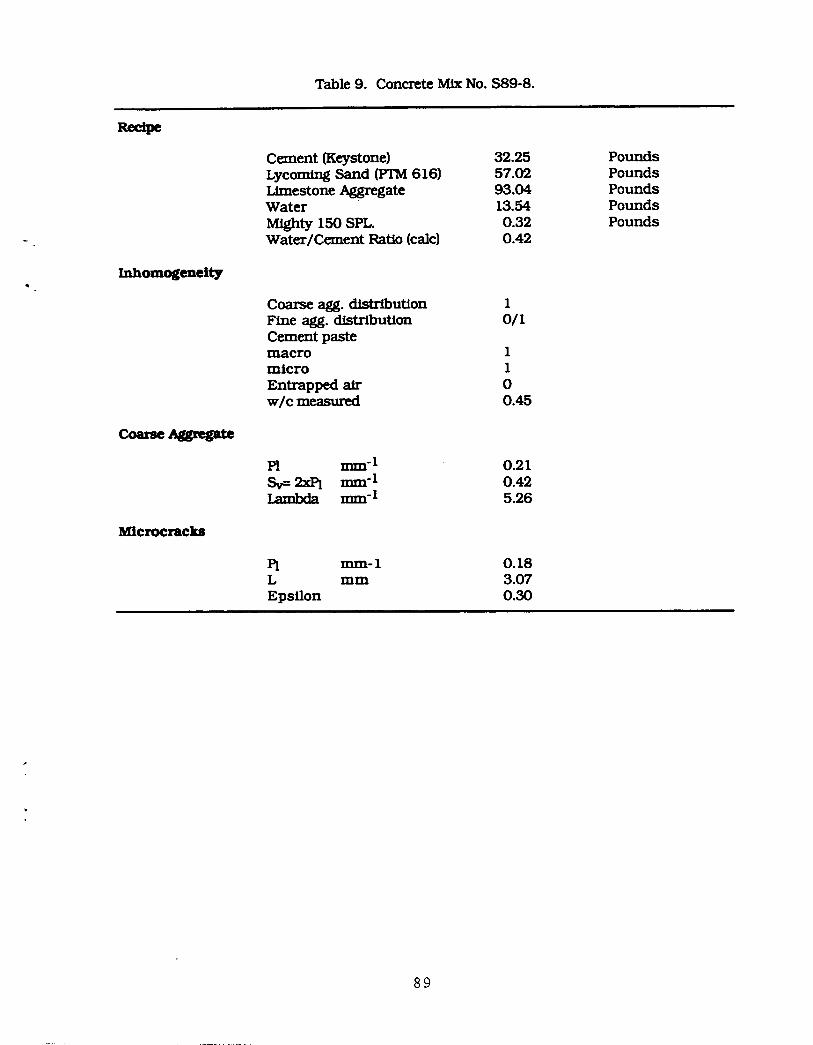
Table 9. Concrete Mix No. $89-8.
Cement (Keystone) 32.25 PoundsLycomlng Sand (FI"M616) 57.02 PoundsLimestone Aggregate 93.04 PoundsWater 13.54 Pounds
Mighty 150 SPL. 0.32 PoundsWater/Cement Ratio (ca)c) 0.42
Inhomogeneity
Coarse agg. distribution 1Fine agg. distribution 0/1Cement pastemacro 1micro 1Entrapped air 0w/c measured 0.45
Coarse Aggregate
P1 mm "I 0.21
Sv= 2x_ mm-I 0.42T_ml_:]a rnrn-1 5.26
Microcracb
Pj ram- I 0.18L mm 3.07
Epsflon 0.30
89
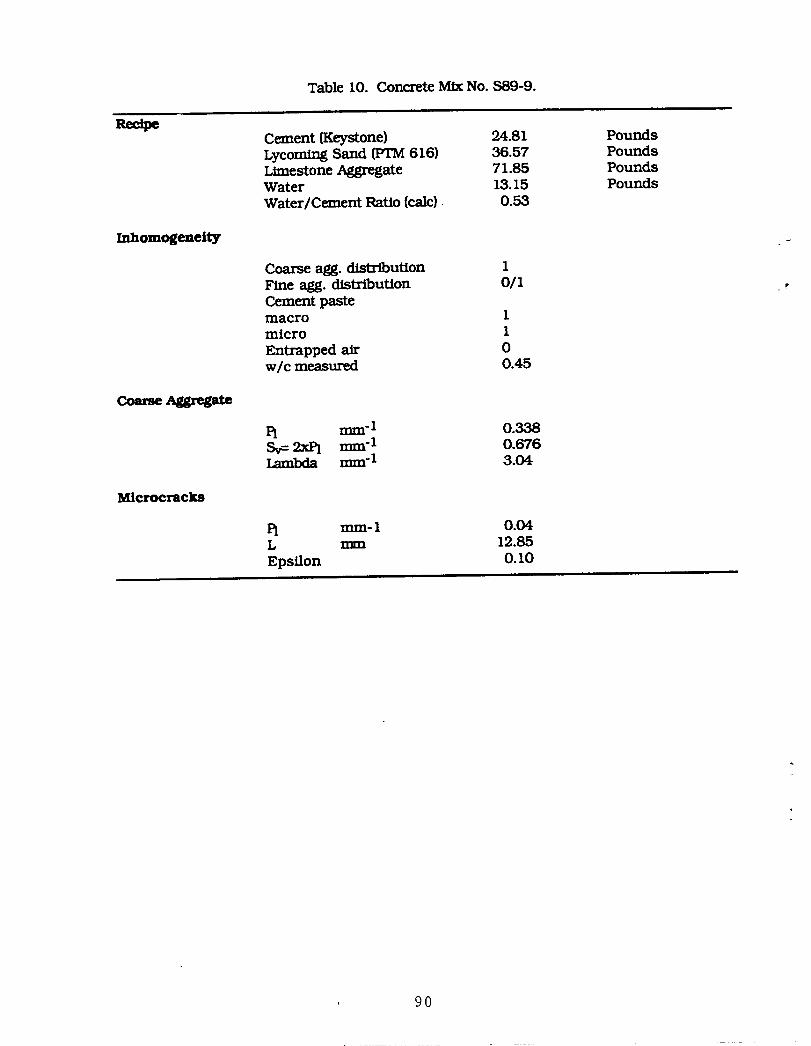
Table 10. Concrete Mix No. $89-9.
RecipeCement (Keystone} 24.81 PoundsLycornlng Sand WTM 616) 36.57 PoundsLimestone Aggregate 71.85 PoundsWater 13.15 PoundsWater/Cement Ratio (calc) 0.53
Inhomogeneity
Coarse agg. distribution 1Fine agg. distribution 0/ICement pastemacro 1micro 1
Entrapped air 0w/c measured 0.45
Coarse Aggregate
PI mm'l 0.338Sv= 2xPl ram-1 0.676T_rn'l"_da rnm "I 3.04
Microcracks
PI ram- 1 0.04L u_ 12.85
Epsflon 0.10i
9O
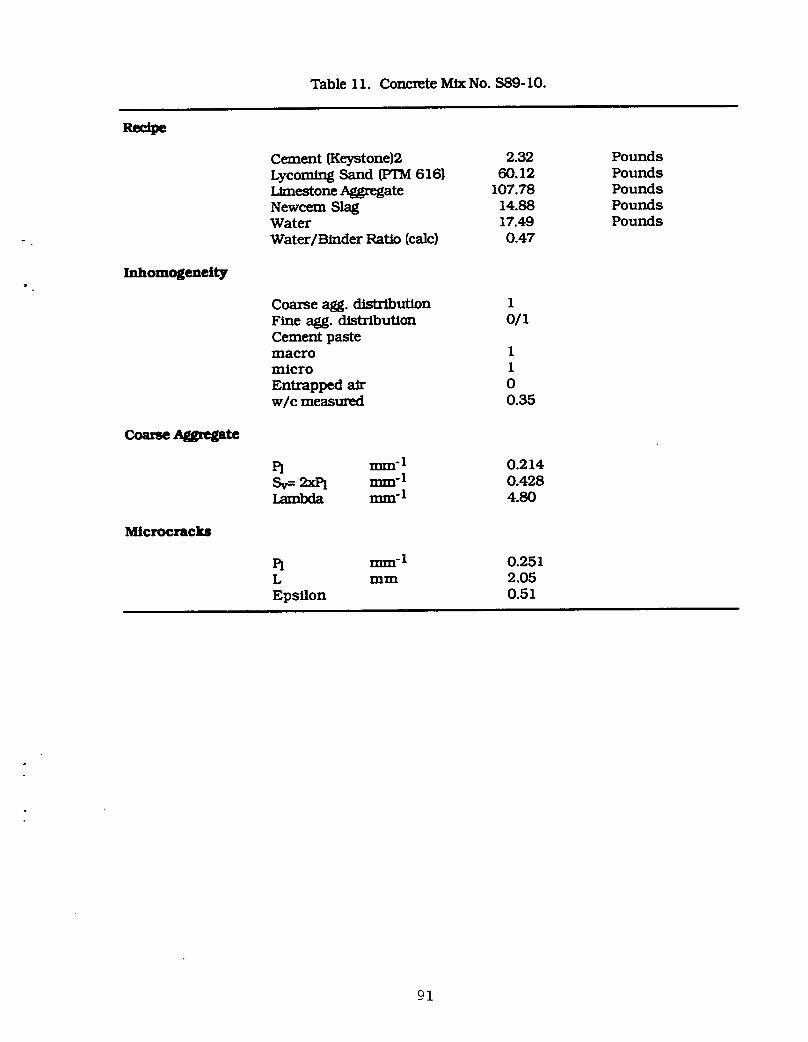
Table 11. Concrete Mix No. $89-10.
P.ece
Cement (Keystone)2 2.32 PoundsLycoming Sand (PTM 616) 60.12 PoundsLimestone Aggregate 107.78 PoundsNewcem Slag 14.88 PoundsWater 17.49 PoundsWater/Binder Ratio (calc) 0.47
Inhomogeneity
Coarse agg. distribution 1Fine agg. distribution 0/1Cement pastemacro 1micro 1Entrapped air 0w/c measured 0.35
Coarse _gregate
I_ mm "I 0.214Sv= 2xPI mm "I 0.428Lambda ram-1 4.80
Microcracks
PI mm-I 0.251L mm 2.05
Epsflon 0.51
91
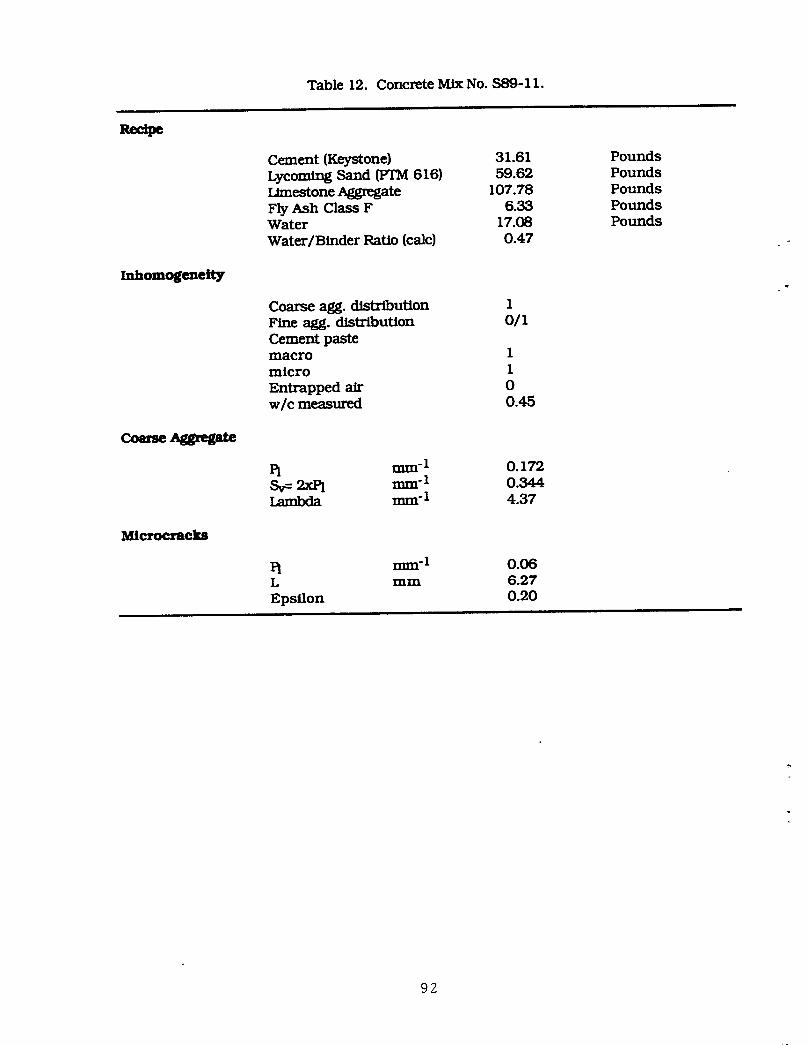
Table 12. Concrete Mix No. $89-11.
i i
P.ec
Cement (Keystone) 31.61 PoundsLycornJng Sand (PTM 616) 59.62 PoundsLimestone Aggregate 107.78 PoundsFly Ash Class F 6.33 PoundsWater 17.08 PoundsWater/Binder Ratio (calc) 0.47
Tnhomogeneity
Coarse agg. dtctribution 1Fine agg. distribution 0/1Cement pastemacro 1micro 1Entrapped air 0wlc measured 0.45
Coarse Aggregate
Pl ram-1 0.172Sv= 2xPI ram-1 0.344I_rnhda mm -I 4.37
/_icrocracks
PI rrrm-1 0.06L mm 6.27Epsflon 0.20
92
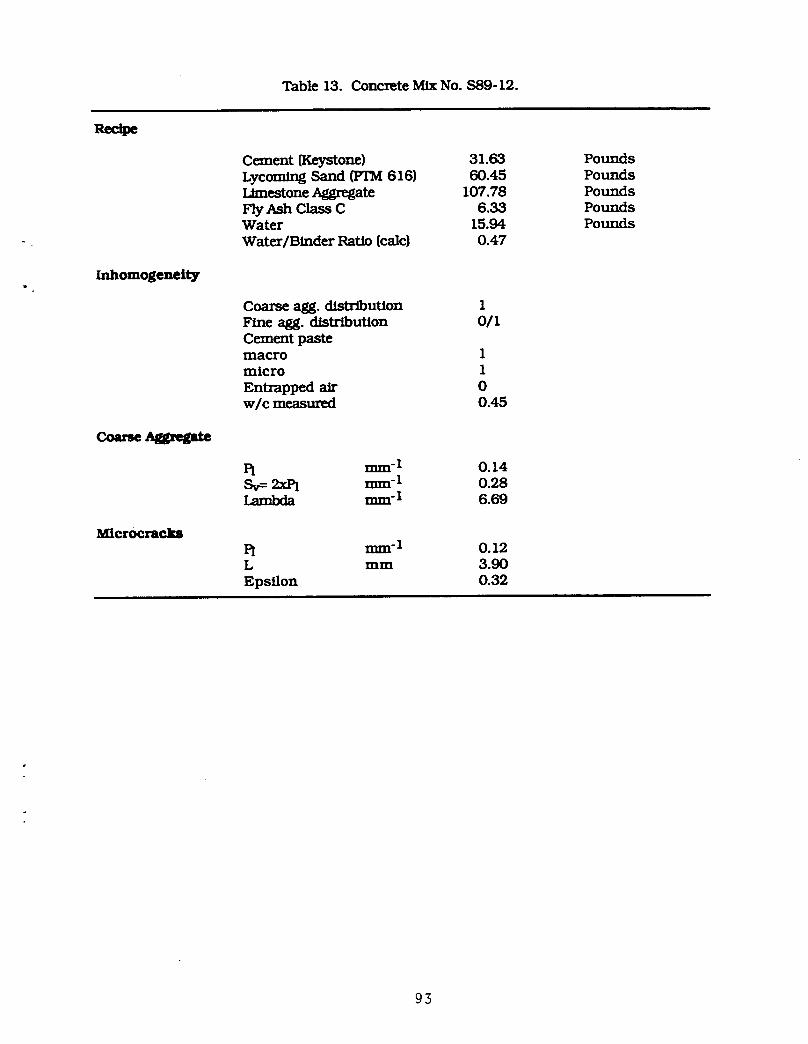
Table 13. Concrete MixNo. $89-12.
Ree
Cement (Keystone) 31.63 PoundsLycomlng Sand (PTIVl616) 60.45 PoundsLtmestone Aggregate 107.78 PoundsFly Ash Class C 6.33 PoundsWater 15.94 PoundsWater/Binder Ratio (calc) 0.47
Inhomogeneityw .
Coarse agg. distribution 1Fine agg. distribution 0/1Cement pastemacro 1micro 1
Entrapped air 0w/c measured 0.45
PI ram- 1 0.14Sv= 2xPI ram-1 0.28T_mhda m "I 6.69
M/crocracksPI ram-1 0.12L mm 3.90
Epsflon 0.32
95
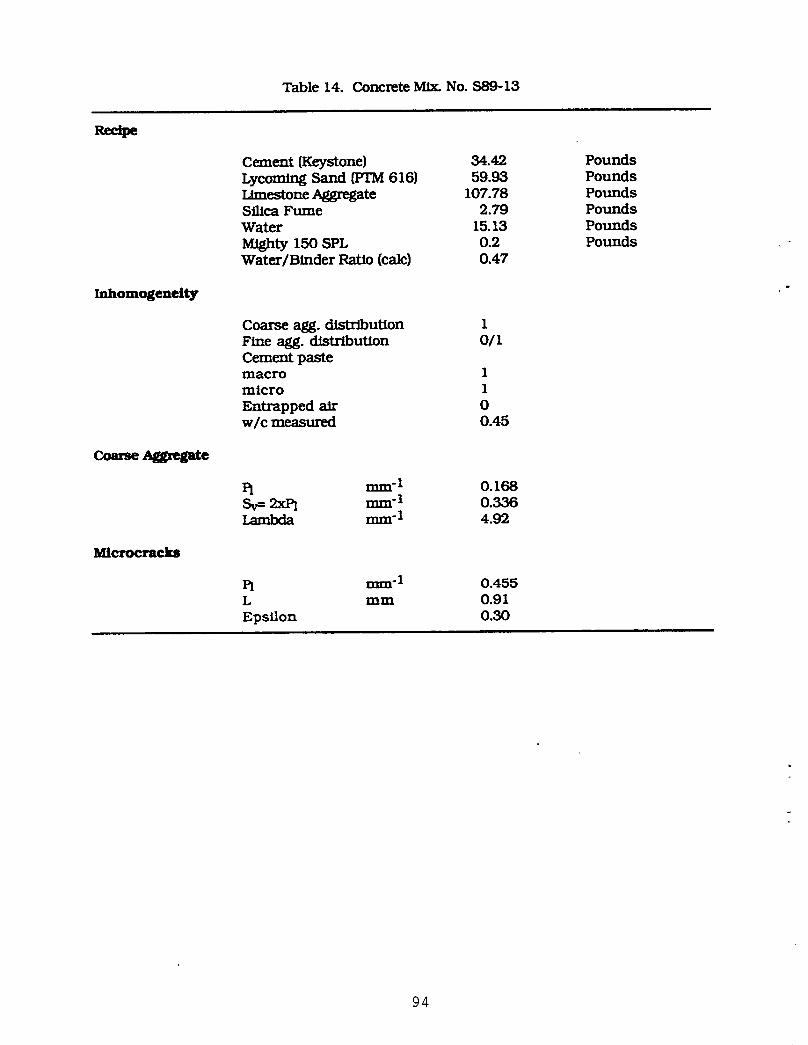
Table 14. Concrete Mix. No. $89-13
Rec_
Cement (Keystone) 34.42 PoundsLycomtng Sand {FI1VI616) 59.93 Pounds!.Imestone Aggregate 107.78 PoundsSilica Fume 2.79 PoundsWater 15.13 PoundsMighty 150 SPL 0.2 Pounds .Water/Binder Ratio (calc) 0.47
Inhomogenelty
Coarse agg. distribution 1Fine agg. distribution 0/1Cement pastemacro 1micro 1Entrapped air 0w/c measured 0.45
Coarse ._gregate
PI mm-1 0.168Sv= 2xPI rnm'l 0.336!-qrnhda ram" 1 4.92
Microcraeks
PI ram-1 0.455L mm 0.91Epsflon 0.30
94
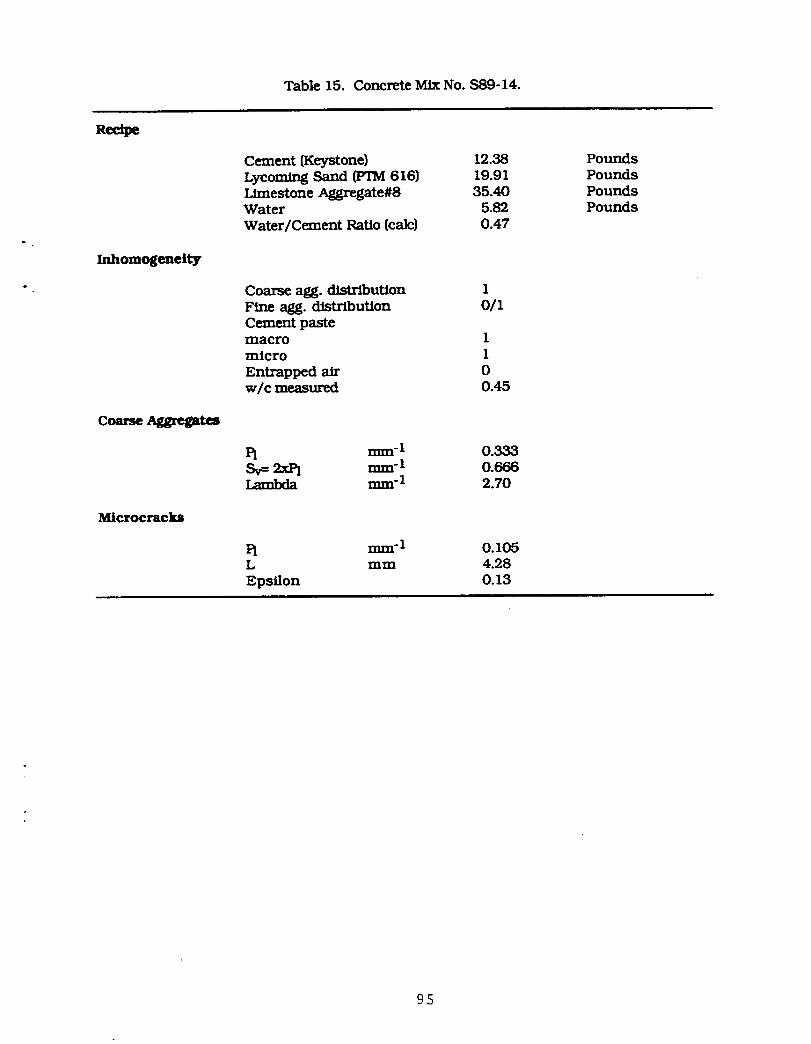
Table 15. Concrete MixNo. $89-14.
Cement (Keystone) 12.38 PoundsLycomlng Sand (PTM 616) 19.91 PoundsLimestone Aggregate#8 35.40 PoundsWater 5.82 PoundsWater/C_ment Ratio (calc) 0.47
Inhomogeneity
" Coarse agg. distribution 1Fine agg. distribution 0/1Cement pastemacro 1micro 1Entrapped air 0w/c measured 0.45
Coarse Aggregates
Pl mm-1 0.333Sv= 2xPI mm-I 0.666T-_mhda ram- I 2.70
Microcracks
PI ram- 1 0.105L mm 4.28
Epsflon 0.13
95

Table 16. Concrete Mix No. $89-15.
Recipe
Cement (Keystone) 37.14 PoundsLycomiz_ Sand [FI3Vl616) 59.73 PoundsSiliceous Aggregate#67 105.78 PoundsWater 17.46 Pounds
Water/Cement Ratio (calc) 0.47
Tnhomogeneity
Coarse agg. di_hlbution 1Fine agg. distribution 0/1Cement pastemacro 1micro 1Entrapped air 0w/c measured 0.45
Coarse Aggregate
PL rrm1-1 0.177Sv= 2xPI mm -I 0.354t_s"n_ rm'n-1 4.77
Microcracks
PI mm -1 0.08L mm 5.28
Epsflon 0.15
95
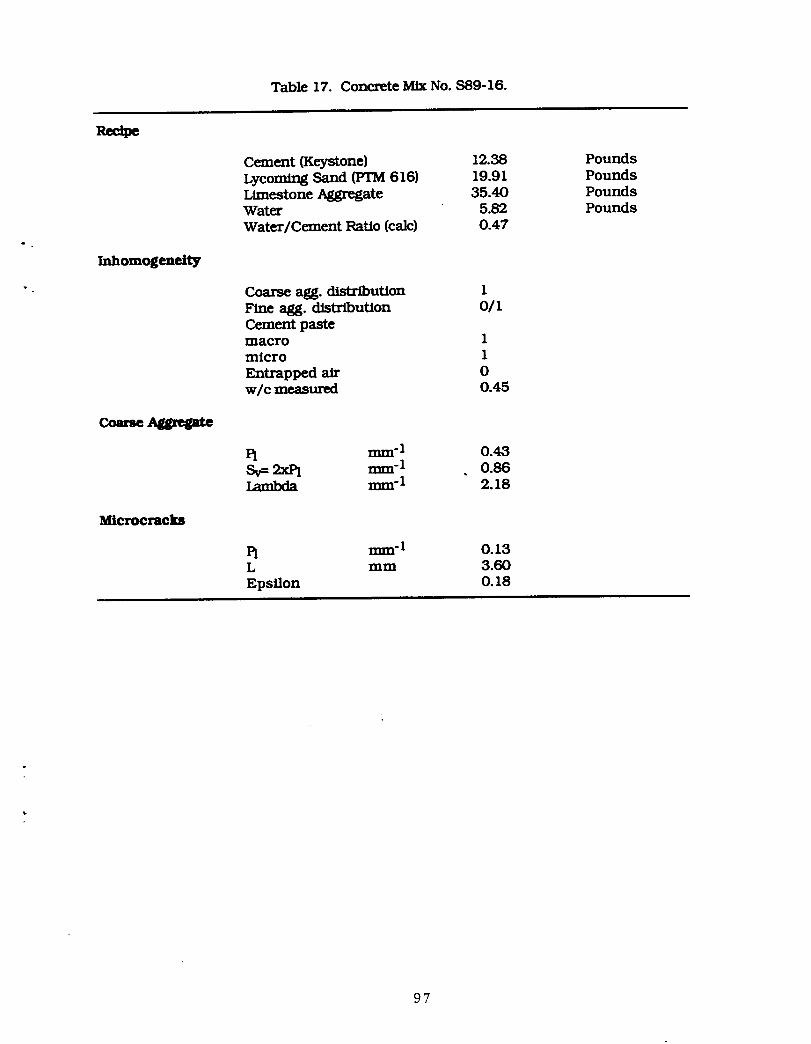
Table 17. Concrete Mix No. $89-16.
Zed
Cement (Keystone) 12.38 PoundsLycomlng Sand (PTM 616) 19.91 PoundsLimestone Aggregate 35.40 PoundsWater 5.82 PoundsWater/Cement Ratio (calc) 0.47
Inhomogeneity
" Coarse agg. distribution IFlne agg. distribution 0/1Cement pastemacro Imicro 1Entrapped air 0w/c measured 0.45
coarseegate
PI mm "1 0.43Sv= 2xPl mm -1 , 0.86T_rrthda mm-I 2.18
Microcracb
PI mm -i 0.13L mm 3.60
Epsflon 0.18
97
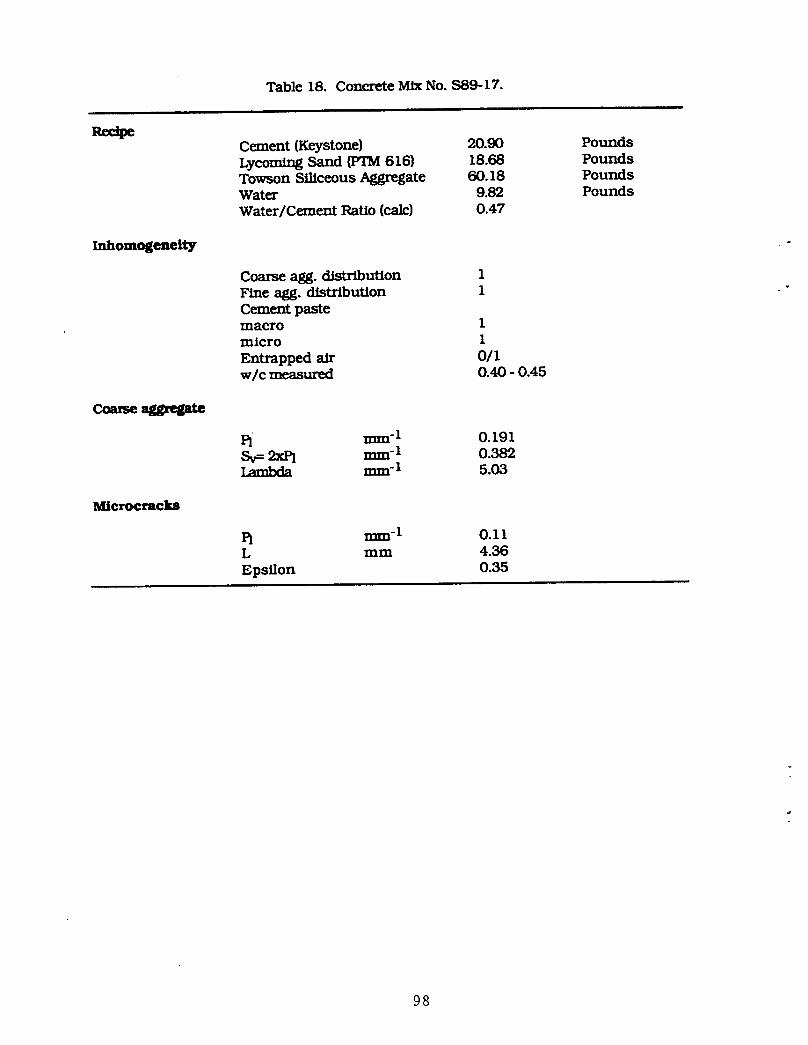
Table 18. Concrete M/x No. $89-17.
Re.pcCement (Keystone} 20.90 PoundsLycomlng Sand (PTM 616) 18.68 PoundsTowson Siliceous Aggregate 60.18 PoundsWater 9.82 Pounds
Water/Cement Ratio (calc) 0.47
Inhomogeneity
Coarse agg. distribution 1Fine agg. distribution 1 .-Cement pastemacro Imicro 1
Entrapped air 0/Iw/c measured 0.40 - 0.45
Coarse sggregate
Pi rm_-I 0.191Sv= 2xPl mm "1 0.382I_mhda mm -1 5.03
Microcracks
PI mm-I 0.11L mm 4.36Epsflon 0.35
98
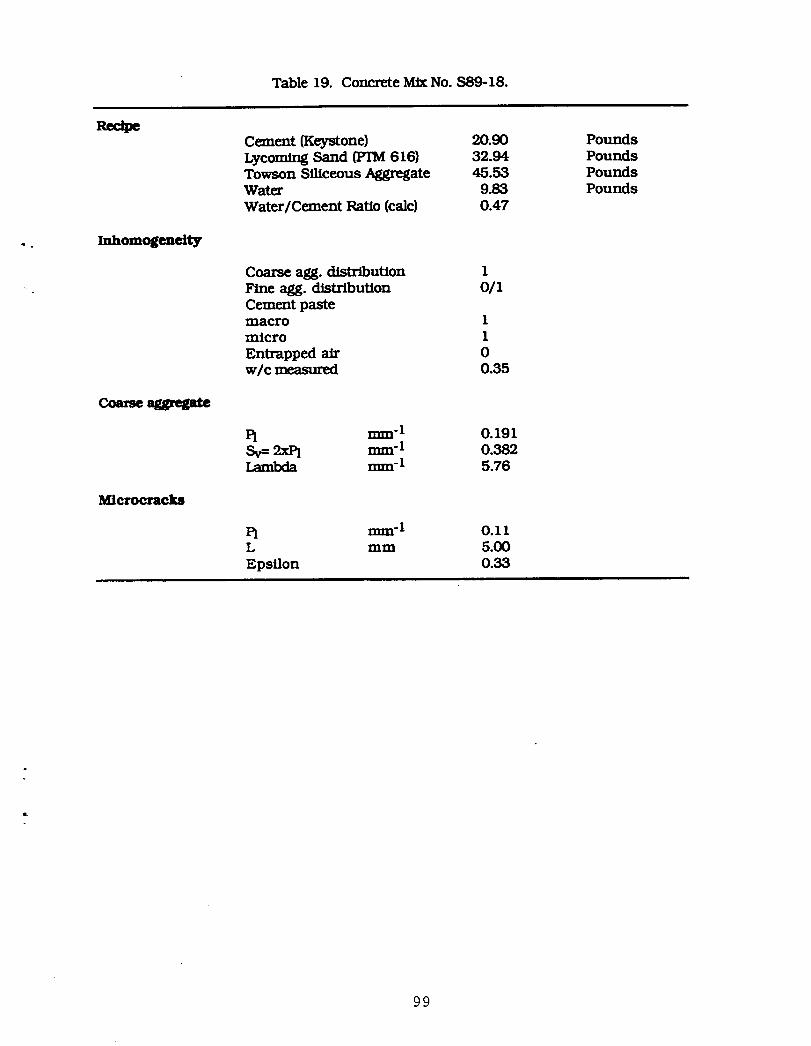
Table 19. Concrete Mix No. $89-18.
P.ecCement (Keystone) 20.90 PoundsLycomlng Sand (IrrM 616) 32.94 PoundsTowson Siliceous Aggregate 45.53 PoundsWater 9.83 PoundsWater/Cement Ratio (ca]c) 0.47
. Tnhomogeneity
Coarse agg. distribution 1Fine agg. distribution 0/1Cement pastemacro 1micro 1Entrapped air 0w/c measured 0.35
coarse
turn-1 O.1912xPI mm -I 0.382
T_mtx:]a Into" 1 5.76
Microcracks
PI ,_In-I 0.11L mm 5.00
Epsflon 0.33
99
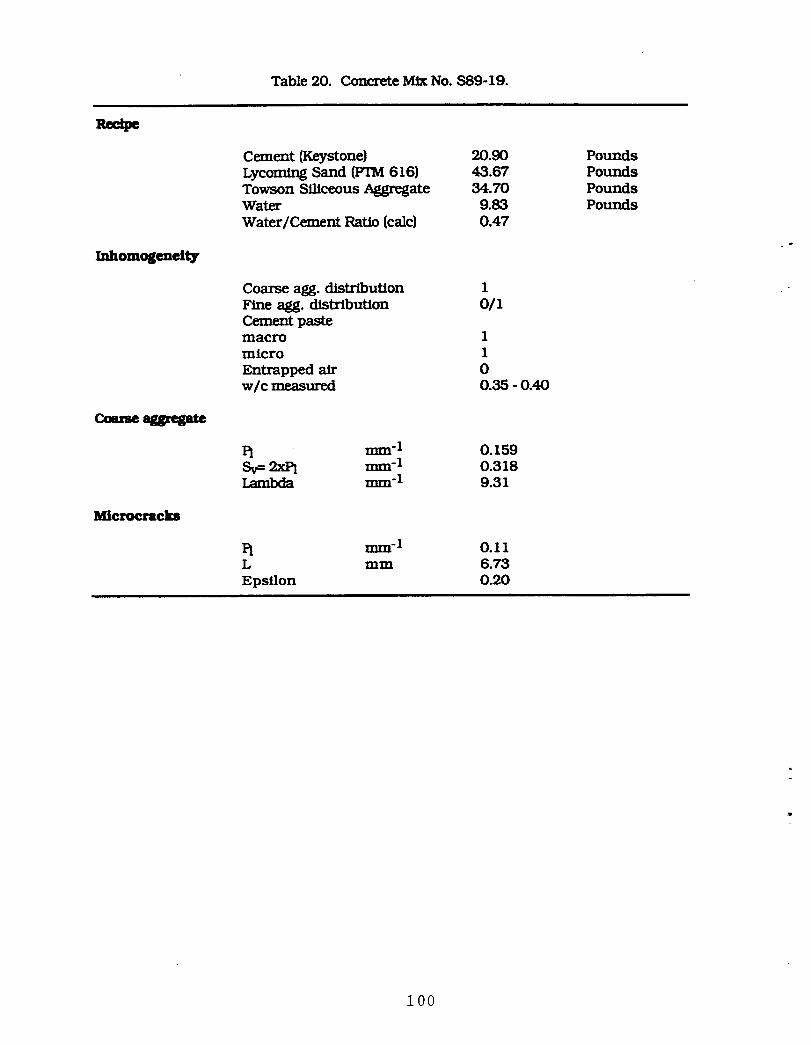
Table 20. Concrete Mix No. $89-19.
Cement (Keystone) 20.90 PoundsLycomlng Sand (PTM 616) 43.67 PoundsTowson Slllceous Aggregate 34.70 PoundsWater 9.83 PoundsWater / Cement Ratio (calc) 0.47
Tnhomogeneity
Coarse agg. distribution 1 .-Fine agg. distribution 0/1Cement pastemacro 1micro 1Entrapped air 0w/c measured 0.35 - 0.40
Coarse sggregate
PI ram-1 0.159Sv= 2xP1 ram-1 0.318Lambda ram-1 9.31
Microeracks
PI mm "I 0.11L mm 6.73Epsilon 0.20
IO0
Appendix C
Nordtest 677-87Concrete, Hardened; Water-Cement Ratio
1 (4)
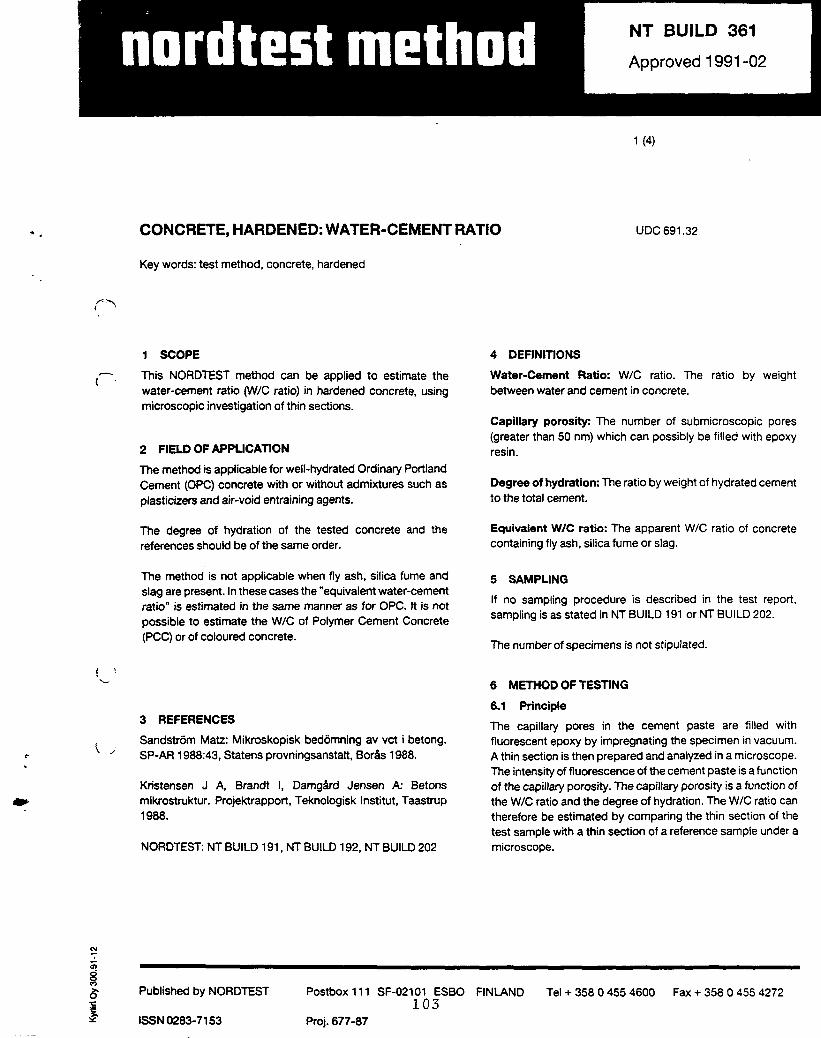
.. CONCRETE, HARDENED: WATER-CEMENT RATIO UDC691.32
Key words: test method, concrete, hardened
1 SCOPE 4 DEFINITIONS
(_ This NORDTEST method can be applied to estimate the Water-Cement Ratio: W/C ratio. The ratio by weightwater-cement ratio (W/C ratio) in hardened concrete, using between water and cement inconcrete.microscopic investigationof thin sections.
Capillary porosity: The number of submicroscopic pores(greater than 50 nm) which can possibly be filled with epoxy
2 FIELD OF APPLICATION resin.
The method is applicable for well-hydrated Ordinary PortlandCement (OPC) concrete with or without admixtures such as Degree of hydration: The ratio byweight of hydrated cement
plasticizers and air-void entraining agents, to the total cement.
The degree of hydration of the tested concrete and the Equivalent W/C ratio: The apparent W/C ratio of concretereferences shouldbe of the same order, containing fly ash, silicafume or slag.
The method is not applicable when fly ash, silica fume and 5 SAMPLINGslag are present. Inthese cases the "equivalent water-cement
If no sampling procedure is described in the test report,ratio" is estimated in the same manner as for OPC. It is not
possible to estimate the W/C of Polymer Cement Concrete samplingis asstated in NT BUILD 191 or NT BUILD 202.
(PCC) orof coloured concrete. The number of specimens is not stipulated.
_- 6 METHOD OF TESTING
6.1 Principle
3 REFERENCES The capillary pores in the cement paste are filled withSandstr6m Matz: Mikroskopisk bed6mning av vct i betong, fluorescent epoxy by impregnating the specimen in vacuum.
_" SP-AR 1988:43, Statens provningsanstalt, Bor&s 1988. A thin section isthen prepared and analyzed in a microscope.The intensity of fluorescence of the cement paste is afunction
Kdstensen J A, Brandt I, Damg_d Jensen A: Betons of the capillary porosity. The capillary porosity is a function of
mikrostruktur. Projektrapport, Teknologisk Institut, Taastrup the W/C ratio and the degree of hydration. The W/C ratio can1988. therefore be estimated by comparing the thin section of the
test sample with a thin section of a referencesample under a
NORDTEST: NT BUILD 191, NT BUILD 192, NT BUILD 202 microscope.
_, Published by NORDTEST Postbox 111 SF-02101 ESBO FINLAND Tel + 358 0 455 4600 Fax + 358 0 455 4272103
ISSN 0283-7153 Proj. 677-87
NORDTEST METHOD NTBUILD361 2
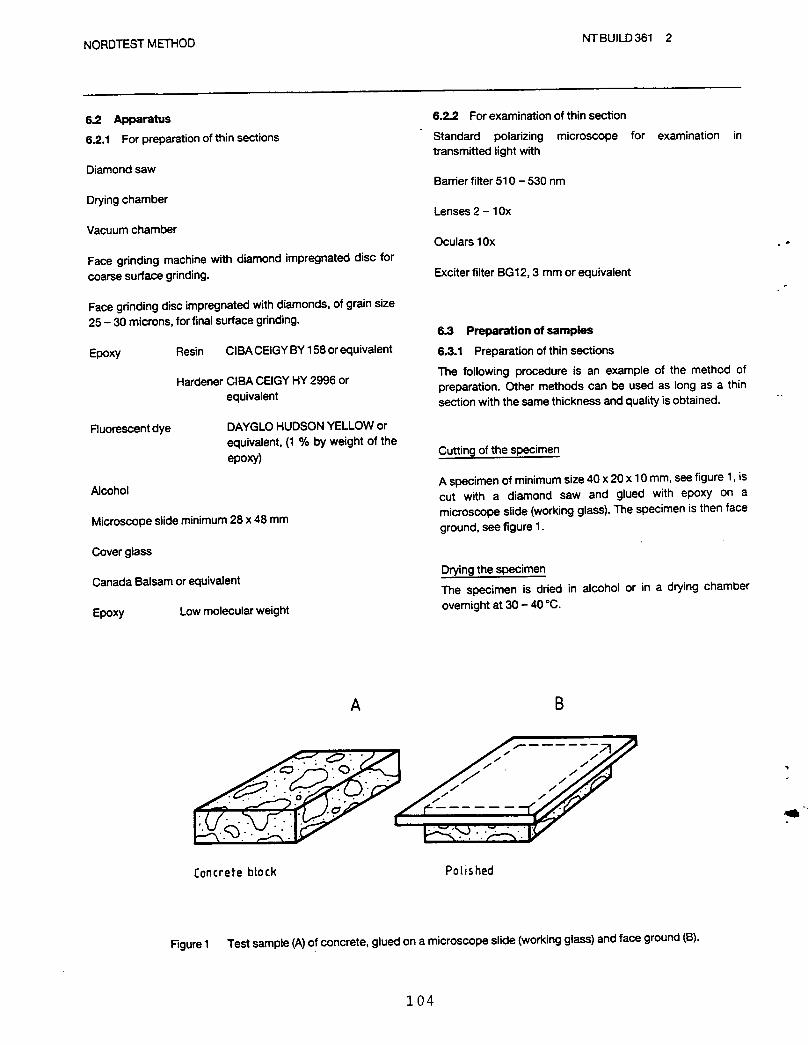
6.2 Apparatus 6.2.2 For examination of thin section
6.2.1 For preparation of thin sections Standard polarizing microscope for examination intransmitted light with
Diamond saw
Barrier filter 510 - 530 nm
DryingchamberLenses 2 - 10x
Vacuum chamber
Oculars 10x
Face grinding machine with diamond impregnated disc for
coarse surface grinding. Exciter filter BG12, 3 mm or equivalent. r
Face grinding disc impregnated with diamonds, of grain size
25 - 30 microns, for final surface grinding.6.3 Preparation of samples
Epoxy Resin CIBA CEIGYBY 158 orequivalent 6.3.1 Preparation of thin sections
The following procedure is an example of the method ofHardener CIBA CEIGY HY 2996 or
equivalent preparation. Other methods can be used as long as a thinsection with the same thickness and quality is obtained. -
Fluorescent dye DAYGLO HUDSON YELLOW or
equivalent, (1% by weight of theepoxy) Cutting of the specimen
Alcohol A specimen of minimum size 40 x 20 x 10 mm, see figure 1, iscut with a diamond saw and glued with epoxy on a
Microscope slide minimum 28 x 48 mm microscope slide (working glass). The specimen is then faceground, see figure 1.
Cover glass
Canada Balsam or equivalent Dryingthe specimenThe specimen is dried in alcohol or in a drying chamber
Epoxy Lowmolecular weight overnight at 30 - 40 °C.
A B
• • ,. -
ql=
Concrete block Polished
Figure I Test sample (A)of concrete, glued on a microscope slide (working glass) and face ground (B).
104
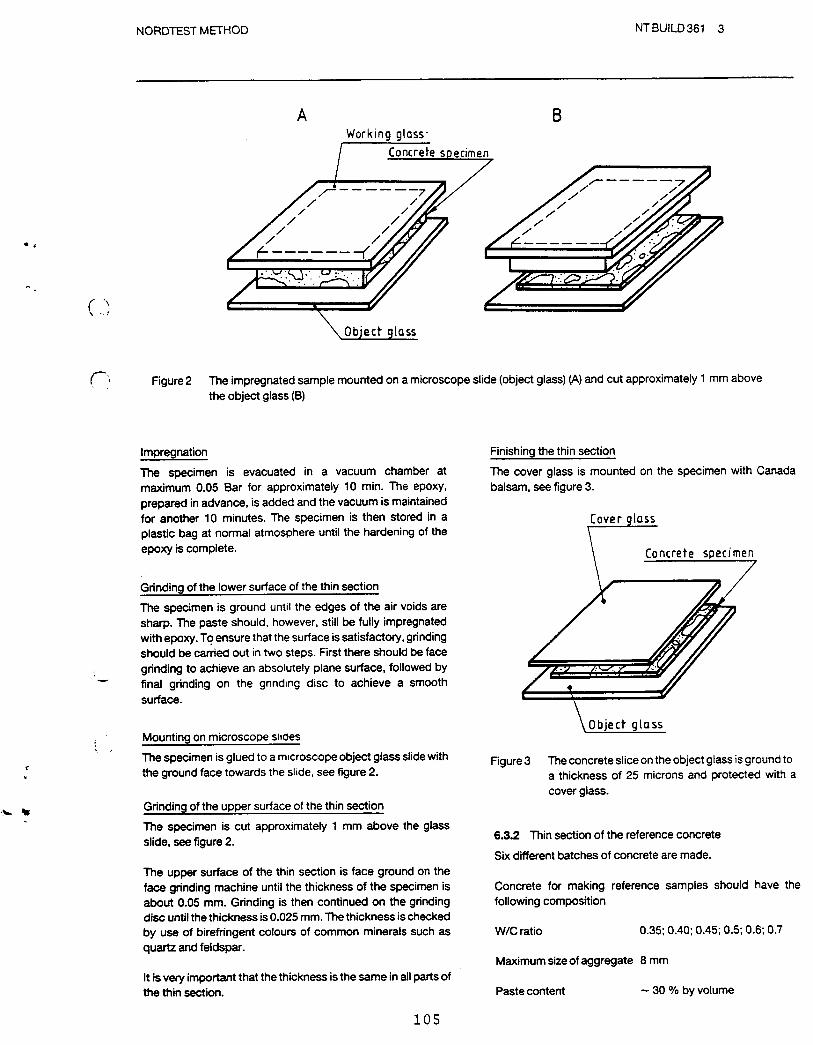
NORDTEST METHOD NTBUILD361 3
A BWorking glass"
Concrete specimen
..(
• Object glass
t_'i, Figure 2 The impregnated sample mounted on a microscope slide (object glass) (A) and cut approximately 1 mm abovethe object glass (B)
Impregnation Finishingthe thin section
The specimen is evacuated in a vacuum chamber at The cover glass is mounted on the specimen with Canadamaximum 0.05 Bar for approximately 10 rain. The epoxy, balsam, seefigure 3.
prepared inadvance, is added and the vacuum is maintained
for another 10 minutes. The specimen is then stored in a Cover glossplastic bag at normal atmosphere until the hardening of the
epoxy is complete. Concrete specimen
Grinding of the lower surface of the thin section
The specimen is ground until the edges of the air voids aresharp. The paste should, however, still be fully impregnated
with epoxy. To ensure that the surface issatisfactory, grindingshould be carried out in two steps. Firstthere should be face
i grinding to achieve an absolutely plane surface, followed by j/,-;t' ,(,'..-._,.'_v final grinding on the gnndmg disc to achieve a smooth ("surface. k
\Object glassMounting on microscope slloes
The specimen is glued to a m_croscopeobject glass slidewith Figure3 The concrete slice on theobject glass is ground to,_ the ground face towards the slide, see figure 2. a thickness of 25 microns and protected with a
cover glass.
_ Grinding of the upper surface of the thin section
The specimen is cut approximately 1 mm above the glass
slide, see figure 2. 6.3.2 Thin section of the reference concreteSix different batches of concrete are made.
The upper surface of the thin section is face ground on theface grinding machine until the thickness of the specimen is Concrete for making reference samples should have theabout 0.05 mm. Grinding is then continued on the grinding following compositiondisc until the thickness is 0.025 ram. The thickness is checked
by use of birefringent colours of common minerals such as W/C ratio 0.35; 0.40; 0.45; 0.5; 0.6; 0.7quartz and feldspar.
Maximum size of aggregate 8 mm
It is very important that the thickness is the same in all parts ofthe thin section. Paste content _ 30 % by volume
105
NORDTEST METHOD NTBUILD361 4
Slump 60 - 80 mm 6.5 Results
Aircontent - 3 % The W/C ratio is determined as the mean value of the W/Cratio in 10 fields of images.
Plasticizer if necessary The W/C ratio isstated as a non-dimensional number withtwodecimals where the second decimal is roundedto 0 or 5.
From each batch of concrete a sample is prepared according
to NT BUILD 201. Thin sections from each reference sample The variation of the W/C ratio is stated as homogeneous,are then prepared according to section 6.3.1. The thinsections used as references should always be stored ina dark inhomogeneous or very inhomogeneous, according to . °
table 1.place,
New references should be prepared when the method for
sample preparation is changed. Table I Homogeneity of cement paste
Once a year the intensity fluorescence of the reference Homogeneity Range of variationof W/C in
samples should be checked. If there have been any changes 10 fields of images
new reference samples must be made. Homogeneous < 0,1
Inhomogeneous 0.1 - 0.2
6.3.3 Thin section of test samples Very inhomogeneous -> 0.2A thin sectionof the test sample is made according to section
6.3.1 and in the same way as the reference samples areprepared.
The following should be noted:
- The paste content and air void content must be of the 6.6 Test report
same order as inthe reference samples The test report shall include the following information,whenrelevant:
- The thicknessof the thinsections of the test sample and
of the reference samples must be 25 microns, a) Name and address of the testing laboratoryb) Identification number of the test report
6.4 Procedure c) Name and address of the organization or the person
6.4.1 Examination of test samples ordering the test
The exciter filter and the barrierfilter are placed inthe raypath d) Purpose of the test
of the microscope. The test sample is placed on the e) Method of sampling and otherfactua! information (date
microscope stage. The reference samples are then placed on and person responsible for sampling)the stage by turn. The W/C ratio is determined to the nearest
0.05 by comparing the fluorescent intensityof the samples, f) Name and address of manufa_urer or supplier of thetested object
The W/C ratio is determined in 10 different fields of images, g) Name or other identification marks of the tested object
h) Description of the tested objectThe range of variation between the fields is calculated.
i) Date of supply of the tested object
During the examination the following must be considered: D Date of test ,i, ._
k) Test method- The air void contentand the cement paste content inthe
field of image of the test sample and the reference m) Any deviations from thetest methodsample must be of the same order, n) Test results
- Each field of image must be in uncarbonated cement o) Inaccuracy or uncertainty of the test resultspaste and at least 5 mm from the originalsurface of the p) Date and signatureconcrete.
106
Concrete and Structures Advisory Committee
Chairman Liaisons
James J. Murphy
New York State Department of Transportation (retired) Theodore R. FerragutFederal Highway Administration
Vice ChairmanHoward H. Newlon, Jr. Crawford F. Jencks
Virginia Transportation Research Council (retired) Transportation Research Board
Members Bryant Mather
"_ _, USAE Waterways Experiment Station
Charles J. Arnold
Michigan Department of Transportation Thomas J. Pasko, Jr.", Federal Highway Administration
Donald E. Beuerlein
Koss Construction Co. John L. RiceFederal Aviation Administration
Bernard C. Brown
lowa Department of Transportation Suneel VanikarFederal Highway Administration
Richard D. Gaynor
National Aggregates Association Ready Mixed 11/19/92Concrete Association
Expert Task GroupRobert J. Girard
Missouri Highway and Transportation Department Amir Hanna
Transportation Research BoardDavid L. Gress
University of New Hampshire Richard H. Howe
Pennsylvania Department of Transportation (retired)Gary Lee Hoffman
Pennsylvania Department of Transportation Stephen Forster
Federal Highway AdministrationBrian B. Hope
Queens University Rebecca S. McDaniel
Indiana Department of TransportationCarl E. Locke, Jr.
University of Kansas Howard H. Newlon, Jr.
Virginia Transportation Research Council (retired)Clellon L. Loveall
Tennessee Department of Transportation Celik H. Ozyildirim
Virginia Transportation Research CouncilDavid G. Manning
Ontario Ministry of Transportation Jan P. Skalny
W.R_ Grace and Company (retired)Robert G. Packard
Portland Cement Association A. Haleem Tahir
American Association of State Highway and Transportation
James E. Roberts Officialst California Department of Transportation
Lillian Wakeley
John M. Scanlon, Jr. USAE Waterways Experiment StationWiss danney Elstner Associates
_ Charles F. Scholer
Purdue University
Lawrence L. Smith
Florida Department of Transportation
John R. Strada
Washington Department of Transportation (retired)