Embed Size (px)
Citation preview

MOLECULAR NEUROSCIENCEMETHODS ARTICLE
published: 02 November 2011doi: 10.3389/fnmol.2011.00034
Concurrent imaging of synaptic vesicle recycling andcalcium dynamics
Haiyan Li 1, Sarah M. Foss1,2,Yuriy L. Dobryy 1†, C. Kevin Park 1, Samuel Andrew Hires3,4†,
Nathan C. Shaner 3,4†, RogerY.Tsien3,4, Leslie C. Osborne5 and Susan M. Voglmaier 1*
1 Department of Psychiatry, School of Medicine, University of California San Francisco, San Francisco, CA, USA2 Graduate Program in Cell Biology, School of Medicine, University of California San Francisco, San Francisco, CA, USA3 Department of Pharmacology, Howard Hughes Medical Institute, University of California San Diego, La Jolla, CA, USA4 Department of Chemistry, and Biochemistry, Howard Hughes Medical Institute, University of California San Diego, La Jolla, CA, USA5 Department of Neurobiology, University of Chicago, Chicago, IL, USA
Edited by:
Alistair N. Garratt, Max DelbrückCenter for Molecular Medicine,Germany
Reviewed by:
Richard John Reimer, StanfordUniversity, USAEdwin Levitan, University ofPittsburgh, USA
*Correspondence:
Susan M. Voglmaier , Department ofPsychiatry, University of CaliforniaSchool of Medicine, 401 ParnassusAvenue, LPPI-A101, San Francisco,CA 94143-0984, USA.e-mail: [email protected]†Present address:
Yuriy L. Dobryy , Department ofPsychiatry, Mount Sinai School ofMedicine, New York, NY, USA;Samuel Andrew Hires, HowardHughes Medical Institute, JaneliaFarm Research Campus, Ashburn, VA,USA;Nathan C. Shaner , Monterey BayAquarium Research Institute, MossLanding, CA, USA.
Synaptic transmission involves the calcium dependent release of neurotransmitter fromsynaptic vesicles. Genetically encoded optical probes emitting different wavelengths offluorescent light in response to neuronal activity offer a powerful approach to understandthe spatial and temporal relationship of calcium dynamics to the release of neurotrans-mitter in defined neuronal populations. To simultaneously image synaptic vesicle recyclingand changes in cytosolic calcium, we developed a red-shifted reporter of vesicle recy-cling based on a vesicular glutamate transporter, VGLUT1-mOrange2 (VGLUT1-mOr2), anda presynaptically localized green calcium indicator, synaptophysin-GCaMP3 (SyGCaMP3)with a large dynamic range. The fluorescence of VGLUT1-mOr2 is quenched by the lowpH of synaptic vesicles. Exocytosis upon electrical stimulation exposes the luminal mOr2to the neutral extracellular pH and relieves fluorescence quenching. Reacidification of thevesicle upon endocytosis again reduces fluorescence intensity. Changes in fluorescenceintensity thus monitor synaptic vesicle exo- and endocytosis, as demonstrated previouslyfor the green VGLUT1-pHluorin.To monitor changes in calcium, we fused the synaptic vesi-cle protein synaptophysin to the recently improved calcium indicator GCaMP3. SyGCaMP3is targeted to presynaptic varicosities, and exhibits changes in fluorescence in responseto electrical stimulation consistent with changes in calcium concentration. Using real timeimaging of both reporters expressed in the same synapses, we determine the time courseof changes inVGLUT1 recycling in relation to changes in presynaptic calcium concentration.Inhibition of P/Q- and N-type calcium channels reduces calcium levels, as well as the rateof synaptic vesicle exocytosis and the fraction of vesicles released.
Keywords: synapse, vesicle, exocytosis, endocytosis, recycling, calcium, imaging, glutamate
INTRODUCTIONThe coupling of calcium influx to the release of neurotransmitterby exocytosis from synaptic vesicles underlies quantal neuro-transmission (Katz and Miledi, 1969). Although this process hasbeen studied in detail in individual synapses electrophysiologi-cally, optical reporters of Ca2+ flux and synaptic vesicle recyclingoffer the opportunity to simultaneously image activity acrossnumerous synapses in neural circuits and networks (Takahashiand Momiyama, 1993; Wheeler et al., 1994; Von Gersdorff andMatthews, 1999; Schneggenburger and Neher, 2000; Zakharenkoet al., 2001; Li et al., 2005b; Dreosti et al., 2009; Tian et al., 2009).Optical methods allow direct measurement of presynaptic phe-nomena, which most electrophysiological techniques assess eitherindirectly or in a subset of specialized synapses such as the Calyxof Held (Von Gersdorff and Matthews, 1999; Schneggenburgeret al., 2002). For optical measurements of neural activity, bothgenetically encoded fluorescent indicators and small molecule-based reporters have emerged. Genetically encoded fluorescentproteins can be targeted to specific neuronal populations, offering
an advantage over small molecule reporters such as Ca2+ sensitivedyes or the styryl amphipathic FM dyes that label recycling synap-tic vesicles (Betz and Bewick, 1993; Dreosti and Lagnado, 2011).Further, fusions with proteins of interest provide a means to tar-get fluorescent reporters to specific subcellular regions (Shaneret al., 2008). For example, fusion of the genetically encoded cal-cium indicator (GECI) GCaMP2 to synaptophysin localizes it tosynaptic vesicles, providing a reliable sensor of calcium transientsin the presynaptic terminal (Dreosti et al., 2009). An improvedGECI, GCaMP3, offers an opportunity to develop a presynapti-cally localized calcium indicator with a higher signal to noise ratioand increased dynamic range (Tian et al., 2009).
Targeting the genetically encoded ecliptic pHluorins to theluminal domains of synaptic vesicle proteins has provided apowerful method to measure synaptic vesicle recycling. EclipticpHluorins are green fluorescent protein (GFP) derivatives thatare shifted in their pH sensitivity such that their fluorescence isquenched at the low pH of synaptic vesicles. Exocytosis of synapticvesicles relieves this quenching, and endocytosis and subsequent
Frontiers in Molecular Neuroscience www.frontiersin.org November 2011 | Volume 4 | Article 34 | 1
Li et al. Two color presynaptic imaging
reacidification result in decreases in fluorescence. The rates of flu-orescence change thus measure exo- and endocytosis (Miesenböcket al., 1998; Sankaranarayanan and Ryan, 2000; Voglmaier et al.,2006). We wanted to investigate the dependence of synaptic vesi-cle recycling on Ca2+ dynamics by coexpression of a reporter ofsynaptic vesicle recycling along with GCaMP3. However, sinceGCaMPs are also derived from GFP, signals from pHluorin andGCaMP fusions cannot easily be distinguished. The developmentof a photostable, pH-sensitive fluorescent protein emitting a dif-ferent color of light, mOrange2 (mOr2), opens the possibility ofimaging synaptic vesicle dynamics, and changes in presynapticCa2+ concentrations in the same synapses (Shaner et al., 2008).The red-shifted mOr2 protein was derived from DsRed from Dis-coma sp., but differs in its pK a. Like pHluorin, the fluorescenceof mOr2 is quenched by the low pH of synaptic vesicles (pH 5.5),and quenching is relieved at neutral pH.
Fusions of super-ecliptic pHluorin with the synaptic vesi-cle proteins synaptobrevin, synaptophysin, synaptotagmin, SV2,and the vesicular glutamate transporter VGLUT1 have all beenused to measure synaptic vesicle recycling (Miesenböck et al.,1998; Sankaranarayanan and Ryan, 2000; Granseth et al., 2006;Voglmaier et al., 2006; Kwon and Chapman, 2011). A fusion ofVGLUT1 with super-ecliptic pHluorin (VGLUT1-pH) exhibits ahigh signal to noise ratio, likely because very little endogenous ortagged VGLUT1 is expressed on the plasma membrane or out-side the presynaptic compartment (Voglmaier et al., 2006; Balajiand Ryan, 2007; Zhu et al., 2009). Therefore, we fused mOr2 toVGLUT1 to create an accurate reporter of synaptic vesicle recy-cling. Engineering two molecules of mOr2 in tandem in an intralu-minal loop of VGLUT1 optimizes the signal to noise ratio. We alsogenerated an improved presynaptic GECI by fusing GCaMP3 tosynaptophysin to create SyGCaMP3. Both reporters are expressedin the presynaptic terminal in transfected neurons. Monitoringchanges in green and red fluorescence in neurons coexpressingthe two reporters provides an optical readout of the spatial andtemporal properties of calcium triggered synaptic vesicle recycling.
MATERIALS AND METHODSREAGENTSBafilomycin, ω-conotoxin GVIA, and ionomycin were obtainedfrom Calibochem (San Diego, CA, USA). CPP, CNQX, and ω-agatoxin TK were purchased from Tocris (Ellisville, MO, USA).FM4-64 was obtained from Biotium (Hayward, CA, USA). Allother chemicals were from Sigma-Aldrich (St. Louis, MO, USA).All cell culture reagents were from Invitrogen (Carlsbad, CA, USA)unless otherwise noted. Conotoxin was resuspended in DMSOat 1 mM and ω-agatoxin TK was resuspended in the recordingmedium at 1.2 μM, before dilution to final concentrations.
MOLECULAR BIOLOGYVGLUT1-mOr2 fusions were constructed by inserting the mOr2cDNA, flanked with linkers, between Val-103 and Val-104 ofrat VGLUT1, the same site containing pHluorin in VGLUT1-pH. Overlap extension PCR mutagenesis was used to flankmOrange2 with a 5′ linker (SGSTSGGSGGTGG) and 3′ linker(SGGTGGSGGTGGSGGTG). For VGLUT1-2xmOr2, we insertedtwo copies of the mOr2 using PCR to insert a linker sequence
(SGTSTGGSGGTGG) between the two mOr2 molecules. Over-lap extension PCR was used to generate SyGCaMP3 by fusionof GCaMP3 (gift of Loren Looger, HHMI, Addgene plasmid22692) to the C-terminus of rat synaptophysin, with short linkersequences (GGS or GGSGGT). Constructs with both linkersequences gave similar results; experiments presented here use theSyGCaMP3 fusion with the six amino acid linker. All cDNAs weresubcloned into pCAGGS for expression under the control of amodified chicken actin promoter.
PRIMARY HIPPOCAMPAL CULTURE, TRANSFECTION, ANDIMMUNOFLUORESCENCEHippocampi from embryonic day 19–20 rats were dissected anddissociated as previously described (Li et al., 2005a). Neuronswere transfected using the Basic Neuron SCN Nucleofector kit,according to manufacturer’s instructions (Lonza, Walkersville,MD, USA). Neurons transfected by nucleofection express similar,moderate levels of protein (Li et al., 2005a). Cells were sub-sequently maintained in Neurobasal media supplemented with1% heat inactivated fetal bovine serum (FBS), 10% NeuroMixgrowth supplement (PAA, Dartmouth, MA, USA), 2 mM Gluta-Max, 15 mM NaCl, and 10 μg/ml primocin (Lonza) and imagedat 14–21 days in vitro (DIV). 5-fluoro-2′-deoxyuridine (10 μMfinal concentration) was added at DIV3–5 as a mitotic inhibitor tocontrol glial growth. All work with animals was conducted underthe supervision and guidance of the Institutional Care and UseCommittee of the University of California, San Francisco.
For immunostaining, cells were fixed in 4% PFA for 5 min, thenin cold methanol for 5 min at −20˚C, permeabilized, and blockedin phosphate-buffered saline (PBS) containing 0.02% saponin/1%fish gelatin/5% BSA, and then stained with rabbit anti-VGLUT1(gift of R. Edwards, University of California, San Francisco), rab-bit anti-synaptophysin (Invitrogen, Carlsbad, CA, USA), or mouseanti-SV2 (gift of R. Kelly, University of California, San Francisco)followed by appropriate secondary antibodies conjugated to FITC,Cy3, or Cy5 (Jackson ImmunoResearch, West Grove, PA, USA).Cells were imaged using confocal laser microscopy (Zeiss LSM510).
LIVE CELL IMAGINGCoverslips with transfected hippocampal neurons were mountedin a rapid switching, laminar-flow perfusion, and stimulationchamber (Warner Instruments, Holliston, MA, USA) on aninverted epifluorescence microscope (Nikon, Melville, NY, USA)and imaged at room temperature using a 63× oil objective(NA = 1.4). Cells were imaged in modified Tyrode’s solutionpH 7.4 (in mM: 119 NaCl, 10 HEPES-NaOH, 30 glucose, 2.5KCl, 2 CaCl2, 2 MgCl2) containing 10 μM each of the gluta-mate receptor antagonists 6-cyano-7 nitroquinoxaline-2,3-dione(CNQX) and 3-(2-carboxypiperazin-4-yl)propyl-1-phosphonicacid (CPP). Electrical stimulation to elicit action potentials(Gandhi and Stevens, 2003; Zhao et al., 2011) was applied usingan A310 Accupulser (WPI, Sarasota, FL, USA) at 10–80 Hz with1 ms bipolar current pulses through platinum-iridium electrodes,to yield fields of 5–10 V/cm across the chamber (Voglmaier et al.,2006). Cells were illuminated using a Xenon lamp (Sutter Instru-ments, Novato, CA, USA) with either a 470/40-nm excitation and
Frontiers in Molecular Neuroscience www.frontiersin.org November 2011 | Volume 4 | Article 34 | 2
Li et al. Two color presynaptic imaging
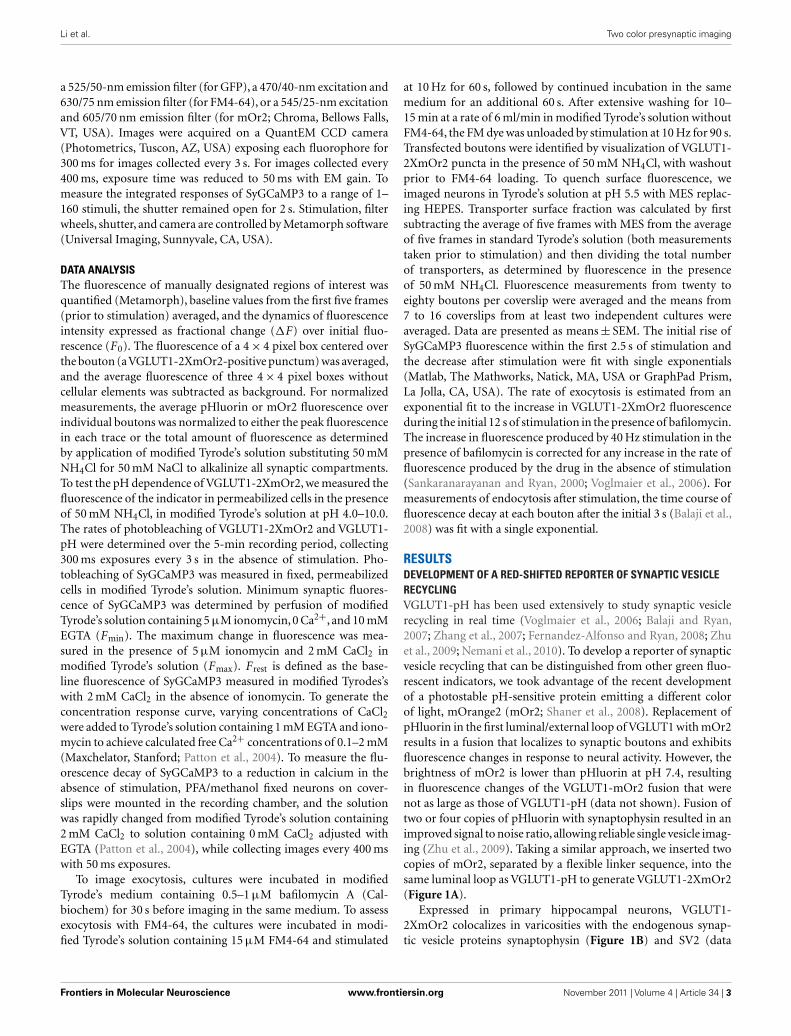
a 525/50-nm emission filter (for GFP), a 470/40-nm excitation and630/75 nm emission filter (for FM4-64), or a 545/25-nm excitationand 605/70 nm emission filter (for mOr2; Chroma, Bellows Falls,VT, USA). Images were acquired on a QuantEM CCD camera(Photometrics, Tuscon, AZ, USA) exposing each fluorophore for300 ms for images collected every 3 s. For images collected every400 ms, exposure time was reduced to 50 ms with EM gain. Tomeasure the integrated responses of SyGCaMP3 to a range of 1–160 stimuli, the shutter remained open for 2 s. Stimulation, filterwheels, shutter, and camera are controlled by Metamorph software(Universal Imaging, Sunnyvale, CA, USA).
DATA ANALYSISThe fluorescence of manually designated regions of interest wasquantified (Metamorph), baseline values from the first five frames(prior to stimulation) averaged, and the dynamics of fluorescenceintensity expressed as fractional change (ΔF) over initial fluo-rescence (F 0). The fluorescence of a 4 × 4 pixel box centered overthe bouton (aVGLUT1-2XmOr2-positive punctum) was averaged,and the average fluorescence of three 4 × 4 pixel boxes withoutcellular elements was subtracted as background. For normalizedmeasurements, the average pHluorin or mOr2 fluorescence overindividual boutons was normalized to either the peak fluorescencein each trace or the total amount of fluorescence as determinedby application of modified Tyrode’s solution substituting 50 mMNH4Cl for 50 mM NaCl to alkalinize all synaptic compartments.To test the pH dependence of VGLUT1-2XmOr2, we measured thefluorescence of the indicator in permeabilized cells in the presenceof 50 mM NH4Cl, in modified Tyrode’s solution at pH 4.0–10.0.The rates of photobleaching of VGLUT1-2XmOr2 and VGLUT1-pH were determined over the 5-min recording period, collecting300 ms exposures every 3 s in the absence of stimulation. Pho-tobleaching of SyGCaMP3 was measured in fixed, permeabilizedcells in modified Tyrode’s solution. Minimum synaptic fluores-cence of SyGCaMP3 was determined by perfusion of modifiedTyrode’s solution containing 5 μM ionomycin, 0 Ca2+, and 10 mMEGTA (F min). The maximum change in fluorescence was mea-sured in the presence of 5 μM ionomycin and 2 mM CaCl2 inmodified Tyrode’s solution (F max). F rest is defined as the base-line fluorescence of SyGCaMP3 measured in modified Tyrodes’swith 2 mM CaCl2 in the absence of ionomycin. To generate theconcentration response curve, varying concentrations of CaCl2were added to Tyrode’s solution containing 1 mM EGTA and iono-mycin to achieve calculated free Ca2+ concentrations of 0.1–2 mM(Maxchelator, Stanford; Patton et al., 2004). To measure the flu-orescence decay of SyGCaMP3 to a reduction in calcium in theabsence of stimulation, PFA/methanol fixed neurons on cover-slips were mounted in the recording chamber, and the solutionwas rapidly changed from modified Tyrode’s solution containing2 mM CaCl2 to solution containing 0 mM CaCl2 adjusted withEGTA (Patton et al., 2004), while collecting images every 400 mswith 50 ms exposures.
To image exocytosis, cultures were incubated in modifiedTyrode’s medium containing 0.5–1 μM bafilomycin A (Cal-biochem) for 30 s before imaging in the same medium. To assessexocytosis with FM4-64, the cultures were incubated in modi-fied Tyrode’s solution containing 15 μM FM4-64 and stimulated
at 10 Hz for 60 s, followed by continued incubation in the samemedium for an additional 60 s. After extensive washing for 10–15 min at a rate of 6 ml/min in modified Tyrode’s solution withoutFM4-64, the FM dye was unloaded by stimulation at 10 Hz for 90 s.Transfected boutons were identified by visualization of VGLUT1-2XmOr2 puncta in the presence of 50 mM NH4Cl, with washoutprior to FM4-64 loading. To quench surface fluorescence, weimaged neurons in Tyrode’s solution at pH 5.5 with MES replac-ing HEPES. Transporter surface fraction was calculated by firstsubtracting the average of five frames with MES from the averageof five frames in standard Tyrode’s solution (both measurementstaken prior to stimulation) and then dividing the total numberof transporters, as determined by fluorescence in the presenceof 50 mM NH4Cl. Fluorescence measurements from twenty toeighty boutons per coverslip were averaged and the means from7 to 16 coverslips from at least two independent cultures wereaveraged. Data are presented as means ± SEM. The initial rise ofSyGCaMP3 fluorescence within the first 2.5 s of stimulation andthe decrease after stimulation were fit with single exponentials(Matlab, The Mathworks, Natick, MA, USA or GraphPad Prism,La Jolla, CA, USA). The rate of exocytosis is estimated from anexponential fit to the increase in VGLUT1-2XmOr2 fluorescenceduring the initial 12 s of stimulation in the presence of bafilomycin.The increase in fluorescence produced by 40 Hz stimulation in thepresence of bafilomycin is corrected for any increase in the rate offluorescence produced by the drug in the absence of stimulation(Sankaranarayanan and Ryan, 2000; Voglmaier et al., 2006). Formeasurements of endocytosis after stimulation, the time course offluorescence decay at each bouton after the initial 3 s (Balaji et al.,2008) was fit with a single exponential.
RESULTSDEVELOPMENT OF A RED-SHIFTED REPORTER OF SYNAPTIC VESICLERECYCLINGVGLUT1-pH has been used extensively to study synaptic vesiclerecycling in real time (Voglmaier et al., 2006; Balaji and Ryan,2007; Zhang et al., 2007; Fernandez-Alfonso and Ryan, 2008; Zhuet al., 2009; Nemani et al., 2010). To develop a reporter of synapticvesicle recycling that can be distinguished from other green fluo-rescent indicators, we took advantage of the recent developmentof a photostable pH-sensitive protein emitting a different colorof light, mOrange2 (mOr2; Shaner et al., 2008). Replacement ofpHluorin in the first luminal/external loop of VGLUT1 with mOr2results in a fusion that localizes to synaptic boutons and exhibitsfluorescence changes in response to neural activity. However, thebrightness of mOr2 is lower than pHluorin at pH 7.4, resultingin fluorescence changes of the VGLUT1-mOr2 fusion that werenot as large as those of VGLUT1-pH (data not shown). Fusion oftwo or four copies of pHluorin with synaptophysin resulted in animproved signal to noise ratio, allowing reliable single vesicle imag-ing (Zhu et al., 2009). Taking a similar approach, we inserted twocopies of mOr2, separated by a flexible linker sequence, into thesame luminal loop as VGLUT1-pH to generate VGLUT1-2XmOr2(Figure 1A).
Expressed in primary hippocampal neurons, VGLUT1-2XmOr2 colocalizes in varicosities with the endogenous synap-tic vesicle proteins synaptophysin (Figure 1B) and SV2 (data
Frontiers in Molecular Neuroscience www.frontiersin.org November 2011 | Volume 4 | Article 34 | 3
Li et al. Two color presynaptic imaging
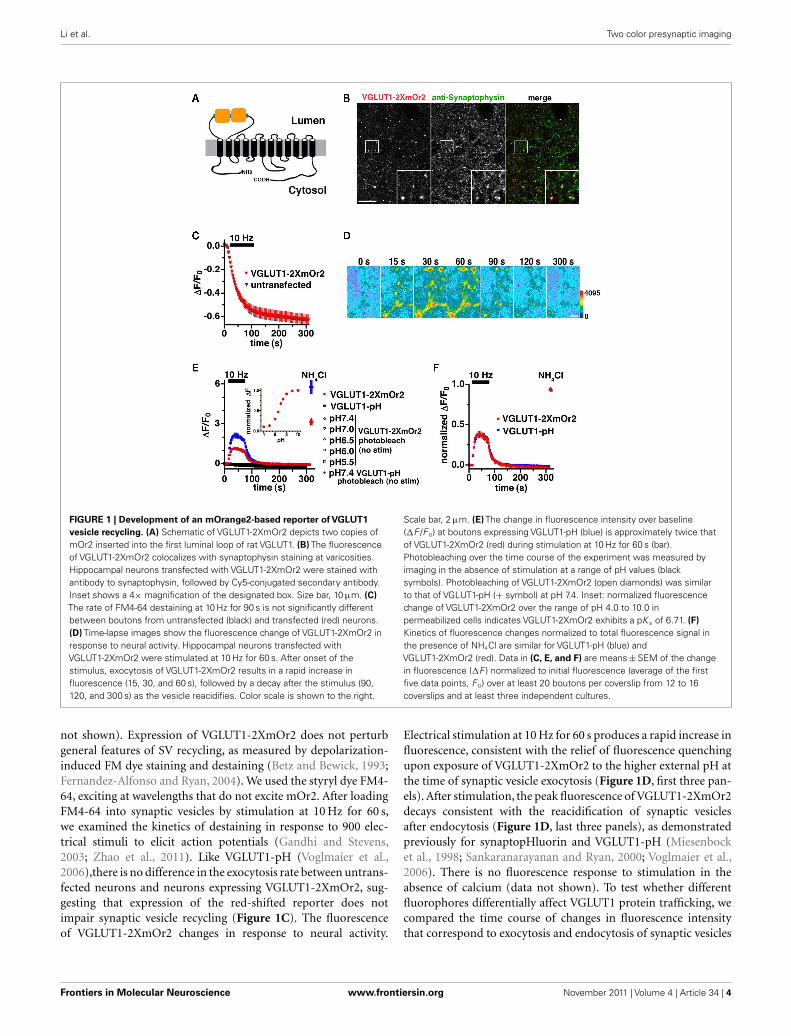
FIGURE 1 | Development of an mOrange2-based reporter of VGLUT1
vesicle recycling. (A) Schematic of VGLUT1-2XmOr2 depicts two copies ofmOr2 inserted into the first luminal loop of rat VGLUT1. (B) The fluorescenceof VGLUT1-2XmOr2 colocalizes with synaptophysin staining at varicosities.Hippocampal neurons transfected with VGLUT1-2XmOr2 were stained withantibody to synaptophysin, followed by Cy5-conjugated secondary antibody.Inset shows a 4× magnification of the designated box. Size bar, 10 μm. (C)
The rate of FM4-64 destaining at 10 Hz for 90 s is not significantly differentbetween boutons from untransfected (black) and transfected (red) neurons.(D) Time-lapse images show the fluorescence change of VGLUT1-2XmOr2 inresponse to neural activity. Hippocampal neurons transfected withVGLUT1-2XmOr2 were stimulated at 10 Hz for 60 s. After onset of thestimulus, exocytosis of VGLUT1-2XmOr2 results in a rapid increase influorescence (15, 30, and 60 s), followed by a decay after the stimulus (90,120, and 300 s) as the vesicle reacidifies. Color scale is shown to the right.
Scale bar, 2 μm. (E) The change in fluorescence intensity over baseline(ΔF /F 0) at boutons expressing VGLUT1-pH (blue) is approximately twice thatof VGLUT1-2XmOr2 (red) during stimulation at 10 Hz for 60 s (bar).Photobleaching over the time course of the experiment was measured byimaging in the absence of stimulation at a range of pH values (blacksymbols). Photobleaching of VGLUT1-2XmOr2 (open diamonds) was similarto that of VGLUT1-pH (+ symbol) at pH 7.4. Inset: normalized fluorescencechange of VGLUT1-2XmOr2 over the range of pH 4.0 to 10.0 inpermeabilized cells indicates VGLUT1-2XmOr2 exhibits a pK a of 6.71. (F)
Kinetics of fluorescence changes normalized to total fluorescence signal inthe presence of NH4Cl are similar for VGLUT1-pH (blue) andVGLUT1-2XmOr2 (red). Data in (C, E, and F) are means ± SEM of the changein fluorescence (ΔF ) normalized to initial fluorescence (average of the firstfive data points, F 0) over at least 20 boutons per coverslip from 12 to 16coverslips and at least three independent cultures.
not shown). Expression of VGLUT1-2XmOr2 does not perturbgeneral features of SV recycling, as measured by depolarization-induced FM dye staining and destaining (Betz and Bewick, 1993;Fernandez-Alfonso and Ryan, 2004). We used the styryl dye FM4-64, exciting at wavelengths that do not excite mOr2. After loadingFM4-64 into synaptic vesicles by stimulation at 10 Hz for 60 s,we examined the kinetics of destaining in response to 900 elec-trical stimuli to elicit action potentials (Gandhi and Stevens,2003; Zhao et al., 2011). Like VGLUT1-pH (Voglmaier et al.,2006),there is no difference in the exocytosis rate between untrans-fected neurons and neurons expressing VGLUT1-2XmOr2, sug-gesting that expression of the red-shifted reporter does notimpair synaptic vesicle recycling (Figure 1C). The fluorescenceof VGLUT1-2XmOr2 changes in response to neural activity.
Electrical stimulation at 10 Hz for 60 s produces a rapid increase influorescence, consistent with the relief of fluorescence quenchingupon exposure of VGLUT1-2XmOr2 to the higher external pH atthe time of synaptic vesicle exocytosis (Figure 1D, first three pan-els). After stimulation, the peak fluorescence of VGLUT1-2XmOr2decays consistent with the reacidification of synaptic vesiclesafter endocytosis (Figure 1D, last three panels), as demonstratedpreviously for synaptopHluorin and VGLUT1-pH (Miesenbocket al., 1998; Sankaranarayanan and Ryan, 2000; Voglmaier et al.,2006). There is no fluorescence response to stimulation in theabsence of calcium (data not shown). To test whether differentfluorophores differentially affect VGLUT1 protein trafficking, wecompared the time course of changes in fluorescence intensitythat correspond to exocytosis and endocytosis of synaptic vesicles
Frontiers in Molecular Neuroscience www.frontiersin.org November 2011 | Volume 4 | Article 34 | 4
Li et al. Two color presynaptic imaging
labeled with VGLUT1-pH and VGLUT1-2XmOr2 during and afterstimulation at 10 Hz for 60 s (Figures 1E,F). The peak fluorescencechange over baseline of VGLUT1-2XmOr2 (ΔF /F 0 = 1.16 ± 0.10)is approximately half that of VGLUT1-pH (ΔF /F 0 = 2.13 ± 0.20,Figure 1E). Normalized to the total fluorescence signal measuredin the presence of 50 mM NH4Cl, the time course of averagefluorescence changes is similar for VGLUT1-pH and VGLUT1-2XmOr2 (Figure 1F). There are no significant differences inthe kinetics of fluorescence response between VGLUT1-pH andVGLUT1-2XmOr2 (Figure 1F). There is also no significant dif-ference in cell surface expression of VGLUT1-pH or VGLUT1-2XmOr2, either before or after stimulation (data not shown). Pho-tobleaching over the course of the experiment is minimal for bothVGLUT1-2XmOr2 (5.40 × 10⁻⁴ ± 6.91 × 10⁻⁶ au/s illuminationat pH 7.4) and VGLUT1-pH (4.51 × 10⁻⁴ ± 6.37 × 10⁻⁶ au/s atpH 7.4, Figure 1E). Photobleaching of VGLUT1-2XmOr2 was alsominimal at all pH values tested (4.66 × 10⁻⁴ ± 1.10 × 10⁻⁵ au/s atpH 7.0; 5.25 × 10⁻⁴ ± 1.26 × 10⁻⁵ au/s at pH 6.5; 7.30 × 10⁻⁴ ±1.84 × 10⁻⁵ au/s at pH 6.0; 7.09 × 10⁻⁴ ± 2.52 × 10⁻⁵ fau/s at pH5.5, Figure 1E). The indicator exhibits pH dependence and adynamic range of up to 3.5-fold over the physiological range of pH5.5 to pH 7.4 (Figure 1E, inset). VGLUT1-2XmOr2 exhibits a pK a
of 6.71, slightly higher than the value measured for mOr2 (Shaneret al., 2008). Together, these data suggest that VGLUT1-2XmOr2,like VGLUT1-pH (Voglmaier et al., 2006) is a reliable reporter ofVGLUT1 trafficking.
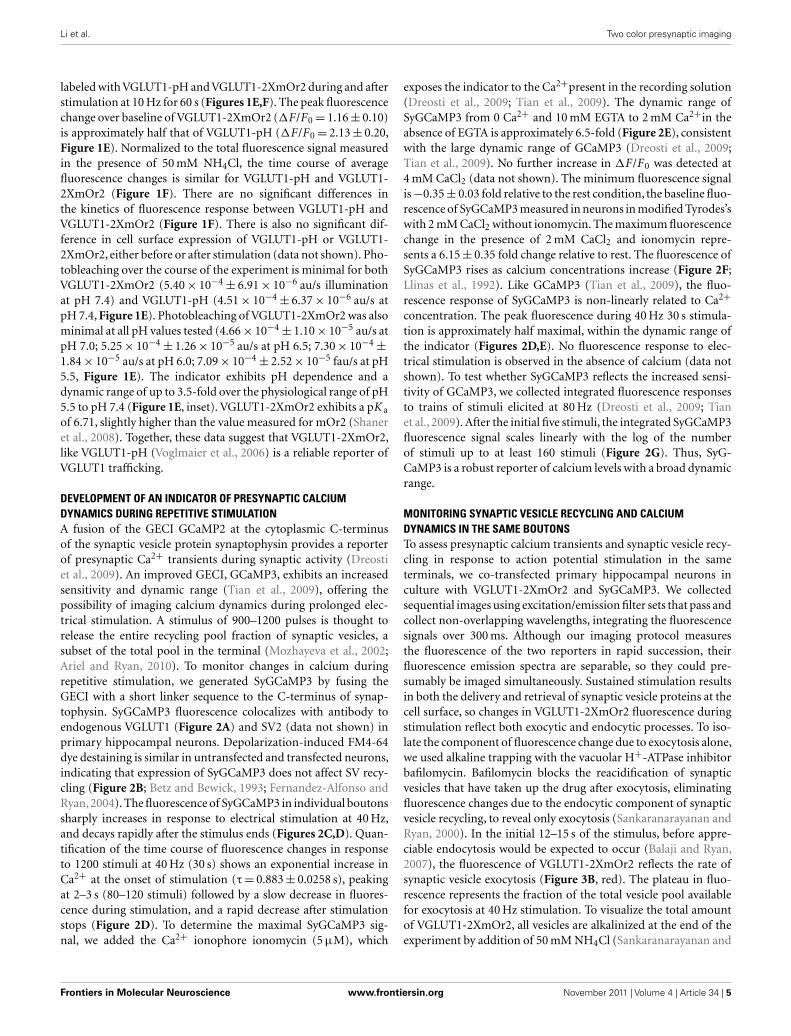
DEVELOPMENT OF AN INDICATOR OF PRESYNAPTIC CALCIUMDYNAMICS DURING REPETITIVE STIMULATIONA fusion of the GECI GCaMP2 at the cytoplasmic C-terminusof the synaptic vesicle protein synaptophysin provides a reporterof presynaptic Ca2+ transients during synaptic activity (Dreostiet al., 2009). An improved GECI, GCaMP3, exhibits an increasedsensitivity and dynamic range (Tian et al., 2009), offering thepossibility of imaging calcium dynamics during prolonged elec-trical stimulation. A stimulus of 900–1200 pulses is thought torelease the entire recycling pool fraction of synaptic vesicles, asubset of the total pool in the terminal (Mozhayeva et al., 2002;Ariel and Ryan, 2010). To monitor changes in calcium duringrepetitive stimulation, we generated SyGCaMP3 by fusing theGECI with a short linker sequence to the C-terminus of synap-tophysin. SyGCaMP3 fluorescence colocalizes with antibody toendogenous VGLUT1 (Figure 2A) and SV2 (data not shown) inprimary hippocampal neurons. Depolarization-induced FM4-64dye destaining is similar in untransfected and transfected neurons,indicating that expression of SyGCaMP3 does not affect SV recy-cling (Figure 2B; Betz and Bewick, 1993; Fernandez-Alfonso andRyan,2004). The fluorescence of SyGCaMP3 in individual boutonssharply increases in response to electrical stimulation at 40 Hz,and decays rapidly after the stimulus ends (Figures 2C,D). Quan-tification of the time course of fluorescence changes in responseto 1200 stimuli at 40 Hz (30 s) shows an exponential increase inCa2+ at the onset of stimulation (τ = 0.883 ± 0.0258 s), peakingat 2–3 s (80–120 stimuli) followed by a slow decrease in fluores-cence during stimulation, and a rapid decrease after stimulationstops (Figure 2D). To determine the maximal SyGCaMP3 sig-nal, we added the Ca2+ ionophore ionomycin (5 μM), which
exposes the indicator to the Ca2+present in the recording solution(Dreosti et al., 2009; Tian et al., 2009). The dynamic range ofSyGCaMP3 from 0 Ca2+ and 10 mM EGTA to 2 mM Ca2+in theabsence of EGTA is approximately 6.5-fold (Figure 2E), consistentwith the large dynamic range of GCaMP3 (Dreosti et al., 2009;Tian et al., 2009). No further increase in ΔF /F 0 was detected at4 mM CaCl2 (data not shown). The minimum fluorescence signalis −0.35 ± 0.03 fold relative to the rest condition, the baseline fluo-rescence of SyGCaMP3 measured in neurons in modified Tyrodes’swith 2 mM CaCl2 without ionomycin. The maximum fluorescencechange in the presence of 2 mM CaCl2 and ionomycin repre-sents a 6.15 ± 0.35 fold change relative to rest. The fluorescence ofSyGCaMP3 rises as calcium concentrations increase (Figure 2F;Llinas et al., 1992). Like GCaMP3 (Tian et al., 2009), the fluo-rescence response of SyGCaMP3 is non-linearly related to Ca2+concentration. The peak fluorescence during 40 Hz 30 s stimula-tion is approximately half maximal, within the dynamic range ofthe indicator (Figures 2D,E). No fluorescence response to elec-trical stimulation is observed in the absence of calcium (data notshown). To test whether SyGCaMP3 reflects the increased sensi-tivity of GCaMP3, we collected integrated fluorescence responsesto trains of stimuli elicited at 80 Hz (Dreosti et al., 2009; Tianet al., 2009). After the initial five stimuli, the integrated SyGCaMP3fluorescence signal scales linearly with the log of the numberof stimuli up to at least 160 stimuli (Figure 2G). Thus, SyG-CaMP3 is a robust reporter of calcium levels with a broad dynamicrange.
MONITORING SYNAPTIC VESICLE RECYCLING AND CALCIUMDYNAMICS IN THE SAME BOUTONSTo assess presynaptic calcium transients and synaptic vesicle recy-cling in response to action potential stimulation in the sameterminals, we co-transfected primary hippocampal neurons inculture with VGLUT1-2XmOr2 and SyGCaMP3. We collectedsequential images using excitation/emission filter sets that pass andcollect non-overlapping wavelengths, integrating the fluorescencesignals over 300 ms. Although our imaging protocol measuresthe fluorescence of the two reporters in rapid succession, theirfluorescence emission spectra are separable, so they could pre-sumably be imaged simultaneously. Sustained stimulation resultsin both the delivery and retrieval of synaptic vesicle proteins at thecell surface, so changes in VGLUT1-2XmOr2 fluorescence duringstimulation reflect both exocytic and endocytic processes. To iso-late the component of fluorescence change due to exocytosis alone,we used alkaline trapping with the vacuolar H+-ATPase inhibitorbafilomycin. Bafilomycin blocks the reacidification of synapticvesicles that have taken up the drug after exocytosis, eliminatingfluorescence changes due to the endocytic component of synapticvesicle recycling, to reveal only exocytosis (Sankaranarayanan andRyan, 2000). In the initial 12–15 s of the stimulus, before appre-ciable endocytosis would be expected to occur (Balaji and Ryan,2007), the fluorescence of VGLUT1-2XmOr2 reflects the rate ofsynaptic vesicle exocytosis (Figure 3B, red). The plateau in fluo-rescence represents the fraction of the total vesicle pool availablefor exocytosis at 40 Hz stimulation. To visualize the total amountof VGLUT1-2XmOr2, all vesicles are alkalinized at the end of theexperiment by addition of 50 mM NH4Cl (Sankaranarayanan and
Frontiers in Molecular Neuroscience www.frontiersin.org November 2011 | Volume 4 | Article 34 | 5
Li et al. Two color presynaptic imaging
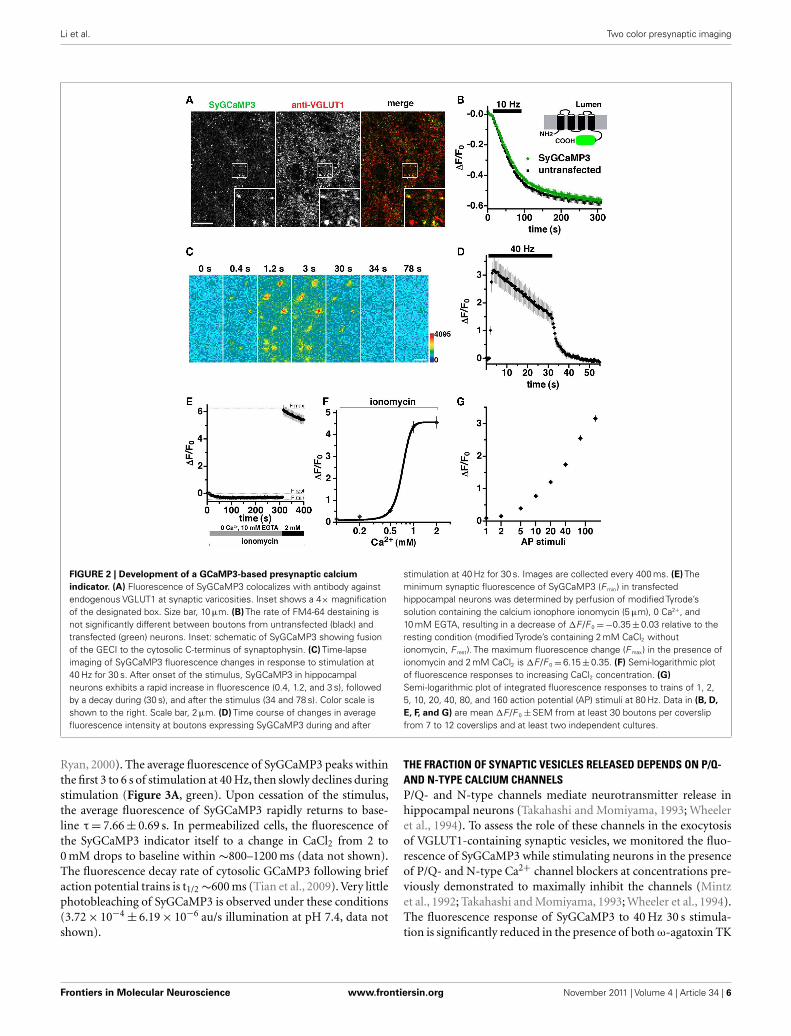
FIGURE 2 | Development of a GCaMP3-based presynaptic calcium
indicator. (A) Fluorescence of SyGCaMP3 colocalizes with antibody againstendogenous VGLUT1 at synaptic varicosities. Inset shows a 4× magnificationof the designated box. Size bar, 10 μm. (B) The rate of FM4-64 destaining isnot significantly different between boutons from untransfected (black) andtransfected (green) neurons. Inset: schematic of SyGCaMP3 showing fusionof the GECI to the cytosolic C-terminus of synaptophysin. (C) Time-lapseimaging of SyGCaMP3 fluorescence changes in response to stimulation at40 Hz for 30 s. After onset of the stimulus, SyGCaMP3 in hippocampalneurons exhibits a rapid increase in fluorescence (0.4, 1.2, and 3 s), followedby a decay during (30 s), and after the stimulus (34 and 78 s). Color scale isshown to the right. Scale bar, 2 μm. (D) Time course of changes in averagefluorescence intensity at boutons expressing SyGCaMP3 during and after
stimulation at 40 Hz for 30 s. Images are collected every 400 ms. (E) Theminimum synaptic fluorescence of SyGCaMP3 (F min) in transfectedhippocampal neurons was determined by perfusion of modified Tyrode’ssolution containing the calcium ionophore ionomycin (5 μm), 0 Ca2+, and10 mM EGTA, resulting in a decrease of ΔF /F 0 = −0.35 ± 0.03 relative to theresting condition (modified Tyrode’s containing 2 mM CaCl2 withoutionomycin, F rest). The maximum fluorescence change (F max) in the presence ofionomycin and 2 mM CaCl2 is ΔF /F 0 = 6.15 ± 0.35. (F) Semi-logarithmic plotof fluorescence responses to increasing CaCl2 concentration. (G)
Semi-logarithmic plot of integrated fluorescence responses to trains of 1, 2,5, 10, 20, 40, 80, and 160 action potential (AP) stimuli at 80 Hz. Data in (B, D,
E, F, and G) are mean ΔF /F 0 ± SEM from at least 30 boutons per coverslipfrom 7 to 12 coverslips and at least two independent cultures.
Ryan, 2000). The average fluorescence of SyGCaMP3 peaks withinthe first 3 to 6 s of stimulation at 40 Hz, then slowly declines duringstimulation (Figure 3A, green). Upon cessation of the stimulus,the average fluorescence of SyGCaMP3 rapidly returns to base-line τ = 7.66 ± 0.69 s. In permeabilized cells, the fluorescence ofthe SyGCaMP3 indicator itself to a change in CaCl2 from 2 to0 mM drops to baseline within ∼800–1200 ms (data not shown).The fluorescence decay rate of cytosolic GCaMP3 following briefaction potential trains is t1/2 ∼600 ms (Tian et al., 2009). Very littlephotobleaching of SyGCaMP3 is observed under these conditions(3.72 × 10⁻⁴ ± 6.19 × 10⁻⁶ au/s illumination at pH 7.4, data notshown).
THE FRACTION OF SYNAPTIC VESICLES RELEASED DEPENDS ON P/Q-AND N-TYPE CALCIUM CHANNELSP/Q- and N-type channels mediate neurotransmitter release inhippocampal neurons (Takahashi and Momiyama, 1993; Wheeleret al., 1994). To assess the role of these channels in the exocytosisof VGLUT1-containing synaptic vesicles, we monitored the fluo-rescence of SyGCaMP3 while stimulating neurons in the presenceof P/Q- and N-type Ca2+ channel blockers at concentrations pre-viously demonstrated to maximally inhibit the channels (Mintzet al., 1992; Takahashi and Momiyama, 1993; Wheeler et al., 1994).The fluorescence response of SyGCaMP3 to 40 Hz 30 s stimula-tion is significantly reduced in the presence of both ω-agatoxin TK
Frontiers in Molecular Neuroscience www.frontiersin.org November 2011 | Volume 4 | Article 34 | 6
Li et al. Two color presynaptic imaging
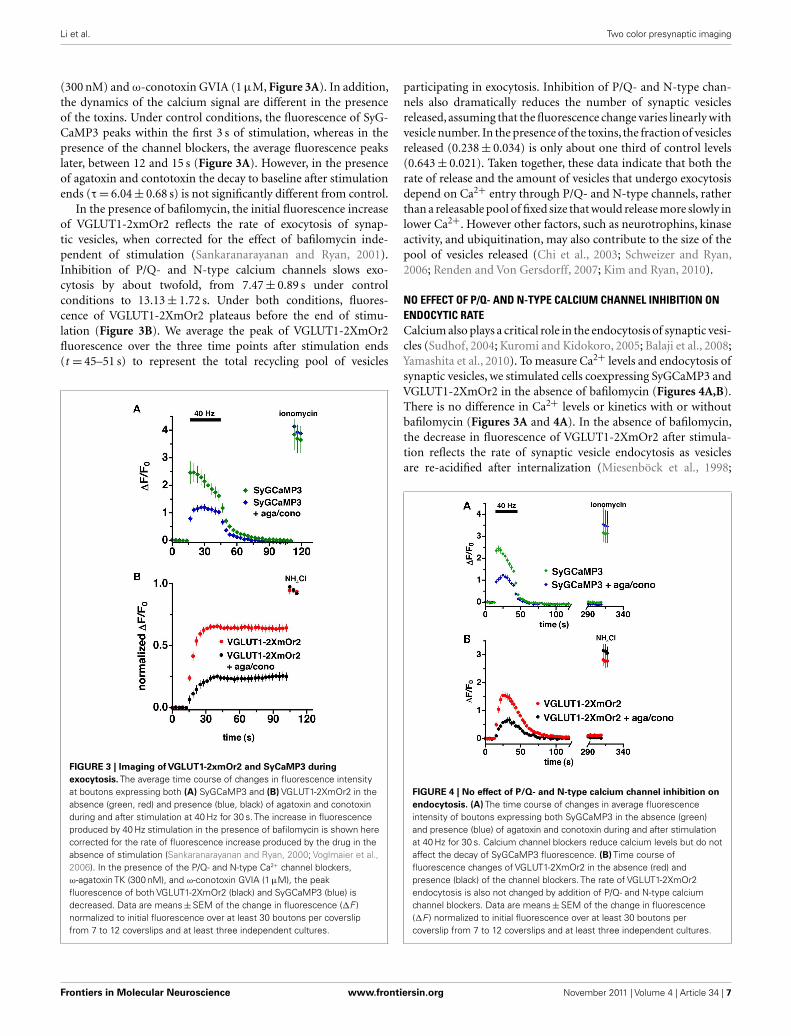
(300 nM) and ω-conotoxin GVIA (1 μM, Figure 3A). In addition,the dynamics of the calcium signal are different in the presenceof the toxins. Under control conditions, the fluorescence of SyG-CaMP3 peaks within the first 3 s of stimulation, whereas in thepresence of the channel blockers, the average fluorescence peakslater, between 12 and 15 s (Figure 3A). However, in the presenceof agatoxin and contotoxin the decay to baseline after stimulationends (τ = 6.04 ± 0.68 s) is not significantly different from control.
In the presence of bafilomycin, the initial fluorescence increaseof VGLUT1-2xmOr2 reflects the rate of exocytosis of synap-tic vesicles, when corrected for the effect of bafilomycin inde-pendent of stimulation (Sankaranarayanan and Ryan, 2001).Inhibition of P/Q- and N-type calcium channels slows exo-cytosis by about twofold, from 7.47 ± 0.89 s under controlconditions to 13.13 ± 1.72 s. Under both conditions, fluores-cence of VGLUT1-2XmOr2 plateaus before the end of stimu-lation (Figure 3B). We average the peak of VGLUT1-2XmOr2fluorescence over the three time points after stimulation ends(t = 45–51 s) to represent the total recycling pool of vesicles
FIGURE 3 | Imaging of VGLUT1-2xmOr2 and SyCaMP3 during
exocytosis. The average time course of changes in fluorescence intensityat boutons expressing both (A) SyGCaMP3 and (B) VGLUT1-2XmOr2 in theabsence (green, red) and presence (blue, black) of agatoxin and conotoxinduring and after stimulation at 40 Hz for 30 s. The increase in fluorescenceproduced by 40 Hz stimulation in the presence of bafilomycin is shown herecorrected for the rate of fluorescence increase produced by the drug in theabsence of stimulation (Sankaranarayanan and Ryan, 2000; Voglmaier et al.,2006). In the presence of the P/Q- and N-type Ca2+ channel blockers,ω-agatoxin TK (300 nM), and ω-conotoxin GVIA (1 μM), the peakfluorescence of both VGLUT1-2XmOr2 (black) and SyGCaMP3 (blue) isdecreased. Data are means ± SEM of the change in fluorescence (ΔF )normalized to initial fluorescence over at least 30 boutons per coverslipfrom 7 to 12 coverslips and at least three independent cultures.
participating in exocytosis. Inhibition of P/Q- and N-type chan-nels also dramatically reduces the number of synaptic vesiclesreleased, assuming that the fluorescence change varies linearly withvesicle number. In the presence of the toxins, the fraction of vesiclesreleased (0.238 ± 0.034) is only about one third of control levels(0.643 ± 0.021). Taken together, these data indicate that both therate of release and the amount of vesicles that undergo exocytosisdepend on Ca2+ entry through P/Q- and N-type channels, ratherthan a releasable pool of fixed size that would release more slowly inlower Ca2+. However other factors, such as neurotrophins, kinaseactivity, and ubiquitination, may also contribute to the size of thepool of vesicles released (Chi et al., 2003; Schweizer and Ryan,2006; Renden and Von Gersdorff, 2007; Kim and Ryan, 2010).
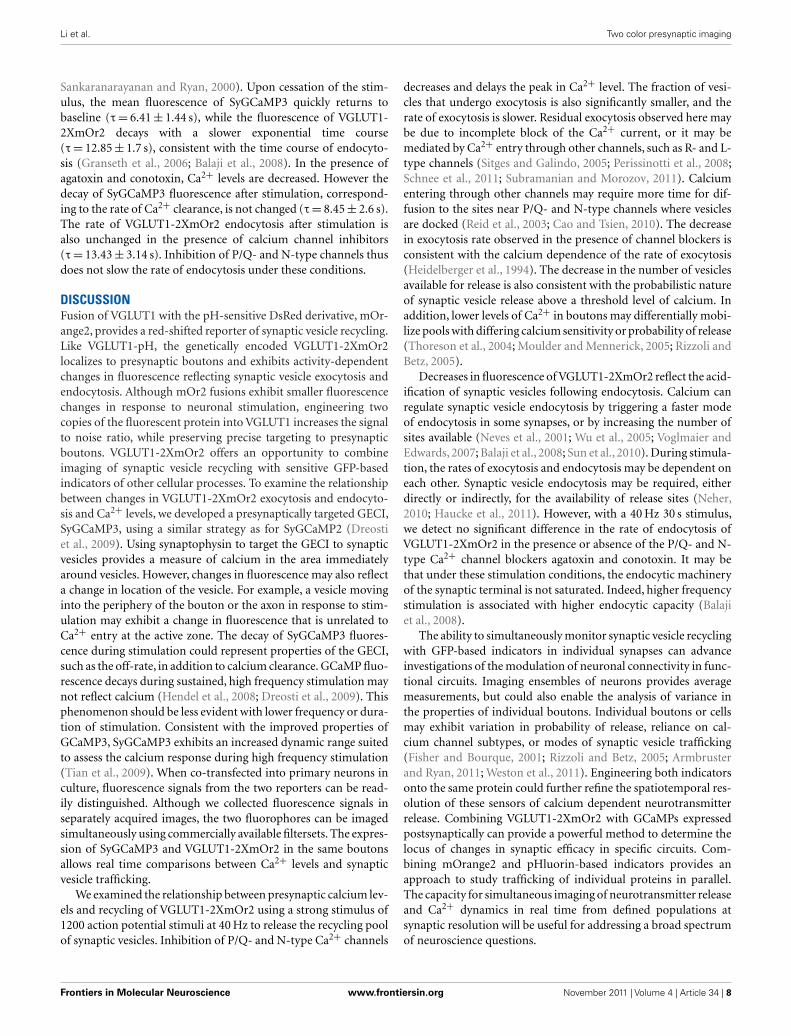
NO EFFECT OF P/Q- AND N-TYPE CALCIUM CHANNEL INHIBITION ONENDOCYTIC RATECalcium also plays a critical role in the endocytosis of synaptic vesi-cles (Sudhof, 2004; Kuromi and Kidokoro, 2005; Balaji et al., 2008;Yamashita et al., 2010). To measure Ca2+ levels and endocytosis ofsynaptic vesicles, we stimulated cells coexpressing SyGCaMP3 andVGLUT1-2XmOr2 in the absence of bafilomycin (Figures 4A,B).There is no difference in Ca2+ levels or kinetics with or withoutbafilomycin (Figures 3A and 4A). In the absence of bafilomycin,the decrease in fluorescence of VGLUT1-2XmOr2 after stimula-tion reflects the rate of synaptic vesicle endocytosis as vesiclesare re-acidified after internalization (Miesenböck et al., 1998;
FIGURE 4 | No effect of P/Q- and N-type calcium channel inhibition on
endocytosis. (A) The time course of changes in average fluorescenceintensity of boutons expressing both SyGCaMP3 in the absence (green)and presence (blue) of agatoxin and conotoxin during and after stimulationat 40 Hz for 30 s. Calcium channel blockers reduce calcium levels but do notaffect the decay of SyGCaMP3 fluorescence. (B) Time course offluorescence changes of VGLUT1-2XmOr2 in the absence (red) andpresence (black) of the channel blockers. The rate of VGLUT1-2XmOr2endocytosis is also not changed by addition of P/Q- and N-type calciumchannel blockers. Data are means ± SEM of the change in fluorescence(ΔF ) normalized to initial fluorescence over at least 30 boutons percoverslip from 7 to 12 coverslips and at least three independent cultures.
Frontiers in Molecular Neuroscience www.frontiersin.org November 2011 | Volume 4 | Article 34 | 7
Li et al. Two color presynaptic imaging
Sankaranarayanan and Ryan, 2000). Upon cessation of the stim-ulus, the mean fluorescence of SyGCaMP3 quickly returns tobaseline (τ = 6.41 ± 1.44 s), while the fluorescence of VGLUT1-2XmOr2 decays with a slower exponential time course(τ = 12.85 ± 1.7 s), consistent with the time course of endocyto-sis (Granseth et al., 2006; Balaji et al., 2008). In the presence ofagatoxin and conotoxin, Ca2+ levels are decreased. However thedecay of SyGCaMP3 fluorescence after stimulation, correspond-ing to the rate of Ca2+ clearance, is not changed (τ = 8.45 ± 2.6 s).The rate of VGLUT1-2XmOr2 endocytosis after stimulation isalso unchanged in the presence of calcium channel inhibitors(τ = 13.43 ± 3.14 s). Inhibition of P/Q- and N-type channels thusdoes not slow the rate of endocytosis under these conditions.
DISCUSSIONFusion of VGLUT1 with the pH-sensitive DsRed derivative, mOr-ange2, provides a red-shifted reporter of synaptic vesicle recycling.Like VGLUT1-pH, the genetically encoded VGLUT1-2XmOr2localizes to presynaptic boutons and exhibits activity-dependentchanges in fluorescence reflecting synaptic vesicle exocytosis andendocytosis. Although mOr2 fusions exhibit smaller fluorescencechanges in response to neuronal stimulation, engineering twocopies of the fluorescent protein into VGLUT1 increases the signalto noise ratio, while preserving precise targeting to presynapticboutons. VGLUT1-2XmOr2 offers an opportunity to combineimaging of synaptic vesicle recycling with sensitive GFP-basedindicators of other cellular processes. To examine the relationshipbetween changes in VGLUT1-2XmOr2 exocytosis and endocyto-sis and Ca2+ levels, we developed a presynaptically targeted GECI,SyGCaMP3, using a similar strategy as for SyGCaMP2 (Dreostiet al., 2009). Using synaptophysin to target the GECI to synapticvesicles provides a measure of calcium in the area immediatelyaround vesicles. However, changes in fluorescence may also reflecta change in location of the vesicle. For example, a vesicle movinginto the periphery of the bouton or the axon in response to stim-ulation may exhibit a change in fluorescence that is unrelated toCa2+ entry at the active zone. The decay of SyGCaMP3 fluores-cence during stimulation could represent properties of the GECI,such as the off-rate, in addition to calcium clearance. GCaMP fluo-rescence decays during sustained, high frequency stimulation maynot reflect calcium (Hendel et al., 2008; Dreosti et al., 2009). Thisphenomenon should be less evident with lower frequency or dura-tion of stimulation. Consistent with the improved properties ofGCaMP3, SyGCaMP3 exhibits an increased dynamic range suitedto assess the calcium response during high frequency stimulation(Tian et al., 2009). When co-transfected into primary neurons inculture, fluorescence signals from the two reporters can be read-ily distinguished. Although we collected fluorescence signals inseparately acquired images, the two fluorophores can be imagedsimultaneously using commercially available filtersets. The expres-sion of SyGCaMP3 and VGLUT1-2XmOr2 in the same boutonsallows real time comparisons between Ca2+ levels and synapticvesicle trafficking.
We examined the relationship between presynaptic calcium lev-els and recycling of VGLUT1-2XmOr2 using a strong stimulus of1200 action potential stimuli at 40 Hz to release the recycling poolof synaptic vesicles. Inhibition of P/Q- and N-type Ca2+ channels
decreases and delays the peak in Ca2+ level. The fraction of vesi-cles that undergo exocytosis is also significantly smaller, and therate of exocytosis is slower. Residual exocytosis observed here maybe due to incomplete block of the Ca2+ current, or it may bemediated by Ca2+ entry through other channels, such as R- and L-type channels (Sitges and Galindo, 2005; Perissinotti et al., 2008;Schnee et al., 2011; Subramanian and Morozov, 2011). Calciumentering through other channels may require more time for dif-fusion to the sites near P/Q- and N-type channels where vesiclesare docked (Reid et al., 2003; Cao and Tsien, 2010). The decreasein exocytosis rate observed in the presence of channel blockers isconsistent with the calcium dependence of the rate of exocytosis(Heidelberger et al., 1994). The decrease in the number of vesiclesavailable for release is also consistent with the probabilistic natureof synaptic vesicle release above a threshold level of calcium. Inaddition, lower levels of Ca2+ in boutons may differentially mobi-lize pools with differing calcium sensitivity or probability of release(Thoreson et al., 2004; Moulder and Mennerick, 2005; Rizzoli andBetz, 2005).
Decreases in fluorescence of VGLUT1-2XmOr2 reflect the acid-ification of synaptic vesicles following endocytosis. Calcium canregulate synaptic vesicle endocytosis by triggering a faster modeof endocytosis in some synapses, or by increasing the number ofsites available (Neves et al., 2001; Wu et al., 2005; Voglmaier andEdwards, 2007; Balaji et al., 2008; Sun et al., 2010). During stimula-tion, the rates of exocytosis and endocytosis may be dependent oneach other. Synaptic vesicle endocytosis may be required, eitherdirectly or indirectly, for the availability of release sites (Neher,2010; Haucke et al., 2011). However, with a 40 Hz 30 s stimulus,we detect no significant difference in the rate of endocytosis ofVGLUT1-2XmOr2 in the presence or absence of the P/Q- and N-type Ca2+ channel blockers agatoxin and conotoxin. It may bethat under these stimulation conditions, the endocytic machineryof the synaptic terminal is not saturated. Indeed, higher frequencystimulation is associated with higher endocytic capacity (Balajiet al., 2008).
The ability to simultaneously monitor synaptic vesicle recyclingwith GFP-based indicators in individual synapses can advanceinvestigations of the modulation of neuronal connectivity in func-tional circuits. Imaging ensembles of neurons provides averagemeasurements, but could also enable the analysis of variance inthe properties of individual boutons. Individual boutons or cellsmay exhibit variation in probability of release, reliance on cal-cium channel subtypes, or modes of synaptic vesicle trafficking(Fisher and Bourque, 2001; Rizzoli and Betz, 2005; Armbrusterand Ryan, 2011; Weston et al., 2011). Engineering both indicatorsonto the same protein could further refine the spatiotemporal res-olution of these sensors of calcium dependent neurotransmitterrelease. Combining VGLUT1-2XmOr2 with GCaMPs expressedpostsynaptically can provide a powerful method to determine thelocus of changes in synaptic efficacy in specific circuits. Com-bining mOrange2 and pHluorin-based indicators provides anapproach to study trafficking of individual proteins in parallel.The capacity for simultaneous imaging of neurotransmitter releaseand Ca2+ dynamics in real time from defined populations atsynaptic resolution will be useful for addressing a broad spectrumof neuroscience questions.
Frontiers in Molecular Neuroscience www.frontiersin.org November 2011 | Volume 4 | Article 34 | 8
Li et al. Two color presynaptic imaging
ACKNOWLEDGMENTSThis work was supported by grants from the International Men-tal Health Research Foundation (IMHRO), the Whitehall Foun-dation, the UCSF Office of the Dean and the Program forBreakthrough Biomedical Research (to Susan M. Voglmaier), and
a predoctoral fellowship from the National Institute of Men-tal Health (to Sarah M. Foss). GCaMP3 was kindly providedby Loren Looger (HHMI). We thank Rebecca Seal and MagdaSantos for helpful discussions, and Zachary Schwartz for dataanalysis.
REFERENCESAriel, P., and Ryan, T. A. (2010). Opti-
cal mapping of release properties insynapses. Front. Neural Circuits 4:18.doi:10.3389/fncir.2010.00018
Armbruster, M., and Ryan, T. A. (2011).Synaptic vesicle retrieval time isa cell-wide rather than individual-synapse property. Nat. Neurosci. 14,824–826.
Balaji, J., Armbruster, M., and Ryan, T.A. (2008). Calcium control of endo-cytic capacity at a CNS synapse. J.Neurosci. 28, 6742–6749.
Balaji, J., and Ryan, T. A. (2007). Single-vesicle imaging reveals that synap-tic vesicle exocytosis and endocytosisare coupled by a single stochasticmode. Proc. Natl. Acad. Sci. U.S.A.104, 20576–20581.
Betz, W. J., and Bewick, G. S. (1993).Optical monitoring of transmitterrelease and synaptic vesicle recyclingat the frog neuromuscular junction.J. Physiol. 460, 287–309.
Cao, Y. Q., and Tsien, R. W. (2010).Different relationship of N- andP/Q-type Ca2+ channels to channel-interacting slots in controlling neu-rotransmission at cultured hip-pocampal synapses. J. Neurosci. 30,4536–4546.
Chi, P., Greengard, P., and Ryan, T.A. (2003). Synaptic vesicle mobi-lization is regulated by distinctsynapsin I phosphorylation path-ways at different frequencies. Neuron38, 69–78.
Dreosti, E., and Lagnado, L. (2011).Optical reporters of synaptic activ-ity in neural circuits. Exp. Physiol. 96,4–12.
Dreosti, E., Odermatt, B., Dorostkar, M.M., and Lagnado, L. (2009). A genet-ically encoded reporter of synap-tic activity in vivo. Nat. Methods 6,883–889.
Fernandez-Alfonso, T., and Ryan, T. A.(2004). The kinetics of synaptic vesi-cle pool depletion at CNS synapticterminals. Neuron 41, 943–953.
Fernandez-Alfonso, T., and Ryan, T.A. (2008). A heterogeneous “rest-ing” pool of synaptic vesiclesthat is dynamically interchangedacross boutons in mammalian CNSsynapses. Brain Cell Biol. 36, 87–100.
Fisher, T. E., and Bourque, C. W. (2001).The function of Ca(2+) channelsubtypes in exocytotic secretion:new perspectives from synaptic and
non-synaptic release. Prog. Biophys.Mol. Biol. 77, 269–303.
Gandhi, S. P., and Stevens, C. F. (2003).Three modes of synaptic vesicularrecycling revealed by single-vesicleimaging. Nature 423, 607–613.
Granseth, B., Odermatt, B., Royle, S. J.,and Lagnado, L. (2006). Clathrin-mediated endocytosis is the domi-nant mechanism of vesicle retrievalat hippocampal synapses. Neuron 51,773–786.
Haucke, V., Neher, E., and Sigrist, S.J. (2011). Protein scaffolds in thecoupling of synaptic exocytosis andendocytosis. Nat. Rev. Neurosci. 12,127–138.
Heidelberger, R., Heinemann, C., Neher,E., and Matthews, G. (1994). Cal-cium dependence of the rate of exo-cytosis in a synaptic terminal. Nature371, 513–515.
Hendel, T., Mank, M., Schnell, B.,Griesbeck, O., Borst, A., and Reiff,D. F. (2008). Fluorescence changesof genetic calcium indicators andOGB-1 correlated with neural activ-ity and calcium in vivo and in vitro.J. Neurosci. 28, 7399–7411.
Katz, B., and Miledi, R. (1969). Sponta-neous and evoked activity of motornerve endings in calcium Ringer. J.Physiol. (Lond.) 203, 689–706.
Kim, S. H., and Ryan, T. A. (2010).CDK5 serves as a major controlpoint in neurotransmitter release.Neuron 67, 797–809.
Kuromi, H., and Kidokoro, Y. (2005).Exocytosis and endocytosis ofsynaptic vesicles and functionalroles of vesicle pools: lessonsfrom the Drosophila neuromus-cular junction. Neuroscientist 11,138–147.
Kwon, S. E., and Chapman, E. R. (2011).Synaptophysin regulates the kinet-ics of synaptic vesicle endocyto-sis in central neurons. Neuron 70,847–854.
Li, H., Waites, C. L., Staal, R. G., Dobryy,Y., Park, J., Sulzer, D. L., and Edwards,R. H. (2005a). Sorting of vesicu-lar monoamine transporter 2 to theregulated secretory pathway confersthe somatodendritic exocytosis ofmonoamines. Neuron 48, 619–633.
Li, Z., Burrone, J., Tyler, W. J., Hart-man, K. N., Albeanu, D. F., andMurthy,V. N. (2005b). Synaptic vesi-cle recycling studied in transgenicmice expressing synaptopHluorin.
Proc. Natl. Acad. Sci. U.S.A. 102,6131–6136.
Llinas, R., Sugimori, M., and Silver, R. B.(1992). Microdomains of high cal-cium concentration in a presynapticterminal. Science 256, 677–679.
Miesenbock, G., De Angelis, D. A., andRothman, J. E. (1998). Visualizingsecretion and synaptic transmissionwith pH-sensitive green fluorescentproteins. Nature 394, 192–195.
Miesenböck, G., De Angelis, D. A., andRothman, J. E. (1998). Visualizingsecretion and synaptic transmissionwith pH-sensitive green fluorescentproteins. Nature 394, 192–195.
Mintz, I. M., Venema, V. J., Swiderek,K. M., Lee, T. D., Bean, B. P., andAdams, M. E. (1992). P-type cal-cium channels blocked by the spidertoxin omega-Aga-IVA. Nature 355,827–829.
Moulder, K. L., and Mennerick, S.(2005). Reluctant vesicles contributeto the total readily releasable poolin glutamatergic hippocampal neu-rons. J. Neurosci. 25, 3842–3850.
Mozhayeva, M. G., Sara, Y., Liu, X., andKavalali, E. T. (2002). Developmentof vesicle pools during maturation ofhippocampal synapses. J. Neurosci.22, 654–665.
Neher, E. (2010). What is rate-limiting during sustained synapticactivity: vesicle supply or theavailability of release sites.Front. Synaptic Neurosci. 2:144.doi:10.3389/fnsyn.2010.00144
Nemani, V. M., Lu, W., Berge, V.,Nakamura, K., Onoa, B., Lee, M.K., Chaudhry, F. A., Nicoll, R.A., and Edwards, R. H. (2010).Increased expression of alpha-synuclein reduces neurotransmitterrelease by inhibiting synaptic vesiclereclustering after endocytosis. Neu-ron 65, 66–79.
Neves, G., Gomis, A., and Lagnado, L.(2001). Calcium influx selects thefast mode of endocytosis in thesynaptic terminal of retinal bipolarcells. Proc. Natl. Acad. Sci. U.S.A. 98,15282–15287.
Patton, C., Thompson, S., and Epel, D.(2004). Some precautions in usingchelators to buffer metals in bio-logical solutions. Cell Calcium 35,427–431.
Perissinotti, P. P., Giugovaz Tropper, B.,and Uchitel, O. D. (2008). L-type cal-cium channels are involved in fast
endocytosis at the mouse neuromus-cular junction. Eur. J. Neurosci. 27,1333–1344.
Reid, C. A., Bekkers, J. M., and Clements,J. D. (2003). Presynaptic Ca2+ chan-nels: a functional patchwork. TrendsNeurosci. 26, 683–687.
Renden, R., and Von Gersdorff, H.(2007). Synaptic vesicle endocytosisat a CNS nerve terminal: faster kinet-ics at physiological temperatures andincreased endocytotic capacity dur-ing maturation. J. Neurophysiol. 98,3349–3359.
Rizzoli, S. O., and Betz, W. J. (2005).Synaptic vesicle pools. Nat. Rev. Neu-rosci. 6, 57–69.
Sankaranarayanan, S., and Ryan, T. A.(2000). Real-time measurements ofvesicle-SNARE recycling in synapsesof the central nervous system. Nat.Cell Biol. 2, 197–204.
Sankaranarayanan, S., and Ryan, T. A.(2001). Calcium accelerates endocy-tosis of vSNAREs at hippocampalsynapses. Nat. Neurosci. 4, 129–136.
Schnee, M. E., Santos-Sacchi, J.,Castellano-Munoz, M., Kong,J. H., and Ricci, A. J. (2011).Calcium-dependent synaptic vesicletrafficking underlies indefatigablerelease at the hair cell afferent fibersynapse. Neuron 70, 326–338.
Schneggenburger, R., and Neher, E.(2000). Intracellular calcium depen-dence of transmitter release rates ata fast central synapse. Nature 406,889–893.
Schneggenburger, R., Sakaba, T., andNeher, E. (2002). Vesicle poolsand short-term synaptic depression:lessons from a large synapse. TrendsNeurosci. 25, 206–212.
Schweizer, F. E., and Ryan, T. A. (2006).The synaptic vesicle: cycle of exo-cytosis and endocytosis. Curr. Opin.Neurobiol. 16, 298–304.
Shaner, N. C., Lin, M. Z., Mckeown, M.R., Steinbach, P. A., Hazelwood, K.L., Davidson, M. W., and Tsien, R.Y. (2008). Improving the photosta-bility of bright monomeric orangeand red fluorescent proteins. Nat.Methods 5, 545–551.
Sitges, M., and Galindo, C. A. (2005).Omega-agatoxin-TK is a useful toolto study P-type Ca2+ channel-mediated changes in internal Ca2+
and glutamate release in depolarisedbrain nerve terminals. Neurochem.Int. 46, 53–60.
Frontiers in Molecular Neuroscience www.frontiersin.org November 2011 | Volume 4 | Article 34 | 9
Li et al. Two color presynaptic imaging
Subramanian, J., and Morozov, A.(2011). Erk1/2 inhibit synaptic vesi-cle exocytosis through L-type cal-cium channels. J. Neurosci. 31,4755–4764.
Sudhof, T. C. (2004). The synaptic vesi-cle cycle. Annu. Rev. Neurosci. 27,509–547.
Sun, T., Wu, X. S., Xu, J., Mcneil,B. D., Pang, Z. P., Yang, W., Bai,L., Qadri, S., Molkentin, J. D.,Yue, D. T., and Wu, L. G. (2010).The role of calcium/calmodulin-activated calcineurin in rapid andslow endocytosis at central synapses.J. Neurosci. 30, 11838–11847.
Takahashi, T., and Momiyama, A.(1993). Different types of cal-cium channels mediate centralsynaptic transmission. Nature 366,156–158.
Thoreson, W. B., Rabl, K., Townes-Anderson, E., and Heidelberger, R.(2004). A highly Ca2+-sensitive poolof vesicles contributes to linearityat the rod photoreceptor ribbonsynapse. Neuron 42, 595–605.
Tian, L., Hires, S. A., Mao, T., Huber,D., Chiappe, M. E., Chalasani, S. H.,Petreanu, L., Akerboom, J., Mckin-ney, S. A., Schreiter, E. R., Bargmann,C. I., Jayaraman, V., Svoboda, K.,
and Looger, L. L. (2009). Imagingneural activity in worms, flies andmice with improved GCaMP cal-cium indicators. Nat. Methods 6,875–881.
Voglmaier, S. M., and Edwards, R.H. (2007). Do different endocyticpathways make different synapticvesicles? Curr. Opin. Neurobiol. 17,374–380.
Voglmaier, S. M., Kam, K., Yang, H.,Fortin, D. L., Hua, Z., Nicoll, R. A.,and Edwards, R. H. (2006). Distinctendocytic pathways control the rateand extent of synaptic vesicle proteinrecycling. Neuron 51, 71–84.
Von Gersdorff, H., and Matthews, G.(1999). Electrophysiology of synap-tic vesicle cycling. Annu. Rev. Physiol.61, 725–752.
Weston, M. C., Nehring, R. B., Woj-cik, S. M., and Rosenmund, C.(2011). Interplay between VGLUTisoforms and endophilin A1 regu-lates neurotransmitter release andshort-term plasticity. Neuron 69,1147–1159.
Wheeler, D. B., Randall, A., and Tsien,R. W. (1994). Roles of N-type andQ-type Ca2+ channels in supportinghippocampal synaptic transmission.Science 264, 107–111.
Wu, W., Xu, J., Wu, X. S., and Wu,L. G. (2005). Activity-dependentacceleration of endocytosis at acentral synapse. J. Neurosci. 25,11676–11683.
Yamashita, T., Eguchi, K., Saitoh, N.,Von Gersdorff, H., and Takahashi,T. (2010). Developmental shift to amechanism of synaptic vesicle endo-cytosis requiring nanodomain Ca2+.Nat. Neurosci. 13, 838–844.
Zakharenko, S. S., Zablow, L., andSiegelbaum, S. A. (2001). Visual-ization of changes in presynapticfunction during long-term synapticplasticity. Nat. Neurosci. 4, 711–717.
Zhang, Q., Cao, Y. Q., and Tsien, R.W. (2007). Quantum dots providean optical signal specific to full col-lapse fusion of synaptic vesicles.Proc. Natl. Acad. Sci. U.S.A. 104,17843–17848.
Zhao, C., Dreosti, E., and Lagnado, L.(2011). Homeostatic synaptic plas-ticity through changes in presynap-tic calcium influx. J. Neurosci. 31,7492–7496.
Zhu, Y., Xu, J., and Heinemann, S.F. (2009). Two pathways of synap-tic vesicle retrieval revealed bysingle-vesicle imaging. Neuron 61,397–411.
Conflict of Interest Statement: Theauthors declare that the research wasconducted in the absence of anycommercial or financial relationshipsthat could be construed as a potentialconflict of interest. Nathan C. Shanerand Roger Y. Tsien are listed as inventorsin a US patent assigned to the Universityof California, which includes as a claimmOrange2, used in this work.
Received: 09 July 2011; paper pend-ing published: 24 July 2011; accepted:05 October 2011; published online: 02November 2011.Citation: Li H, Foss SM, Dobryy YL,Park CK, Hires SA, Shaner NC, TsienRY, Osborne LC and Voglmaier SM(2011) Concurrent imaging of synap-tic vesicle recycling and calcium dynam-ics. Front. Mol. Neurosci. 4:34. doi:10.3389/fnmol.2011.00034Copyright © 2011 Li, Foss, Dobryy,Park, Hires, Shaner, Tsien, Osborne andVoglmaier . This is an open-access arti-cle subject to a non-exclusive licensebetween the authors and Frontiers MediaSA, which permits use, distribution andreproduction in other forums, providedthe original authors and source are cred-ited and other Frontiers conditions arecomplied with.
Frontiers in Molecular Neuroscience www.frontiersin.org November 2011 | Volume 4 | Article 34 | 10