Embed Size (px)
Citation preview

Confidence Intervals for ARMA-GARCH
Value-at-Risk
Laura Spierdijk�
May 31, 2013
�University of Groningen, Faculty of Economics and Business, Department of Economics, Econometrics andFinance, P.O. Box 800, NL-9700 AV Groningen, The Netherlands. Email: [email protected]. Phone: +31 50 3635929. Fax: +31 50 363 7337.

Confidence Intervals for ARMA-GARCH Value-at-Risk
Abstract
The quasi-maximum likelihood (QML) estimators of a GARCH model may not be
normally distributed when the model errors lack a finite fourth moment. However, conven-
tional methods to obtain confidence intervals for GARCH-based Value-at-Risk estimates
rely on asymptotic normality. This study proposes a residual subsample bootstrap to esti-
mate confidence intervals for QML-based ARMA-GARCH Value-at-Risk (VaR) estimates.
Simulation experiments show that this approach yields confidence intervals with correct
empirical coverage rates, even when conventional methods fail. An application to daily
stock returns illustrates the empirical relevance of the residual subsample bootstrap.
Keywords: quasi-maximum likelihood, heavy tails, subsample bootstrap
JEL classification: C22, C53, C58

1 Introduction
During the past decades Value-at-Risk (VaR) has become a standard tool in risk manage-
ment. For example, the capital requirements for insurance companies operating in the European
Union, as prescribed by the Solvency II Directive, are based on the 99.5% VaR of the portfolio
of assets and liabilities measured over a one-year time horizon (Sandstrom, 2011).
The "%-VaR is defined as the "% quantile of a given profit-and-loss (P-L) distribution. VaR
estimation requires certain assumptions about the latter distribution. When the P-L distribution
of a portfolio of securities is the object of interest, it has become fairly standard to assume a
distribution of the Generalized Autoregressive Conditional Heteroskedasticity (GARCH) type
(Engle, 1982; Bollerslev, 1986) GARCH models capture an important stylized fact of asset
returns known as volatility clustering: high (absolute) returns tend to be followed by more high
returns and low (absolute) returns tend to be followed by more low returns. Models of the
GARCH-type are able to deal with this form of conditional heteroskedasticity.
An attractive property of GARCH models is that consistent estimation of the model pa-
rameters does not require knowledge of the distribution of the model errors. Quasi-maximum
likelihood (QML) is based on the normal likelihood function and yields consistent parame-
ter estimates even when normality is violated, provided that certain regularity conditions hold
(Hall and Yao, 2003; Francq and Zakoıan, 2004). Consistent (but generally inefficient) estima-
tion of the covariance matrix is possible using the sandwich estimator proposed by Bollerslev
and Wooldridge (1992).
VaR estimates depend on the estimated parameters of the underlying P-L distribution, which
are subject to estimation uncertainty. To judge the accuracy of a VaR estimate, it is crucial to
quantify this estimation uncertainty in terms of a confidence interval. When the confidence
interval around a VAR estimate is found to be wide, caution is required when decisions are to
be based on the inaccurate point estimate.
Several methods can be used to quantify the parameter uncertainty associated with model-
based VaR estimates. Among these methods are the Delta method (Duan, 2004) and the residual
bootstrap (Dowd, 2002; Christoffersen and Goncalves, 2005).
Hall and Yao (2003) show that non-normality of the QML estimator arises in a GARCH
1

model when the fourth moment of the model errors is not finite and the distribution of the
squared model errors is not in the domain of attraction of the Normal distribution. It is obvious
that the Delta method is not appropriate in such a case. Furthermore, it is well known that the
conventional bootstrap is generally not consistent when the limiting distribution of a statistic
is not standard Normal after appropriate normalization (Athreya, 1987a,b; Knight, 1989; Hall,
1990; Mammen, 1992). If the model errors belong to the class of regularly-varying distribu-
tions with proportional tails, the asymptotic distribution of the extreme conditional quantiles is
available under certain assumptions and can be used to obtain analytical confidence intervals
(Chan et al., 2007). As usual, these assumptions incur the risk of misspecification. However, the
literature has not yet shown how to obtain confidence intervals with correct coverage without
additional assumptions.
This paper proposes a new method to obtain confidence intervals for QML-based VaR esti-
mates, derived from ARMA-GARCH models with unknown error distribution. No prior knowl-
edge about the distribution of the model errors is assumed, apart from some minimal regularity
conditions. The fourth moment of the error distribution is allowed to be either finite or infinite.
The residual subsample bootstrap that we propose boils down the subsample bootstrap of Sher-
man and Carlstein (2004), applied to the residuals of the ARMA-GARCH model. An attractive
feature of our approach is that it is based on an ‘omnibus’ procedure. Regardless of the distri-
bution and the moments of the model errors, the subsample bootstrap will produce confidence
intervals with correct empirical coverage rates.
Given the empirical evidence for heavy-tailed asset returns (see e.g. McNeil and Frey
(2000)) and asset returns that lack a finite fourth moment (Pagan, 1996; Cont, 2001; Embrechts
et al., 1997), there is a substantial risk that conventional methods will fail. Fortunately, the
residual subsample bootstrap provides an omnibus approach to obtain confidence intervals for
VaR estimates.
By means of a simulation study we show that the residual subsample bootstrap approach
yields confidence intervals with accurate coverage in all situations, but particularly when con-
ventional methods fail due to a lack of asymptotic normality of the QML estimators. The resid-
ual subsample bootstrap also performs satisfactory when sample sizes are relatively modest.
2

Rule-of-thumb choices for the length of the subsample, as proposed by Sherman and Carlstein
(2004), turn out to work well in an ARMA-GARCH context. We compare the coverage rates
of our method with those of the Normal approximation method of Chan et al. (2007). Like our
method, the latter approach does not rely on asymptotic normality of the QML estimator. Also
this comparison turns out favorable for the confidence intervals based on the residual subsample
bootstrap.
Application of the residual subsample bootstrap when the VaR estimator is asymptotically
normally distributed results in confidence intervals with correct empirical coverage rates. But
these confidence intervals are relatively wide: Inefficiency is the price that has to be paid for
the omnibus nature of the residual subsample bootstrap. Because we prefer to avoid such inef-
ficiencies, we recommend some simple tests to assess the finiteness of the model errors’ fourth
moment and the shape of the VaR estimator’s asymptotic distribution. Given the outcomes of
these tests, the researcher can choose between one of the conventional methods relying on
asymptotic normality of the QML estimators and the ‘omnibus’ subsample bootstrap. We illus-
trate these tests in the empirical part of the paper, where we estimate VaR for heavy-tailed and
skewed stock returns.
The setup of the remainder of this paper is as follows. Section 2 describes how VaR is
estimated using the QML estimator of an ARMA-GARCH model. The residual subsample
bootstrap is discussed in Section 3. By means of simulation this section evaluates the empirical
coverage rates of the residual subsample bootstrap’s confidence intervals. Section 4 discusses
alternative methods to estimate confidence intervals for VaR estimates, followed by more sim-
ulations. Section 5 uses daily stock returns to estimate VaR and subsequently compares the
confidence intervals obtained by the residual subsample bootstrap and the alternative methods.
Finally, Section 6 concludes. A separate appendix with supplementary background material is
available.
3

2 Estimation of Value-at-Risk
ARMA-GARCH specifications are location-scale models belonging to the class of time-series
models with GARCH errors (McNeil and Frey, 2000; Li et al., 2002). Alternative VaR models
have been studied by e.g. Engle and Manganelli (2004) and Koenker and Xiao (2006).
For the sake of exposition we confine the analysis to the ARMA(1,1)-GARCH(1,1) model,
but we emphasize that our approach can be applied to ARMA-GARCH models of any order.
We thus consider the following ARMA(1,1)-GARCH(1,1) model for t D 1; : : : ; n:
rt D �t C �tzt I (1)
�t D � C rt�1 C �.rt�1 � �t�1/I (2)
�2t D ! C ˛.rt�1 � �t�1/2
C ˇ�2t�1I (3)
zt � D.0; 1/ iid; (4)
where D.0; 1/ denotes a distribution with mean 0 and variance 1. Covariance-stationarity is
imposed by assuming that j j < 1, ! > 0, ˛ > 0, ˇ > 0, and ˛ C ˇ < 1. We also make the
standard assumption that IE.z2t / < 1 (Chan et al., 2007).
Given a times series sample r1; : : : ; rn, we estimate the ARMA-GARCH model by means
of QML, yielding the vector of estimated model parameters O� D . O�; O ; O�; O!; O ; O/. We refer to
zt D .rt � �t/=�t as the ‘model errors’ or the ‘standardized returns’.
Because our main interest goes to losses, we focus on the left tail of the P-L distribution.
We consider the "% one-step ahead conditional VaR, denoted �"njnC1
and satisfying
IP.rnC1 < �"njnC1 j In/ D "=100; (5)
where In denotes all information available up to time n. Conditional on In, the "% quantile of
the return distribution equals
�"njnC1 D �nC1 C �nC1Q"
z; (6)
where Qyz denotes the y% quantile of the standardized returns zt . A point estimate of �"
njnC1is
obtained by replacing �nC1, �nC1 and Q"z by their forecasted counterparts:
b�"njnC1 D O�nC1 C O�nC1
OQ"z: (7)
4

We consider static forecasts of �nC1 and �nC1, which are obtained by iterating Equations (2)
and (3) using O� and the observed values of r1; : : : ; rn. We estimate the quantiles of the stan-
dardized return distribution from the empirical distribution of Ozt D .rt � O�t/= O�t , yielding the
sample quantiles OQ"z (Christoffersen and Goncalves, 2005; Goa and Song, 2008). Because the
resulting VaR estimate is subject to parameter uncertainty via O�t , O�t , and OQ"z, it is important to
provide a confidence interval in addition to the point estimate.
A well-known limitation of VaR as a risk measure it that it does not satisfy the sub-additivity
property. Although other risk measures, such as expected shortfall, may be preferable from a
theoretical point of view, VaR remains among the most widely used risk measures. We therefore
limit our analysis to VaR, but we emphasize that it is straightforward to extend the approach to
alternative risk measures.
3 Residual subsample bootstrap
The goal of this section is to show that the residual subsample bootstrap yields confidence
intervals with correct coverage rates for a wide range of ARMA-GARCH specifications, but
particularly when the ARMA-GARCH errors lack a finite fourth moment. We start with a
description of the residual subsample bootstrap, followed by some simulation results.
3.1 Methodology
Given a possibly dependent sample r1; : : : ; rn, Sherman and Carlstein (2004) consider a gen-
eral statistic sn D sn.r1; : : : ; rn/ as a consistent point estimator of a target parameter s. Their
subsample bootstrap assumes that an.sn � s/ converges in distribution for n ! 1 and some
sequence an ! 1, but does neither require knowledge of .an/ nor of the limiting distribution.
The ‘omnibus’ nature of the subsample bootstrap makes this method attractive for confidence
interval estimation.
Three minimal conditions for consistency are required, which boil down to (1) the assump-
tion that the limit distribution of an.sn � s/ exists, (2) a couple of standard assumptions regard-
ing the subsample size ` as a function of the sample size n, and (3) a mixing condition (Sherman
5

and Carlstein, 2004, Conditions R.1 – R.3, p. 127). In general, non-replacement subsampling
methods work because the resulting subsamples are random samples of the true population dis-
tribution instead of estimators of the latter distribution. The formal proof that the subsample
bootstrap of Sherman and Carlstein (2004) yields asymptotically correct coverage probabilities
relies heavily on the related work of Politis and Romano (1994); Bertail et al. (1999) and is not
repeated here.
We propose a residual subsample bootstrap for estimating VaR confidence intervals. This
bootstrap is an application of the subsample bootstrap of Sherman and Carlstein (2004) to
the ARMA-GARCH model residuals Ozt , which are assumed to be iid. Obviously, the mixing
condition is satisfied when the subsample bootstrap is applied to iid residuals. Sherman and
Carlstein (2004, p. 128) describe how to adjust their subsample bootstrap to non-dependent
data. It is evidently not possible to use all�
n
`
�subsamples of size ` from the n residuals. We
therefore randomly draw B D 1000 of such subsamples (Politis and Romano, 1994). This
choice of B will turn out adequate in Section 3.3, in the sense that a further increase in B has
only a minor impact on the confidence intervals.
After fitting an ARMA-GARCH model to the observed sample r1; : : : ; rn by means of QML
(resulting in the vector of estimated ARMA-GARCH parameters O�), the residual subsample
bootstrap consists of the following steps. A random subsample of length ` is drawn with-
out replacement from the estimated ARMA-GARCH model’s standardized returns Oz1; : : : ; Ozn,
yielding Qz1; : : : ; Qz`. Next, O� and Equations (1) – (3) are used to recursively generate values
Qr1; : : : ; Qr`. The bootstrap sample Qr1; : : : ; Qr` is used to estimate the ARMA-GARCH model by
means of QML, yielding Q�. Subsequently, Q� and the observed r1; : : : ; rn are used to statically
calculate Q�n and Q�n according to Equations (2) – (3). QQ"z is defined as the "% sample quantile
of Qzt D .rt � Q�t/= Q�t and used as a bootstrap estimator of Q"z . Finally, e�"
njnC1is calculated from
Equation (7) using Q�n, Q�n, and QQ"z.
The above steps are repeated B times, resulting in e�"njnC1;1
; : : : ;e�"njnC1;B
. The proposed x%
confidence interval has the formhe�"njnC1;1 � Q
.1Cx/=2
1 ;e�"njnC1;1 � Q
.1�x/=2
1
i: (8)
6

Here Qy
1 is defined as the empirical y% quantile of
e�"njnC1;1 � b�"
njnC1; : : : ;e�"njnC1;B � b�"
njnC1; (9)
with b�"njnC1
as defined in Equation (7). As noted by Sherman and Carlstein (2004), the choice
of e�"njnC1;1
in (8) is arbitrary and can be replaced by any e�"njnC1;i
, i D 2; : : : ; B.
Sherman and Carlstein (2004) prove that the coverage rate of the above confidence interval
is asymptotically correct. They also show that the width of the confidence interval converges
in probability to zero for n ! 1 (under their standard assumptions ` ! 1, `=n ! 0
and a`=an ! 0). Intuitively, a larger subsample size results in bootstrap estimators that are
based on more data. Estimators based on more data are subject to less parameter uncertainty,
resulting in a smaller expected confidence interval width. On the other hand, with a larger
subsample size the subsamples tend to overlap more. At the same time, e�"njnC1;1
and b�"njnC1
become more dependent. These two effects result in a higher coverage probability error. Hence,
there is a trade-off between expected confidence interval width and coverage probability error.
On the basis of a simulation study, Sherman and Carlstein (2004) recommend a subsample size
between (a constant times) n1=2 and (a constant times) n2=3. Throughout, we will consider the
subsample sizes `1 D n2=3, `2 D .n1=2 C n2=3/=2, and `3 D n1=2 (all three rounded to the
nearest integer).
In the introduction we already mentioned the possible inefficiency of the subsample boot-
strap. We can make this statement more formal here. The price that is paid for the omnibus
nature of the subsample bootstrap is that the resulting confidence intervals typically have a
length of order a�1`
instead of a�1n (where ` denotes the subsample size and n the full sample
size). We will come back to this issue in Section 4.1.
3.2 Simulation setup
We start with an ARMA(1,1)-GARCH(1,1) model with parameters � D .0; 0:5; 0:3; 0:01; 0:1; 0:8/,
reflecting relatively high persistence in both the ARMA and the GARCH part of the model. The
distribution of the standardized returns is chosen to be Normal, Student’s t , or skewed Student’s
t (Fernandez and Steel, 1998). In all cases the distribution of the standardized returns is scaled
7

in such a way that it has mean 0 and variance 1. The skewed Student’s t distribution has skew-
ness parameter � D 0:5, reflecting negative skewness. The shape parameter (reflecting the
number of degrees of freedom) equals � D 3 for both t distributions. The t distributions with 3
degrees of freedom have a finite second moment (as required), but infinite fourth moment.
For a given distribution of zt , we randomly draw values z1; : : : ; zn and recursively simulate
N D 1000 time series r1; : : : ; rn on the basis of Equations (1) – (3). We estimate �"njnC1
as
outlined in Section 2 and obtain the associated 90% confidence intervals using the residual
subsample bootstrap of Section 3.1. We calculate the true value �"njnC1
using the true values of
�t and �t . The true value of Q"z is defined as the "% sample quantile of z1; : : : ; zn. We do not use
the true "% quantile of zt ’s distribution (i.e., the Normal, t or skewed t distribution), because
we want to assess the empirical coverage rate of b�"njnC1
exclusive of sampling uncertainty. The
empirical coverage probability is calculated as the fraction of simulations for which the true
value of �"njnC1
falls within the estimated confidence interval. We consider the sample sizes
n D 300; 500; 1000 and 5000. The separate appendix with supplementary material provides
further computational details.
3.3 Simulation results
The empirical coverage probabilities for " D 5% are displayed in the first panel of Table 1 (cap-
tioned ‘Case 1’). This table shows that the subsample bootstrap yields coverage probabilities
close to 90% for all distributions.
The coverage rates depend on the selected subsample size, but each of the three chosen
subsample sizes results in reasonably accurate coverage rates. For n D 1000, the subsample
sizes `1 D 100 and `2 D 66 yield the best coverage rates. For n D 5000, the most accurate
coverage rates are obtained for the subsample sizes `2 D 182 and `3 D 71. For n D 300I 500,
we only consider the subsample sizes `1 D 45I 65 and `2 D 31I 43. Even for these modest
sample sizes, the coverage rates are at least 0.86 with the most favorable subsample size.
We run a wide range of robustness checks based on different ARMA-GARCH specifica-
tions, involving lower persistence, positive skewness, and t distributions with 4 or 5 instead of
3 degrees of freedom. We also estimate 1% and 10% VaR in addition to the 5% VaR. The
8

Table 1: Empirical coverage probabilities (residual subsample bootstrap)
Case 1 Case 2 Case 3(high persistence) (low persistence) (pure GARCH)
n Normal t.3/ st.3/ Normal t.3/ st.3/ Normal t.3/ st.3/
` D `1
300 0.88 0.86 0.86 0.90 0.86 0.88 0.89 0.84 0.87500 0.90 0.89 0.87 0.89 0.88 0.88 0.89 0.89 0.871000 0.89 0.89 0.88 0.88 0.87 0.88 0.89 0.87 0.875000 0.90 0.84 0.85 0.89 0.82 0.83 0.90 0.82 0.82
` D `2
300 0.89 0.87 0.85 0.88 0.85 0.85 0.85 0.83 0.82500 0.89 0.89 0.85 0.88 0.88 0.87 0.90 0.87 0.851000 0.91 0.89 0.87 0.89 0.87 0.90 0.92 0.88 0.885000 0.91 0.88 0.87 0.90 0.87 0.86 0.89 0.85 0.84
` D `3
1000 0.89 0.89 0.83 0.89 0.89 0.86 0.88 0.84 0.825000 0.89 0.90 0.89 0.90 0.89 0.90 0.89 0.90 0.89
Notes: For different sample sizes (n) and distributions of the ARMA(1,1)-GARCH(1,1) errors, this tabledisplays the empirical coverage probabilities of the 90% confidence intervals based on the subsample sizes`1 D n2=3, `2 D .n1=2 C n2=3/=2, and `3 D n1=2. Distributions: t.3/, Student’s t distribution with � D 3
degrees of freedom; st.3/, skewed Student’s t distribution with � D 3 degrees of freedom and skewness pa-rameter �. Case 1 (high persistence): " D 5%, � D 0:5, .�; ; �; !; ˛; ˇ/ D .0; 0:5; 0:3; 0:01; 0:1; 0:8/. Case2 (low persistence): " D 1%, � D 1:5, .�; ; �; !; ˛; ˇ/ D .0; 0:3; 0:1; 0:01; 0:2; 0:4/. Case 3 (pure GARCHmodel): " D 1%, � D 1:5, .�; ; �; !; ˛; ˇ/ D .0; 0; 0; 1; 0:2; 0:3/.
results of these additional simulations show that the subsample bootstrap yields confidence in-
tervals with coverage rates close to the nominal values, regardless of the value of ", the ARMA
and GARCH persistence, the skewness and the degrees of freedom of the t distributions.
A selection of additional estimation results is shown in the second panel of Table 1 (cap-
tioned ‘Case 2’). The outcomes in this part of Table 1 correspond with � D 3, � D 1:5 (instead
of � D 0:5 as before) and the low-persistence parameter vector � D .0; 0:3; 0:1; 0:01; 0:2; 0:4/.
Moreover, in Case 2 the empirical coverage rates apply to the 1% VaR (instead of the 5% VaR
as before). Again the residual subsample bootstrap yields empirical coverage probabilities that
are close to 90%. With respect to the optimal subsample sizes we find similar results as before.
9

3.4 Choice of the subsample size
As mentioned in Section 3.1, smaller subsample sizes result in wider expected confidence in-
tervals. For example, in Case 1 the average interval widths over the simulation runs equal 0.35
(`1), 0.43 (`2) and 0.72 (`3) for n D 5000 and a skewed Student’s t distribution. Smaller sub-
sample sizes are preferable over larger ones to minimize the coverage probability error. To strike
a proper balance between coverage accuracy and interval width, `2 seems a reasonable choice
for the subsample size according to our simulations. Full details about the average confidence
interval width in the simulations can be found in the appendix with supplementary material.
The subsample sizes used in this section range between 31 and 292, depending on the
sample size. We emphasize that the simulation results presented here have been obtained under
ideal circumstances; i.e., in the situation that the true data generating process is also the model
that has been estimated. The favorable results obtained for the smallest subsamples may not
extend to real-life applications, where there can be some misspecification. Therefore, although
we obtain good results even for the smallest subsample sizes, we recommend not to use such
small subsamples in practice without further robustness checks.
In particular, we recommend a couple of steps to verify whether the subsample size has not
been chosen too small. First, it is important to check whether the quasi-maximum likelihood
routine used to estimate the model parameters has truly converged. Second, the average of the
VaR estimates over the bootstrap subsamples should at least be close to the estimated VaR
based on the observed data. One may even consider putting a lower bound on the subsample
size (depending on the number of ARMA-GARCH parameters), but such a lower bound is
inevitably somewhat arbitrary.
4 Comparison to alternative methods
Several alternative methods are available for estimating the parameter uncertainty associated
with QML-based VaR estimates. Some of these methods, such as the Delta method and the con-
ventional residual bootstrap, rely on asymptotic normality of the QML estimator. The Normal
approximation method proposed by Chan et al. (2007) does not assume asymptotic normality
10

of the QML estimator, but makes other assumptions. This section compares the performance of
the residual subsample bootstrap to each of these methods.
4.1 Methods based on asymptotic normality of the QML estimator
The methods that we consider in this section are (1) the Delta method, (2) a parametric boot-
strap from the presumed asymptotic distribution of the estimated QML parameters, and (3) the
residual bootstrap (Efron and Tribshirani, 1993). We refer to the appendix for the details of
these methods. We use the simulation design of Section 3.2 and 3.3 (Cases 1 and 2) and apply
each of the aforementioned methods to estimate confidence intervals for the QML-based VaR
estimates.
The empirical coverage probabilities for Cases 1 and 2 are displayed in the first and second
part of Table 2. As expected, the alternative methods have coverage probabilities close to 90%
when the standardized returns have a Normal distribution. Larger differences in coverage prob-
abilities arise for the Student’s t distributions. For these distributions the conventional methods
yield empirical coverage rates that are substantially below 90%. This holds particularly true for
the skewed Student’s t distribution, for which the empirical coverage rates range between 0.60
(n D 300, parametric bootstrap) and 0.79 (n D 5000, Delta method).
Although the Delta method seems to have a relatively high coverage rate of 0.84 in Case 1
for n D 5000 and a Student’s t distribution, its one-sided coverage rates are less favorable. The
empirical left (right) coverage probability is defined as the fraction of simulated samples for
which the true VaR exceeds (is less than) the lower (upper) bound of the estimated confidence
interval. The one-sided coverage rates should equal 0.95 in case of a 90% confidence interval,
but are 0.86 and 0.99. For the residual subsample bootstrap with (non-optimal) subsample size
`1, we also establish a two-sided coverage rate of 0.84, but the one-sided rates are more accurate
(0.90 and 0.94, respectively) than with the Delta method. To save space we do not report the
empirical one-sided coverage rates in Tables 1 and 2, but they are available in the appendix with
supplementary material. In general, the conventional methods’ right coverage rates are fairly
close to 95%, whereas the left coverage rates fall below the nominal level. This means that the
conventional methods are not able to accurately estimate the VaR distribution’s left tail. By
11

Table 2: Empirical coverage probabilities (conventional methods)
Case 1 Case 2 Case 3(high persistence) (low persistence) (pure GARCH)
n Normal t.3/ st.3/ Normal t.3/ st.3/ Normal t.3/ st.3/
DM300 0.93 0.76 0.68 0.90 0.71 0.71 0.88 0.71 0.66500 0.91 0.78 0.72 0.91 0.73 0.73 0.90 0.73 0.731000 0.92 0.80 0.72 0.91 0.76 0.72 0.90 0.74 0.715000 0.93 0.84 0.79 0.92 0.79 0.77 0.91 0.77 0.75
PB300 0.91 0.70 0.60 0.90 0.66 0.64 0.88 0.66 0.61500 0.90 0.72 0.66 0.91 0.68 0.69 0.90 0.67 0.661000 0.90 0.75 0.67 0.90 0.73 0.69 0.92 0.73 0.685000 0.89 0.78 0.72 0.90 0.77 0.73 0.89 0.75 0.70
RB300 0.90 0.75 0.66 0.90 0.71 0.70 0.90 0.72 0.68500 0.88 0.76 0.69 0.91 0.72 0.75 0.91 0.74 0.741000 0.89 0.77 0.71 0.89 0.78 0.72 0.92 0.78 0.725000 0.88 0.79 0.75 0.89 0.78 0.78 0.89 0.78 0.76
Notes: For different sample sizes (n) and distributions of the ARMA(1,1)-GARCH(1,1) errors, this ta-ble displays the empirical coverage probabilities of the 90% confidence intervals based on various meth-ods. Distributions: t.3/, Student’s t distribution with � D 3 degrees of freedom; st.3/: skewed Student’st distribution with � D 3 degrees of freedom and skewness parameter �. Case 1 (high persistence):" D 5%, � D 0:5, .�; ; �; !; ˛; ˇ/ D .0; 0:5; 0:3; 0:01; 0:1; 0:8/. Case 2 (low persistence): " D 1%,� D 1:5, .�; ; �; !; ˛; ˇ/ D .0; 0:3; 0:1; 0:01; 0:2; 0:4/. Case 3 (pure GARCH model): " D 1%, � D 1:5,.�; ; �; !; ˛; ˇ/ D .0; 0; 0; 1; 0:2; 0:3/. Methods: Delta method (DM), parametric bootstrap (PB), and resid-ual bootstrap (RB).
contrast, the residual subsample bootstrap succeeds in accurately estimating both the left and
the right tail of the VaR distribution.
With Normally distributed residuals, the residual subsample bootstrap has good coverage
rates. However, in this case the approach is inefficient because the confidence intervals are
much wider than with the other methods. For example, for n D 300 and a Normal distribution
the average interval width equals 0.52 in Case 2 (using the residual subsample bootstrap with
subsample size `1), whereas the average interval width based on the Delta method is only 0.12.
12

For n D 5000, the average widths equal 0.03 (Delta method) and 0.13 (residual subsample
bootstrap with subsample size `2). Hence, when the true distribution of the residuals is Normal,
the subsample bootstrap is inefficient and it would be better to use one of the conventional
methods to generate confidence intervals. Although the true distribution of the model errors
is usually unknown, there are statistical tests to assess the finiteness of the model errors and
the shape of the VaR estimator’s asymptotic distribution. We will come back to this issue in
Section 5.
4.2 Normal approximation method
Also Chan et al. (2007) describe a method to obtain confidence intervals for VaR estimates that
does not rely on asymptotic normality of the QML estimator. Their VaR estimator is slightly
different from the one proposed in Section 2 and obtained using the two-step procedure of
McNeil and Frey (2000). First, the parameters of the pure GARCH model are estimated by
means of QML, after which the Hill estimator (Hill, 1975) is used to estimate the tail index
of the standardized return distribution. The "% VaR estimate is obtained using Equation (6),
where Q"z is based on the Hill estimator and the standardized returns. In practice, the difference
between the two quantiles turns out negligible; see also Section 5.4. We refer to the appendix
for the technical details of the approach proposed by Chan et al. (2007).
Chan et al. (2007) use the asymptotic normality of the Hill estimator to construct a con-
fidence interval for their VaR estimator. We will refer to this approach in the sequel as the
‘Normal approximation’ method. By construction, this approach is only valid for small values
of ", which means that it only works well for " D 1% in our setting. One of the crucial assump-
tions underlying this method is that the Hill estimator is asymptotically unbiased. More details
about the Normal approximation approach and its assumptions are given in the appendix. Be-
sides the Normal approximation method, Chan et al. (2007) also propose data tilting to obtain
confidence intervals (Hall and Yao, 2003; Peng and Qi, 2006). Because the confidence intervals
based on the Normal approximation are shown to be superior in terms of empirical coverage
rates, we confine our analysis to the latter method.
The choice of the ‘tail sample size’ in the calculation of the Hill estimator is crucial, yet
13

Figure 1: Empirical coverage rates (Normal approximation method)
0 50 100 200
0.0
0.6
tail sample size
cove
rage
rat
e
normal, n=300
0 50 100 200
0.0
0.6
tail sample size
cove
rage
rat
e
t, n=300
0 50 100 200
0.0
0.6
tail sample size
cove
rage
rat
e
skewed t, n=300
0 50 100 200
0.0
0.6
tail sample size
cove
rage
rat
e
t, n=500
0 50 100 200
0.0
0.6
tail sample size
cove
rage
rat
et, n=500
0 50 100 200
0.0
0.6
tail sample size
cove
rage
rat
e
skewed t, n=500
0 50 100 200
0.0
0.6
tail sample size
cove
rage
rat
e
normal, n=5000
0 50 100 200
0.0
0.6
tail sample size
cove
rage
rat
e
t, n=1000
0 50 100 200
0.0
0.6
tail sample size
cove
rage
rat
e
skewed t, n=1000
0 200 400 600
0.0
0.6
tail sample size
cove
rage
rat
e
normal, n=5000
0 200 400 600
0.0
0.6
tail sample size
cove
rage
rat
e
t, n=5000
0 200 400 600
0.0
0.6
tail sample size
cove
rage
rat
e
skewed t, n=5000
for finite samples it is not clear how to choose it optimally; see for example Huisman et al.
(2001) for a discussion. In the simulations we avoid this problem by plotting the coverage rates
of the associated 90% confidence intervals as a function of the chosen tail sample size. How-
ever, we emphasize that the highest coverage rates found are only feasible when the optimal
tail sample size is known upfront, which is usually not the case in practice.
We follow Chan et al. (2007) by considering a pure GARCH model with parameters � D
.0; 0; 0; 1; 0:2; 0:3/, which we refer to as Case 3. We confine the simulations to the 1% VaR
for the reason given above and set the parameters of the t distributions to � D 3 and � D 1:5
14

(positive skewness). For these parameter settings the third part of Table 1 (captioned ‘Case
3’) provides confidence intervals based on the subsample bootstrap. The third part of Table 2
(captioned ‘Case 3’) reports the confidence intervals based on the conventional methods.
We first consider the Normal approximation method. The 90% confidence intervals based
on the latter approach depend strongly on the chosen tail sample size as becomes apparent
from Figure 1 (where the horizontal lines indicate the nominal coverage rate of 0.9). For the
Normal distribution there exists a tail sample size for which the coverage rate is virtually equal
to 0.9. However, for the skewed t distribution the optimal coverage rate falls below this level
regardless of the sample and tail sample sizes. Moreover, for this distribution the bias in the
coverage rates increases with the sample size. For n D 300, the highest empirical coverage rate
is 0.82, but for n D 5000 it is only 0.69 for any tail sample size larger than 10. Also for the
non-skewed t distribution the coverage rates do not exceed 0.8 in case of the largest sample
size. We explain the bias in the coverage rates from the VaR estimator’s asymptotic bias that is
ignored in the construction of the confidence interval. Another problem with the Hill estimator
is that the estimated tail index should be larger than 2 to ensure IE.z2t / < 1. For some tail
sample sizes this restriction is not fulfilled in certain simulation runs.
As before, the confidence intervals based on the residual subsample bootstrap have empir-
ical coverage rates close to the nominal level regardless of the error distribution, whereas the
conventional methods fail in case of a (skewed) t distribution. For example, for n D 300 and
the skewed t distribution, the conventional methods’ empirical coverage rates range between
0.61 and 0.68. For n D 5000, the coverage rates are somewhat better (0.70 – 0.76), but still far
from nominal.
5 Empirical application
In an application involving real-life data, this section compares the confidence intervals based
on the residual subsample bootstrap with the confidence intervals based on the conventional
methods and the Normal approximation method.
15

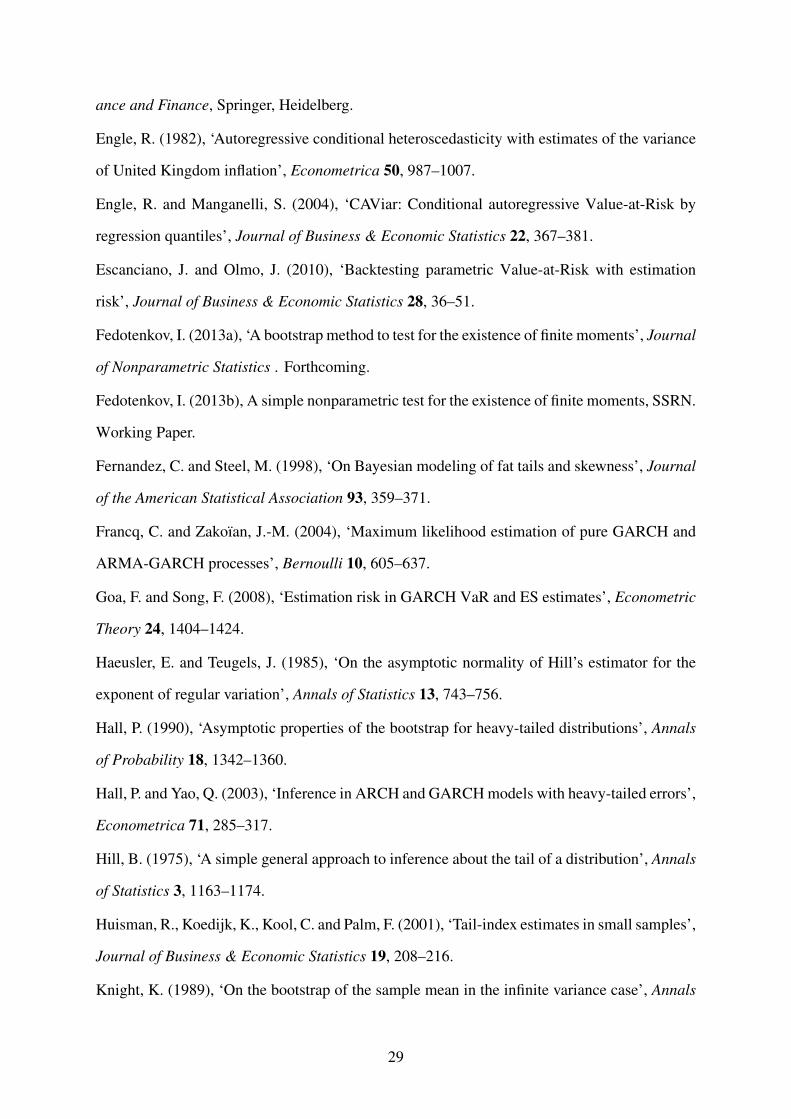
Figure 2: Returns on the SBMO stock (January 2, 2007 – April 24, 2013)
2007 2008 2009 2010 2011 2012 2013
−30
−20
−10
010
20
date
log
retu
rn o
n S
&P
GS
CI T
RI (
%)
5.1 Data
We consider continuously compounded daily returns for the stock SBM Offshore (SBMO),
listed on the NYSE Euronext Amsterdam. We calculate these returns from the stock prices
during the period January 1, 2007 – April 24, 2013. The data have been downloaded from
Datastream, where their mnemonic is H:SBMO. This results in a sample of 1647 daily returns.
Table 3 reports sample statistics for the full sample. The returns have a huge sample kurtosis
(15.5) and a negative sample skewness (�0:54). The presence of GARCH effects is visible
from Figure 2, where high (absolute) returns tend to be followed by more high returns and
low (absolute) returns tend to be followed by more low returns. This figure illustrates that
the SBMO stock has experienced several substantial price drops since the start of US subprime
crisis in 2007 and the subsequent global financial crisis that commenced with the fall of Lehman
Brothers in September 2008.
16

5.2 Model
We apply a rolling-window analysis that starts with the the period January 2, 2007 – December
30, 2011 and ends with the the period April 24, 2008 – April 23, 2013. For each of the 343
resulting rolling-windows periods (consisting of n D 1304 observations each), we estimate a
GARCH(1,1) model with constant expected returns (i.e., �t D �) by means of QML.
Table 3: Sample statistics for daily returns on the SBMO stock (January 2, 2007 – April 24, 2013)
%mean -0.04std.dev. 2.73skewness -0.54kurtosis 15.521% quantile -6.885% quantile -4.1510% quantile -2.8050% quantile 0.0090% quantile 2.6795% quantile 3.7299% quantile 7.01
The parameter estimates for the first rolling-window period are displayed in Table 4. As
usual, the sandwich estimator of Bollerslev and Wooldridge (1992) has been used to estimate
the corresponding covariance matrix, although the resulting standard errors rely on the possibly
incorrect assumption of asymptotic normality of the QML estimator. As often found for daily
returns, the volatility persistence is close to unity. The GARCH residuals’ lack of normality
becomes apparent from a Normal QQ-plot (available in the appendix), which shows that both
tails of the residual distribution are relatively heavy.
Several tests are available to assess the goodness-of-fit of an estimated ARMA-GARCH
model. The Ljung-Box test applied to the standardized returns is often used to test the null hy-
pothesis of no autocorrelation. Application of the same test to the squared standardized returns
yields a test for remaining GARCH effects (McLeod and Li, 1983). Furthermore, the Bera-
Jarque test applied to the standardized returns provides a way to test for normality. However,
17

Table 4: QML estimation results for GARCH(1,1) model
coeff. std.dev. t -value p-value� 0.125 0.069 1.830 0.067! 0.183 0.128 1.432 0.152˛ 0.137 0.073 1.861 0.063ˇ 0.847 0.071 11.907 0.000
Notes: A GARCH(1,1) model with constant expected returns � has been applied to the returns (in %) on theSBMO stock during the first rolling-window period (January 20, 2007 – December 30, 2011). The standarderrors, t -values and p-values are based on the robust covariance matrix (Bollerslev and Wooldridge, 1992).
when the fourth moment of the standardized results is not finite, these tests are no longer valid,
because they all involve the fourth moment of the standardized residuals. Although the tests
can always be performed from a technical point of view, their outcomes may be uninformative
or even misleading; the residuals’ sample fourth moment can show very erratic behavior when
the fourth moment does not exist.
Based on the foregoing, it is evident that our analysis could benefit from assessing the
finiteness of the standardized returns’ fourth moment and the shape of the VaR estimator’s
asymptotic distribution. Such an assessment will not only be informative about the validity of
the above tests, but will also provides guidance in deciding whether or not it is really necessary
to apply the subsample bootstrap. With no evidence against the VaR estimator’s asymptotic
normality, efficiency considerations make one of the conventional methods more attractive.
5.3 Finite fourth moments and asymptotic normality
An informal way of checking the finiteness of the fourth moment is by plotting the GARCH
residuals’ sample fourth moment over an expanding-window sample; i.e., by subsequently in-
creasing the number of observations used to calculate the sample fourth moment. This visual
approach was first suggested by Mandelbrot (1963); see Cont (2001). When the sample fourth
moment exists, the graph of the sample fourth moment as a function of the number of observa-
tions will almost surely converge to the theoretical moment; otherwise, it will not converge or
show erratic behavior. A related visual test has been proposed by Embrechts et al. (1997, p. 309-
18

310). For iid random variables X1; : : : ; Xn, a finite p-th moment is equivalent to Rn.p/a.s.! 0,
where Rn D .jX1jp C : : : ; jXnjp/=max.jX1jp; : : : ; jXnjp/. The strong convergence can be vi-
sually assessed by plotting Rn.p/ as a function of n over an expanding window. Two recent
tests for finite moments have been proposed by Fedotenkov (2013a,b). These nonparametric
tests are based on the strong law of large numbers that holds when the moment does not ex-
ist (Derman and Robbins, 1955) and can be used to test for the existence of finite moments
of arbitrary order. The strong consistency of the QML estimators (Francq and Zakoıan, 2004)
ensures that these four tests also apply to the ARMA-GARCH model residuals. A totally dif-
ferent way of testing the finiteness of the fourth moment is by estimating the tail index of the
model residuals using the Hill estimator. A distribution with tail index > k has a finite k-th
moment. Under certain assumptions the asymptotic distribution of O �1 is known (Haeusler and
Teugels, 1985) and permits the construction of an asymptotic confidence interval. Similarly to
the Normal approximation method of Chan et al. (2007), such a confidence interval is based on
the assumption that the asymptotic bias of the Hill estimator is zero.
We apply each of the five tests to the first rolling-window sample to investigate the exis-
tence of a finite fourth moment; the results for the other rolling-window periods are similar
and omitted to save space. Both the Mandelbrot and the Rn.4/ plots show extremely unstable
behavior for growing n; see Figures 3(a) and (b). The first of the two nonparametric tests pro-
posed by Fedotenkov (2013a,b) is based on a subsample bootstrap and yields a test statistic
equal to 0.078. When the fourth moment does not exist, the test converges almost surely to
0. The second test statistic converges to 1 in the absence of a finite fourth moment and has
a value of 0.923 when applied to the GARCH residuals. Both test statistics have values that
are close to the values that arise when the fourth moment is not finite. Moreover, both tests
are very robust to the choice of the underlying parameters, such as the size of the subsam-
ple that is required in the first test. For the first test we select, in the notation of Fedotenkov
(2013a), � D 0:99 and a subsample size of 0:4log .n/. For the second test we take, in the no-
tation of Fedotenkov (2013b), g.n/ Dp
log .log n/. The Hill estimator (with tail sample size
k1 D b1:5.log n/2c D 77) equals O �1 D 0:35 with 95% asymptotic confidence interval [0.28,
0.41], which does not contain values less than 0.25. We therefore reject the null hypothesis
19

Figu
re3:
Vis
ualt
ests
for
the
finite
ness
ofth
eG
AR
CH
-mod
eler
ror’
sfou
rth
mom
ent(
Janu
ary
2,20
07–
Dec
embe
r30
,201
1)
2007
2008
2009
2010
2011
2012
05101520
date
sample 4−th moment
(a)
Sam
ple
4−th
mom
ent
2007
2008
2009
2010
2011
2012
1234da
te
ratio of sample 4−th moment and max.(b)
Rat
io o
f sam
ple
4−th
mom
ent a
nd m
axim
um
20

H0 W �1 < 0:25 in favor of the alternative hypothesis H1 W �1 � 0:25. The selected tail
sample size k1 turned out to work well in our simulations with sample sizes less than 5000. It
is also the sample size recommended by Chan et al. (2007).
In the absence of a finite fourth moment asymptotic normality of the QML estimator is still
possible (Hall and Yao, 2003). As a robustness check, we therefore investigate the asymptotic
normality of the VaR estimator by means of the replicating histograms of Sherman and Carl-
stein (1996). This approach employs a (residual) subsample bootstrap to assess the shape of
a statistic’s sampling distribution. The replicating histogram is strongly consistent under weak
regularity conditions, which are virtually the same as the ones described in Section 3.1. In our
setting, the replicating histogram boils down to a histogram (or kernel density estimate) of the
residual subsample replicates e�"njnC1;1
; : : : ;e�"njnC1;B
.
Figure 4 shows a kernel-smoothed version of the replicating histogram for the VaR esti-
mate based on the first rolling-window period (for B D 10000 and `1 D 119). As explained by
Sherman and Carlstein (1996), only the shape of the replicating histogram is informative (e.g.,
symmetry versus skewness). For this reason the axes in Figure 4 have been left blank. The repli-
cating histogram shows a leptokurtic and negatively skewed distribution. With other subsample
sizes we find comparable non-Normal shapes. These results extend to the other rolling-window
samples.
All five moment tests cast doubt on the finiteness of the GARCH errors’ fourth moment,
while the replicating histogram indicates that the VaR estimator is likely to have a non-Normal
sampling distribution. We thus conclude that we most likely need the subsample bootstrap to
obtain confidence intervals with correct coverage. The results also imply that we cannot use the
usual tests to assess the goodness-of-fit of the GARCH model. The next section will instead
backtest the VaR estimates as a way of indirect goodness-of-fit testing.
5.4 VaR estimates
For each of the 343 rolling-window periods we estimate the 1% one-day ahead VaR using the
method of Section 2, as well as the approach of Chan et al. (2007). For the latter method we
employ again a tail sample size of k1 D 77 to calculate the Hill estimator.
21

Figure 4: Replicating histogram (January 2, 2007 – December 30, 2011)
Notes: We used the R-routine bkde in the KernSmooth library to create the kernel density plot, with thebandwidth determined by the dpik command from the same library. The selected bandwidth was h D 0:0012.
The estimates based on the method of Chan et al. (2007) are marginally different from
the VaR estimates obtained with the method of Section 2. The latter estimates base OQ"z in
Equation (7) on the empirical quantile of the standardized returns, whereas the VaR estimates
underlying the Normal approximation method derive OQ"z from the Hill estimator.
We count the number of times the equity returns fall below the 1% VaR point estimates (a
‘violation’). For the method of Section 2 and that of Chan et al. (2007), the 343 rolling-window
estimates result in four violations (which are all in 2012: January 11 and 24, April 10, and
November 15).
5.5 Backtesting
Formal tests of VaR estimates’ unconditional coverage have been suggested by Kupiec (1995)
and Christoffersen (1998). Obviously, these tests are based on a different definition of ‘cov-
erage’ as used in the previous sections, where the coverage rates of confidence intervals were
analyzed. As noticed by Escanciano and Olmo (2010), the asymptotic distribution of the above
tests is based on the assumption that the VaR estimate is equal to the true VaR (i.e., that there
22

is neither estimation nor model uncertainty). The two test statistics considered by Escanciano
and Olmo (2010) permit a test for correct unconditional coverage and a joint test for inde-
pendence of violations and correct unconditional coverage, respectively. The authors derive the
test statistics’ asymptotic distribution in the presence of estimation and model uncertainty. They
consider different forecasting schemes, including the rolling-window scheme that we also use.
They show that the assumption of neither model nor parameter uncertainty can result in mis-
leading test outcomes. Their adjusted test statistics are based on the assumption that the VaR
model’s parameter vector can be estimated by ap
n-consistent estimator (where n denotes the
sample size). They are not applicable to our setting, where the rate of convergence is unknown.
However, assuming that the data have been generated by a pure GARCH(1,1) model (i.e., we
assume a lack of model uncertainty), we can use the residual subsample bootstrap to derive
confidence intervals for the two test statistics used by Escanciano and Olmo (2010). The re-
sulting confidence intervals can be used to construct tests that explicitly account for parameter
uncertainty.
Throughout, we only consider the VaR estimates based on the method of Section 2. On
the basis of the test statistics’ confidence intervals, obtained with the subsample bootstrap,
we fail to reject the null hypothesis of correct unconditional coverage and the joint hypothe-
sis of independence of violations and correct unconditional coverage. We use the test statisticsPntDn�RC1 It;"=R (unconditional coverage) and
PntDn�RC2 It;"It�1;"=R (independence of vio-
lations) for R D 343 (the number of rolling-window samples). Here It;" is an indicator variable
indicating whether rt exceeds the corresponding rolling-window VaR estimate b�"t�1jt
. The test
statistics have values 0.0117 and 0.0000 and the confidence intervals based on the residual sub-
sample bootstrap with B D 10000 are [-0.0187, 0.0221] and [-0.0058, 0.0029]. The choice for
a pure GARCH(1,1) model thus seems reasonable.
5.6 Confidence intervals
We use the conventional method, the Normal approximation method, and the subsample boot-
strap to obtain confidence intervals. Figures 5(a) – (c) show the rolling-window point estimates
of the one-day ahead 1% VaR, together with a 90% point-wise confidence interval based on
23

Figu
re5:
Rol
ling-
win
dow
estim
ates
ofon
e-da
yah
ead
1%Va
Rw
ith90
%po
int-
wis
eco
nfide
nce
inte
rval
2012
2013
−40−30−20−1001020
date
log return (%)
(a)
Del
ta m
eth
od
2012
2013
−40−30−20−1001020
date
log return (%)
(b)
Par
amet
ric
bo
ots
trap
2012
2013
−40−30−20−1001020
date
log return (%)
(c)
Res
idu
al b
oo
tstr
ap
Not
es:
The
solid
blue
line
inth
ese
two
figur
essh
ows
the
rolli
ng-w
indo
wes
timat
esof
the
one-
day
ahea
d1%
VaR
(i.e
.,b �" tj
tC1).
The
blac
kso
lidlin
ein
dica
tes
the
retu
rns
on
the
SBM
Ost
ock
atda
ytC
1(i
.e.,
r tC
1),
allo
win
gfo
raco
mpa
riso
nbe
twee
nre
aliz
edre
turn
sr t
C1
and
b �" tjtC
1.T
heda
shed
red
lines
corr
espo
ndto
the
uppe
rand
low
erbo
unds
ofth
eas
soci
ated
90%
confi
denc
ein
terv
als.
24

Figu
re6:
Rol
ling-
win
dow
estim
ates
ofon
e-da
yah
ead
1%Va
Rw
ith90
%po
int-
wis
eco
nfide
nce
inte
rval
(con
tinue
d)
2012
2013
−20−1001020
date
log return (%)
(a)
No
rmal
ap
pro
xim
atio
n
2012
2013
−20−1001020da
te
log return (%)
(b)
Su
bsa
mp
le b
oo
tstr
ap
Not
es:
The
solid
blue
line
inth
ese
two
figur
essh
ows
the
rolli
ng-w
indo
wes
timat
esof
the
one-
day
ahea
d1%
VaR
(i.e
.,b �" tj
tC1).
The
blac
kso
lidlin
ein
dica
tes
the
retu
rns
onth
eSB
MO
stoc
kat
day
tC
1(i
.e.,
r tC
1).
The
dash
edre
dlin
esco
rres
pond
toth
eup
pera
ndlo
wer
boun
dsof
the
asso
ciat
ed90
%co
nfide
nce
inte
rval
s.
25

the Delta method, the parametric bootstrap and the residual bootstrap, respectively. Also the
realized returns on the SBMO stock are displayed in the figure. In Figures 6(a) and (b) the
same is done the Normal approximation method and the residual subsample bootstrap (with
B D 10000 and subsample size `1 D 119), respectively.
The confidence intervals based on the parametric and residual bootstraps and the Normal
approximation method indicate reasonable accuracy of the VaR point estimates. By contrast,
the Delta method yields relatively wide intervals for some rolling-window intervals; often even
wider than those based on the residual subsample bootstrap.
Because the GARCH errors are likely to lack a finite fourth moment (thus casting severe
doubt on the asymptotic normality of the QML estimator), we prefer the confidence intervals
based on the residual subsample bootstrap over the conventional methods. Furthermore, the
Hill estimator’s potential bias, in addition to its sensitivity to the choice of the tail sample size,
make us prefer the residual subsample bootstrap over the Normal approximation method.
For risk management purposes, it is important to realize that the VaR estimates’ distribution
is subject to substantial estimation uncertainty as shown in Figure 6(b). For example, when a
VaR estimate is used to set a capital reserve, additional capital on top of the VaR estimate may
be required to deal with the underlying estimation uncertainty.
6 Conclusions
When the fourth moment of the ARMA-GARCH model errors is not finite, the asymptotic dis-
tribution of the QML estimator may not be normal and the conventional methods for obtaining
confidence intervals for VaR estimates are likely to fail. There are ways to obtain confidence
intervals under additional distributional assumptions, but such methods incur the risk of mis-
specification.
We propose a residual subsample bootstrap to obtain confidence intervals for QML-based
ARMA-GARCH VaR estimates. This approach imposes minimal regularity conditions and al-
lows for heavy-tailed or skewed distributions, with or without a finite fourth moment. Simu-
lations show that the residual subsample bootstrap, based on rule-of-thumb subsample sizes,
26

yields confidence intervals with correct coverage for a wide range of specifications, but par-
ticularly when conventional methods fail due to a lack of asymptotic normality of the QML
estimators. The residual subsample bootstrap also performs well in comparison with the Nor-
mal approximation approach; another method that does not rely on the asymptotic normality of
the QML estimator. The latter method turns out sensitive to the tail sample size used to calculate
the Hill estimator and can only be used to obtain extreme quantiles. Furthermore, the Normal
approximation method assumes that the Hill estimator is unbiased, which does not have to be
the case in practice.
The practical relevance of the residual subsample bootstrap becomes apparent when we
estimate VaR for heavy-tailed and skewed stock returns. Several tests find evidence against
a finite fourth moment of the GARCH errors. We therefore resort to the residual subsample
bootstrap to obtain confidence intervals and show that the confidence intervals based on the
latter approach differ substantially from those obtained with the conventional methods and the
Normal approximation method.
Although the residual subsample bootstrap is also consistent when the ARMA-GARCH
model errors have a finite fourth moment, application of the subsample bootstrap in such a case
will yield relatively wide confidence intervals. This is the price that has to be paid for the om-
nibus nature of the residual subsample bootstrap. To avoid such inefficiencies, we recommend
some simple tests to assess the finiteness of the model errors’ fourth moment and the shape of
the VaR estimator’s asymptotic distribution.
The approach proposed in this study can be extended to multi-period VaR estimates and
other risk measures such as expected shortfall. We leave this as a topic for future research.
Acknowledgements
The author is grateful to Edward Carlstein, Ruud Koning, Michael Sherman, and Tom Wans-
beek for useful comments and suggestions. The usual disclaimer applies.
27

References
Athreya, K. (1987a), Bootstrap of the mean in the infinite variance case, in Y. Prohorov and
V. Sazonov, eds, ‘Proceedings of the First World Congress of the Bernoulli Society’, Vol. 5,
VNU Science Press, Utrecht, The Netherlands, pp. 95–98.
Athreya, K. (1987b), ‘Bootstrap of the mean in the infinite variance case’, Annals of Statistics
15, 724–731.
Bertail, P., Politis, D. and Romano, J. (1999), ‘On subsampling estimators with unknown rate
of convergence’, Journal of the American Statistical Association 94, 569–579.
Bollerslev, T. (1986), ‘Generalized autoregressive conditional heteroskedasticity’, Journal of
Econometrics 31, 307–327.
Bollerslev, T. and Wooldridge, J. (1992), ‘Quasi maximum likelihood estimation and inference
in dynamic models with time varying covariances’, Econometric Reviews 11, 143–172.
Chan, N., Deng, S.-J., Peng, L. and Xia, Z. (2007), ‘Interval estimation of Value-at-Risk based
on GARCH models with heavy-tailed innovations’, Journal of Econometrics 137, 556–576.
Christoffersen, P. (1998), ‘Evaluating interval forecasts’, International Economic Review
39, 841–862.
Christoffersen, P. and Goncalves, S. (2005), ‘Estimation risk in financial risk management’,
Journal of Risk 7, 1–28.
Cont, R. (2001), ‘Empirical properties of asset returns: stylized facts and statistical issues’,
Quantitative Finance 1, 223–226.
Derman, C. and Robbins, H. (1955), ‘The strong law of large numbers when the first moment
does not exist’, Proceedings of the National Academy of Statistics 41, 586–587.
Dowd, K. (2002), Measuring Market Risk, Wiley, Chichester, UK.
Duan, J. (2004), ‘Maximum likelihood estimation using price data of the derivative contract’,
Mathematical Finance 4, 155–167.
Efron, B. and Tribshirani, R. (1993), An Introduction to the Bootstrap. Monographs on Statis-
tics and Applied Probability 57, Chapman & Hall, New York.
Embrechts, P., Kluppelberg, C. and Mikosh, T. (1997), Modelling Extremal Events: For Insur-
28
ance and Finance, Springer, Heidelberg.
Engle, R. (1982), ‘Autoregressive conditional heteroscedasticity with estimates of the variance
of United Kingdom inflation’, Econometrica 50, 987–1007.
Engle, R. and Manganelli, S. (2004), ‘CAViar: Conditional autoregressive Value-at-Risk by
regression quantiles’, Journal of Business & Economic Statistics 22, 367–381.
Escanciano, J. and Olmo, J. (2010), ‘Backtesting parametric Value-at-Risk with estimation
risk’, Journal of Business & Economic Statistics 28, 36–51.
Fedotenkov, I. (2013a), ‘A bootstrap method to test for the existence of finite moments’, Journal
of Nonparametric Statistics . Forthcoming.
Fedotenkov, I. (2013b), A simple nonparametric test for the existence of finite moments, SSRN.
Working Paper.
Fernandez, C. and Steel, M. (1998), ‘On Bayesian modeling of fat tails and skewness’, Journal
of the American Statistical Association 93, 359–371.
Francq, C. and Zakoıan, J.-M. (2004), ‘Maximum likelihood estimation of pure GARCH and
ARMA-GARCH processes’, Bernoulli 10, 605–637.
Goa, F. and Song, F. (2008), ‘Estimation risk in GARCH VaR and ES estimates’, Econometric
Theory 24, 1404–1424.
Haeusler, E. and Teugels, J. (1985), ‘On the asymptotic normality of Hill’s estimator for the
exponent of regular variation’, Annals of Statistics 13, 743–756.
Hall, P. (1990), ‘Asymptotic properties of the bootstrap for heavy-tailed distributions’, Annals
of Probability 18, 1342–1360.
Hall, P. and Yao, Q. (2003), ‘Inference in ARCH and GARCH models with heavy-tailed errors’,
Econometrica 71, 285–317.
Hill, B. (1975), ‘A simple general approach to inference about the tail of a distribution’, Annals
of Statistics 3, 1163–1174.
Huisman, R., Koedijk, K., Kool, C. and Palm, F. (2001), ‘Tail-index estimates in small samples’,
Journal of Business & Economic Statistics 19, 208–216.
Knight, K. (1989), ‘On the bootstrap of the sample mean in the infinite variance case’, Annals
29

of Statistics 17, 1168–1175.
Koenker, R. and Xiao, Z. (2006), ‘Quantile autoregression’, Journal of the American Statistical
Association 101, 980–990.
Kupiec, P. (1995), ‘Techniques for verifying the accuracy of risk measurement models’, Journal
of Derivatives 3, 73–84.
Mammen, E. (1992), When does bootstrap work? Asymptotic results and simulations, Lecture
Notes in Statistics 77, Springer, New York.
Mandelbrot, B. (1963), ‘The variation of certain speculative prices’, Journal of Business
36, 394–419.
McLeod, A. and Li, W. (1983), ‘Diagnostic checking ARMA time series models using squared-
residual autocorrelations’, Journal of Time Series Analysis 4, 269–273.
McNeil, A. and Frey, R. (2000), ‘Estimation of tail-related risk measures for heteroscedastic
financial time series: An extreme value approach’, Journal of Empirical Finance 7, 271–300.
Pagan, A. (1996), ‘The econometrics of financial markets’, Journal of Empirical Finance 3, 15–
102.
Peng, L. and Qi, L. (2006), ‘Confidence regions for high quantiles of a heavy tailed distribu-
tion’, Annals of Statistics 34, 1964–1986.
Politis, D. and Romano, J. (1994), ‘Large-sample confidence regions based on subsamples
under minimal assumptions’, Annals of Statistics 22, 2031–2050.
Sandstrom, A. (2011), Handbook of Solvency for Actuaries and Risk Managers: Theory and
Practice, Chapman & Hall/CRC Finance, Boca Raton.
Sherman, M. and Carlstein, E. (1996), ‘Replicating histograms’, Journal of the American Sta-
tistical Association 91, 566–576.
Sherman, M. and Carlstein, E. (2004), ‘Confidence intervals based on estimators with unknown
rates of convergence’, Computational Statistics & Data Analysis 46, 123–139.
30


![Analysis of Systemic Risk: A Vine Copula- based ARMA-GARCH … · ARCH model to the generalized ARCH (GARCH) model. Chen and Khashanah [5] implemented ARMA (p, q)-GARCH (1, 1) with](https://img.pdfslide.net/doc/110x75/5accda217f8b9aad468d2abd/analysis-of-systemic-risk-a-vine-copula-based-arma-garch-model-to-the-generalized.jpg)