Embed Size (px)
Citation preview
CONDENSEDINTERIM FINANCIAL
INFORMATIONFor the 3rd Quarter Ended
30 June 2018(Un-audited)
THALINDUSTRIESTHALINDUSTRIES
1
C o n t e n t s
Company Information 2
Directors’ Review 4
Condensed Interim Statement of Financial Position 8
Condensed Interim Profit and Loss Account 10
Condensed Interim Statement of Comprehensive Income 11
Condensed Interim Cash Flow Statement 12
Condensed Interim Statement of Changes in Equity 13
Selected Notes to the Condensed Interim Financial Information 14
2
Company Information
BOARD OF DIRECTORS CHAIRPERSON
Mrs. Qaiser Shamim Khan
CHIEF EXECUTIVE
Mr. Muhammad Shamim Khan MANAGING DIRECTOR
Mr. Nauman Ahmed Khan DIRECTORS
Mr. Muhammad Shamim Khan (Director) Mrs. Qaiser Shamim Khan (Director) Mr. Nauman Ahmed Khan (Director) Mr. Adnan Ahmed Khan (Director) Mr. Muhammad Khan (Director) Mr. Muhammad Ashraf Khan Durani (Independent Director) Mr. Rab Nawaz (Independent Director) AUDIT COMMITTEE Mr. Muhammad Ashraf Khan Durani (Chairman) Mrs. Qaiser Shamim Khan (Member) Mr. Adnan Ahmed Khan (Member) HUMAN RESOURCE & Mr. Rab Nawaz (Chairman/Member)REMUNERATION Mr. Adnan Ahmed Khan (Member)COMMITTEE Mr. Muhammad Khan (Member) CHIEF FINANCIAL OFFICER Mr. Hafiz Muhammad Arif COMPANY SECRETARY Mr. Wasif Mahmood AUDITORS M/s. Rahman Sarfaraz Rahim Iqbal Rafiq Chartered Accountants, Lahore LEGAL ADVISOR Mr. Shehzad Ata Elahi, Advocate Ch. Altaf Hussain Advocate BANKERS Albaraka Bank Pakistan Limited Allied Bank Limited Askari Bank Limited Bank Al-Habib Limited Bank Alfalah Limited Faysal Bank Limited Habib Bank Limited Habid Metropolitan Bank Limited MCB Bank Limited MCB Islamic Bank Limited Meezan Bank Limited Standard Chartered Bank (Pakistan) Limited Soneri Bank Limited The Bank of Punjab United Bank Limited
3
SHARE REGISTRAR M/s. CORPLINK (Pvt) Ltd Wings Arcade, 1-K- Commercial Model Town, Lahore Tel: 042-35839182, 35887262 Fax: 042-35869037 REGISTERED OFFICE 23- Pir Khurshid Colony Gulgasht, Multan Tel: 061-6524621, 6524675 Fax: 061-6524675 LAHORE OFFICE 2-D-1 Gulberg-III, Lahore – 54600 Tel: 042-35771066-71 Fax: 042-35771175 FACTORY ADDRESSES Unit 1: Layyah Sugar Mills, Layyah Tel: 0606-411981-4, 0606-410014 Fax: 0606-411284 Unit 2: Safina Sugar Mills, Lalian District Chinniot. Tel: 047-6610011-6 Fax: 047-6610010 WEBSITE www.thalindustries.com
4
Directors’ Review
The Directors of your Company are pleased to present the Un-Audited Accounts of the Company for the 3rd quarter / nine months period ended 30th June 2018.
INDUSTRY OVERVIEW
Last year’s per acre yield of cane crop was much better and healthy. It induced the growers to keep the ratoon crop instead of uprooting. This might contribute to lower per acre yield this year balanced by higher cultivated area. At a country level, we again have a bumper cane crop this year and high sugar production in the country.
Despite expectation of surplus sugar production in the local and international markets, the sugarcane minimum price was maintained by the Punjab Government at Rs. 180/- per mound for the crushing season 2017-18, whereas the Sindh Government notified the cane price at Rs. 182/- per mound later on reduced to Rs 160/- per mound consequent to sugar mills writ in Honourable Sindh High Court.
Federal Government has announced an export subsidy of maximum Rs. 10.70/- per Kg with certain conditions of sugar prices in international market, even then it will be difficult for the industry to maintain its financial strength this year because national and international sugar prices are at a minimum level. Additionally Suo Moto by Hon’ble Supreme Court of Pakistan regarding immediate clearance of cane grower’s dues within vert short span of time put extreme liquidity pressure on all sugar mills of the country and forced to sell sugar at further lower prices.
OPERATING HIGHLIGHTS
The Company was able to crush 2,697,755 M. Tons sugarcane and produced 260,788.300 M. Tons white refined sugar at an average recovery of 9.672% during the current crushing season as compared to last year’s sugarcane crushing of 2,869,699 M. Tons and production of 279,307.850 M. Tons white refined sugar at an average recovery of 9.736%. The reason for low production in the current year is mainly due to the late start of the crushing season and drop in average recovery in the region. Company was able to achieve its target of COD (Commercial Operation Date) in the start of December for 20 MW Power Project at its Layyah plant, which is a milestone to be proud of.
Net sales was recorded at Rs. 10,973.483 million during the nine months period from 1st October-2017 to 30th June-2018 as compared to Rs. 11,924.606 million against the corresponding period of last year. Net sales declined mainly due to lower sales volume and lowest sugar prices in local & international market.
Due to higher sugarcane cost and sharp decrease in sugar & molasses prices Company suffered after tax loss of Rs. (51.674) million against after tax profit of Rs. 825.913 million over the same period of last year. Moreover, sugar sales tax fixed at higher price by the Government as compared to its actual market prices had also adversely affected the profitability.
The period under review can be considered as the worst period in sugar industry history when high sugar cane cost, bumper crop, stocks carry over situation and lowest sugar prices in local and International market. In this adverse circumstances, the survival of sugar industry will only be dependent on completion of 2.0 million tons sugar export already approved by federal Government. Your Company sustained insignificant losses only due to sale of electricity to Central
5
Power Purchasing Agency (Guarantee) Ltd (CPPAGL) from newly completed power project under policy of upfront tariff.
Efforts of everyone associated with the company must be appreciated for extracting value from investment of past few years at a time when the company needed it very much.
All out efforts are being made to increase the production and profitability of the company through process efficiency, installing modern and latest technology equipment, reducing production cost due to close supervision, developing good quality cane, by providing the latest improved seed varieties, fertilizer, pesticides etc. and facilitating the cane growers constantly, which ultimately will result in higher sugar recovery and also provide financial benefit to the cane growers.
FUTURE OUTLOOK
It is evident that due to bumper cane crop in 2017-18 at a country level. Despite reports of lower sugar recoveries from mills across the country in the start of the crushing season there was surplus sugar production over annual requirement like last year.
We believe that a surplus production of sugar have resulted in further pressure on local sugar prices which have already touched its minimum level of the last three years. The sugar prices in the international market are also at historically low levels. This scenario is ultimately bound to convert the profitability of the sugar industry into loss and may become a survival issue for many of the sugar companies in the country. The only viable financial outcome is to export 100% quantity approved by Federal Government, otherwise all indications and to date estimates clearly indicate that the financial situation for sugar mills will remain very challenging in future.
Power export from a bagasse based power plant and installation of FFEs is expected to have a material impact on the company’s financial position, which will strengthen our ability to fight in the upcoming competitive, challenging, and tough economic climate.
ACKNOWLEDGEMENT
The Board would like to record their appreciation for the efforts and devotion of all the company’s employees and hope they will continue their contribution towards the enhancement of productivity and well-being of the company in the future as well. The board also wishes to thank the financial institutions, farmers and all stakeholders associated with the company for their support and cooperation.
For and on behalf of the Board
MUHAMMAD SHAMIM KHANLAHORE: 23 July 2018 Chief Executive
6
7
8
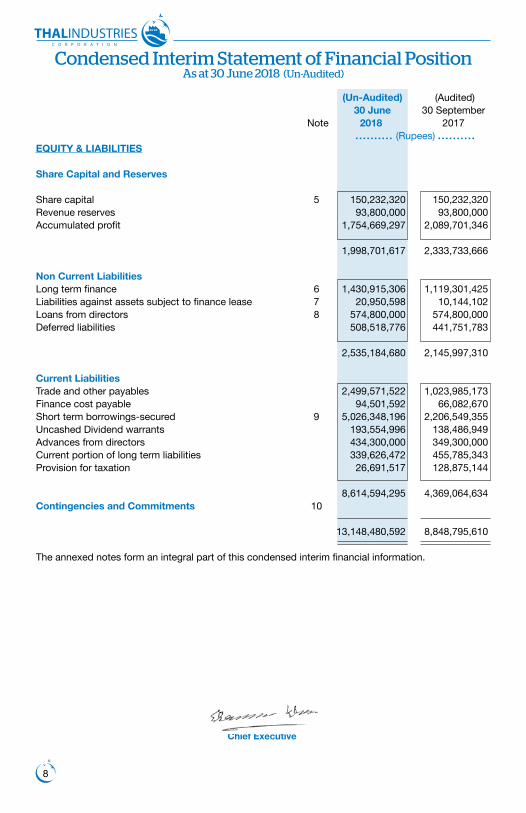
Condensed Interim Statement of Financial PositionAs at 30 June 2018 (Un-Audited)
(Un-Audited) (Audited) 30 June 30 September Note 2018 2017 . . . . . . . . . . (Rupees) . . . . . . . . . .EQUITY & LIABILITIES
Share Capital and Reserves
Share capital 5 150,232,320 150,232,320 Revenue reserves 93,800,000 93,800,000 Accumulated profit 1,754,669,297 2,089,701,346
1,998,701,617 2,333,733,666 Non Current Liabilities Long term finance 6 1,430,915,306 1,119,301,425 Liabilities against assets subject to finance lease 7 20,950,598 10,144,102 Loans from directors 8 574,800,000 574,800,000 Deferred liabilities 508,518,776 441,751,783
2,535,184,680 2,145,997,310 Current Liabilities Trade and other payables 2,499,571,522 1,023,985,173 Finance cost payable 94,501,592 66,082,670 Short term borrowings-secured 9 5,026,348,196 2,206,549,355 Uncashed Dividend warrants 193,554,996 138,486,949 Advances from directors 434,300,000 349,300,000 Current portion of long term liabilities 339,626,472 455,785,343 Provision for taxation 26,691,517 128,875,144
8,614,594,295 4,369,064,634 Contingencies and Commitments 10 13,148,480,592 8,848,795,610 The annexed notes form an integral part of this condensed interim financial information.
Chief Executive
9
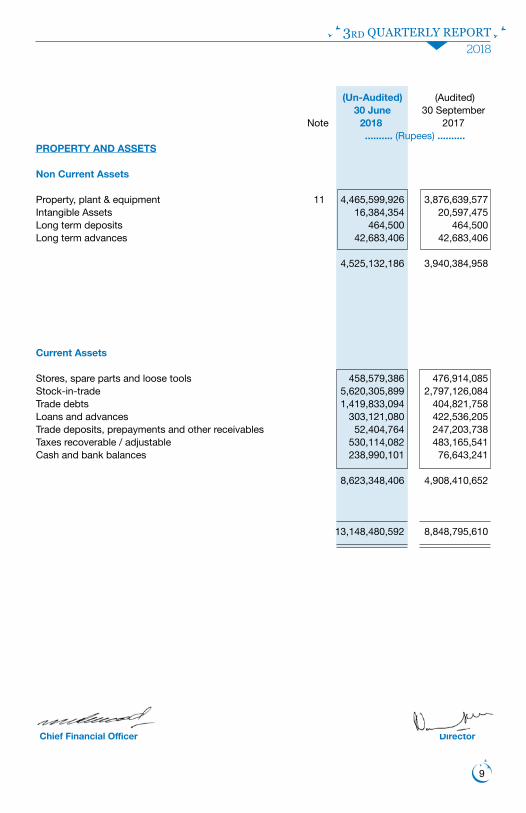
(Un-Audited) (Audited) 30 June 30 September Note 2018 2017 .......... (Rupees) ..........PROPERTY AND ASSETS
Non Current Assets
Property, plant & equipment 11 4,465,599,926 3,876,639,577 Intangible Assets 16,384,354 20,597,475 Long term deposits 464,500 464,500 Long term advances 42,683,406 42,683,406
4,525,132,186 3,940,384,958 Current Assets Stores, spare parts and loose tools 458,579,386 476,914,085 Stock-in-trade 5,620,305,899 2,797,126,084 Trade debts 1,419,833,094 404,821,758 Loans and advances 303,121,080 422,536,205 Trade deposits, prepayments and other receivables 52,404,764 247,203,738 Taxes recoverable / adjustable 530,114,082 483,165,541 Cash and bank balances 238,990,101 76,643,241
8,623,348,406 4,908,410,652 13,148,480,592 8,848,795,610
Chief Financial Officer Director
10
Condensed Interim Profit and Loss Account For the Period Ended 30 June 2018 (Un-Audited)
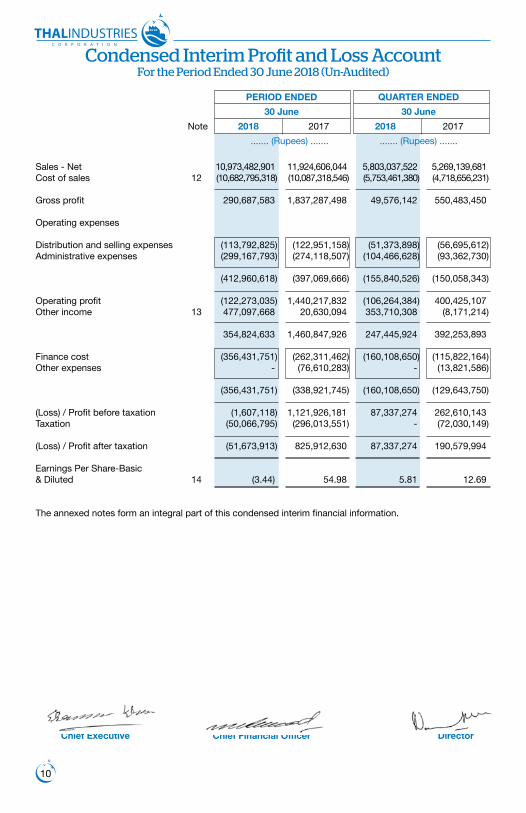
PERIOD ENDED QUARTER ENDED 30 June 30 June Note 2018 2017 2018 2017 ....... (Rupees) ....... ....... (Rupees) ....... Sales - Net 10,973,482,901 11,924,606,044 5,803,037,522 5,269,139,681Cost of sales 12 (10,682,795,318) (10,087,318,546) (5,753,461,380) (4,718,656,231)
Gross profit 290,687,583 1,837,287,498 49,576,142 550,483,450 Operating expenses Distribution and selling expenses (113,792,825) (122,951,158) (51,373,898) (56,695,612)Administrative expenses (299,167,793) (274,118,507) (104,466,628) (93,362,730)
(412,960,618) (397,069,666) (155,840,526) (150,058,343)
Operating profit (122,273,035) 1,440,217,832 (106,264,384) 400,425,107 Other income 13 477,097,668 20,630,094 353,710,308 (8,171,214)
354,824,633 1,460,847,926 247,445,924 392,253,893 Finance cost (356,431,751) (262,311,462) (160,108,650) (115,822,164)Other expenses - (76,610,283) - (13,821,586)
(356,431,751) (338,921,745) (160,108,650) (129,643,750)
(Loss) / Profit before taxation (1,607,118) 1,121,926,181 87,337,274 262,610,143 Taxation (50,066,795) (296,013,551) - (72,030,149)
(Loss) / Profit after taxation (51,673,913) 825,912,630 87,337,274 190,579,994 Earnings Per Share-Basic & Diluted 14 (3.44) 54.98 5.81 12.69 The annexed notes form an integral part of this condensed interim financial information.
Chief Executive Chief Financial Officer Director
11
Condensed Interim Statement of Comprehensive Income
For the Period Ended 30 June 2018 (Un-Audited)
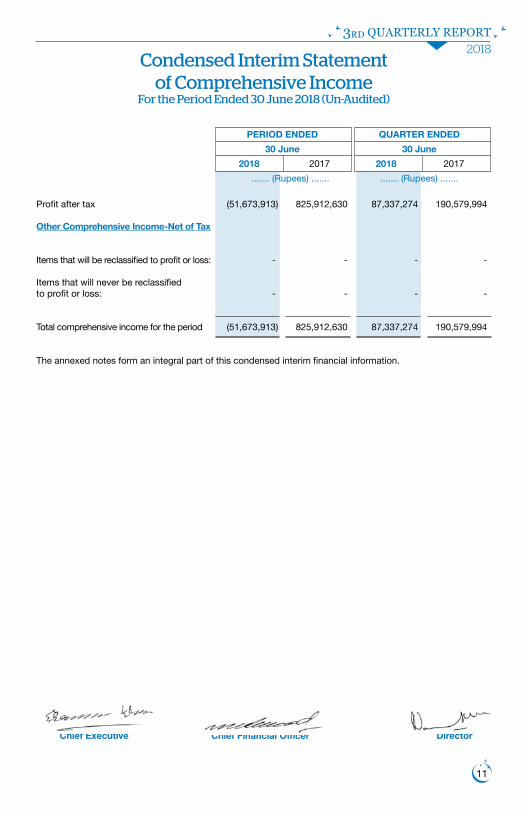
PERIOD ENDED QUARTER ENDED 30 June 30 June 2018 2017 2018 2017 ....... (Rupees) ....... ....... (Rupees) ....... Profit after tax (51,673,913) 825,912,630 87,337,274 190,579,994 Other Comprehensive Income-Net of Tax Items that will be reclassified to profit or loss: - - - - Items that will never be reclassified to profit or loss: - - - - Total comprehensive income for the period (51,673,913) 825,912,630 87,337,274 190,579,994 The annexed notes form an integral part of this condensed interim financial information.
Chief Executive Chief Financial Officer Director
12
Condensed Interim Cash Flow Statement
For the Period Ended 30 June 2018 (Un-Audited)
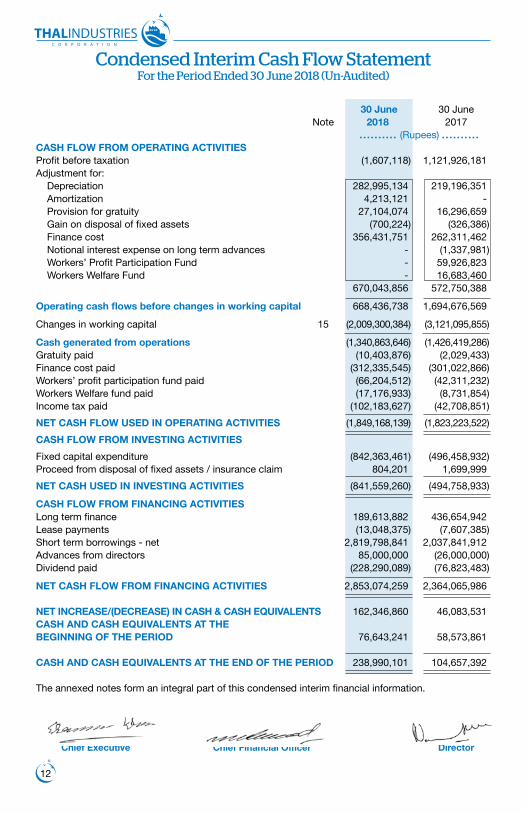
30 June 30 June Note 2018 2017 . . . . . . . . . . (Rupees) . . . . . . . . . .CASH FLOW FROM OPERATING ACTIVITIES Profit before taxation (1,607,118) 1,121,926,181 Adjustment for: Depreciation 282,995,134 219,196,351 Amortization 4,213,121 - Provision for gratuity 27,104,074 16,296,659 Gain on disposal of fixed assets (700,224) (326,386) Finance cost 356,431,751 262,311,462 Notional interest expense on long term advances - (1,337,981) Workers’ Profit Participation Fund - 59,926,823 Workers Welfare Fund - 16,683,460 670,043,856 572,750,388
Operating cash flows before changes in working capital 668,436,738 1,694,676,569
Changes in working capital 15 (2,009,300,384) (3,121,095,855)
Cash generated from operations (1,340,863,646) (1,426,419,286)Gratuity paid (10,403,876) (2,029,433)Finance cost paid (312,335,545) (301,022,866)Workers’ profit participation fund paid (66,204,512) (42,311,232)Workers Welfare fund paid (17,176,933) (8,731,854)Income tax paid (102,183,627) (42,708,851)NET CASH FLOW USED IN OPERATING ACTIVITIES (1,849,168,139) (1,823,223,522)CASH FLOW FROM INVESTING ACTIVITIES Fixed capital expenditure (842,363,461) (496,458,932)Proceed from disposal of fixed assets / insurance claim 804,201 1,699,999NET CASH USED IN INVESTING ACTIVITIES (841,559,260) (494,758,933)
CASH FLOW FROM FINANCING ACTIVITIES Long term finance 189,613,882 436,654,942Lease payments (13,048,375) (7,607,385)Short term borrowings - net 2,819,798,841 2,037,841,912 Advances from directors 85,000,000 (26,000,000)Dividend paid (228,290,089) (76,823,483)
NET CASH FLOW FROM FINANCING ACTIVITIES 2,853,074,259 2,364,065,986 NET INCREASE/(DECREASE) IN CASH & CASH EQUIVALENTS 162,346,860 46,083,531 CASH AND CASH EQUIVALENTS AT THE BEGINNING OF THE PERIOD 76,643,241 58,573,861
CASH AND CASH EQUIVALENTS AT THE END OF THE PERIOD 238,990,101 104,657,392 The annexed notes form an integral part of this condensed interim financial information.
Chief Executive Chief Financial Officer Director
13
Share General Accumulated Total Particular Capital Reserves Profit (Rupees) (Rupees) (Rupees) (Rupees)
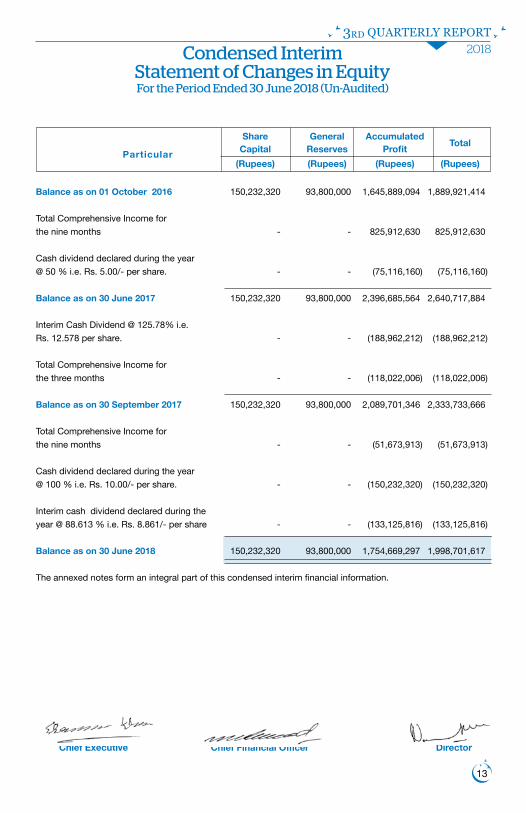
Balance as on 01 October 2016 150,232,320 93,800,000 1,645,889,094 1,889,921,414 Total Comprehensive Income for the nine months - - 825,912,630 825,912,630 Cash dividend declared during the year @ 50 % i.e. Rs. 5.00/- per share. - - (75,116,160) (75,116,160) Balance as on 30 June 2017 150,232,320 93,800,000 2,396,685,564 2,640,717,884 Interim Cash Dividend @ 125.78% i.e. Rs. 12.578 per share. - - (188,962,212) (188,962,212) Total Comprehensive Income for the three months - - (118,022,006) (118,022,006) Balance as on 30 September 2017 150,232,320 93,800,000 2,089,701,346 2,333,733,666 Total Comprehensive Income for the nine months - - (51,673,913) (51,673,913) Cash dividend declared during the year @ 100 % i.e. Rs. 10.00/- per share. - - (150,232,320) (150,232,320) Interim cash dividend declared during the year @ 88.613 % i.e. Rs. 8.861/- per share - - (133,125,816) (133,125,816) Balance as on 30 June 2018 150,232,320 93,800,000 1,754,669,297 1,998,701,617 The annexed notes form an integral part of this condensed interim financial information.
Condensed Interim Statement of Changes in Equity For the Period Ended 30 June 2018 (Un-Audited)
Chief Executive Chief Financial Officer Director
14
Selected Notes to the Condensed Interim Financial Information
For the Period Ended 30 June 2018 (Un-Audited)
1. STATUS AND ACTIVITIES The Thal Industries Corporation Limited (Company) was incorporated in Pakistan on 07 September
1953 under The Companies Act, 1913 (Now Companies Act, 2017) as public company limited by shares. Its shares are quoted on Pakistan stock exchange in Pakistan. Its registered office is situated at 23-Pir Khurshid Colony, Gulgusht, Multan. The Company is principally engaged in production and sale of refined sugar and its by-products.
2. BASIS OF PREPARATION The condensed interim financial information is not audited and has been presented in condensed
form and does not include all the information as is required to be provided in a full set of annual financial statements. This condensed interim financial information should be read in conjunction with the audited financial statements of the company for the year ended 30 September 2017.
The comparative figures as at 30 September 2017 in the condensed interim statement of financial
position and the related notes to the condensed interim financial information are based on audited financial statements. The comparative condensed interim profit & loss account, condensed interim cash flow statement, condensed interim statement of changes in equity and related notes to the condensed interim financial information for the nine months period ended 30 June 2017 are based on un-audited/un-reviewed condensed interim financial information. The condensed interim profit & loss account and condensed interim statement of other comprehensive income for the quarters ended 30 June 2018 and 30 June 2017 are neither audited nor reviewed.
3. STATEMENT OF COMPLIANCE This condensed interim financial information of the company for the nine months period ended 30
June 2018 has been prepared in accordance with the requirements of the International Accounting Standard -34 “Interim Financial Reporting” and provisions of and directives issued under the Companies Act, 2017. In case where requirements differ, the provisions of or directives issued under the Companies Act, 2017 have been followed.
4. ACCOUNTING POLICIES 4.1 The accounting policies and the methods of computation adopted in the preparation of this
condensed interim financial information are the same as those applied in the preparation of the financial statements for the year ended 30 September 2017.
4.2 Previous period’s figures are re-arranged / re-classified where necessary to facilitate comparison
and are rounded off to the nearest rupee; appropriate disclosure is given in relevant note in case of material rearrangement.
15
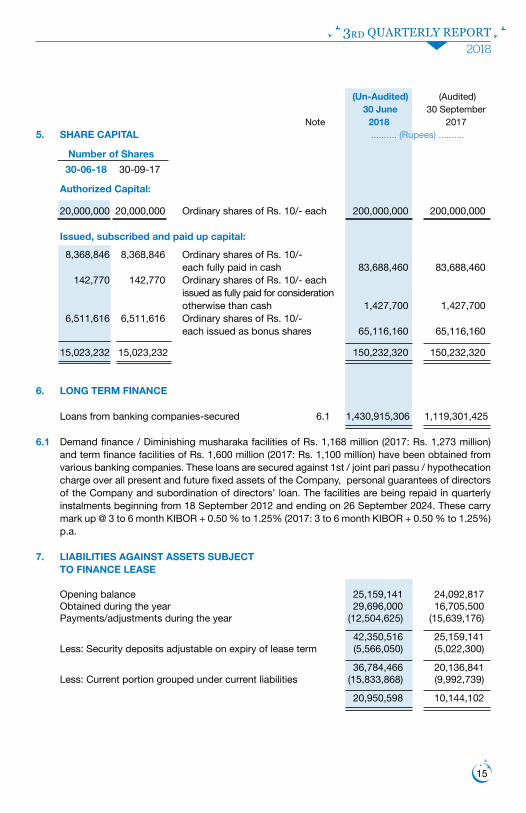
(Un-Audited) (Audited) 30 June 30 September Note 2018 20175. SHARE CAPITAL .......... (Rupees) ..........
Number of Shares 30-06-18 30-09-17
Authorized Capital:
20,000,000 20,000,000 Ordinary shares of Rs. 10/- each 200,000,000 200,000,000 Issued, subscribed and paid up capital:
8,368,846 8,368,846 Ordinary shares of Rs. 10/- each fully paid in cash 83,688,460 83,688,460 142,770 142,770 Ordinary shares of Rs. 10/- each issued as fully paid for consideration otherwise than cash 1,427,700 1,427,700 6,511,616 6,511,616 Ordinary shares of Rs. 10/- each issued as bonus shares 65,116,160 65,116,160
15,023,232 15,023,232 150,232,320 150,232,320
6. LONG TERM FINANCE Loans from banking companies-secured 6.1 1,430,915,306 1,119,301,425 6.1 Demand finance / Diminishing musharaka facilities of Rs. 1,168 million (2017: Rs. 1,273 million)
and term finance facilities of Rs. 1,600 million (2017: Rs. 1,100 million) have been obtained from various banking companies. These loans are secured against 1st / joint pari passu / hypothecation charge over all present and future fixed assets of the Company, personal guarantees of directors of the Company and subordination of directors’ loan. The facilities are being repaid in quarterly instalments beginning from 18 September 2012 and ending on 26 September 2024. These carry mark up @ 3 to 6 month KIBOR + 0.50 % to 1.25% (2017: 3 to 6 month KIBOR + 0.50 % to 1.25%) p.a.
7. LIABILITIES AGAINST ASSETS SUBJECT TO FINANCE LEASE Opening balance 25,159,141 24,092,817 Obtained during the year 29,696,000 16,705,500 Payments/adjustments during the year (12,504,625) (15,639,176)
42,350,516 25,159,141 Less: Security deposits adjustable on expiry of lease term (5,566,050) (5,022,300)
36,784,466 20,136,841 Less: Current portion grouped under current liabilities (15,833,868) (9,992,739)
20,950,598 10,144,102
16
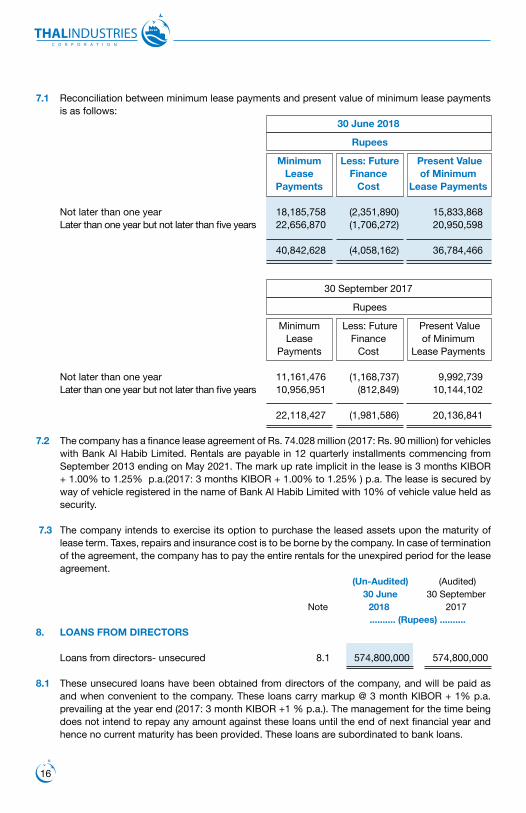
7.1 Reconciliation between minimum lease payments and present value of minimum lease payments is as follows:
30 June 2018
Rupees
Minimum Less: Future Present Value Lease Finance of Minimum Payments Cost Lease Payments
Not later than one year 18,185,758 (2,351,890) 15,833,868 Later than one year but not later than five years 22,656,870 (1,706,272) 20,950,598 40,842,628 (4,058,162) 36,784,466
30 September 2017
Rupees
Minimum Less: Future Present Value Lease Finance of Minimum Payments Cost Lease Payments Not later than one year 11,161,476 (1,168,737) 9,992,739 Later than one year but not later than five years 10,956,951 (812,849) 10,144,102 22,118,427 (1,981,586) 20,136,841 7.2 The company has a finance lease agreement of Rs. 74.028 million (2017: Rs. 90 million) for vehicles
with Bank Al Habib Limited. Rentals are payable in 12 quarterly installments commencing from September 2013 ending on May 2021. The mark up rate implicit in the lease is 3 months KIBOR + 1.00% to 1.25% p.a.(2017: 3 months KIBOR + 1.00% to 1.25% ) p.a. The lease is secured by way of vehicle registered in the name of Bank Al Habib Limited with 10% of vehicle value held as security.
7.3 The company intends to exercise its option to purchase the leased assets upon the maturity of
lease term. Taxes, repairs and insurance cost is to be borne by the company. In case of termination of the agreement, the company has to pay the entire rentals for the unexpired period for the lease agreement.
(Un-Audited) (Audited) 30 June 30 September Note 2018 2017 .......... (Rupees) ..........8. LOANS FROM DIRECTORS Loans from directors- unsecured 8.1 574,800,000 574,800,000
8.1 These unsecured loans have been obtained from directors of the company, and will be paid as and when convenient to the company. These loans carry markup @ 3 month KIBOR + 1% p.a. prevailing at the year end (2017: 3 month KIBOR +1 % p.a.). The management for the time being does not intend to repay any amount against these loans until the end of next financial year and hence no current maturity has been provided. These loans are subordinated to bank loans.
17
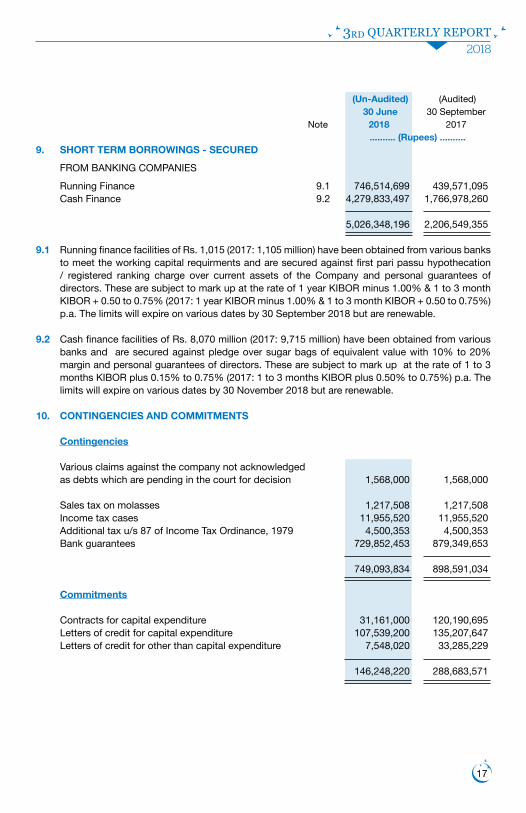
(Un-Audited) (Audited) 30 June 30 September Note 2018 2017 .......... (Rupees) ..........9. SHORT TERM BORROWINGS - SECURED FROM BANKING COMPANIES Running Finance 9.1 746,514,699 439,571,095 Cash Finance 9.2 4,279,833,497 1,766,978,260
5,026,348,196 2,206,549,355
9.1 Running finance facilities of Rs. 1,015 (2017: 1,105 million) have been obtained from various banks to meet the working capital requirments and are secured against first pari passu hypothecation / registered ranking charge over current assets of the Company and personal guarantees of directors. These are subject to mark up at the rate of 1 year KIBOR minus 1.00% & 1 to 3 month KIBOR + 0.50 to 0.75% (2017: 1 year KIBOR minus 1.00% & 1 to 3 month KIBOR + 0.50 to 0.75%) p.a. The limits will expire on various dates by 30 September 2018 but are renewable.
9.2 Cash finance facilities of Rs. 8,070 million (2017: 9,715 million) have been obtained from various banks and are secured against pledge over sugar bags of equivalent value with 10% to 20% margin and personal guarantees of directors. These are subject to mark up at the rate of 1 to 3 months KIBOR plus 0.15% to 0.75% (2017: 1 to 3 months KIBOR plus 0.50% to 0.75%) p.a. The limits will expire on various dates by 30 November 2018 but are renewable.
10. CONTINGENCIES AND COMMITMENTS Contingencies Various claims against the company not acknowledged as debts which are pending in the court for decision 1,568,000 1,568,000 Sales tax on molasses 1,217,508 1,217,508 Income tax cases 11,955,520 11,955,520 Additional tax u/s 87 of Income Tax Ordinance, 1979 4,500,353 4,500,353 Bank guarantees 729,852,453 879,349,653 749,093,834 898,591,034
Commitments Contracts for capital expenditure 31,161,000 120,190,695 Letters of credit for capital expenditure 107,539,200 135,207,647 Letters of credit for other than capital expenditure 7,548,020 33,285,229 146,248,220 288,683,571
18
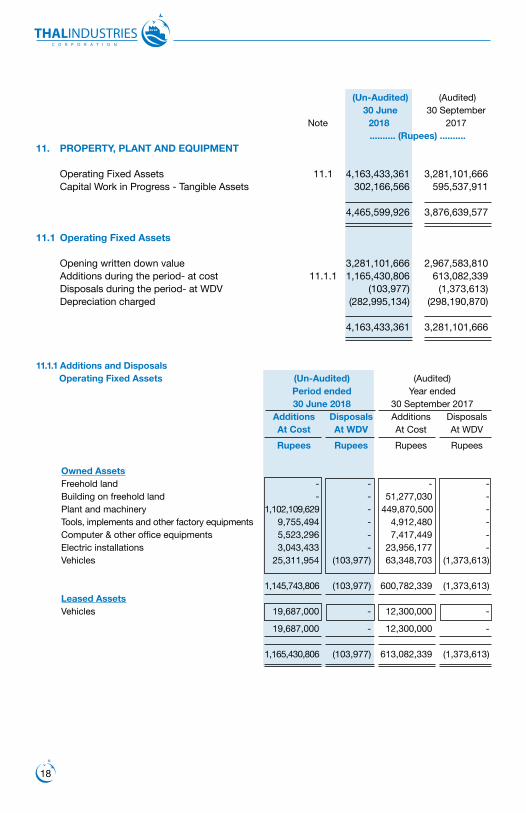
(Un-Audited) (Audited) 30 June 30 September Note 2018 2017 .......... (Rupees) ..........11. PROPERTY, PLANT AND EQUIPMENT Operating Fixed Assets 11.1 4,163,433,361 3,281,101,666 Capital Work in Progress - Tangible Assets 302,166,566 595,537,911 4,465,599,926 3,876,639,577
11.1 Operating Fixed Assets Opening written down value 3,281,101,666 2,967,583,810 Additions during the period- at cost 11.1.1 1,165,430,806 613,082,339 Disposals during the period- at WDV (103,977) (1,373,613) Depreciation charged (282,995,134) (298,190,870)
4,163,433,361 3,281,101,666 11.1.1 Additions and Disposals Operating Fixed Assets (Un-Audited) (Audited) Period ended Year ended 30 June 2018 30 September 2017 Additions Disposals Additions Disposals At Cost At WDV At Cost At WDV Rupees Rupees Rupees Rupees
Owned Assets Freehold land - - - - Building on freehold land - - 51,277,030 - Plant and machinery 1,102,109,629 - 449,870,500 - Tools, implements and other factory equipments 9,755,494 - 4,912,480 - Computer & other office equipments 5,523,296 - 7,417,449 - Electric installations 3,043,433 - 23,956,177 - Vehicles 25,311,954 (103,977) 63,348,703 (1,373,613)
1,145,743,806 (103,977) 600,782,339 (1,373,613) Leased Assets Vehicles 19,687,000 - 12,300,000 -
19,687,000 - 12,300,000 - 1,165,430,806 (103,977) 613,082,339 (1,373,613)
19
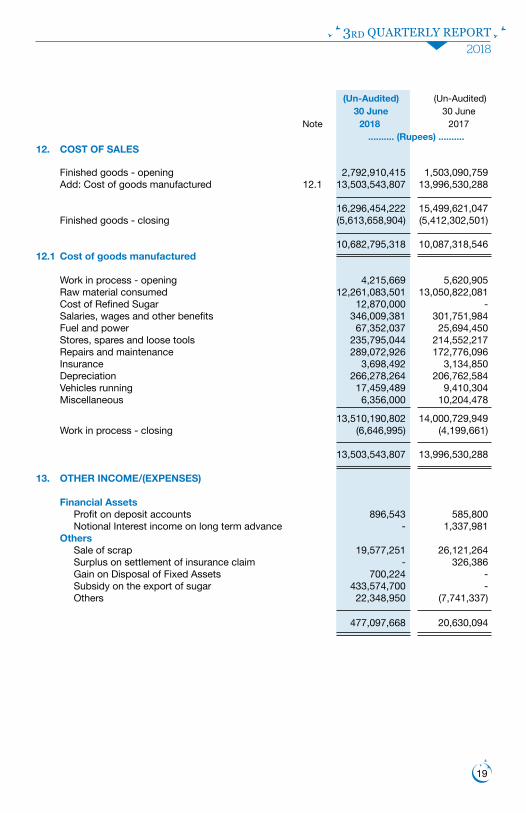
(Un-Audited) (Un-Audited) 30 June 30 June Note 2018 2017 .......... (Rupees) ..........12. COST OF SALES Finished goods - opening 2,792,910,415 1,503,090,759 Add: Cost of goods manufactured 12.1 13,503,543,807 13,996,530,288 16,296,454,222 15,499,621,047 Finished goods - closing (5,613,658,904) (5,412,302,501)
10,682,795,318 10,087,318,546 12.1 Cost of goods manufactured Work in process - opening 4,215,669 5,620,905 Raw material consumed 12,261,083,501 13,050,822,081 Cost of Refined Sugar 12,870,000 - Salaries, wages and other benefits 346,009,381 301,751,984 Fuel and power 67,352,037 25,694,450 Stores, spares and loose tools 235,795,044 214,552,217 Repairs and maintenance 289,072,926 172,776,096 Insurance 3,698,492 3,134,850 Depreciation 266,278,264 206,762,584 Vehicles running 17,459,489 9,410,304 Miscellaneous 6,356,000 10,204,478 13,510,190,802 14,000,729,949 Work in process - closing (6,646,995) (4,199,661)
13,503,543,807 13,996,530,288
13. OTHER INCOME/(EXPENSES) Financial Assets Profit on deposit accounts 896,543 585,800 Notional Interest income on long term advance - 1,337,981 Others Sale of scrap 19,577,251 26,121,264 Surplus on settlement of insurance claim - 326,386 Gain on Disposal of Fixed Assets 700,224 - Subsidy on the export of sugar 433,574,700 - Others 22,348,950 (7,741,337)
477,097,668 20,630,094
20
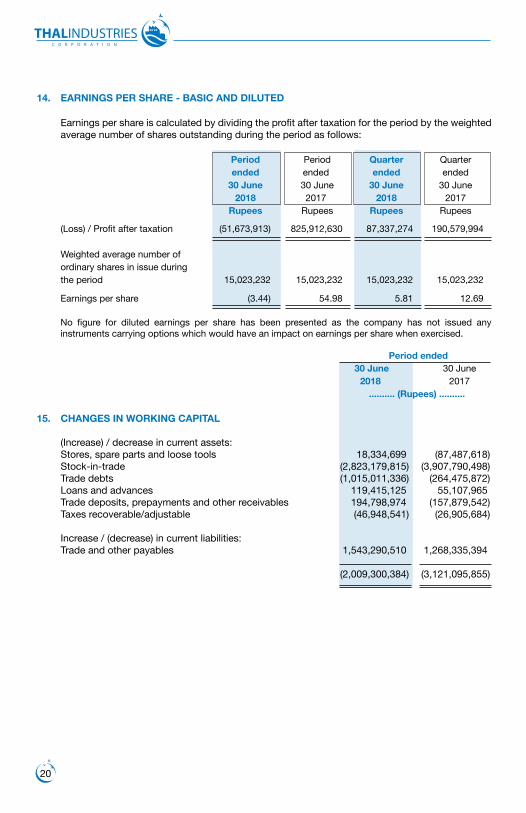
14. EARNINGS PER SHARE - BASIC AND DILUTED
Earnings per share is calculated by dividing the profit after taxation for the period by the weighted average number of shares outstanding during the period as follows:
Period Period Quarter Quarter ended ended ended ended 30 June 30 June 30 June 30 June 2018 2017 2018 2017 Rupees Rupees Rupees Rupees (Loss) / Profit after taxation (51,673,913) 825,912,630 87,337,274 190,579,994 Weighted average number of ordinary shares in issue during the period 15,023,232 15,023,232 15,023,232 15,023,232
Earnings per share (3.44) 54.98 5.81 12.69 No figure for diluted earnings per share has been presented as the company has not issued any
instruments carrying options which would have an impact on earnings per share when exercised.
Period ended 30 June 30 June 2018 2017 .......... (Rupees) ..........
15. CHANGES IN WORKING CAPITAL (Increase) / decrease in current assets: Stores, spare parts and loose tools 18,334,699 (87,487,618) Stock-in-trade (2,823,179,815) (3,907,790,498) Trade debts (1,015,011,336) (264,475,872) Loans and advances 119,415,125 55,107,965 Trade deposits, prepayments and other receivables 194,798,974 (157,879,542) Taxes recoverable/adjustable (46,948,541) (26,905,684) Increase / (decrease) in current liabilities: Trade and other payables 1,543,290,510 1,268,335,394 (2,009,300,384) (3,121,095,855)
21
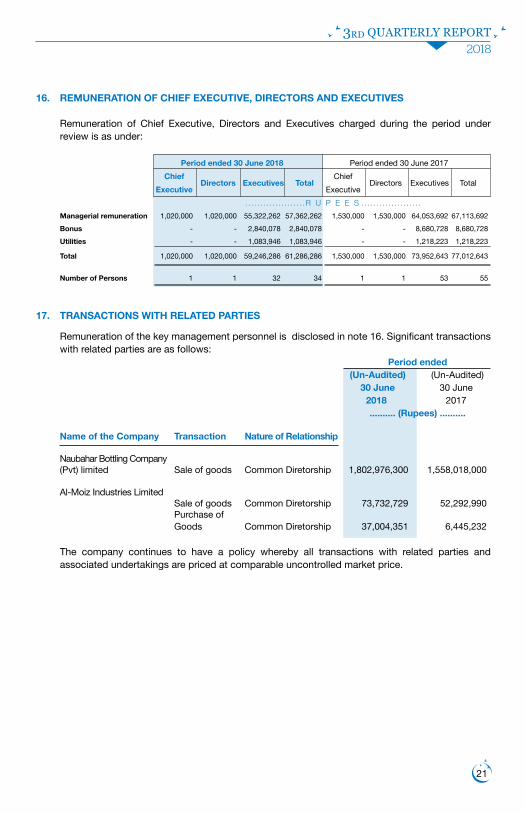
16. REMUNERATION OF CHIEF EXECUTIVE, DIRECTORS AND EXECUTIVES
Remuneration of Chief Executive, Directors and Executives charged during the period under review is as under:
Period ended 30 June 2018 Period ended 30 June 2017 Chief
Directors Executives Total Chief
Directors Executives Total Executive Executive . . . . . . . . . . . . . . . . . . . .R U P E E S . . . . . . . . . . . . . . . . . . . . Managerial remuneration 1,020,000 1,020,000 55,322,262 57,362,262 1,530,000 1,530,000 64,053,692 67,113,692 Bonus - - 2,840,078 2,840,078 - - 8,680,728 8,680,728 Utilities - - 1,083,946 1,083,946 - - 1,218,223 1,218,223
Total 1,020,000 1,020,000 59,246,286 61,286,286 1,530,000 1,530,000 73,952,643 77,012,643 Number of Persons 1 1 32 34 1 1 53 55
17. TRANSACTIONS WITH RELATED PARTIES Remuneration of the key management personnel is disclosed in note 16. Significant transactions
with related parties are as follows: Period ended (Un-Audited) (Un-Audited) 30 June 30 June 2018 2017 .......... (Rupees) ..........
Name of the Company Transaction Nature of Relationship Naubahar Bottling Company (Pvt) limited Sale of goods Common Diretorship 1,802,976,300 1,558,018,000 Al-Moiz Industries Limited Sale of goods Common Diretorship 73,732,729 52,292,990 Purchase of Goods Common Diretorship 37,004,351 6,445,232 The company continues to have a policy whereby all transactions with related parties and
associated undertakings are priced at comparable uncontrolled market price.
22
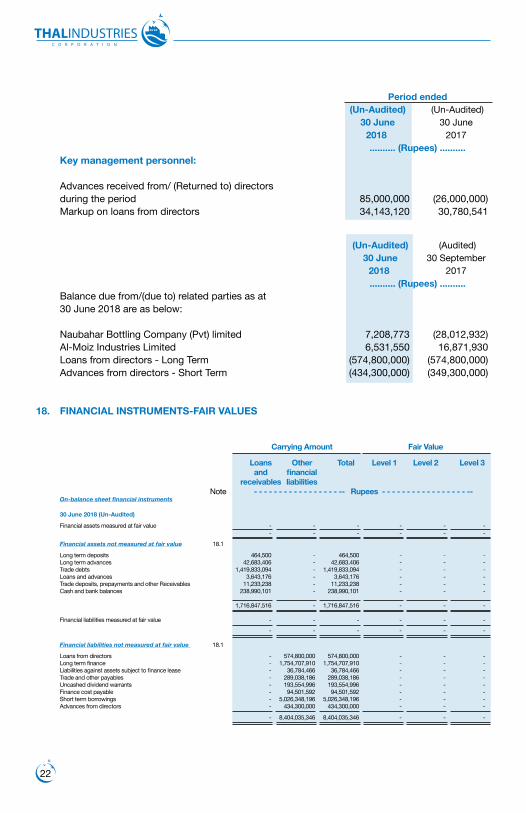
Period ended (Un-Audited) (Un-Audited) 30 June 30 June 2018 2017 .......... (Rupees) .......... Key management personnel: Advances received from/ (Returned to) directors during the period 85,000,000 (26,000,000) Markup on loans from directors 34,143,120 30,780,541
(Un-Audited) (Audited) 30 June 30 September 2018 2017 .......... (Rupees) .......... Balance due from/(due to) related parties as at 30 June 2018 are as below: Naubahar Bottling Company (Pvt) limited 7,208,773 (28,012,932) Al-Moiz Industries Limited 6,531,550 16,871,930 Loans from directors - Long Term (574,800,000) (574,800,000) Advances from directors - Short Term (434,300,000) (349,300,000)
18. FINANCIAL INSTRUMENTS-FAIR VALUES
Carrying Amount Fair Value
Loans Other Total Level 1 Level 2 Level 3 and financial receivables liabilities Note - - - - - - - - - - - - - - - - - -- Rupees - - - - - - - - - - - - - - - - - -- On-balance sheet financial instruments
30 June 2018 (Un-Audited)
Financial assets measured at fair value - - - - - - - - - - - -
Financial assets not measured at fair value 18.1
Long term deposits 464,500 - 464,500 - - - Long term advances 42,683,406 - 42,683,406 - - - Trade debts 1,419,833,094 - 1,419,833,094 - - - Loans and advances 3,643,176 - 3,643,176 - - - Trade deposits, prepayments and other Receivables 11,233,238 - 11,233,238 - - - Cash and bank balances 238,990,101 - 238,990,101 - - - 1,716,847,516 - 1,716,847,516 - - - Financial liabilities measured at fair value - - - - - - - - - - - - Financial liabilities not measured at fair value 18.1
Loans from directors - 574,800,000 574,800,000 - - - Long term finance - 1,754,707,910 1,754,707,910 - - - Liabilities against assets subject to finance lease - 36,784,466 36,784,466 - - - Trade and other payables - 289,038,186 289,038,186 - - - Uncashed dividend warrants - 193,554,996 193,554,996 - - - Finance cost payable - 94,501,592 94,501,592 - - - Short term borrowings - 5,026,348,196 5,026,348,196 - - - Advances from directors - 434,300,000 434,300,000 - - - - 8,404,035,346 8,404,035,346 - - -
23
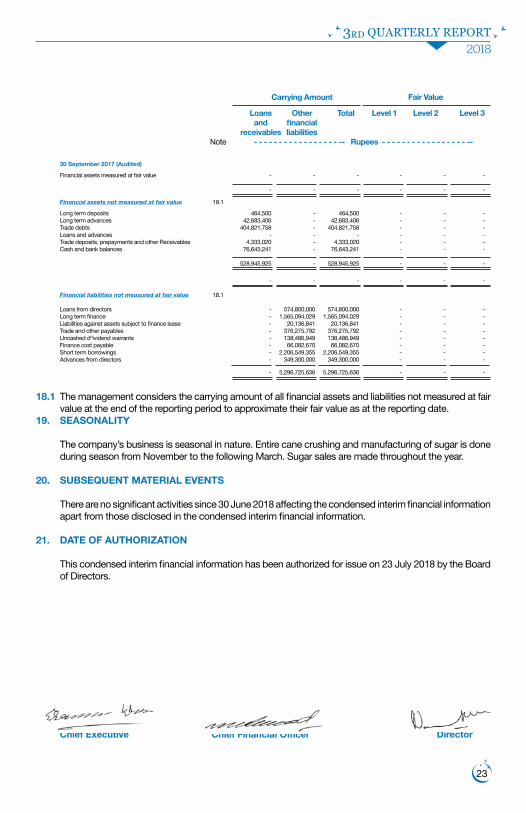
Carrying Amount Fair Value
Loans Other Total Level 1 Level 2 Level 3 and financial receivables liabilities Note - - - - - - - - - - - - - - - - - -- Rupees - - - - - - - - - - - - - - - - - --
30 September 2017 (Audited)
Financial assets measured at fair value - - - - - -
- - - - - - Financial assets not measured at fair value 18.1
Long term deposits 464,500 - 464,500 - - - Long term advances 42,683,406 - 42,683,406 - - - Trade debts 404,821,758 - 404,821,758 - - - Loans and advances - - - - - - Trade deposits, prepayments and other Receivables 4,333,020 - 4,333,020 - - - Cash and bank balances 76,643,241 - 76,643,241 - - -
528,945,925 - 528,945,925 - - - - - - - - - Financial liabilities not measured at fair value 18.1 Loans from directors - 574,800,000 574,800,000 - - - Long term finance - 1,565,094,029 1,565,094,029 - - - Liabilities against assets subject to finance lease - 20,136,841 20,136,841 - - - Trade and other payables - 376,275,792 376,275,792 - - - Uncashed dºividend warrants - 138,486,949 138,486,949 - - - Finance cost payable - 66,082,670 66,082,670 - - - Short term borrowings - 2,206,549,355 2,206,549,355 - - - Advances from directors - 349,300,000 349,300,000 - - -
- 5,296,725,636 5,296,725,636 - - - 18.1 The management considers the carrying amount of all financial assets and liabilities not measured at fair
value at the end of the reporting period to approximate their fair value as at the reporting date.19. SEASONALITY The company’s business is seasonal in nature. Entire cane crushing and manufacturing of sugar is done
during season from November to the following March. Sugar sales are made throughout the year. 20. SUBSEQUENT MATERIAL EVENTS There are no significant activities since 30 June 2018 affecting the condensed interim financial information
apart from those disclosed in the condensed interim financial information. 21. DATE OF AUTHORIZATION This condensed interim financial information has been authorized for issue on 23 July 2018 by the Board
of Directors.
Chief Executive Chief Financial Officer Director
24
If undelivered, please return to:
THE THAL INDUSTRIES CORPORATION LIMITED23-Pir Khurshid Colony Gulgasht Multan.Ph: 061-6524621 - 6524675Fax: 061-6524675
Registered Office:
2-D-1 Gulberg-III, Lahore – 54600Tel: 042-35771066-71Fax: 042-35771175
Lahore Office:
THALINDUSTRIESTHALINDUSTRIES
![Relazione mandrino.rete.ppt [modalità compatibilità]...2019/05/08 · + thal α othal Hb S β thal δβ thal Hb Lepore Hb E Hb O Arab Hb C Hb D Punjab HPFH Not a carrier α+ thal](https://img.pdfslide.net/doc/110x75/5e9a890fb98c3712227912ea/relazione-modalit-compatibilit-20190508-thal-othal-hb-s-thal.jpg)