Embed Size (px)
Citation preview
Condition Monitoring of In-ServiceNonceramic Insulators
and Underground CablesFinal Project Report
Power Systems Engineering Research Center
A National Science FoundationIndustry/University Cooperative Research Center
since 1996
PSERC
Power Systems Engineering Research Center
Condition Monitoring of In-Service Nonceramic Insulators and Underground Cables
Final Report
R. S. Gorur, Project Leader Arizona State University
PSERC Publication 02-25
May 2002
Information about this project For more information about this project contact: R. S. Gorur, Professor Department of Electrical Engineering Arizona State University Tempe, AZ 85287-5706 Phone: 480-965-4894 Fax: 480-965-0745 Email: [email protected] Power Systems Engineering Research Center This is a project report from the Power Systems Engineering Research Center (PSERC). PSERC is a multi-university Center conducting research on challenges facing a restructuring electric power industry and educating the next generation of power engineers. More information about PSERC can be found at the Center’s website: http://www.pserc.wisc.edu. For additional information, contact: Power Systems Engineering Research Center Cornell University 428 Phillips Hall Ithaca, New York 14853 Phone: 607-255-5601 Fax: 607-255-8871 Notice Concerning Copyright Material Permission to copy without fee all or part of this publication is granted if appropriate attribution is given to this document as the source material. This report is available for downloading from the PSERC website.
© 2002 Arizona State University. All rights reserved.
i
Acknowledgements
The work described in this report was sponsored by the Power Systems Engineering
Research Center (PSERC). We express our appreciation for the support provided by PSERC’s
industrial members and by the National Science Foundation under grant NSF EEC 0001880
received under the Industry/University Cooperative Research Center program.
The work described in Part 1 of this report was performed by a graduate student Mr.
Balasubramaniam Pinnangudi. Mr. A. J. Kroese of Salt River Project, Phoenix, served as the
industry and technical advisor for this part of the project.
The work described in Part 2 was performed by a graduate student Mr. Snehal Dalal. Mr.
M. L. Dyer of Salt River Project, Phoenix, served as the industry and technical adviser for this
part of the project.
ii
Executive Summary
Part 1: Quantification of Corona Discharges on Polymer Insulators
Corona discharges present a serious threat to the long term performance of nonceramic
(also known as composite or polymeric) insulators. To date, there has been no satisfactory
method to assess the damage caused by corona in service. This project presents the first attempt
to correlate visible patterns of corona discharges on actual insulators with the energy associated
with the discharge. An UV camera capable of capturing the corona discharge even during
daytime has been employed. Conventional partial discharge (PD) monitoring has been used to
assess the magnitude of corona in a well-shielded high voltage laboratory. An image processing
technique that converts the light signal into quantifiable measures (pixel intensity and area) has
been attempted.
The results from this project indicate that there is a correlation between the visible pattern
of corona, measured discharge energy and the pixel intensity and area. This correlation has been
proven under both dry and wet conditions. It appears that data of the threshold corona energy
intensity to cause deterioration of the housing material (obtained from previous projects) can be
used to predict the performance of nonceramic insulators under actual service conditions. This
project has considered those nonceramic insulators that do not have any manufacturing or design
defects. The next phase of the project will involve the evaluation of defective insulators.
Part 2: Prediction of Future Performance of In Service XLPE Cables
This study examines the performance of 15kV XLPE new and aged cable (taken out from
the service after 10 + years) in context with electrical tree and electrical failure of cable. The
breakdown tests are preformed using needle-plane geometry at room temperature as well as
elevated temperature of 1000C. A statistical technique like regression analysis is utilized to
analyze the test results as well as to predict the future performance and life expectancy of cables.
The analytical techniques like Fourier Transform Infra-Red (FTIR) spectroscopy is used to study
the permanent changes in the XLPE material. This project proves the fact that there are
permanent changes occurring in the material that lead to progressive degradation and/or failure
in the long run.
iii
A number of conclusions have been reached in this project.
• After aging of around 10 years in dry weather like that of Arizona, cable performance is
degraded by at least 25%.
• As the slope of the both new and aged cable model remains same, it can be concluded
that the rate of degradation is not changing with the age of the cable.
• A different depth of penetration (damage due to accidental dig ins) is required to failure
for aged and new cable. For new cable it is approximately 5.9 mm and for aged cable it
is 3.8 mm. It can be concluded from this that aged cable are more susceptible to failure
due to accidental dig ins.
• In XLPE samples, reduction in the absorption bands due to [-CH2-CH2] n at 2840 cm-1 to
2915 cm-1 on the surface can be identified in FTIR spectrums.
• CH2-CH2 is the backbone of XLPE material and reduction of this backbone material is
noted with aging as well as after electrical failure. Side chain absorption band made up
of CO= and – CH2 at 1460 cm-1 also decreases and reaches higher transmittance level
(lower absorbance level) than case of new cable without failure.
• The ATH-related absorption band (≤ 1020 cm-1) is reduced as the age of cable increases
and also with the failure of the cable
iv
Table of Contents Part 1 Quantification of Corona Discharges on Polymer Insulators ......................................... 1
1.1 Introduction..................................................................................................................... 1
1.2 Experiment Setup............................................................................................................ 2
1.3 Test Procedures............................................................................................................... 3
1.4 Image Analysis and Processing ...................................................................................... 5
1.5 Partial Discharge Parameters .......................................................................................... 7
1.6 Test Results..................................................................................................................... 7
1.7 Future Work .................................................................................................................. 11
1.8 References..................................................................................................................... 11
Part 2 Prediction of Future Performance of In Service XLPE Cables .................................... 12
2.1 Introduction................................................................................................................... 12
2.2 Physics of Treeing......................................................................................................... 13
2.3 Experimental Setup....................................................................................................... 14
2.3.1 Electrical Breakdown Test.................................................................................... 14
2.3.2 FTIR Spectroscopy Test ....................................................................................... 15
2.4 Results........................................................................................................................... 16
2.4.1 Electrical Breakdown Test.................................................................................... 16
2.4.2 FTIR Spectroscopy Test ....................................................................................... 19
2.5 Regression Analysis...................................................................................................... 20
2.6 Conclusion .................................................................................................................... 24
2.7 Future Work .................................................................................................................. 24
2.8 References..................................................................................................................... 25
Part 1 Quantification of Corona Discharges on Polymer Insulators
1.1 Introduction
Corona can be initiated on non-ceramic insulators (NCI) due to defective manufacturing
and deficiencies in hardware design. Corona can cause premature failure. To aid in proper
insulator selection, it is important to determine the magnitude of corona and the damage
threshold of various insulator-housing materials. In this project, interesting pre-flashover
activities that are related to corona are observed on polymer insulators subjected to high voltage.
The electrical activities that occur during bursts of light emission have been monitored. A high-
speed UV camera has been used for visual observations.
The high-speed corona camera detects and locates weak corona signals by overlaying a
UV video image of the corona on a visible video image of the background. The solar blindness
is achieved by using a special filter that is transparent in the solar blind UV band and is
completely opaque to the solar radiation.
Image processing techniques are used to measure the brightness of the discharge in terms
of the pixel illumination levels. A correlation is drawn between the image obtained with a
corona detection camera and the energy associated, as measured by traditional partial discharge
(PD) detection methods. Critical values of energy, and the associated visual patterns beyond
which the corona has a deteriorating influence on the insulator have been determined. This
provides an effective way to predict the severity of corona on the insulator in-service from
ground inspection. Simulation results are reported, together with discussion of various problems
2
1.2 Experiment Setup
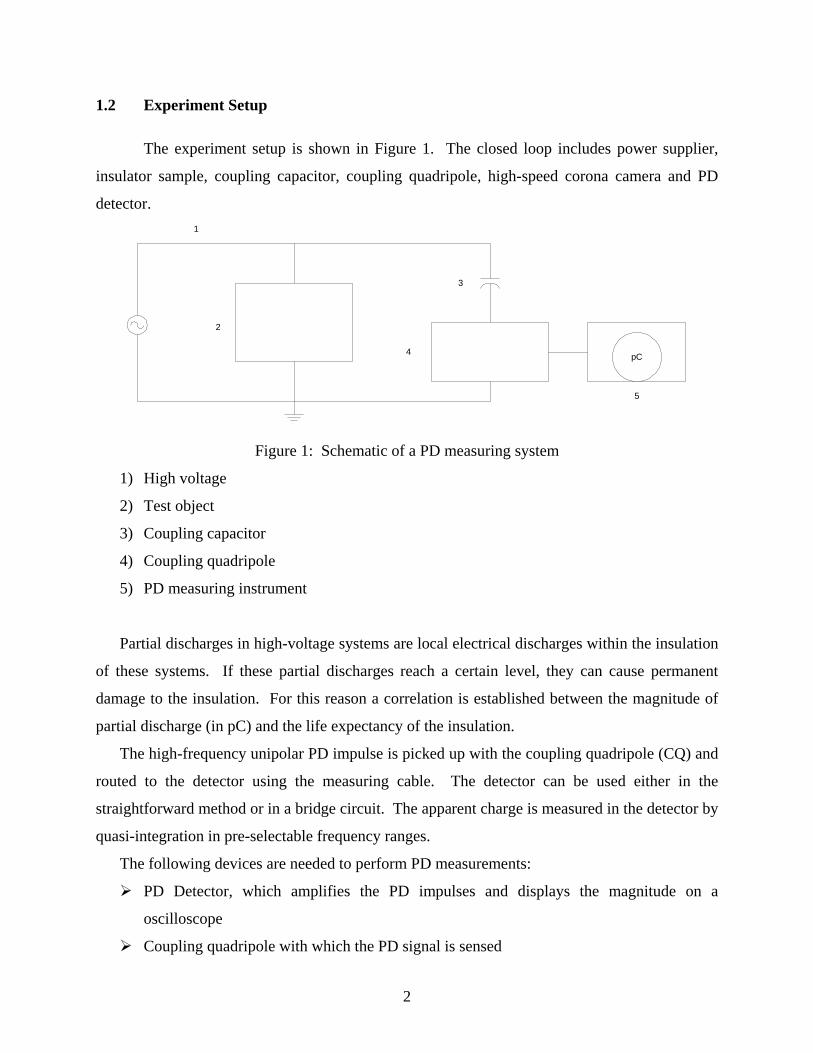
The experiment setup is shown in Figure 1. The closed loop includes power supplier,
insulator sample, coupling capacitor, coupling quadripole, high-speed corona camera and PD
detector. 1
2
3
4
5
pC
Figure 1: Schematic of a PD measuring system
1) High voltage
2) Test object
3) Coupling capacitor
4) Coupling quadripole
5) PD measuring instrument
Partial discharges in high-voltage systems are local electrical discharges within the insulation
of these systems. If these partial discharges reach a certain level, they can cause permanent
damage to the insulation. For this reason a correlation is established between the magnitude of
partial discharge (in pC) and the life expectancy of the insulation.
The high-frequency unipolar PD impulse is picked up with the coupling quadripole (CQ) and
routed to the detector using the measuring cable. The detector can be used either in the
straightforward method or in a bridge circuit. The apparent charge is measured in the detector by
quasi-integration in pre-selectable frequency ranges.
The following devices are needed to perform PD measurements:
PD Detector, which amplifies the PD impulses and displays the magnitude on a
oscilloscope
Coupling quadripole with which the PD signal is sensed
3
Coupling capacitor, which decouples the high frequency PD impulses from the high
voltage
Calibrator, which supplies the calibrating impulses with a defined charge
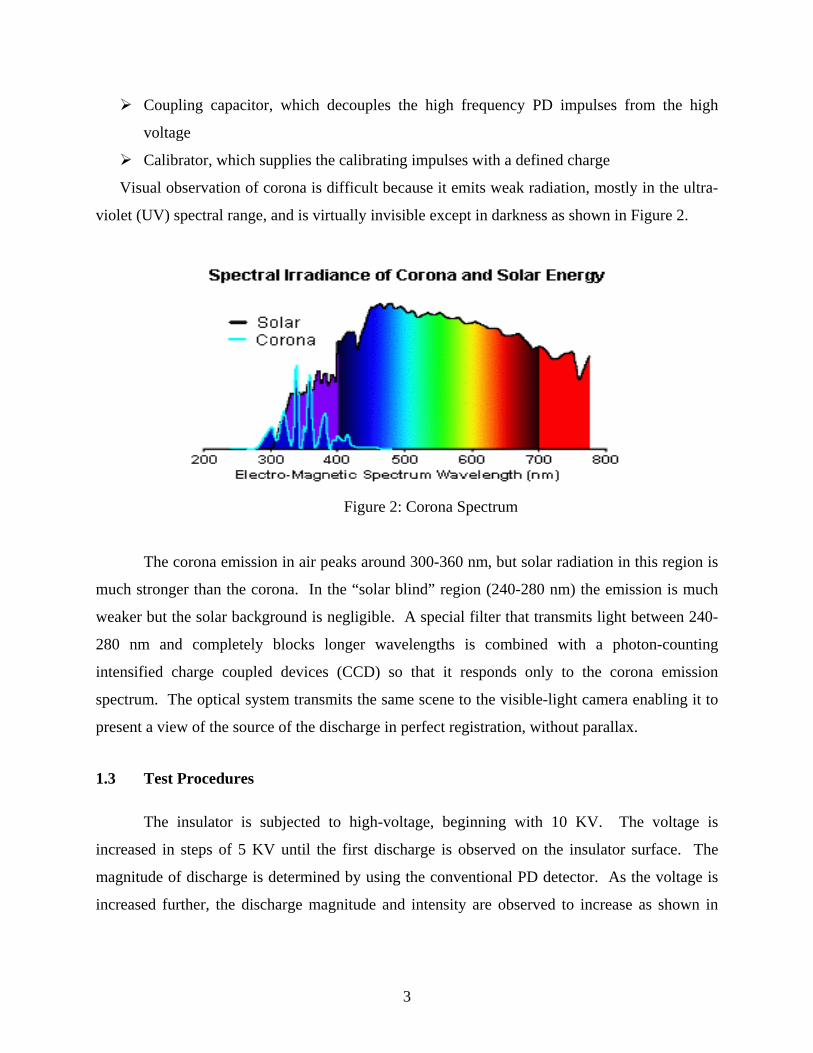
Visual observation of corona is difficult because it emits weak radiation, mostly in the ultra-
violet (UV) spectral range, and is virtually invisible except in darkness as shown in Figure 2.
Figure 2: Corona Spectrum
The corona emission in air peaks around 300-360 nm, but solar radiation in this region is
much stronger than the corona. In the “solar blind” region (240-280 nm) the emission is much
weaker but the solar background is negligible. A special filter that transmits light between 240-
280 nm and completely blocks longer wavelengths is combined with a photon-counting
intensified charge coupled devices (CCD) so that it responds only to the corona emission
spectrum. The optical system transmits the same scene to the visible-light camera enabling it to
present a view of the source of the discharge in perfect registration, without parallax.
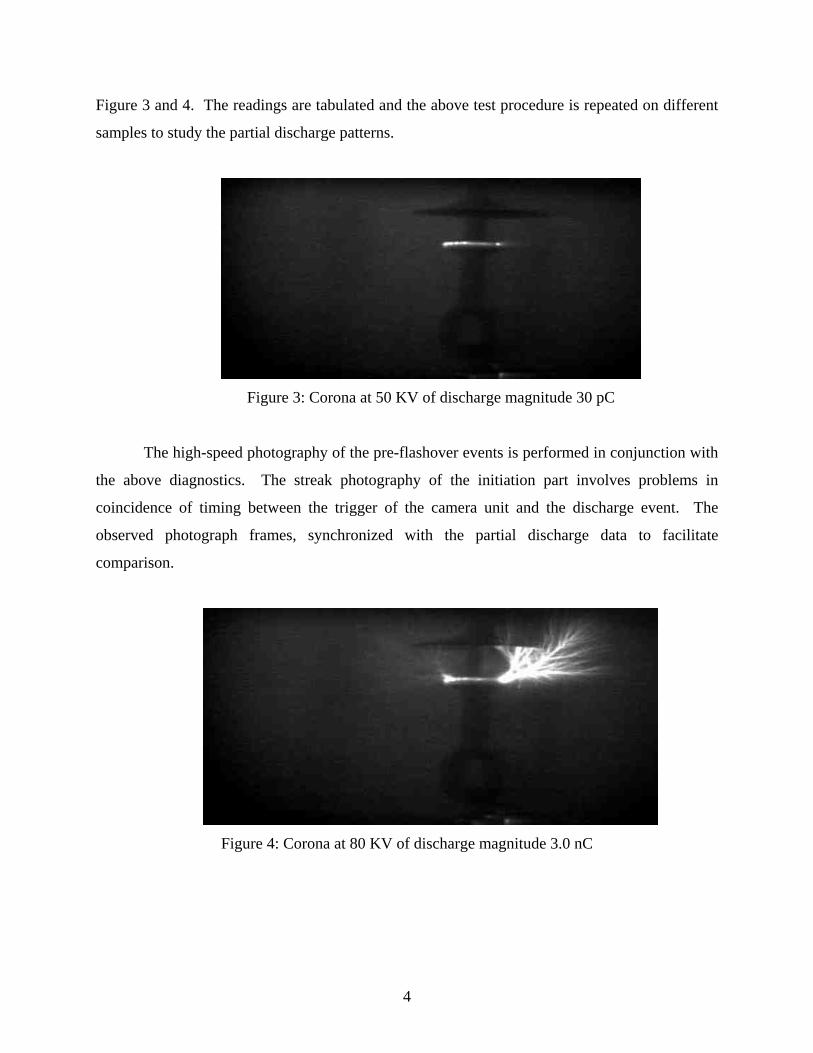
1.3 Test Procedures
The insulator is subjected to high-voltage, beginning with 10 KV. The voltage is
increased in steps of 5 KV until the first discharge is observed on the insulator surface. The
magnitude of discharge is determined by using the conventional PD detector. As the voltage is
increased further, the discharge magnitude and intensity are observed to increase as shown in
4
Figure 3 and 4. The readings are tabulated and the above test procedure is repeated on different
samples to study the partial discharge patterns.
Figure 3: Corona at 50 KV of discharge magnitude 30 pC
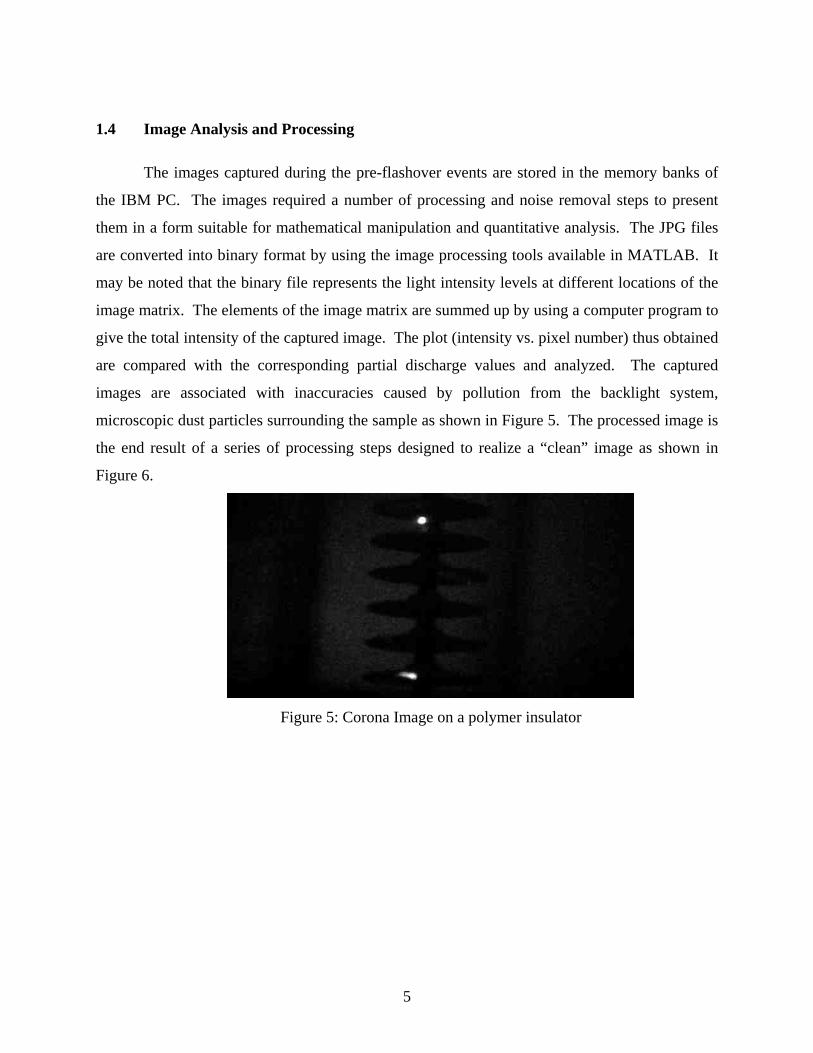
The high-speed photography of the pre-flashover events is performed in conjunction with
the above diagnostics. The streak photography of the initiation part involves problems in
coincidence of timing between the trigger of the camera unit and the discharge event. The
observed photograph frames, synchronized with the partial discharge data to facilitate
comparison.
Figure 4: Corona at 80 KV of discharge magnitude 3.0 nC
5
1.4 Image Analysis and Processing
The images captured during the pre-flashover events are stored in the memory banks of
the IBM PC. The images required a number of processing and noise removal steps to present
them in a form suitable for mathematical manipulation and quantitative analysis. The JPG files
are converted into binary format by using the image processing tools available in MATLAB. It
may be noted that the binary file represents the light intensity levels at different locations of the
image matrix. The elements of the image matrix are summed up by using a computer program to
give the total intensity of the captured image. The plot (intensity vs. pixel number) thus obtained
are compared with the corresponding partial discharge values and analyzed. The captured
images are associated with inaccuracies caused by pollution from the backlight system,
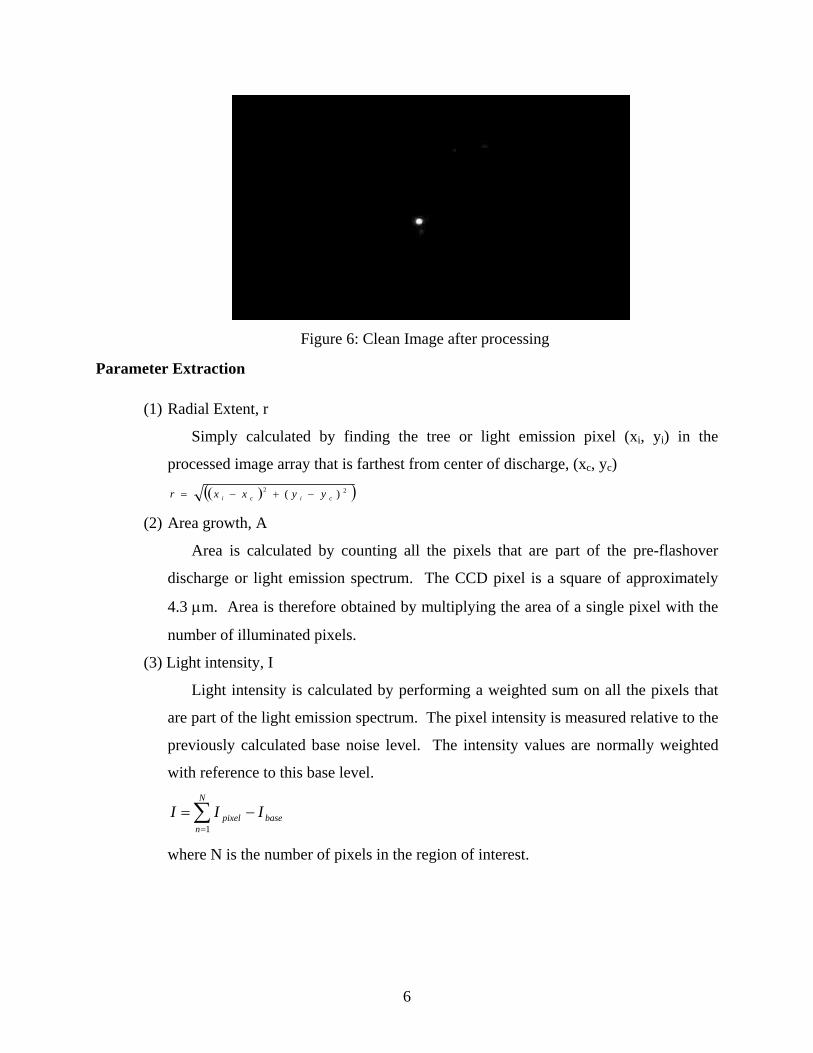
microscopic dust particles surrounding the sample as shown in Figure 5. The processed image is
the end result of a series of processing steps designed to realize a “clean” image as shown in
Figure 6.
Figure 5: Corona Image on a polymer insulator
6
Figure 6: Clean Image after processing
Parameter Extraction
(1) Radial Extent, r
Simply calculated by finding the tree or light emission pixel (xi, yi) in the
processed image array that is farthest from center of discharge, (xc, yc)
( )( )22 )( cici yyxxr −+−=
(2) Area growth, A
Area is calculated by counting all the pixels that are part of the pre-flashover
discharge or light emission spectrum. The CCD pixel is a square of approximately
4.3 µm. Area is therefore obtained by multiplying the area of a single pixel with the
number of illuminated pixels.
(3) Light intensity, I
Light intensity is calculated by performing a weighted sum on all the pixels that
are part of the light emission spectrum. The pixel intensity is measured relative to the
previously calculated base noise level. The intensity values are normally weighted
with reference to this base level.
∑=
−=N
nbasepixel III
1
where N is the number of pixels in the region of interest.
7
1.5 Partial Discharge Parameters
The total charge is defined as the sum of the magnitudes of all PD pulses detected during
a single ac cycle. It is calculated at each time step through the lifetime of the sample. The
maximum discharge magnitude detected during any given period of data acquisition increases
during the lifetime of the discharge. This suggests a relation between the discharge radial extent,
area and intensity with the partial discharge magnitude. However, it should be noted that the
maximum discharge magnitude is not just a function of the above parameters, but also of applied
voltage/field strength.
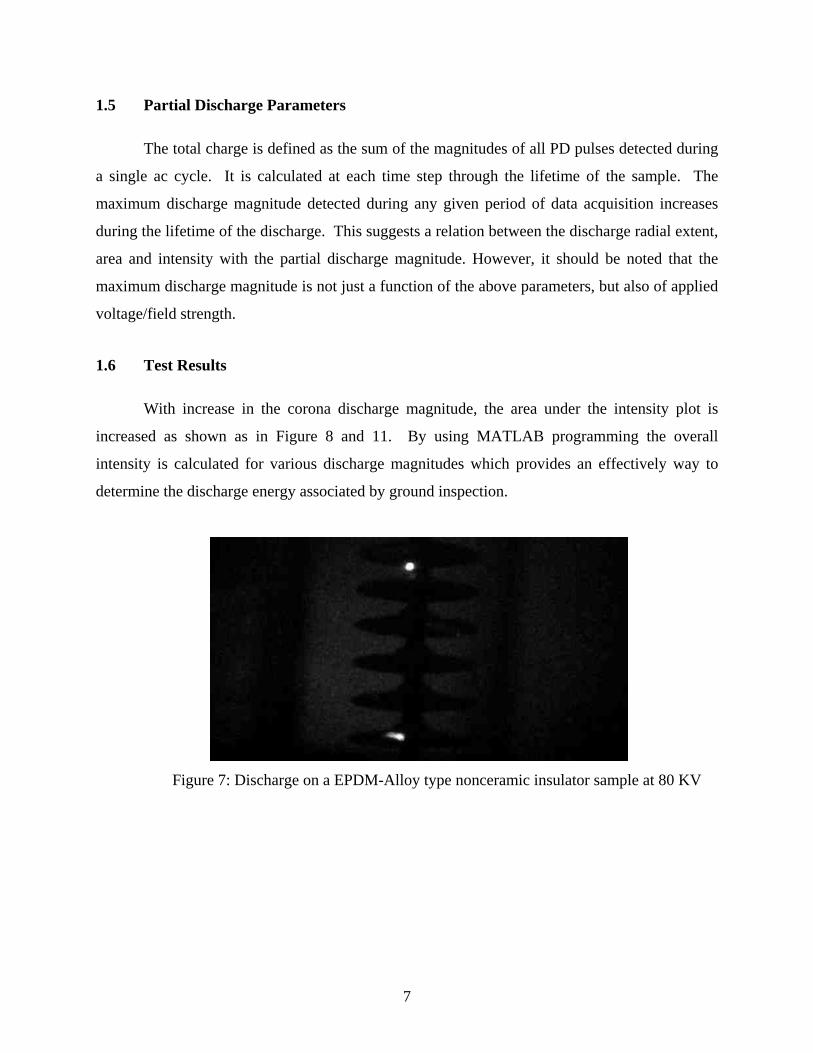
1.6 Test Results
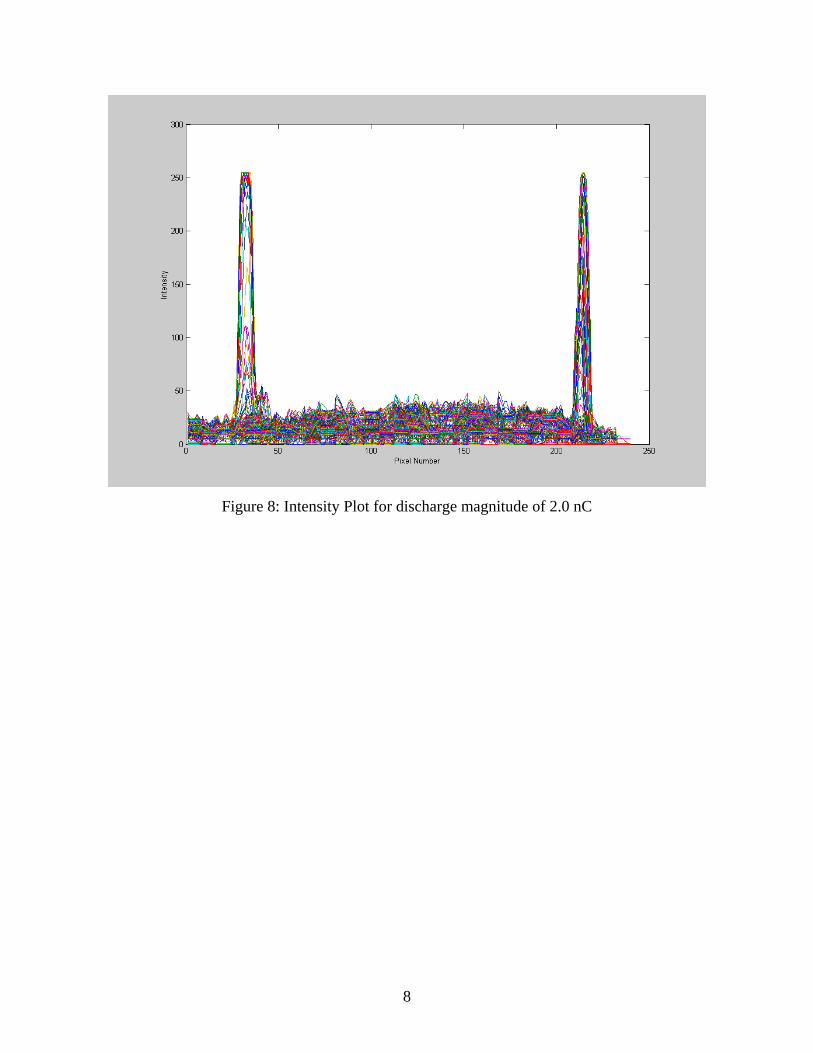
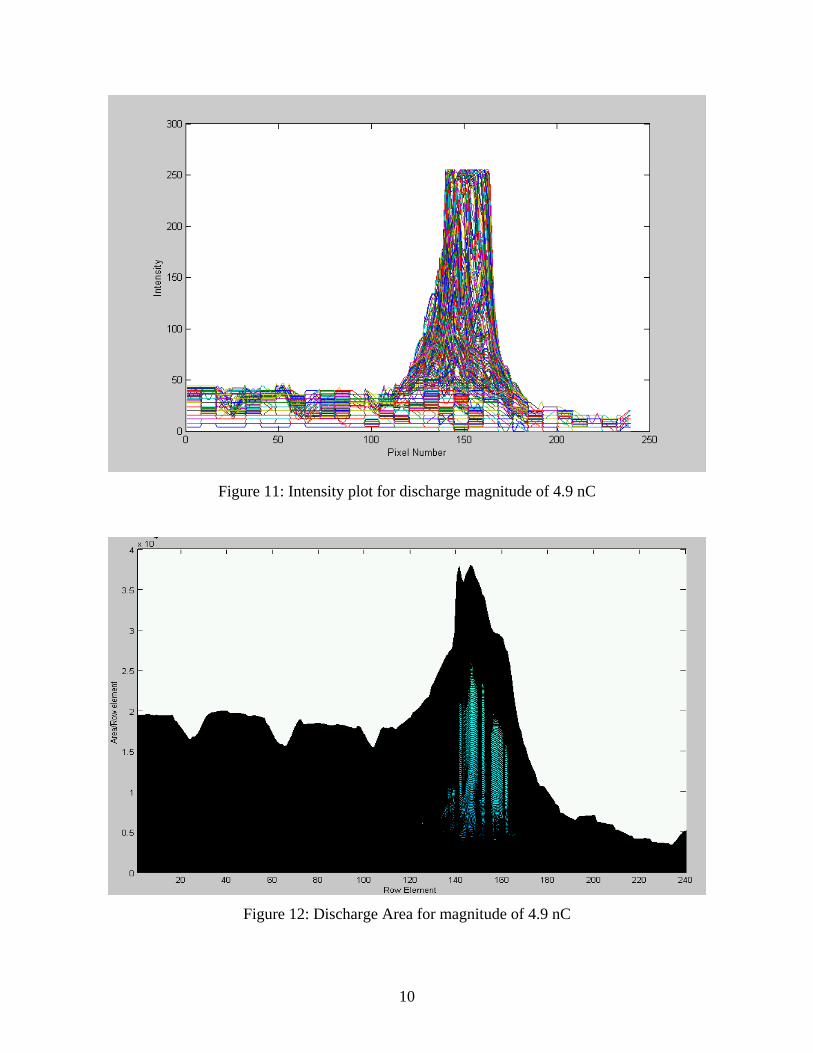
With increase in the corona discharge magnitude, the area under the intensity plot is
increased as shown as in Figure 8 and 11. By using MATLAB programming the overall
intensity is calculated for various discharge magnitudes which provides an effectively way to
determine the discharge energy associated by ground inspection.
Figure 7: Discharge on a EPDM-Alloy type nonceramic insulator sample at 80 KV
8
Figure 8: Intensity Plot for discharge magnitude of 2.0 nC
9
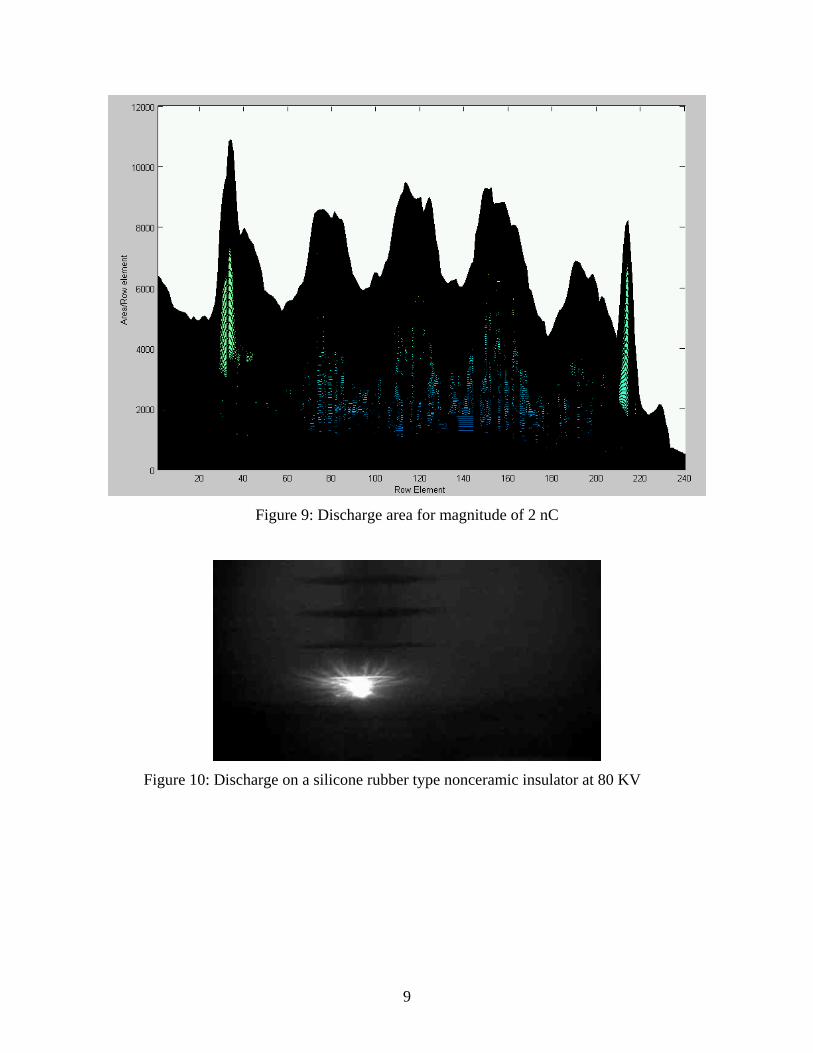
Figure 9: Discharge area for magnitude of 2 nC
Figure 10: Discharge on a silicone rubber type nonceramic insulator at 80 KV
10
Figure 11: Intensity plot for discharge magnitude of 4.9 nC
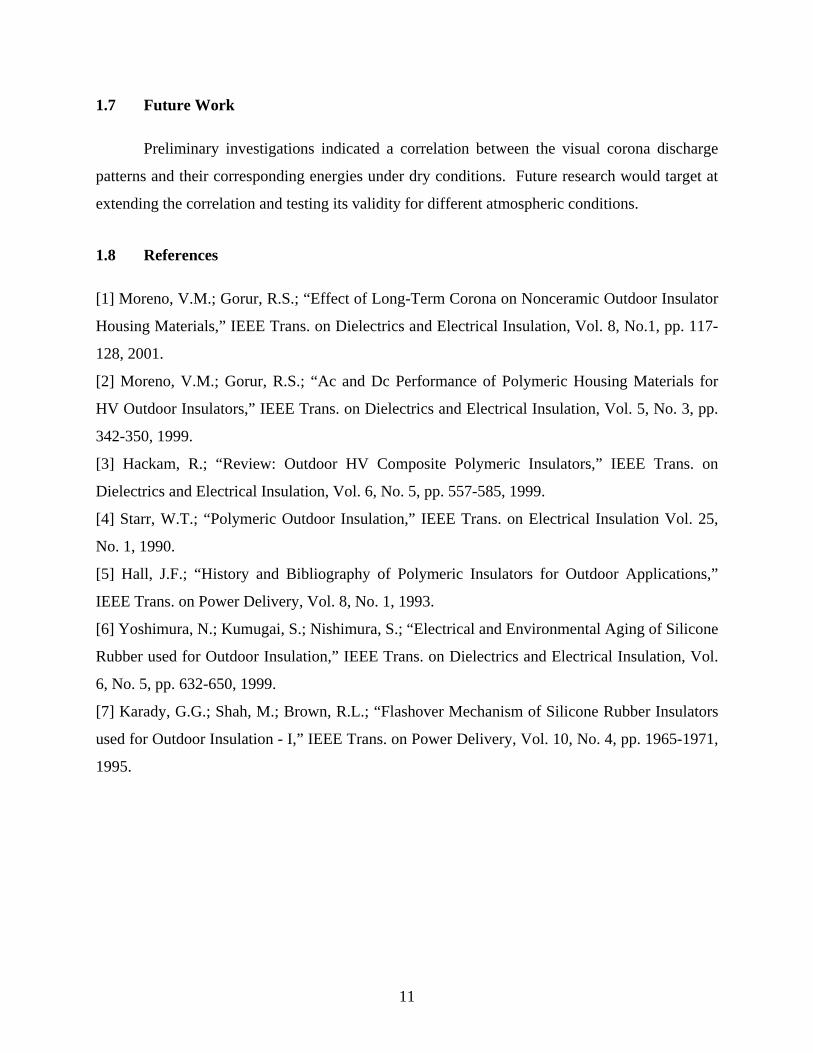
Figure 12: Discharge Area for magnitude of 4.9 nC
11
1.7 Future Work
Preliminary investigations indicated a correlation between the visual corona discharge
patterns and their corresponding energies under dry conditions. Future research would target at
extending the correlation and testing its validity for different atmospheric conditions.
1.8 References
[1] Moreno, V.M.; Gorur, R.S.; “Effect of Long-Term Corona on Nonceramic Outdoor Insulator
Housing Materials,” IEEE Trans. on Dielectrics and Electrical Insulation, Vol. 8, No.1, pp. 117-
128, 2001.
[2] Moreno, V.M.; Gorur, R.S.; “Ac and Dc Performance of Polymeric Housing Materials for
HV Outdoor Insulators,” IEEE Trans. on Dielectrics and Electrical Insulation, Vol. 5, No. 3, pp.
342-350, 1999.
[3] Hackam, R.; “Review: Outdoor HV Composite Polymeric Insulators,” IEEE Trans. on
Dielectrics and Electrical Insulation, Vol. 6, No. 5, pp. 557-585, 1999.
[4] Starr, W.T.; “Polymeric Outdoor Insulation,” IEEE Trans. on Electrical Insulation Vol. 25,
No. 1, 1990.
[5] Hall, J.F.; “History and Bibliography of Polymeric Insulators for Outdoor Applications,”
IEEE Trans. on Power Delivery, Vol. 8, No. 1, 1993.
[6] Yoshimura, N.; Kumugai, S.; Nishimura, S.; “Electrical and Environmental Aging of Silicone
Rubber used for Outdoor Insulation,” IEEE Trans. on Dielectrics and Electrical Insulation, Vol.
6, No. 5, pp. 632-650, 1999.
[7] Karady, G.G.; Shah, M.; Brown, R.L.; “Flashover Mechanism of Silicone Rubber Insulators
used for Outdoor Insulation - I,” IEEE Trans. on Power Delivery, Vol. 10, No. 4, pp. 1965-1971,
1995.
12
Part 2 Prediction of Future Performance of In Service XLPE Cables
2.1 Introduction
The beginning of power cable technology can be traced back up to 1880s, when the
incandescent light was introduced. Solid polyethylene extruded insulated power cables were
first introduced in 1950s. It became apparent after few years of service that all types of
polyethylene are susceptible to degradation and eventual failure under the conditions imposed by
electrical stress in a service environment. The changes in polymeric insulation that lead to
electrical failure fall into two interrelated categories, molecular level degradation and
microscopic changes [1]. At molecular level reactions occur that change the chemical nature of
polymer molecules. The microscopic changes include phenomena such as tree growth, void
formation, cracks and crazing [2]. A common cause for underground residential distribution
(URD) power cable failure is the formation and growth of water trees and electrical trees.
This report is organized as follows. Section 2.2 discusses in brief parameters and various
mechanisms for initiation and propagation of electrical tree suggested till date. Section 2.3
discusses the experimental set up and data monitored during electrical breakdown test and FTIR
spectroscopy test. Section 2.44 discusses the result obtained from breakdown test as well as
FTIR test. In section 2.5, regression analysis applied to the results obtained from breakdown
test, and conclusion is discussed. Section 2.6, gives scope of future work.
13
2.2 Physics of Treeing
Tree is defined as ‘latent damage in the insulation that consists of microscopic channels
formed by partial breakdown of defective or overstressed region’ and as ‘hollow tubes with non
conducting walls and containing the gaseous products of discharge’ [3]. Trees are classified
based on different criteria such as shape of the trees, location of origination or characteristics, out
of which most accepted classification of trees comes based on its characteristics as electrical
(dry) and water (wet) tree. The main difference between electrical and water tree emphasized is
based on presence of hollow channel. Electrical tree consist of hollow channel resulting from the
decomposition of material, which is clearly visible in translucent or transparent solid dielectrics
when examined with an optical microscope and transmitted light.
Electrical treeing has three distinct phases. The first is the initiation phase, or the
incubation period, during which no detectable partial discharge occur. The second is the growth
of propagation phase during which the tree propagates by continuous or periodic partial
discharge activity. The third is breakdown phase, during which cable insulation fails due to
dielectric breakdown. There are different mechanisms proposed for initiation of electrical tree.
in [4], which includes formation of electrical tree due to electrical tree, hot electron and
mechanical stress. Growth of electrical tree is defined [5] as, an array of fine (~1 µm diameter)
erosion channels form through a partial discharge (PD) activity within the evolving tree
structure. These partial discharges cause decomposition of the insulation, mainly in the gases.
The composition of produced gases depends on material and local temperature produced by the
discharge. All researchers seem to agree upon the fact that once initiated, electrical tree will
propagate through the weakest part of the structure due to effect of discharge in the formed
cavity. At higher temperature due to reduction in intrinsic strength, time to breakdown is
reduced by considerable amount. This work attempts to predict the future performance of cable
based on breakdown characteristic of the insulation implementing real working condition of the
cable with temperature of 1000C.
14
2.3 Experimental Setup
2.3.1 Electrical Breakdown Test
Since electrical trees are initiated at, and grow from sites of stress concentration rather than
in uniform fields, it is important that selected experimental procedure provide constant and
reproducible conditions of electrical stressing. Among the different experimental procedures
mentioned in [6], the needle test is selected, based on ASTM D 3756-97. The needle test
provides comparative data and not the degree of correlation with actual performance in service,
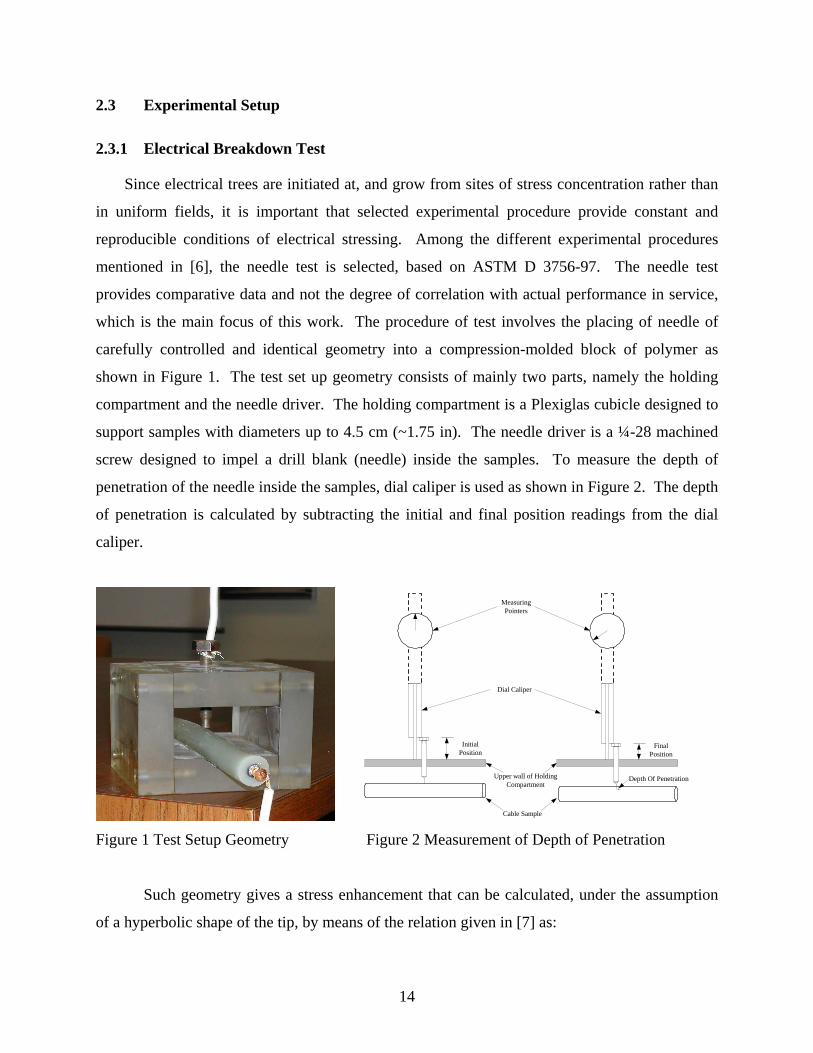
which is the main focus of this work. The procedure of test involves the placing of needle of
carefully controlled and identical geometry into a compression-molded block of polymer as
shown in Figure 1. The test set up geometry consists of mainly two parts, namely the holding
compartment and the needle driver. The holding compartment is a Plexiglas cubicle designed to
support samples with diameters up to 4.5 cm (~1.75 in). The needle driver is a ¼-28 machined
screw designed to impel a drill blank (needle) inside the samples. To measure the depth of
penetration of the needle inside the samples, dial caliper is used as shown in Figure 2. The depth
of penetration is calculated by subtracting the initial and final position readings from the dial
caliper.
InitialPosition
FinalPosition
Upper wall of HoldingCompartment
Cable Sample
MeasuringPointers
Dial Caliper
Depth Of Penetration
Figure 1 Test Setup Geometry Figure 2 Measurement of Depth of Penetration
Such geometry gives a stress enhancement that can be calculated, under the assumption
of a hyperbolic shape of the tip, by means of the relation given in [7] as:
15
( )rdlnr
VEmax 42
×
×= (1)
Where, Emax = electrical field on the tip of the needle d = interelectrode gap r = Tip radius v = Applied voltage
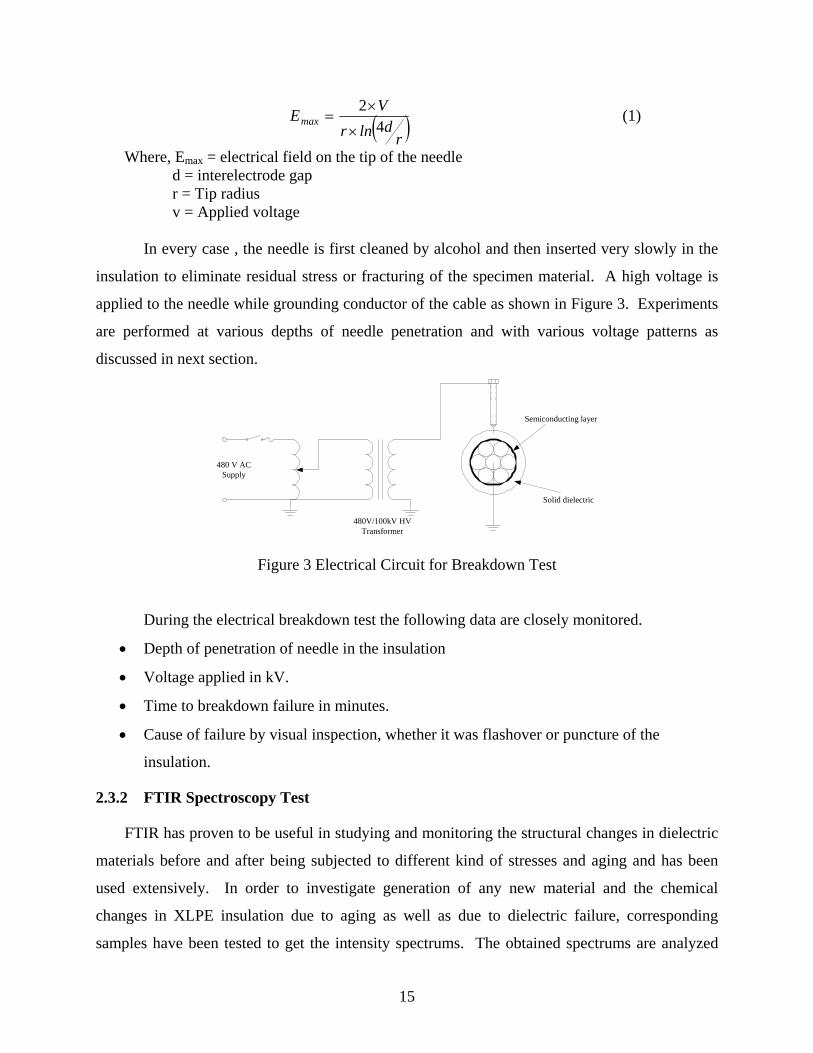
In every case , the needle is first cleaned by alcohol and then inserted very slowly in the
insulation to eliminate residual stress or fracturing of the specimen material. A high voltage is
applied to the needle while grounding conductor of the cable as shown in Figure 3. Experiments
are performed at various depths of needle penetration and with various voltage patterns as
discussed in next section.
Semiconducting layer
Solid dielectric
480 V ACSupply
480V/100kV HVTransformer
Figure 3 Electrical Circuit for Breakdown Test
During the electrical breakdown test the following data are closely monitored.
• Depth of penetration of needle in the insulation
• Voltage applied in kV.
• Time to breakdown failure in minutes.
• Cause of failure by visual inspection, whether it was flashover or puncture of the
insulation.
2.3.2 FTIR Spectroscopy Test
FTIR has proven to be useful in studying and monitoring the structural changes in dielectric
materials before and after being subjected to different kind of stresses and aging and has been
used extensively. In order to investigate generation of any new material and the chemical
changes in XLPE insulation due to aging as well as due to dielectric failure, corresponding
samples have been tested to get the intensity spectrums. The obtained spectrums are analyzed
16
based on the intensity of peaks. A Nicolet 205 FTIR spectrometer equipped with an EZ-scope
attachment from Spectra-Tech is used as a mean of microanalysis. The detector used is a liquid
nitrogen cooled MCT (Mercury Cadmium Telluride) detector.
The polyethylene is a polymeric material with long chain of hydrocarbon plastic produced
by the polymerization of ethylene gas (C2H4) either under low or high pressure. The
polyethylene can be classified based on relative degree of branching (side chain formation) in
their molecular structures, which can be controlled with selective catalysts. The cross-linking
process causes PE to change from a thermoplastic to thermosetting material with a marked
improvement in both physical and electrical properties. The individual molecular chains are
bonded to each other to form a three-dimensional polymer of extremely high molecular weight in
XLPE. Carbon black is added in XLPE to increase tensile strength and hardness but at the same
time affects the electrical properties of the insulation. Carbon black is added to guard against
ultraviolet radiation, which due to its absorption by the carbonyl group (C=O) may induce
degradation [8].
2.4 Results
2.4.1 Electrical Breakdown Test
Experiments are done at 1000C to simulate the actual working conditions of the cable.
Initially to finalize the voltage pattern for the electrical breakdown test, a continuously increasing
high voltage is applied with different depth of penetration and breakdown voltage is recorded.
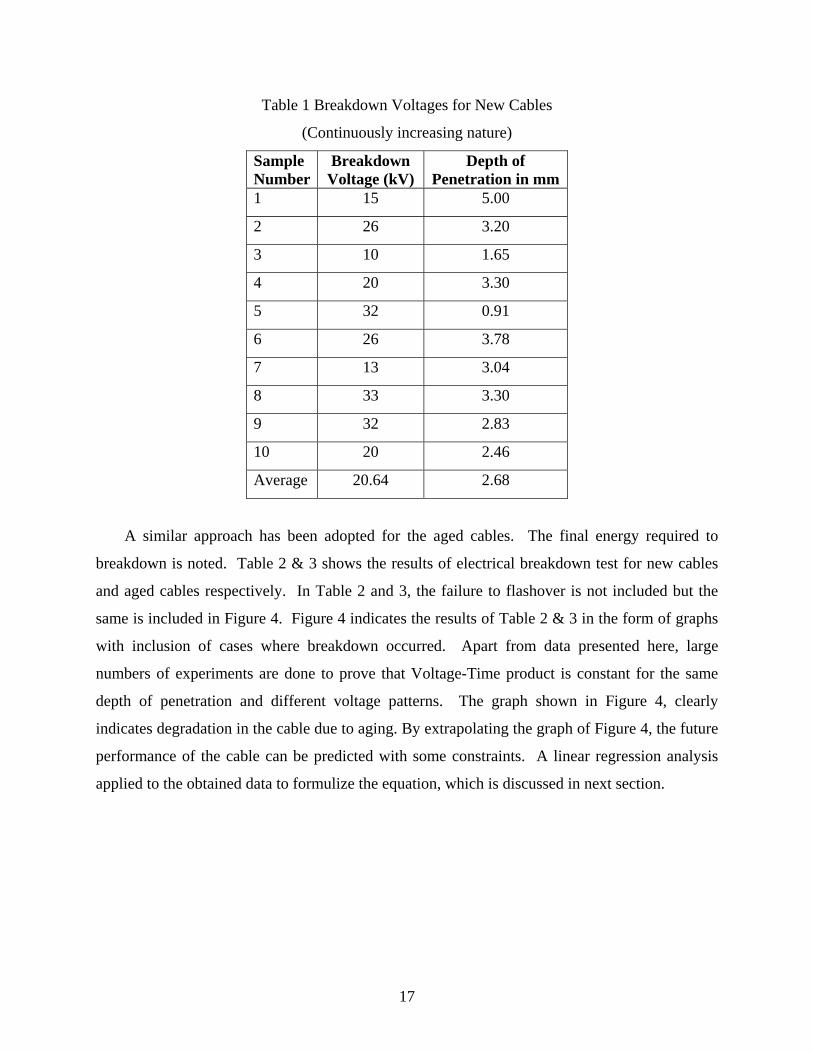
Ten different samples of new type have been tested as shown in Table 1. Average breakdown
voltage was about 20.64 kV with average depth of penetration of 2.68 mm. Using this result the
voltage pattern decided is 20 kV for first hour and then 5 kV increasing voltage per every half an
hour thereafter. The results obtained from the voltage pattern described have been evaluated
with the concept of total energy required to failure. The Voltage-Time product is calculated for
each case and attempt is made to relate this with the various depth of penetration and
temperature.
17
Table 1 Breakdown Voltages for New Cables
(Continuously increasing nature)
Sample Number
Breakdown Voltage (kV)
Depth of Penetration in mm
1 15 5.00
2 26 3.20
3 10 1.65
4 20 3.30
5 32 0.91
6 26 3.78
7 13 3.04
8 33 3.30
9 32 2.83
10 20 2.46
Average 20.64 2.68
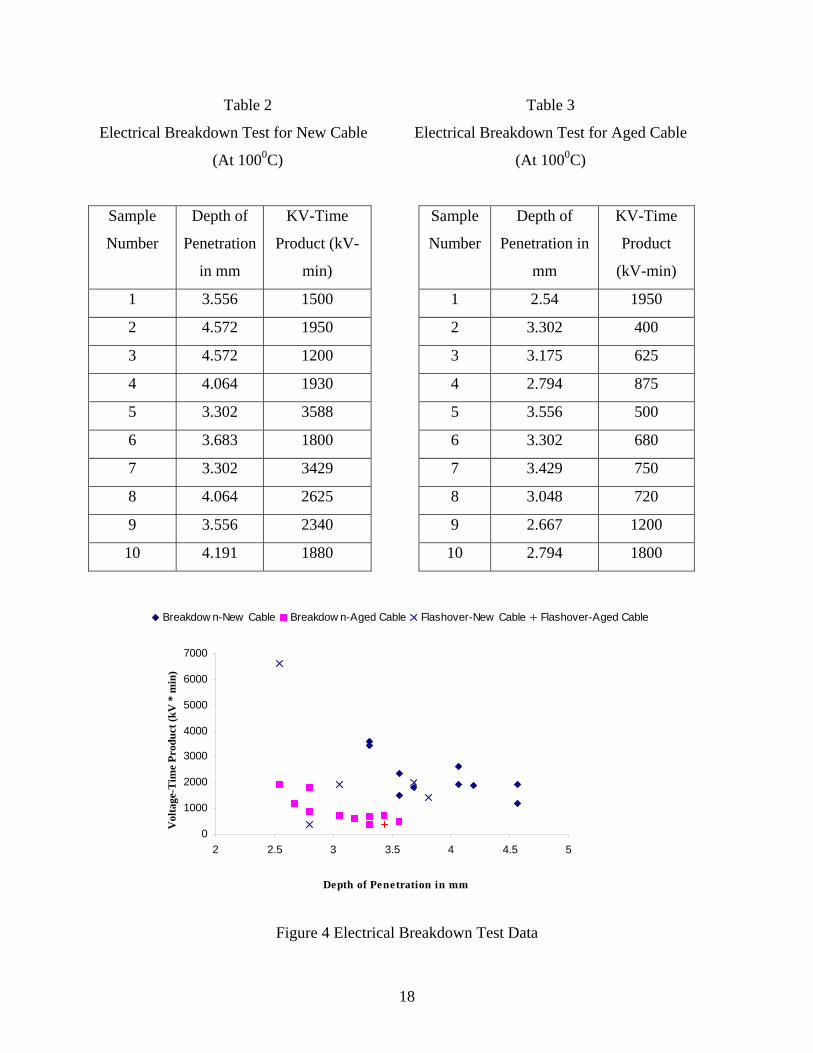
A similar approach has been adopted for the aged cables. The final energy required to
breakdown is noted. Table 2 & 3 shows the results of electrical breakdown test for new cables
and aged cables respectively. In Table 2 and 3, the failure to flashover is not included but the
same is included in Figure 4. Figure 4 indicates the results of Table 2 & 3 in the form of graphs
with inclusion of cases where breakdown occurred. Apart from data presented here, large
numbers of experiments are done to prove that Voltage-Time product is constant for the same
depth of penetration and different voltage patterns. The graph shown in Figure 4, clearly
indicates degradation in the cable due to aging. By extrapolating the graph of Figure 4, the future
performance of the cable can be predicted with some constraints. A linear regression analysis
applied to the obtained data to formulize the equation, which is discussed in next section.
18
Table 2 Table 3
Electrical Breakdown Test for New Cable
(At 1000C)
Electrical Breakdown Test for Aged Cable
(At 1000C)
Sample
Number
Depth of
Penetration
in mm
KV-Time
Product (kV-
min)
Sample
Number
Depth of
Penetration in
mm
KV-Time
Product
(kV-min)
1 3.556 1500 1 2.54 1950
2 4.572 1950 2 3.302 400
3 4.572 1200 3 3.175 625
4 4.064 1930 4 2.794 875
5 3.302 3588 5 3.556 500
6 3.683 1800 6 3.302 680
7 3.302 3429 7 3.429 750
8 4.064 2625 8 3.048 720
9 3.556 2340 9 2.667 1200
10 4.191 1880 10 2.794 1800
0
1000
2000
3000
4000
5000
6000
7000
2 2.5 3 3.5 4 4.5 5
Depth of Penetration in mm
Vol
tage
-Tim
e Pr
oduc
t (kV
* m
in)
Breakdow n-New Cable Breakdow n-Aged Cable Flashover-New Cable Flashover-Aged Cable
Figure 4 Electrical Breakdown Test Data
19
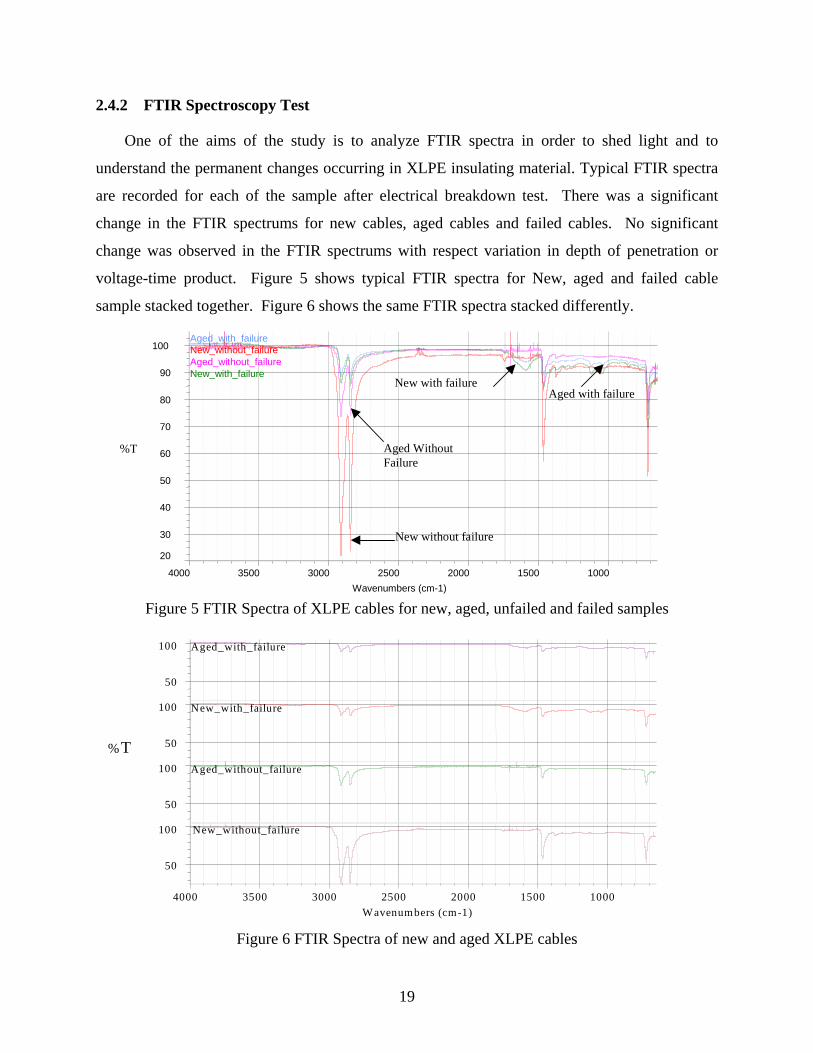
2.4.2 FTIR Spectroscopy Test
One of the aims of the study is to analyze FTIR spectra in order to shed light and to
understand the permanent changes occurring in XLPE insulating material. Typical FTIR spectra
are recorded for each of the sample after electrical breakdown test. There was a significant
change in the FTIR spectrums for new cables, aged cables and failed cables. No significant
change was observed in the FTIR spectrums with respect variation in depth of penetration or
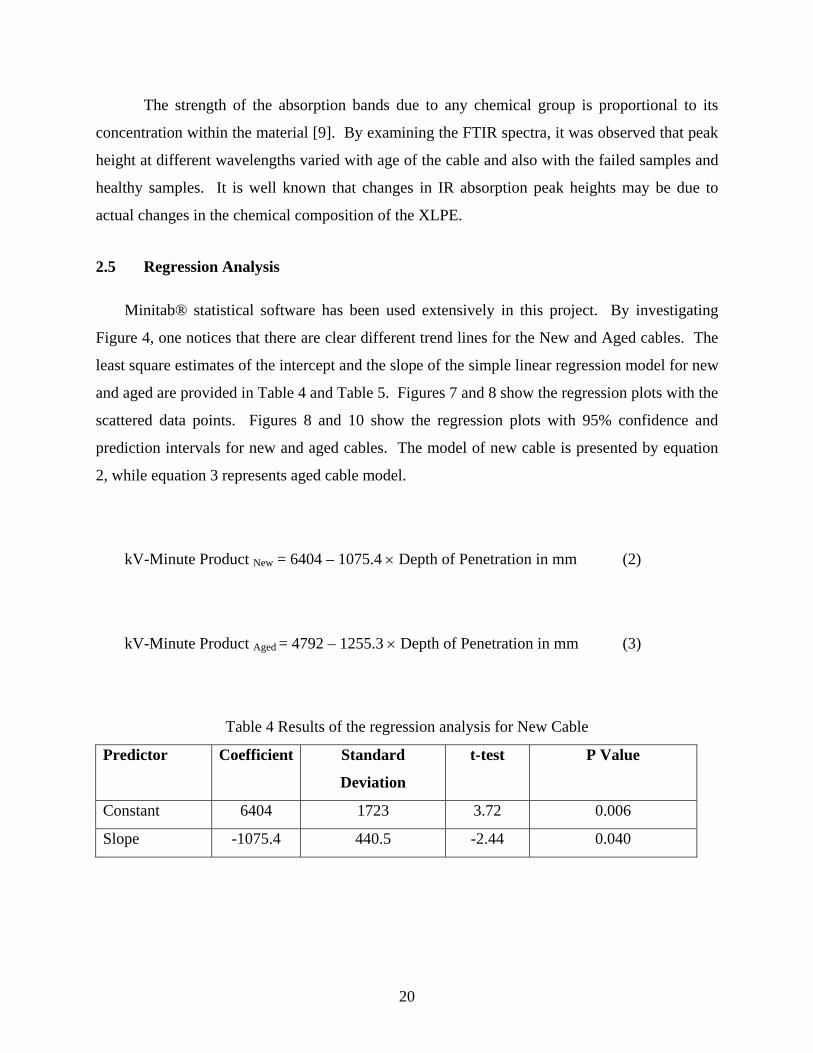
voltage-time product. Figure 5 shows typical FTIR spectra for New, aged and failed cable
sample stacked together. Figure 6 shows the same FTIR spectra stacked differently.
Figure 5 FTIR Spectra of XLPE cables for new, aged, unfailed and failed samples
Figure 6 FTIR Spectra of new and aged XLPE cables
Aged_with_failure New_without_failure Aged_without_failure New_with_failure
20 30
40
50
60
70
80
90
100
1000 1500 2000 2500 3000 3500 4000 Wavenumbers (cm-1)
%T
New without failure
Aged Without Failure
New with failureAged with failure
Aged_with_failure
50
100
New_with_failure
50
100
Aged_without_failure
50
100
New_without_failure
50
100
1000 1500 2000 2500 3000 3500 4000 Wavenumbers (cm-1)
%T
20
The strength of the absorption bands due to any chemical group is proportional to its
concentration within the material [9]. By examining the FTIR spectra, it was observed that peak
height at different wavelengths varied with age of the cable and also with the failed samples and
healthy samples. It is well known that changes in IR absorption peak heights may be due to
actual changes in the chemical composition of the XLPE.
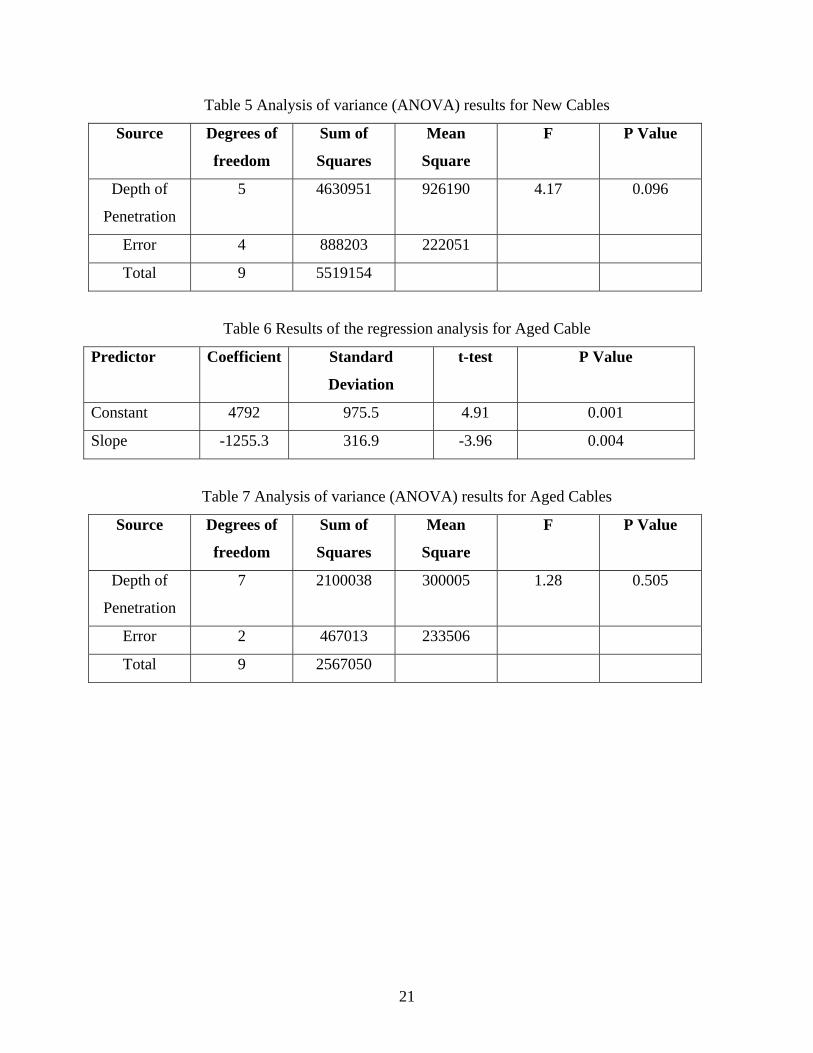
2.5 Regression Analysis
Minitab® statistical software has been used extensively in this project. By investigating
Figure 4, one notices that there are clear different trend lines for the New and Aged cables. The
least square estimates of the intercept and the slope of the simple linear regression model for new
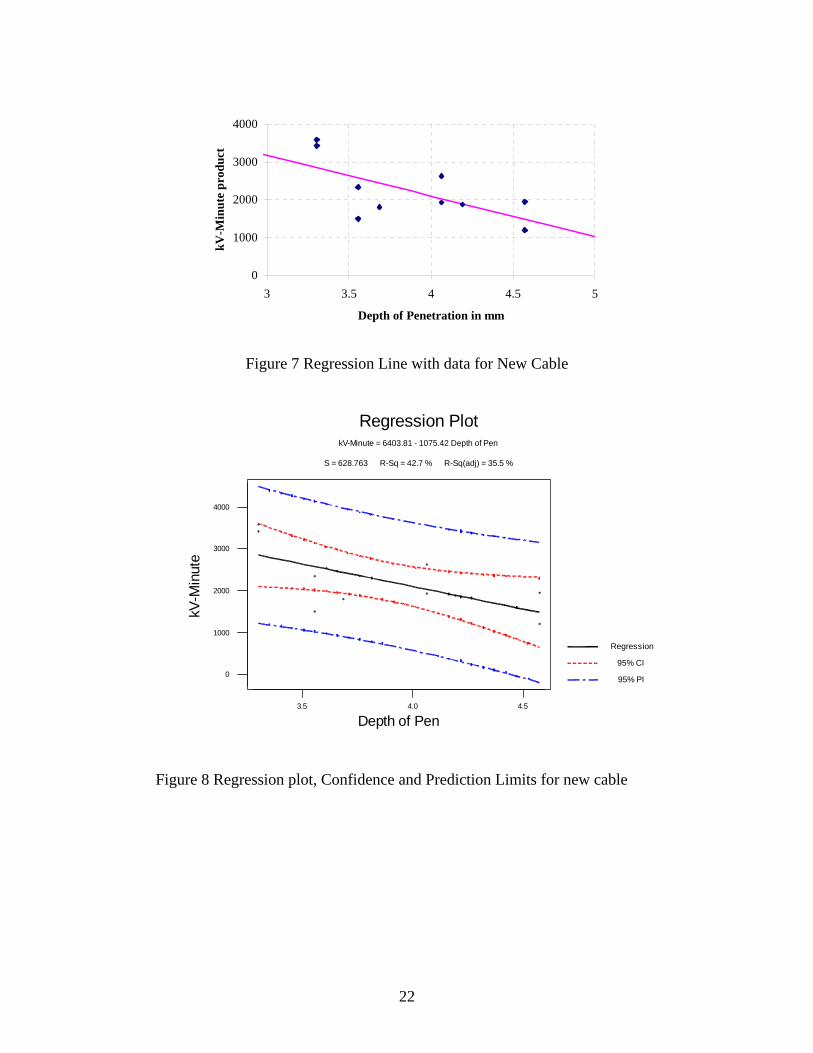
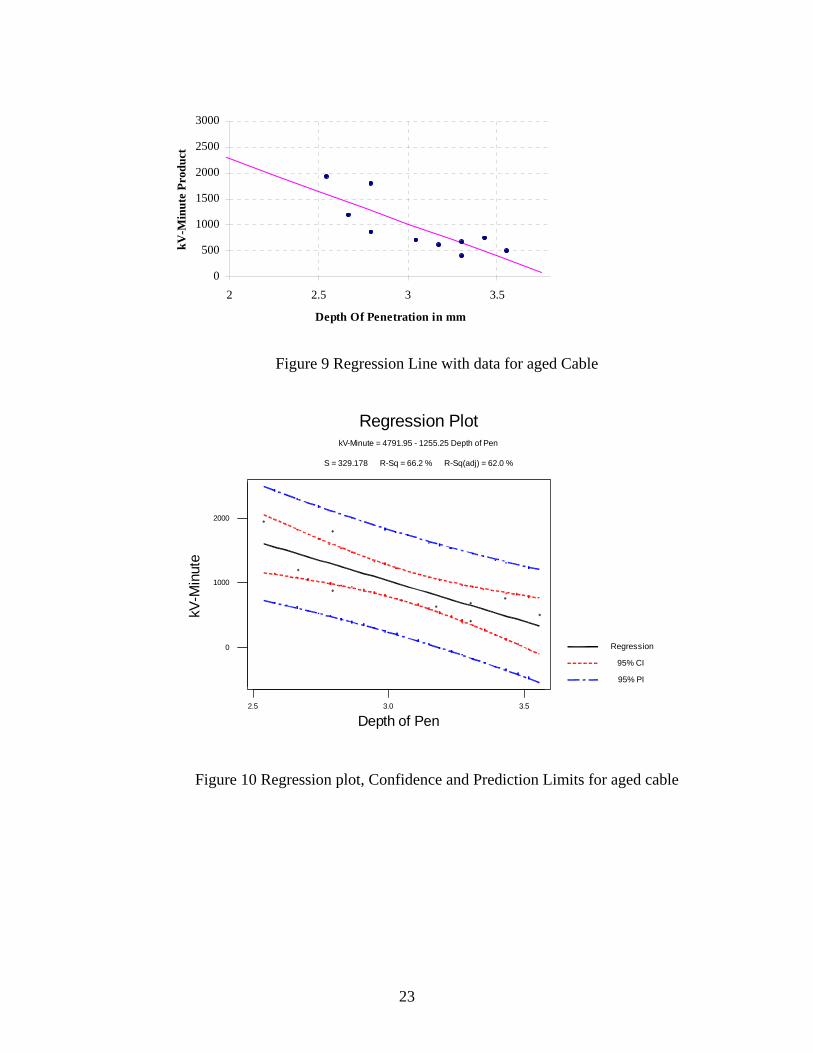
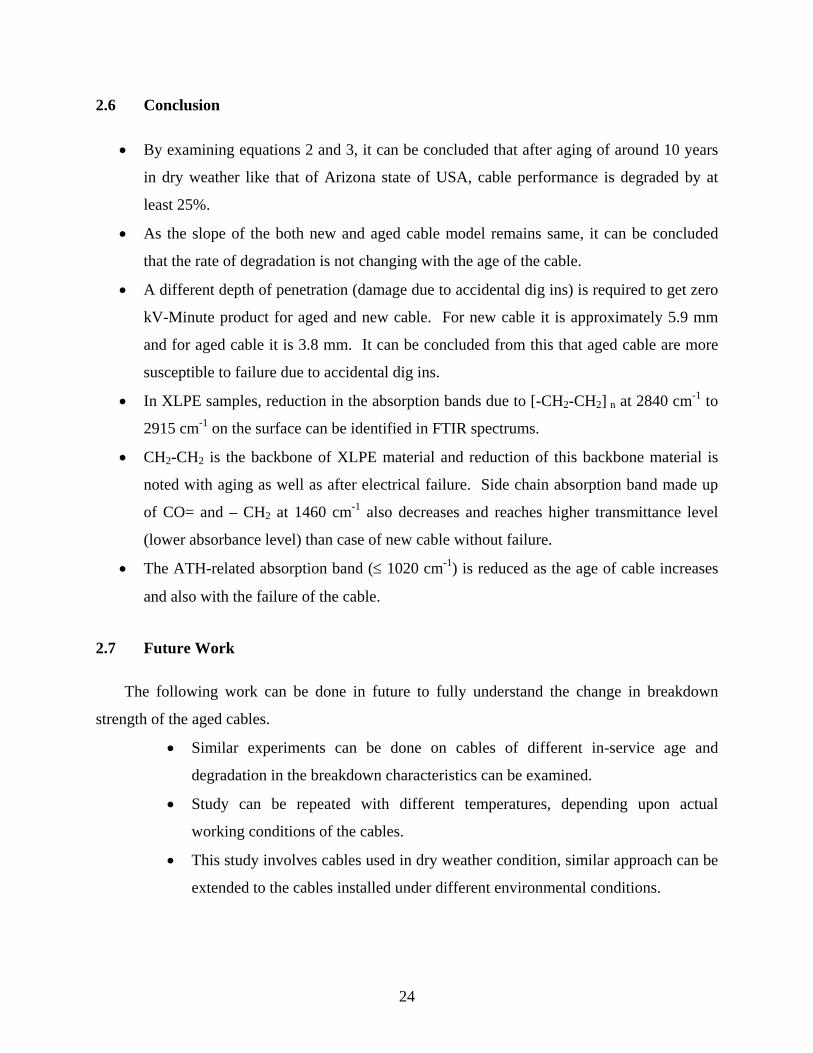
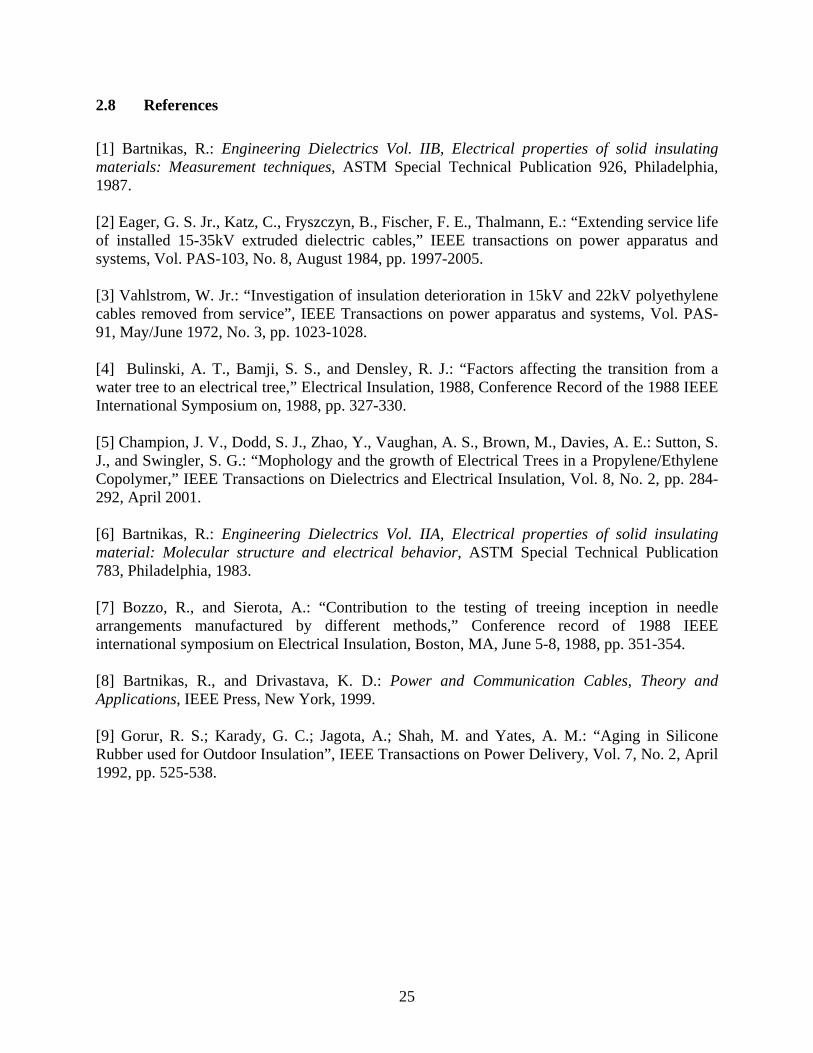
and aged are provided in Table 4 and Table 5. Figures 7 and 8 show the regression plots with the
scattered data points. Figures 8 and 10 show the regression plots with 95% confidence and
prediction intervals for new and aged cables. The model of new cable is presented by equation
2, while equation 3 represents aged cable model.
kV-Minute Product New = 6404 – 1075.4 × Depth of Penetration in mm (2)
kV-Minute Product Aged = 4792 – 1255.3 × Depth of Penetration in mm (3)
Table 4 Results of the regression analysis for New Cable
Predictor Coefficient Standard
Deviation
t-test P Value
Constant 6404 1723 3.72 0.006
Slope -1075.4 440.5 -2.44 0.040
21
Table 5 Analysis of variance (ANOVA) results for New Cables
Source Degrees of
freedom
Sum of
Squares
Mean
Square
F P Value
Depth of
Penetration
5 4630951 926190 4.17 0.096
Error 4 888203 222051
Total 9 5519154
Table 6 Results of the regression analysis for Aged Cable
Predictor Coefficient Standard
Deviation
t-test P Value
Constant 4792 975.5 4.91 0.001
Slope -1255.3 316.9 -3.96 0.004
Table 7 Analysis of variance (ANOVA) results for Aged Cables
Source Degrees of
freedom
Sum of
Squares
Mean
Square
F P Value
Depth of
Penetration
7 2100038 300005 1.28 0.505
Error 2 467013 233506
Total 9 2567050
22
0
1000
2000
3000
4000
3 3.5 4 4.5 5
Depth of Penetration in mm
kV-M
inut
e pr
oduc
t
Figure 7 Regression Line with data for New Cable
3.5 4.0 4.5
0
1000
2000
3000
4000
Depth of Pen
kV-M
inut
e
kV-Minute = 6403.81 - 1075.42 Depth of Pen
S = 628.763 R-Sq = 42.7 % R-Sq(adj) = 35.5 %
Regression
95% CI
95% PI
Regression Plot
Figure 8 Regression plot, Confidence and Prediction Limits for new cable
23
0
500
1000
1500
2000
2500
3000
2 2.5 3 3.5
Depth Of Penetration in mm
kV-M
inut
e Pr
oduc
t
Figure 9 Regression Line with data for aged Cable
3.53.02.5
2000
1000
0
Depth of Pen
kV-M
inut
e
S = 329.178 R-Sq = 66.2 % R-Sq(adj) = 62.0 %
kV-Minute = 4791.95 - 1255.25 Depth of Pen
95% PI
95% CI
Regression
Regression Plot
Figure 10 Regression plot, Confidence and Prediction Limits for aged cable
24
2.6 Conclusion
• By examining equations 2 and 3, it can be concluded that after aging of around 10 years
in dry weather like that of Arizona state of USA, cable performance is degraded by at
least 25%.
• As the slope of the both new and aged cable model remains same, it can be concluded
that the rate of degradation is not changing with the age of the cable.
• A different depth of penetration (damage due to accidental dig ins) is required to get zero
kV-Minute product for aged and new cable. For new cable it is approximately 5.9 mm
and for aged cable it is 3.8 mm. It can be concluded from this that aged cable are more
susceptible to failure due to accidental dig ins.
• In XLPE samples, reduction in the absorption bands due to [-CH2-CH2] n at 2840 cm-1 to
2915 cm-1 on the surface can be identified in FTIR spectrums.
• CH2-CH2 is the backbone of XLPE material and reduction of this backbone material is
noted with aging as well as after electrical failure. Side chain absorption band made up
of CO= and – CH2 at 1460 cm-1 also decreases and reaches higher transmittance level
(lower absorbance level) than case of new cable without failure.
• The ATH-related absorption band (≤ 1020 cm-1) is reduced as the age of cable increases
and also with the failure of the cable.
2.7 Future Work
The following work can be done in future to fully understand the change in breakdown
strength of the aged cables.
• Similar experiments can be done on cables of different in-service age and
degradation in the breakdown characteristics can be examined.
• Study can be repeated with different temperatures, depending upon actual
working conditions of the cables.
• This study involves cables used in dry weather condition, similar approach can be
extended to the cables installed under different environmental conditions.
25
2.8 References
[1] Bartnikas, R.: Engineering Dielectrics Vol. IIB, Electrical properties of solid insulating materials: Measurement techniques, ASTM Special Technical Publication 926, Philadelphia, 1987. [2] Eager, G. S. Jr., Katz, C., Fryszczyn, B., Fischer, F. E., Thalmann, E.: “Extending service life of installed 15-35kV extruded dielectric cables,” IEEE transactions on power apparatus and systems, Vol. PAS-103, No. 8, August 1984, pp. 1997-2005. [3] Vahlstrom, W. Jr.: “Investigation of insulation deterioration in 15kV and 22kV polyethylene cables removed from service”, IEEE Transactions on power apparatus and systems, Vol. PAS-91, May/June 1972, No. 3, pp. 1023-1028. [4] Bulinski, A. T., Bamji, S. S., and Densley, R. J.: “Factors affecting the transition from a water tree to an electrical tree,” Electrical Insulation, 1988, Conference Record of the 1988 IEEE International Symposium on, 1988, pp. 327-330. [5] Champion, J. V., Dodd, S. J., Zhao, Y., Vaughan, A. S., Brown, M., Davies, A. E.: Sutton, S. J., and Swingler, S. G.: “Mophology and the growth of Electrical Trees in a Propylene/Ethylene Copolymer,” IEEE Transactions on Dielectrics and Electrical Insulation, Vol. 8, No. 2, pp. 284-292, April 2001. [6] Bartnikas, R.: Engineering Dielectrics Vol. IIA, Electrical properties of solid insulating material: Molecular structure and electrical behavior, ASTM Special Technical Publication 783, Philadelphia, 1983. [7] Bozzo, R., and Sierota, A.: “Contribution to the testing of treeing inception in needle arrangements manufactured by different methods,” Conference record of 1988 IEEE international symposium on Electrical Insulation, Boston, MA, June 5-8, 1988, pp. 351-354. [8] Bartnikas, R., and Drivastava, K. D.: Power and Communication Cables, Theory and Applications, IEEE Press, New York, 1999. [9] Gorur, R. S.; Karady, G. C.; Jagota, A.; Shah, M. and Yates, A. M.: “Aging in Silicone Rubber used for Outdoor Insulation”, IEEE Transactions on Power Delivery, Vol. 7, No. 2, April 1992, pp. 525-538.