Embed Size (px)
Citation preview

ORNL/LTR-2019/1288NOTICE: This document contains information of a preliminary nature and is not intended for release. It is subject to revision or correction and therefore does not represent a final report.
Performance Evaluation of the ThermoLift Natural Gas Fired Air Conditioner and Cold-Climate Heat Pump
Peter HofbauerPaul SchwartzVishaldeep Sharma
September 2019
Approved for public release. Distribution is unlimited
DOCUMENT AVAILABILITYReports produced after January 1, 1996, are generally available free via US Department of Energy (DOE) SciTech Connect.
Website www.osti.gov
Reports produced before January 1, 1996, may be purchased by members of the public from the following source:
National Technical Information Service5285 Port Royal RoadSpringfield, VA 22161Telephone 703-605-6000 (1-800-553-6847)TDD 703-487-4639Fax 703-605-6900E-mail [email protected] http://classic.ntis.gov/
Reports are available to DOE employees, DOE contractors, Energy Technology Data Exchange representatives, and International Nuclear Information System representatives from the following source:
Office of Scientific and Technical InformationPO Box 62Oak Ridge, TN 37831Telephone 865-576-8401Fax 865-576-5728E-mail [email protected] http://www.osti.gov/contact.html
This report was prepared as an account of work sponsored by an agency of the United States Government. Neither the United States Government nor any agency thereof, nor any of their employees, makes any warranty, express or implied, or assumes any legal liability or responsibility for the accuracy, completeness, or usefulness of any information, apparatus, product, or process disclosed, or represents that its use would not infringe privately owned rights. Reference herein to any specific commercial product, process, or service by trade name, trademark, manufacturer, or otherwise, does not necessarily constitute or imply its endorsement, recommendation, or favoring by the United States Government or any agency thereof. The views and opinions of authors expressed herein do not necessarily state or reflect those of the United States Government or any agency thereof.
ORNL/LTR-2019/1288
Energy and Transportation Science Division
Performance Evaluation of the ThermoLift Natural Gas Fired Air Conditioner and Cold-Climate Heat Pump
Peter HofbauerVishaldeep Sharma
Jonathan HaasDiana BrehobPaul Schwartz
September 2019
Prepared byOAK RIDGE NATIONAL LABORATORY
Oak Ridge, TN 37831-6283managed by
UT-BATTELLE, LLCfor the
US DEPARTMENT OF ENERGYunder contract DE-AC05-00OR22725

iii
1. TABLE OF CONTENTS
1. TABLE OF CONTENTS .....................................................................................................................iii2. LIST OF FIGURES..............................................................................................................................iii3. LIST OF TABLES................................................................................................................................iv4. ABBREVIATIONS ...............................................................................................................................vACKNOWLEDGEMENTS..........................................................................................................................vi5. EXECUTIVE SUMMARY ...................................................................................................................16. CLAIMED TECHNOLOGY BENEFITS .............................................................................................17. TECHNOLOGY DESCRIPTION .........................................................................................................28. SYSTEM COMPONENTS AND DESCRIPTION...............................................................................69. IMPLEMENTATION OF THE HEAT PUMP TECHNOLOGY.........................................................710. OVERVIEW OF TESTING ..................................................................................................................911. INSTRUMENTATION .......................................................................................................................1012. TEST PROCEDURE ...........................................................................................................................1213. TEST RESULTS..................................................................................................................................1214. CONCLUSIONS .................................................................................................................................2215. REFERENCES ....................................................................................................................................23
2. LIST OF FIGURES
Figure 1: High level integration of TCHP™ into building, conceptual installation into building .................Figure 2: Cross sections showing TCHP™ chambers with coolant loop and helium flow............................Figure 3: Displacer and chamber volume movement in the TCHP™ (Top) and Pressure-Volume
diagram for the cycle in hot, warm, and cold chambers simulated and measured (Bottom)..............Figure 4: Mechatronic driver for top displacer ...............................................................................................Figure 5: TCHP™ Gen 3.0 machine and identification of major system components. .................................Figure 6: Home heating schematic using the TCHP™...................................................................................Figure 7: Home cooling schematic using the TCHP™...................................................................................Figure 8: Laboratory setup for the cold and warm coolant loops ...................................................................Figure 9: Sensor locations within the TCHP™, collecting 23 independent data points.................................Figure 10: Inlet temperatures to warm HX and cold HX over test interval on August 6, 2018. ....................Figure 11: Heat rate inputs from hot and cold side, heat rate output from the warm side, and heat
rate available from the condenser over the four test points; data collected on August 6, 2018.....................................................................................................................................................
Figure 12: Heat output rate from the warm HX, heat input rate to the warm HX from the cold and hot and resulting cycle COP from August 6, 2018. ............................................................................
Figure 13: Cycle COP of TCHP™ measured in two laboratories in July and August of 2018......................Figure 14: Temperatures in the ThermoLift heat pump over the test duration on August 6, 2018;
test points 1, 2, 3, and 4 identified by green dotted line .....................................................................Figure 15: Gas and surface temperatures at test point #1, −25°C (−13°F). ....................................................Figure 16: Gas and surface temperatures at test point #4, 20°C (68°F). ........................................................Figure 17: Gas and surface temperatures at test point #3, 8.3°C (47°F). .......................................................Figure 18: Gas and surface temperatures at test point #4, 20°C (68°F)..........................................................Figure 19: Temperature in the cold end when no cold coolant is circulated, on August 6, 2018...................Figure 20: Position of the hot and cold displacers (upper graph); working gas pressure in the cold
chamber and gas spring pressure (lower graph)..................................................................................

iv
3. LIST OF TABLES
Table 1. Instrumentation specifications .....................................................................................................18Table 2: List of test points, setpoint temperatures, and actual testing temperatures................................20Table 3. Measured heating capacity of the TCHP at four “ambient” temperatures................................22Table 4: Uncertainty in Cycle COP ............................................................................................................24Table 5: Summary of test conditions for four cold coolant inlet temperatures. .......................................26Table 6: COP and capacity of the TCHP compared to DOE targets. .......................................................32
v
4. ABBREVIATIONS
TCHP™ - Thermal Compression Heat PumpHVAC – Heating, Ventilation, Air-ConditioningGHG – Greenhouse GasGWP - Global Warming PotentialTRL - Technology Readiness LevelDOE – Department of EnergyEERE – Energy Efficiency and Renewable EnergyORNL – Oak Ridge National LaboratorySOW – Statement of WorkCOP – Coefficient of PerformanceHX – Heat Exchanger

vi
ACKNOWLEDGEMENTS
This report and the work described were sponsored by Building Technologies Office of the US Department of Energy Office of Energy Efficiency and Renewable Energy. The authors would like to acknowledge the insightful review comments of Dr. Brian Fricke of ORNL. This work would not have been possible without the excellent support of lab technicians Randy Linkous, Geoffrey Ormston, Tony Gehl.
7
5. EXECUTIVE SUMMARY
ThermoLift is currently developing its Thermal Compression Heat Pump (TCHP™), a natural-gas driven air conditioner and cold-climate heat pump, which can provide space heating, water heating, and air conditioning simultaneously in a single device. The system has broad application as a combined heating, ventilation, and air-conditioning (HVAC) solution with the benefit of substantial energy, cost, and greenhouse gas (GHG) reductions. Unlike traditional vapor compression heat-pumps, the TCHP™ uses helium as a working fluid in place of high global warming potential (GWP) refrigerants. The development effort has produced three iterations or generations of prototypes with advancement of the technology readiness level (TRL) from TRL-1 (TCHP™ Gen 1.0) to TRL-5 (TCHP™ Gen 3.0).1In August of 2013, the US DOE solicited the submission of proposals through funding opportunity announcement DE-FOA-0000823, Building Technologies Innovations Program. The Office of Energy Efficiency and Renewable Energy (EERE) subsequently accepted ThermoLift’s proposal to develop a heat pump system based on the Hofbauer cycle, a new cycle that supplants the Vuilleumier cycle and provided funding for prototype evaluation at Oak Ridge National Laboratory (ORNL). ORNL is a widely known research center for developing and evaluating building technologies. Through its Building Technologies Research and Integration Center, ORNL has unique capabilities which allows them to collaborate with industry and academia to advance building component technologies.The TCHP™ Gen 3.0 prototype was shipped to ORNL on July 23, 2018. After installation and integration of the heat pump into ORNL’s test facility and performing instrumentation validation and calibration, extended operation of the heat pump was achieved during continuous operation on August 6, 2018, and includes various heating and cooling temperature ranges and performance analysis. The Gen 3.0 prototype was evaluated at four “ambient” temperatures: −25°C, −8.33°C, 8.33°C, and 20°C, (−13°F, 17°F, 47°F, and 68°F) denoted as test points 1-4, respectively. For heating, cycle coefficients of performance (COP) at the four “ambient” temperatures were found to be 1.30, 1.46, 1.52, and 1.61, respectively. Furthermore, there is no capacity reduction as the inlet temperature to the cold heat exchanger (HX) decreases. The heating capacity delivered by the TCHP was found to be 12 kW at -25°C. Finally, this final report identifies measures for obtaining further efficiency improvements.
6. CLAIMED TECHNOLOGY BENEFITS
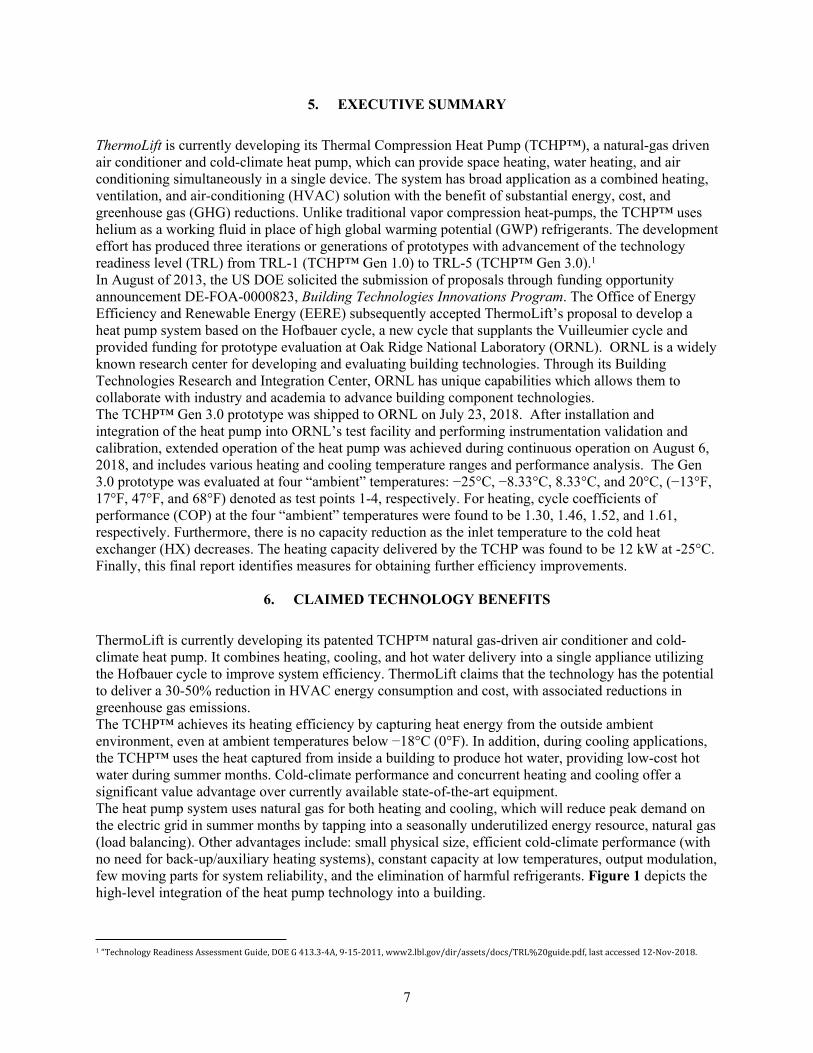
ThermoLift is currently developing its patented TCHP™ natural gas-driven air conditioner and cold-climate heat pump. It combines heating, cooling, and hot water delivery into a single appliance utilizing the Hofbauer cycle to improve system efficiency. ThermoLift claims that the technology has the potential to deliver a 30-50% reduction in HVAC energy consumption and cost, with associated reductions in greenhouse gas emissions. The TCHP™ achieves its heating efficiency by capturing heat energy from the outside ambient environment, even at ambient temperatures below −18°C (0°F). In addition, during cooling applications, the TCHP™ uses the heat captured from inside a building to produce hot water, providing low-cost hot water during summer months. Cold-climate performance and concurrent heating and cooling offer a significant value advantage over currently available state-of-the-art equipment. The heat pump system uses natural gas for both heating and cooling, which will reduce peak demand on the electric grid in summer months by tapping into a seasonally underutilized energy resource, natural gas (load balancing). Other advantages include: small physical size, efficient cold-climate performance (with no need for back-up/auxiliary heating systems), constant capacity at low temperatures, output modulation, few moving parts for system reliability, and the elimination of harmful refrigerants. Figure 1 depicts the high-level integration of the heat pump technology into a building.
1 “Technology Readiness Assessment Guide, DOE G 413.3-4A, 9-15-2011, www2.lbl.gov/dir/assets/docs/TRL%20guide.pdf, last accessed 12-Nov-2018.
8
7. TECHNOLOGY DESCRIPTION
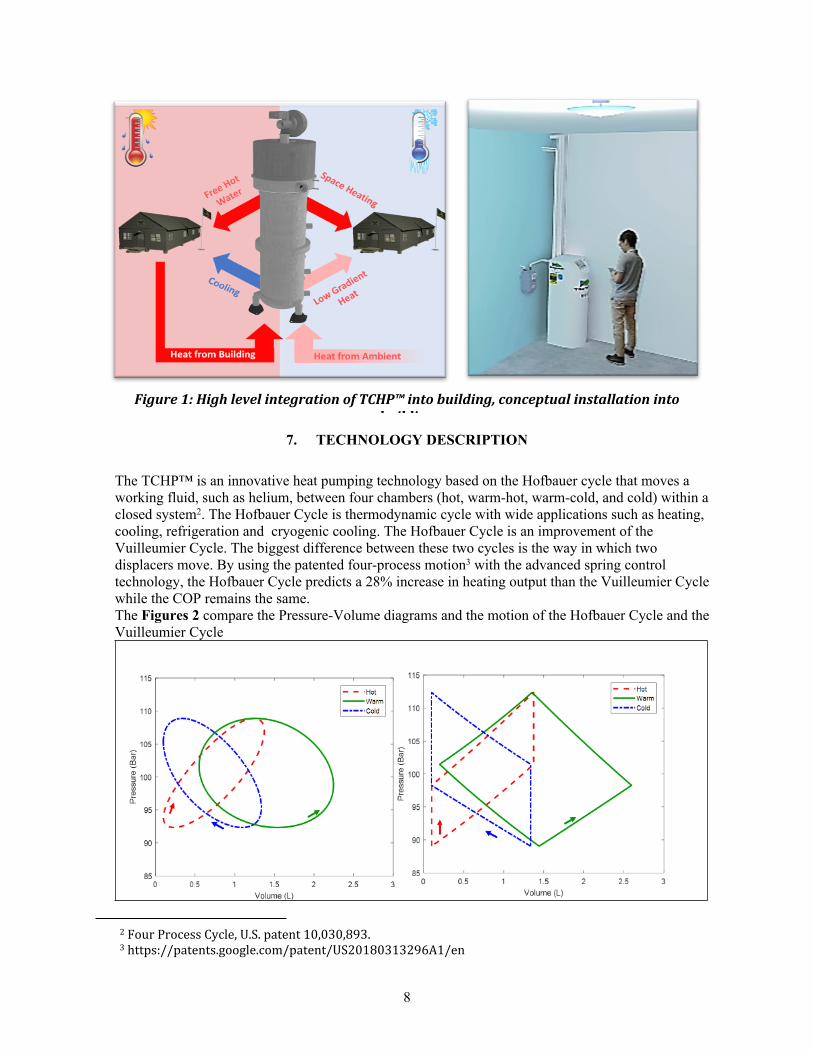
The TCHP™ is an innovative heat pumping technology based on the Hofbauer cycle that moves a working fluid, such as helium, between four chambers (hot, warm-hot, warm-cold, and cold) within a closed system2. The Hofbauer Cycle is thermodynamic cycle with wide applications such as heating, cooling, refrigeration and cryogenic cooling. The Hofbauer Cycle is an improvement of the Vuilleumier Cycle. The biggest difference between these two cycles is the way in which two displacers move. By using the patented four-process motion3 with the advanced spring control technology, the Hofbauer Cycle predicts a 28% increase in heating output than the Vuilleumier Cycle while the COP remains the same. The Figures 2 compare the Pressure-Volume diagrams and the motion of the Hofbauer Cycle and the Vuilleumier Cycle
2 Four Process Cycle, U.S. patent 10,030,893.3 https://patents.google.com/patent/US20180313296A1/en
Figure 1: High level integration of TCHP™ into building, conceptual installation into building

9
Figure 2: Cycle comparison between Hofbauer cycle and Vuilleumier cycle
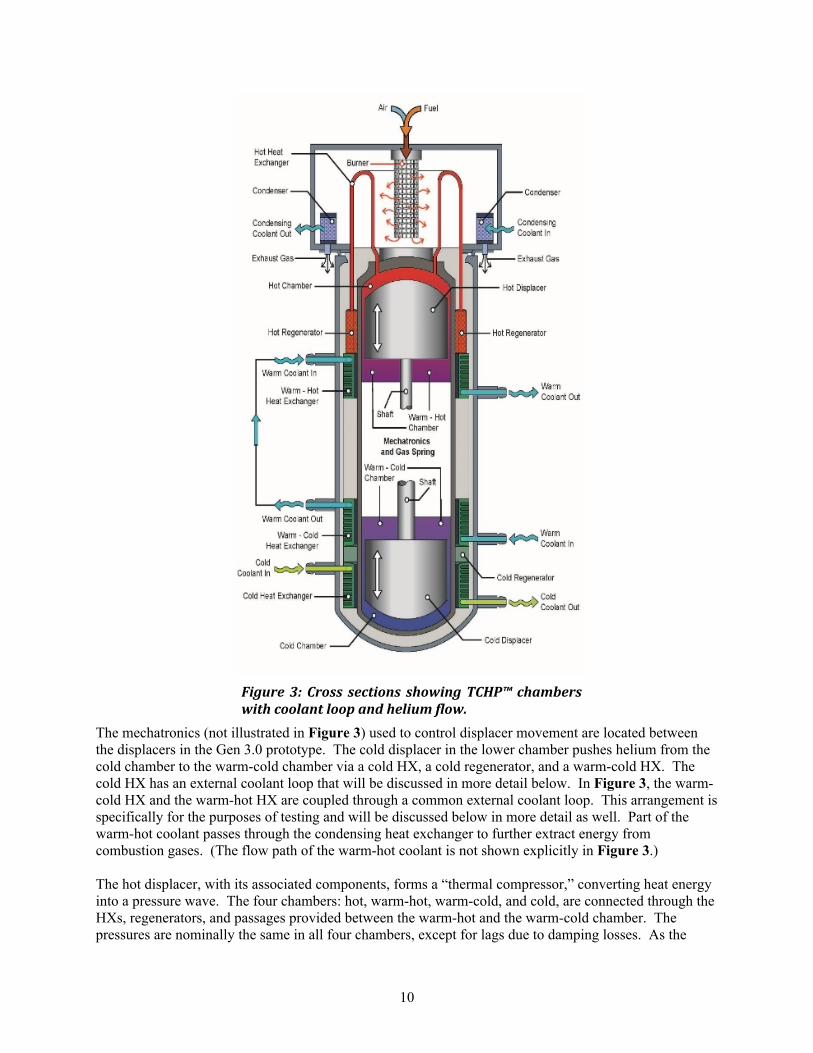
As shown in Figure 3, the hot and cold displacers in a TCHP reciprocate independently within a cylinder to shuttle the working fluid, helium, in and out of the chambers. The displacers are both shown in a middle position between their end points of travel so that the four chambers are all visible in Figure 3. Fuel is burned in a wire-mesh burner to produce a high-temperature heat source, the heat from which is transferred to the helium within the tubes of the hot heat exchanger (HX), shown in orange-red in Figure 3. The hot chamber helium temperature is controlled to 500oC (932oF). The hot HX in the Gen 3.0 prototype has 120 tubes, although only two are shown in Figure 3 for clarity. When the hot displacer moves upward, working fluid is pushed out of the hot chamber into a hot regenerator and a warm-hot HX. The warm-hot HX transfers energy from the helium to a coolant which is part of an external coolant loop (described further below).
10
The mechatronics (not illustrated in Figure 3) used to control displacer movement are located between the displacers in the Gen 3.0 prototype. The cold displacer in the lower chamber pushes helium from the cold chamber to the warm-cold chamber via a cold HX, a cold regenerator, and a warm-cold HX. The cold HX has an external coolant loop that will be discussed in more detail below. In Figure 3, the warm-cold HX and the warm-hot HX are coupled through a common external coolant loop. This arrangement is specifically for the purposes of testing and will be discussed below in more detail as well. Part of the warm-hot coolant passes through the condensing heat exchanger to further extract energy from combustion gases. (The flow path of the warm-hot coolant is not shown explicitly in Figure 3.)
The hot displacer, with its associated components, forms a “thermal compressor,” converting heat energy into a pressure wave. The four chambers: hot, warm-hot, warm-cold, and cold, are connected through the HXs, regenerators, and passages provided between the warm-hot and the warm-cold chamber. The pressures are nominally the same in all four chambers, except for lags due to damping losses. As the
Figure 3: Cross sections showing TCHP™ chambers with coolant loop and helium flow.
11
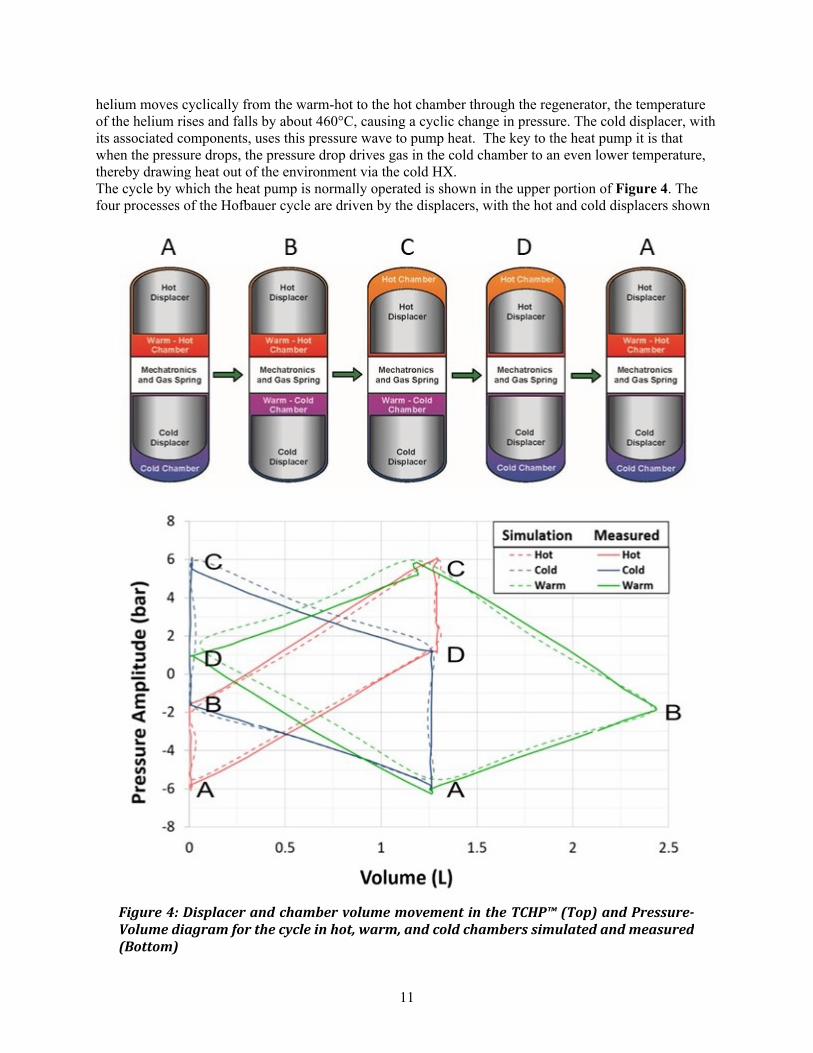
helium moves cyclically from the warm-hot to the hot chamber through the regenerator, the temperature of the helium rises and falls by about 460°C, causing a cyclic change in pressure. The cold displacer, with its associated components, uses this pressure wave to pump heat. The key to the heat pump it is that when the pressure drops, the pressure drop drives gas in the cold chamber to an even lower temperature, thereby drawing heat out of the environment via the cold HX. The cycle by which the heat pump is normally operated is shown in the upper portion of Figure 4. The four processes of the Hofbauer cycle are driven by the displacers, with the hot and cold displacers shown
Figure 4: Displacer and chamber volume movement in the TCHP™ (Top) and Pressure-Volume diagram for the cycle in hot, warm, and cold chambers simulated and measured (Bottom)

12
at the left-hand side (position A) of Figure 4 both being in their upper position with helium in the warm-hot and cold chambers. In moving from position A to position B, the cold displacer is moved downward towards the cold chamber thereby causing helium to flow into the annular space outside the cylinder (not shown in Figure 4) that includes the cold HX, cold regenerator, and warm-cold HX, and then into the warm-cold chamber. This results in a small increase in average gas temperature and pressure. From position B to position C, the hot displacer is actuated to move downward causing helium to flow out of the warm-hot chamber through the warm-hot HX, hot regenerator, hot heat HX, and into the hot chamber. This is the “compression” stroke, with the average gas temperature increasing substantially and therefore the average pressure rises. In the heat pump part of the machine, this rising pressure causes an increase in gas temperature throughout. Position C corresponds to the highest average gas temperature and therefore the highest pressure in the cycle. From positions C to D, the cold displacer is released to allow it to move upward causing helium to flow in the opposite direction from that described in going from positions A to B. The heat is captured in the warm-cold HX and the cold regenerator, and there is a small decrease in average gas temperature and therefore pressure. Moving from D to A the hot displacer moves upward pushing the helium through the heat exchangers and regenerators so the average gas temperature falls substantially, thereby causing a corresponding drop in the gas pressure, essentially the opposite flow as described from positions B to C. During this “expansion” stroke, most of the gas is in the cold chamber, where it cools even further due to the system pressure drop. During subsequent cycles, this low temperature gas is able to absorb heat from the environment via the cold HX.The left- and right-hand illustrations in Figure 4 both represent position A, i.e., the cycle is completed when the displacers return to position A at which point, the gas pressure and average temperature are at their lowest level in the cycle. The sequence then repeats. The cycle is illustrated on the P-V diagram (lower graph in Figure 4) for the hot, warm (warm-hot and warm-cold connected) and cold chambers.A cross-sectional illustration of the mechatronics in Figure 5 shows a displacer in mid-travel as it reciprocates within a cylinder. Displacer movement is driven primarily by the small varying pressure difference between the hot and cold sections, acting upon the displacers and shafts. Compression springs help buffer impacts at the end of the stroke and provides acceleration to begin the next stroke. Coils in back irons are provided at the upper and lower ends of travel to further control motion. The displacer shaft is coupled to an armature made of a ferromagnetic material and includes a permanent magnet. The coils also contribute motive force to the displacer, shaft, and armature (reciprocating elements), especially for startup, but relying solely upon electromagnetic force would cause excessive electrical energy draw.Compression springs provide much of the force to cause the reciprocating elements to move from end to end. When the upper coil is energized, the reciprocating elements move upward and compresses the upper compression spring, while the compression force of the lower compression spring is less than its neutral position shown in Error! Reference source not found. That is, the springs are biased such that
Figure 5: Mechatronic driver for top displacer

13
they are providing a force acting downward on the reciprocating elements. The coil holds against the spring force. When it is desired for the reciprocating elements to move downward, the upper coil is de-energized so that the upper compression spring pushes downward on the armature more than the lower compression spring is pushing upward, thereby causing the reciprocating elements to move downward. If there were no friction in the system and there was no pressure difference across the displacer, the armature would move to the fully downward position. However, due to losses in the system, the reciprocating elements fail to move fully to the downward position. To pull the reciprocating elements to their lower position, the lower coil is energized. As the reciprocating elements move downward, the lower compression spring compresses, which decelerates the reciprocating elements to help avoid impacting the lower coil as the armature approaches. Simultaneously, the kinetic energy of the reciprocating elements is converted into potential energy in the lower compression spring. This potential energy is used to move the reciprocating elements upward when the lower coil is de-energized. A major difference between the ThermoLift heat pump and a conventional Vuilleumier heat pump is that the displacers are independently actuated in the ThermoLift heat pump. This allows one displacer to move from one end of travel to the other end travel while the other displacer is stationary. Furthermore, it allows for dwell at ends of travel of the displacer. This control over displacer motion allows for controlling the heating or cooling delivered to match the demand.Not shown in Figure 5 are the power electronics required to drive the coil and a control unit that commands current to the coils based on a desired duty cycle and a signal from a position sensor (also not shown). In addition to the spring decelerating the reciprocating elements near the end of travel, current to the coil is tailored to avoid the armature impacting the coil. Hovering of the armature within a millimeter of the coil is employed to avoid noise of impact and to improve system durability. Figure 5 shows the elements for driving a single displacer. A second set of similar components drives a second displacer.
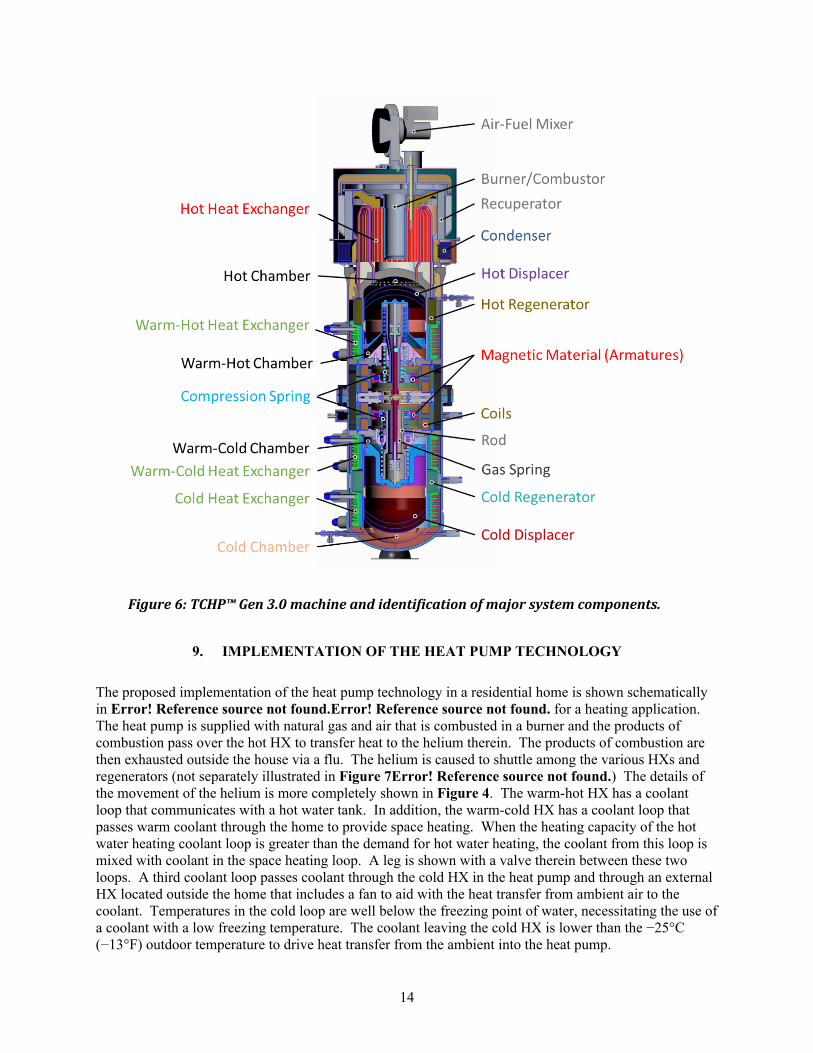
8. SYSTEM COMPONENTS AND DESCRIPTION
The major components of the Gen 3.0 prototype are identified in Figure 6 and include:
Heater head – made up of the air-fuel mixer, burner, recuperator, and condenser
Four heat exchangers – hot HX, warm-hot HX, warm-cold HX, and cold HX.
Two regenerators –hot regenerator and cold regenerator.
Mechatronics – The displacers are coupled to armatures via rods. The armatures include magnetic
material, which is acted upon by stationary coils, when the coils are energized. Each displacer
includes one armature and two stationary coils. The majority of the force on the displacers is
provided by compression springs, each displacer having a pair of compression springs that are
biased against each other.
14
9. IMPLEMENTATION OF THE HEAT PUMP TECHNOLOGY
The proposed implementation of the heat pump technology in a residential home is shown schematically in Error! Reference source not found.Error! Reference source not found. for a heating application. The heat pump is supplied with natural gas and air that is combusted in a burner and the products of combustion pass over the hot HX to transfer heat to the helium therein. The products of combustion are then exhausted outside the house via a flu. The helium is caused to shuttle among the various HXs and regenerators (not separately illustrated in Figure 7Error! Reference source not found.) The details of the movement of the helium is more completely shown in Figure 4. The warm-hot HX has a coolant loop that communicates with a hot water tank. In addition, the warm-cold HX has a coolant loop that passes warm coolant through the home to provide space heating. When the heating capacity of the hot water heating coolant loop is greater than the demand for hot water heating, the coolant from this loop is mixed with coolant in the space heating loop. A leg is shown with a valve therein between these two loops. A third coolant loop passes coolant through the cold HX in the heat pump and through an external HX located outside the home that includes a fan to aid with the heat transfer from ambient air to the coolant. Temperatures in the cold loop are well below the freezing point of water, necessitating the use of a coolant with a low freezing temperature. The coolant leaving the cold HX is lower than the −25°C (−13°F) outdoor temperature to drive heat transfer from the ambient into the heat pump.
Figure 6: TCHP™ Gen 3.0 machine and identification of major system components.

15
In Figure 7Error! Reference source not found., heat is transferred from the hot HX into the warm-hot HX and from the cold HX into the warm-cold HX. The thermal energy source for the hot HX is combustion of a hydrocarbon; the thermal energy source for the cold HX is ambient air.
A proposed cooling configuration for the heat pump technology is shown in Figure 8Error! Reference source not found., and is similar to the heating configuration. The major difference between heating and cooling is that the space cooling HX’s distributed through the house communicate with the heat pump’s cold HX, i.e., they are part of the cold coolant loop, as opposed to the warm-cold coolant loop as is the case for heating. The warm-cold HX is coupled to the external HX that is transferring energy to the environment (or where heat is needed). Note that in Figure 7Error! Reference source not found., thermal energy is extracted from the environment and in Figure 8Error! Reference source not found., thermal energy is transferred to the environment.
Figure 7: Home heating schematic using the TCHP™

16
The TCHP™ is connected to two liquid loops, outdoor and indoor, through a cold HX and warm HX. In domestic heating applications, such as for space heating and/or hot water heating, the TCHP™ extracts thermal energy from the combustion of natural gas and captures thermal energy from outside ambient air via an air-to-liquid HX. The TCHP™ delivers heat to the building via heated water. The cold HX within the heat pump is connected to an external HX located outside the building that absorbs energy from the ambient. In cooling applications, the cold HX absorbs heat from the building and the warm HX rejects this heat to the environment or hot water via the external HX.
10. OVERVIEW OF TESTING
The test matrix developed for prototype system evaluation was based on ISO Standard 13256-2:1998 (RA 2012) and AHRI Standard 210/240. The warm coolant temperature is maintained at 40±0.5°C (104±0.9°F), where the warm inlet temperature represents the return temperature of a modern hydronic heating system. A total of four cold coolant temperatures were used as surrogates for ambient conditions in cold and moderate climate zones, and are designated as Test Points (TP) 1 through 4: −25°C (TP1), −8.3°C (TP2), 8.3°C (TP3), and 20°C (TP4); (−13°F, 17°F, 47°F, and 68°F, respectively). Note that the test condition at −25°C (−13°F) outdoor temperature is not a standard test condition for ordinary electric heat pumps. It was selected in this evaluation to demonstrate the cold-climate performance of the TCHP™.To simulate the heating application illustrated in Figure 7 in a laboratory environment, two closed loops of recirculating fluid, a warm loop and a cold loop, are provided, as shown in Error! Reference source not found.. The warm fluid loop, which passes through the warm-cold and warm-hot heat exchangers,
Figure 8: Home cooling schematic using the TCHP™
17
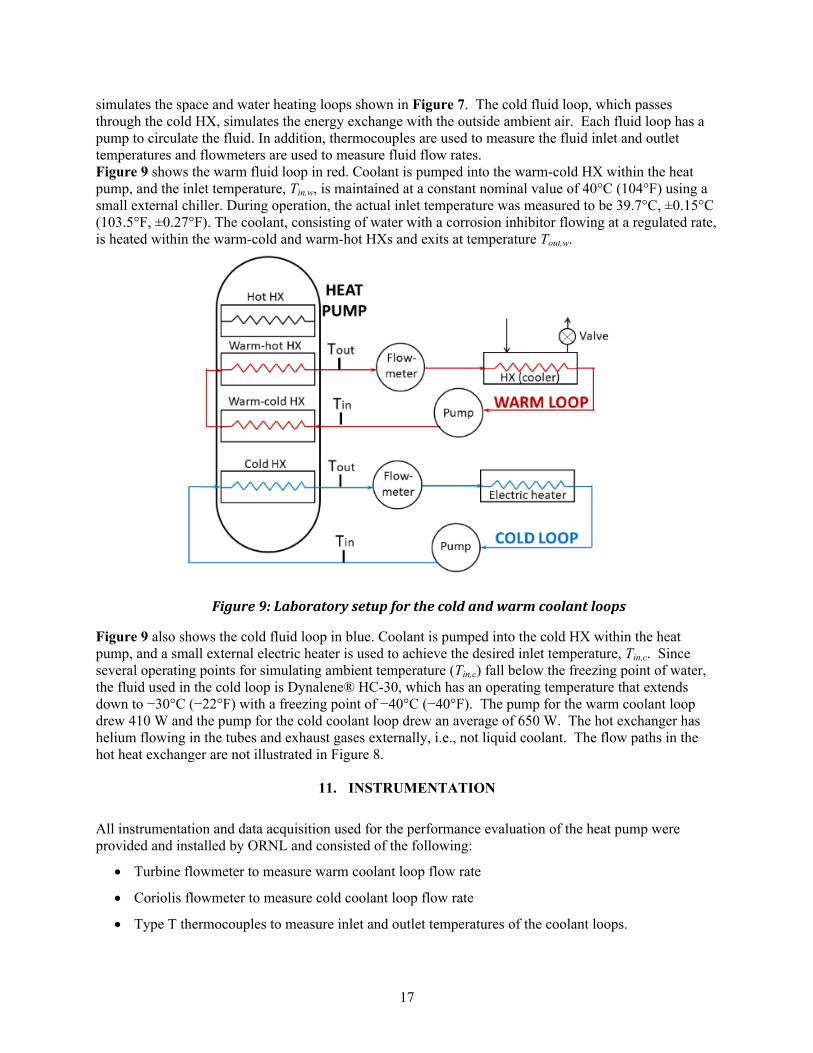
simulates the space and water heating loops shown in Figure 7. The cold fluid loop, which passes through the cold HX, simulates the energy exchange with the outside ambient air. Each fluid loop has a pump to circulate the fluid. In addition, thermocouples are used to measure the fluid inlet and outlet temperatures and flowmeters are used to measure fluid flow rates.Figure 9 shows the warm fluid loop in red. Coolant is pumped into the warm-cold HX within the heat pump, and the inlet temperature, Tin,w, is maintained at a constant nominal value of 40°C (104°F) using a small external chiller. During operation, the actual inlet temperature was measured to be 39.7°C, ±0.15°C (103.5°F, ±0.27°F). The coolant, consisting of water with a corrosion inhibitor flowing at a regulated rate, is heated within the warm-cold and warm-hot HXs and exits at temperature Tout,w.
Figure 9 also shows the cold fluid loop in blue. Coolant is pumped into the cold HX within the heat pump, and a small external electric heater is used to achieve the desired inlet temperature, Tin,c. Since several operating points for simulating ambient temperature (Tin,c) fall below the freezing point of water, the fluid used in the cold loop is Dynalene® HC-30, which has an operating temperature that extends down to −30°C (−22°F) with a freezing point of −40°C (−40°F). The pump for the warm coolant loop drew 410 W and the pump for the cold coolant loop drew an average of 650 W. The hot exchanger has helium flowing in the tubes and exhaust gases externally, i.e., not liquid coolant. The flow paths in the hot heat exchanger are not illustrated in Figure 8.
11. INSTRUMENTATION
All instrumentation and data acquisition used for the performance evaluation of the heat pump were provided and installed by ORNL and consisted of the following:
Turbine flowmeter to measure warm coolant loop flow rate
Coriolis flowmeter to measure cold coolant loop flow rate
Type T thermocouples to measure inlet and outlet temperatures of the coolant loops.
Figure 9: Laboratory setup for the cold and warm coolant loops

18
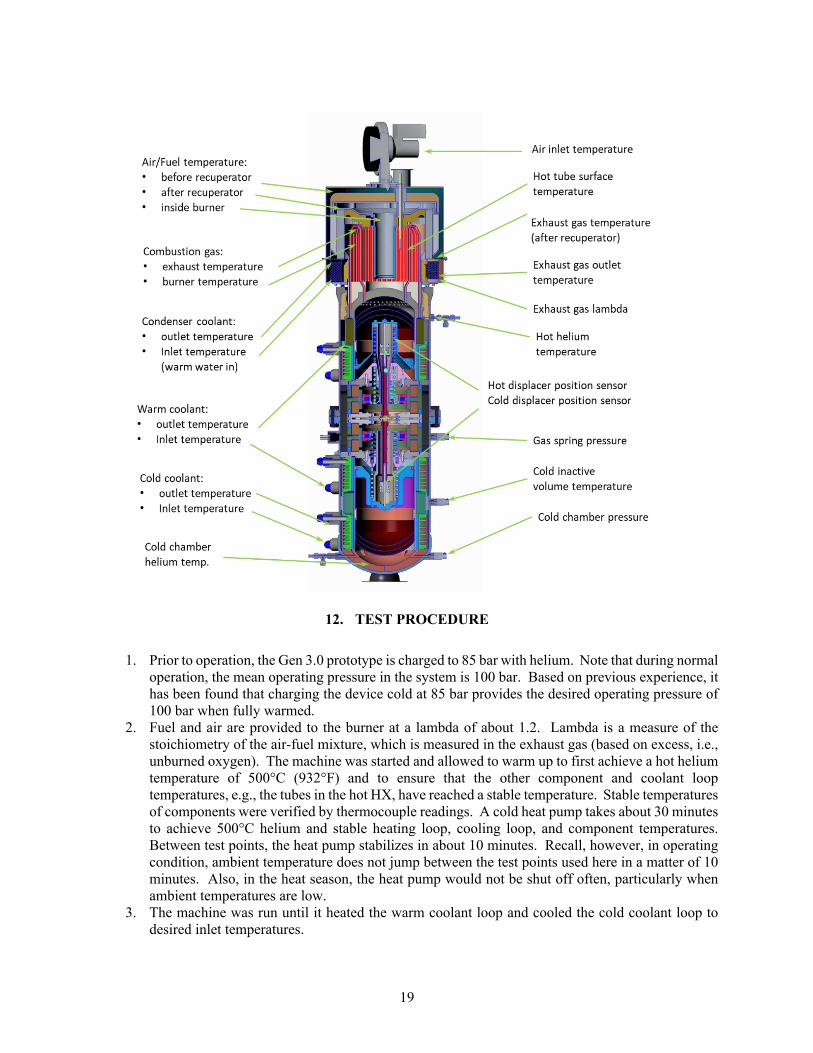
Table 1 lists the specification of the instrumentation used in this study. The data from the instrumentation was collected with a National Instruments data acquisition system, and quantities were measured and record every 10 seconds during the test period. Finally, the TCHP™ prototype was delivered with instrumentation installed by ThermoLift, consisting of multiple temperature, pressure, and position sensors for diagnostic and control purposes. Locations of these sensors are shown in Error! Reference source not found..
Table 1. Instrumentation specifications
Instrument Measured quantity Instrument range Accuracy
Turbine flow meter (Omega FTB-101)
Warm coolant loop flow rate ±0.5% of reading
Coriolis flow meter (Micromotion CMF025)
Cold coolant loop flow rate ±0.4% of reading
Type T thermocouples Inlet and outlet coolant loop temperatures
−250°C to 350°C(−418°F to 662°F) ±0.5°C (±0.9°F)
Figure 10: Sensor locations within the TCHP™, collecting 23 independent data points.
19
12. TEST PROCEDURE
1. Prior to operation, the Gen 3.0 prototype is charged to 85 bar with helium. Note that during normal operation, the mean operating pressure in the system is 100 bar. Based on previous experience, it has been found that charging the device cold at 85 bar provides the desired operating pressure of 100 bar when fully warmed.
2. Fuel and air are provided to the burner at a lambda of about 1.2. Lambda is a measure of the stoichiometry of the air-fuel mixture, which is measured in the exhaust gas (based on excess, i.e., unburned oxygen). The machine was started and allowed to warm up to first achieve a hot helium temperature of 500°C (932°F) and to ensure that the other component and coolant loop temperatures, e.g., the tubes in the hot HX, have reached a stable temperature. Stable temperatures of components were verified by thermocouple readings. A cold heat pump takes about 30 minutes to achieve 500°C helium and stable heating loop, cooling loop, and component temperatures. Between test points, the heat pump stabilizes in about 10 minutes. Recall, however, in operating condition, ambient temperature does not jump between the test points used here in a matter of 10 minutes. Also, in the heat season, the heat pump would not be shut off often, particularly when ambient temperatures are low.
3. The machine was run until it heated the warm coolant loop and cooled the cold coolant loop to desired inlet temperatures.
20
4. The machine was operated at a steady-state condition for at least 30 minutes to ensure conditions had stabilized at one of the four test points.
5. The machine was operated for an additional 30 minutes to collect data used for determining performance metrics.
13. TEST RESULTS
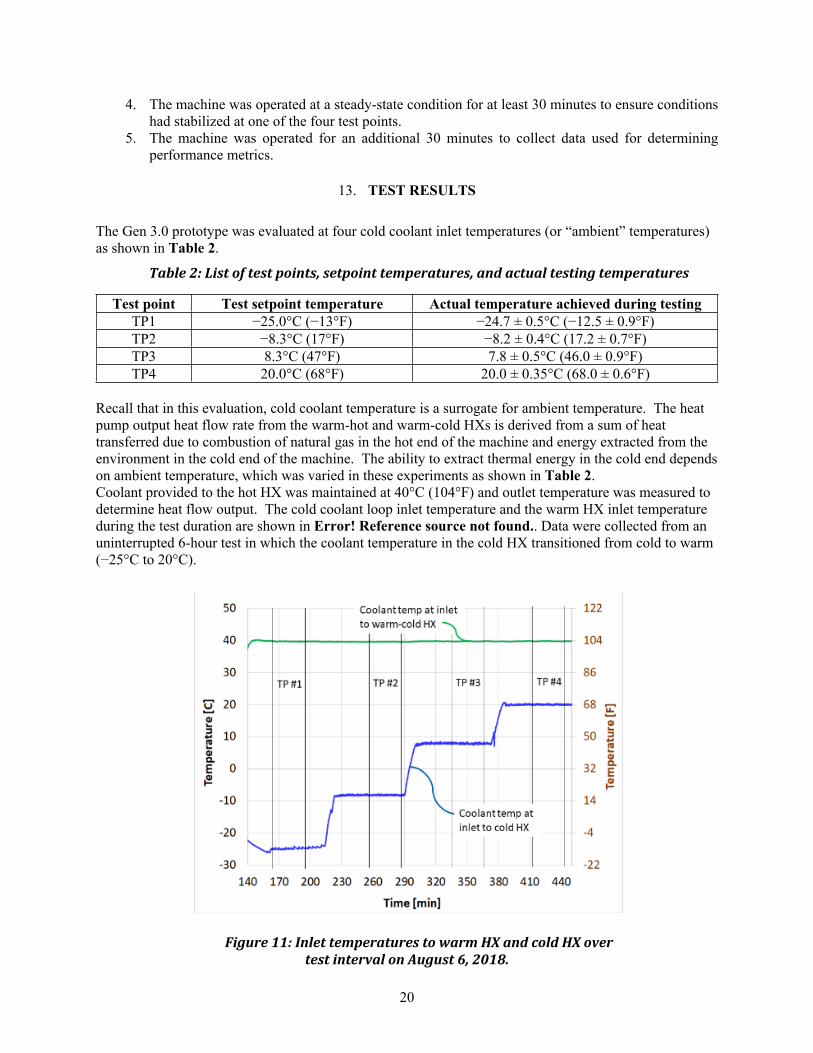
The Gen 3.0 prototype was evaluated at four cold coolant inlet temperatures (or “ambient” temperatures) as shown in Table 2.
Table 2: List of test points, setpoint temperatures, and actual testing temperatures
Test point Test setpoint temperature Actual temperature achieved during testingTP1 −25.0°C (−13°F) −24.7 ± 0.5°C (−12.5 ± 0.9°F)TP2 −8.3°C (17°F) −8.2 ± 0.4°C (17.2 ± 0.7°F)TP3 8.3°C (47°F) 7.8 ± 0.5°C (46.0 ± 0.9°F)TP4 20.0°C (68°F) 20.0 ± 0.35°C (68.0 ± 0.6°F)
Recall that in this evaluation, cold coolant temperature is a surrogate for ambient temperature. The heat pump output heat flow rate from the warm-hot and warm-cold HXs is derived from a sum of heat transferred due to combustion of natural gas in the hot end of the machine and energy extracted from the environment in the cold end of the machine. The ability to extract thermal energy in the cold end depends on ambient temperature, which was varied in these experiments as shown in Table 2.Coolant provided to the hot HX was maintained at 40°C (104°F) and outlet temperature was measured to determine heat flow output. The cold coolant loop inlet temperature and the warm HX inlet temperature during the test duration are shown in Error! Reference source not found.. Data were collected from an uninterrupted 6-hour test in which the coolant temperature in the cold HX transitioned from cold to warm (−25°C to 20°C).
Figure 11: Inlet temperatures to warm HX and cold HX over test interval on August 6, 2018.

21
Before collecting data, the Gen 3.0 prototype was operated for at least one hour to ensure internal stability. Subsequently, the independent variable in the testing, the cold coolant inlet temperature, was set. The system was operated for 30 minutes at the selected cold coolant inlet temperature prior to collecting data over an additional 30-minute interval, as shown in Error! Reference source not found.:
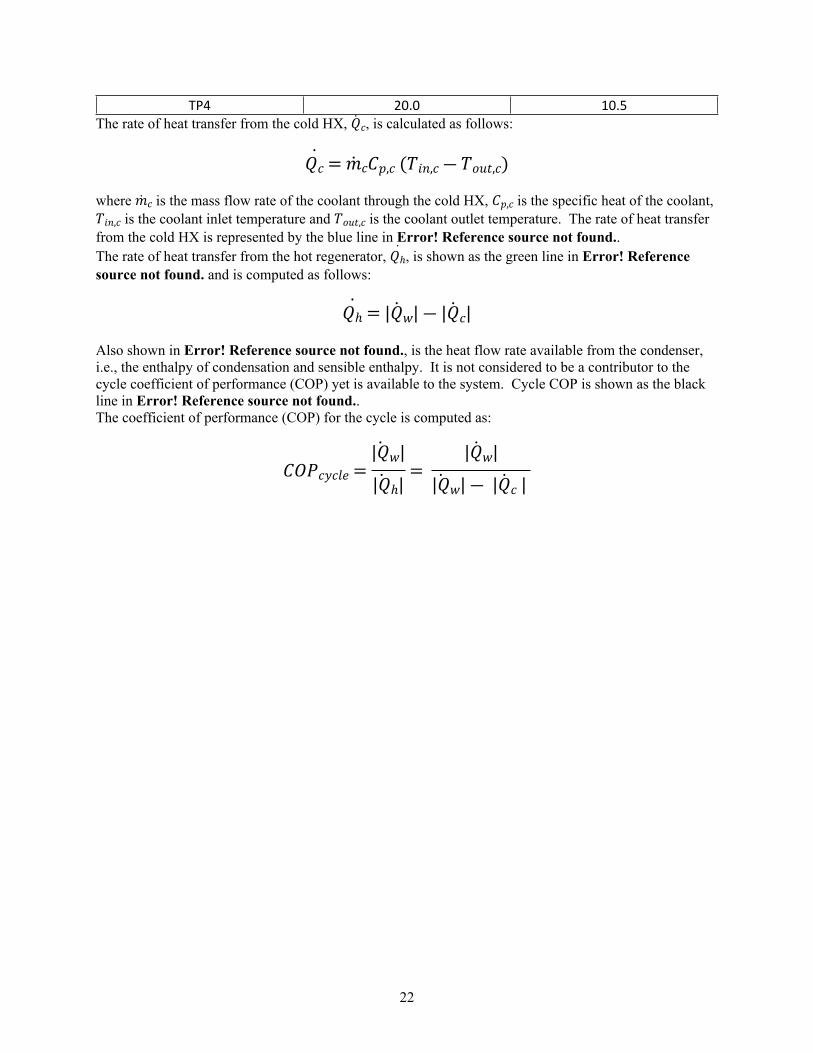
Consider the warm-hot and warm-cold HXs, where heat flow into these HXs occurs from both the hot side and cold side of the TCHP™. The rate of heat transfer from the warm-hot and warm-cold HXs, , 𝑄𝑤is calculated as follows:
𝑄𝑤 = 𝑚𝑤𝐶𝑝,𝑤 (𝑇𝑖𝑛,𝑤 ― 𝑇𝑜𝑢𝑡,𝑤)
where is the mass flow rate of the coolant through the warm-hot and warm-cold HXs, is the 𝑚𝑤 𝐶𝑝,𝑤specific heat of the coolant, is the coolant outlet temperature, and is the coolant inlet 𝑇𝑜𝑢𝑡,𝑤 𝑇𝑖𝑛,𝑤temperature. The rate of heat transfer from the warm-hot and warm-cold HXs is shown as the green line in Error! Reference source not found. (negative as energy is leaving the control volume). Recall that, in the heating configuration, the heat from the warm-hot and warm-cold HXs is used for water heating and space heating. It can be seen that for the four test points, the heating capacity delivered by the warm-hot and warm-cold HXs remained relatively constant. The average heating capacity for each of the test points is summarized in Table 3.
Table 3. Measured heating capacity of the TCHP at four “ambient” temperatures
Test Point “Ambient” Temperature (°C) Average Heating Capacity (kW)TP1 −25.0 11.7TP2 −8.3 10.3TP3 8.3 11.2
Figure 12: Heat rate inputs from hot and cold side, heat rate output from the warm side, and heat rate available from the condenser over the four test points; data collected on August
6, 2018.
22
TP4 20.0 10.5The rate of heat transfer from the cold HX, , is calculated as follows:𝑄𝑐
𝑄𝑐 = 𝑚𝑐𝐶𝑝,𝑐 (𝑇𝑖𝑛,𝑐 ― 𝑇𝑜𝑢𝑡,𝑐)
where is the mass flow rate of the coolant through the cold HX, is the specific heat of the coolant, 𝑚𝑐 𝐶𝑝,𝑐 is the coolant inlet temperature and is the coolant outlet temperature. The rate of heat transfer 𝑇𝑖𝑛,𝑐 𝑇𝑜𝑢𝑡,𝑐
from the cold HX is represented by the blue line in Error! Reference source not found.. The rate of heat transfer from the hot regenerator, , is shown as the green line in Error! Reference 𝑄ℎsource not found. and is computed as follows:
𝑄ℎ = |𝑄𝑤| ― |𝑄𝑐|
Also shown in Error! Reference source not found., is the heat flow rate available from the condenser, i.e., the enthalpy of condensation and sensible enthalpy. It is not considered to be a contributor to the cycle coefficient of performance (COP) yet is available to the system. Cycle COP is shown as the black line in Error! Reference source not found..The coefficient of performance (COP) for the cycle is computed as:
𝐶𝑂𝑃𝑐𝑦𝑐𝑙𝑒 =|𝑄𝑤|
|𝑄ℎ|=
|𝑄𝑤|
|𝑄𝑤| ― |𝑄𝑐 |
23
In
Error! Reference source not found., cycle COP is plotted along with the heat input rates for the four test points.In Table 4, the uncertainty in determining cycle COP based on the measurement uncertainties is shown for the four test points. The uncertainty is lower for TP#1 than the other test conditions. This is primarily due to the greater temperature difference between the coolant loops, resulting in the uncertainty of the fluid temperature readings contributing less to the total uncertainty.
Table 4: Uncertainty in Cycle COP
Test point Nominal cold fluid inlet temperature
Actual cold fluid inlet temperature Cycle COP
TP#1 −25°C (-17°F) −24.7°C(-12.5°F) 1.30±0.09TP#2 −8.3°C (17°F) −8.2°C (17.2°F) 1.46±0.16TP#3 8.3°C (47°F) 7.8°C (46.0 °F) 1.52±0.14TP#4 20°C (68°F) 20.0°C (68.0°F) 1.62±0.18
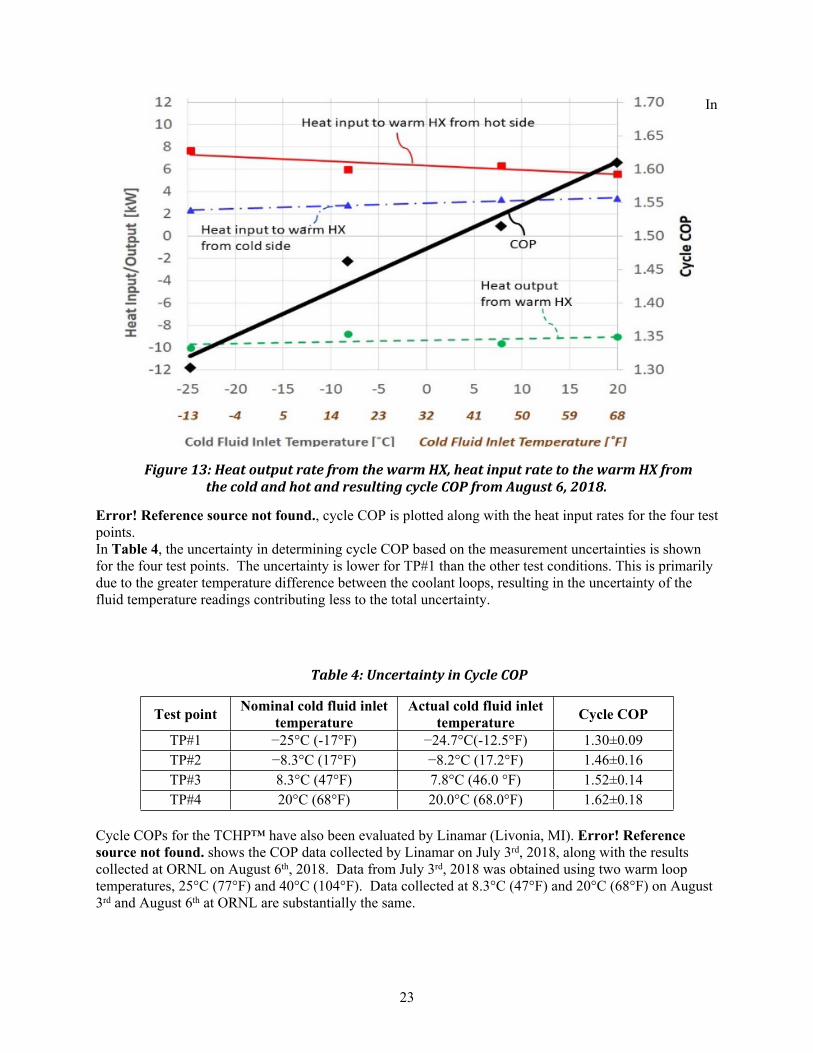
Cycle COPs for the TCHP™ have also been evaluated by Linamar (Livonia, MI). Error! Reference source not found. shows the COP data collected by Linamar on July 3rd, 2018, along with the results collected at ORNL on August 6th, 2018. Data from July 3rd, 2018 was obtained using two warm loop temperatures, 25°C (77°F) and 40°C (104°F). Data collected at 8.3°C (47°F) and 20°C (68°F) on August 3rd and August 6th at ORNL are substantially the same.
Figure 13: Heat output rate from the warm HX, heat input rate to the warm HX from the cold and hot and resulting cycle COP from August 6, 2018.
24
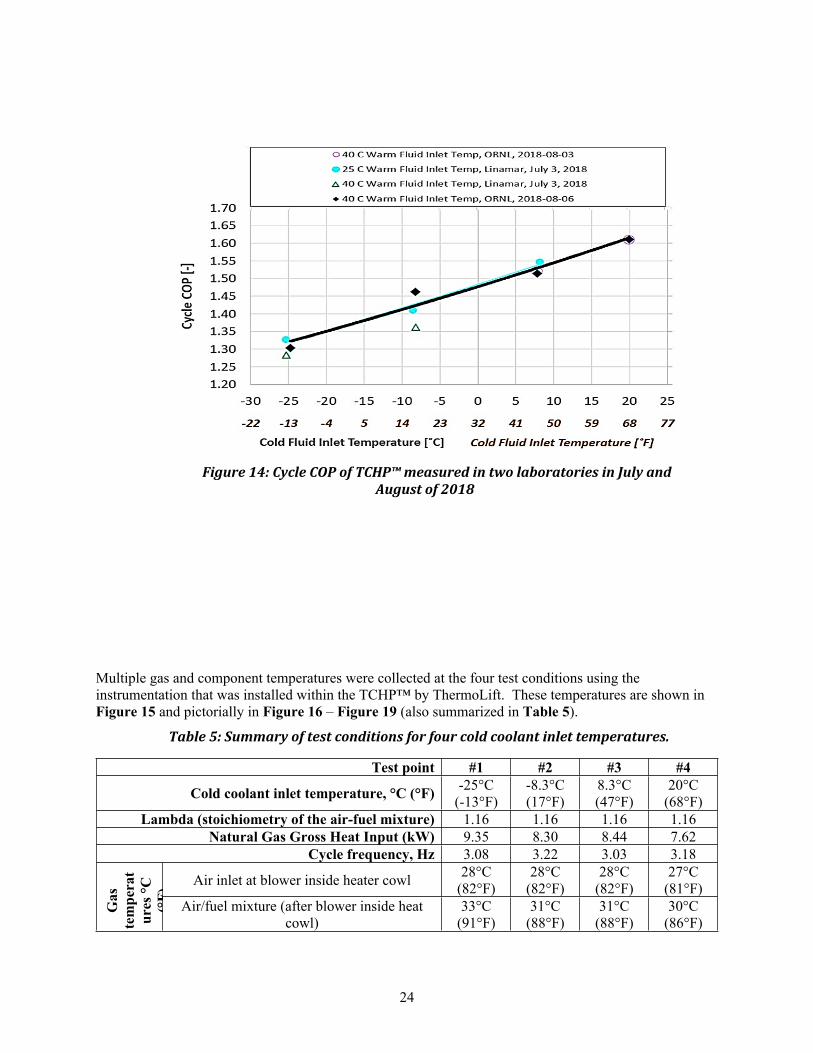
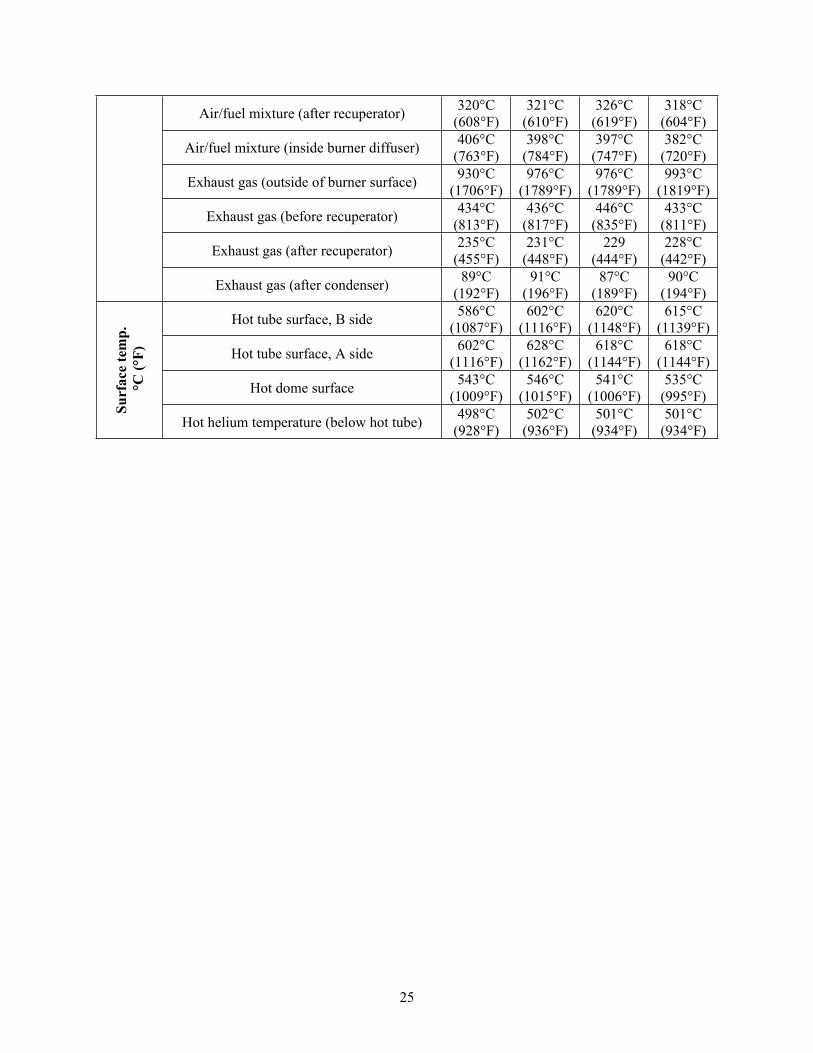
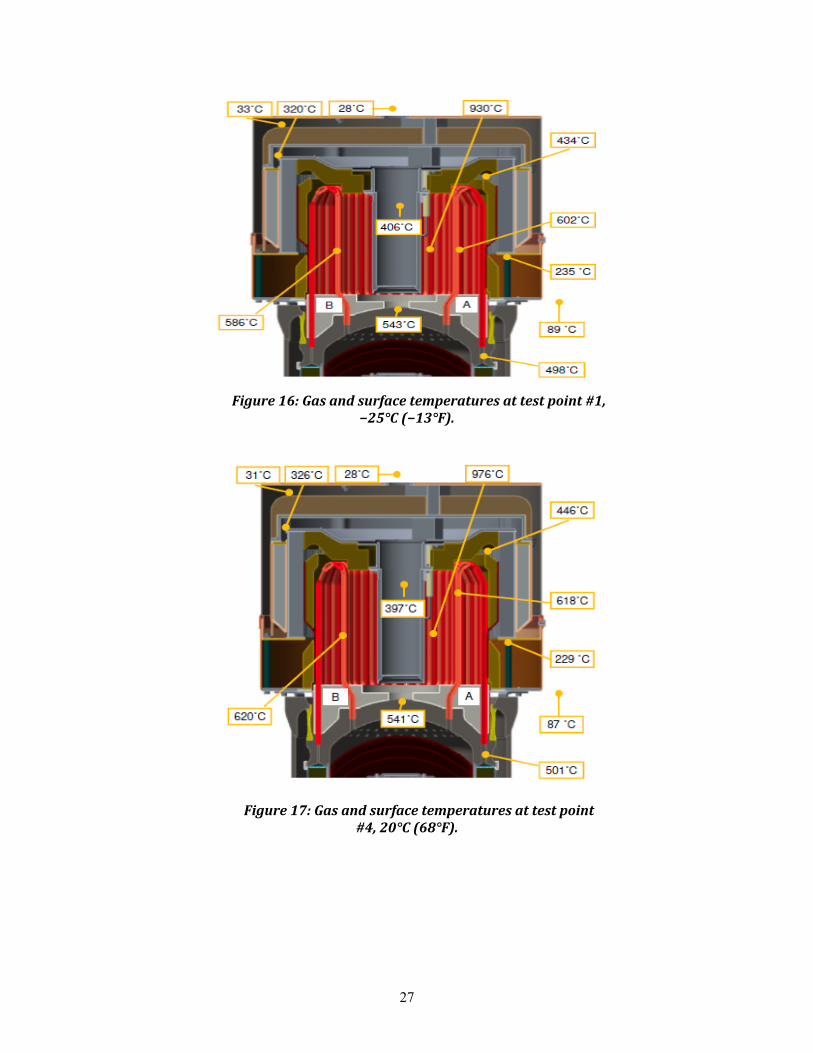
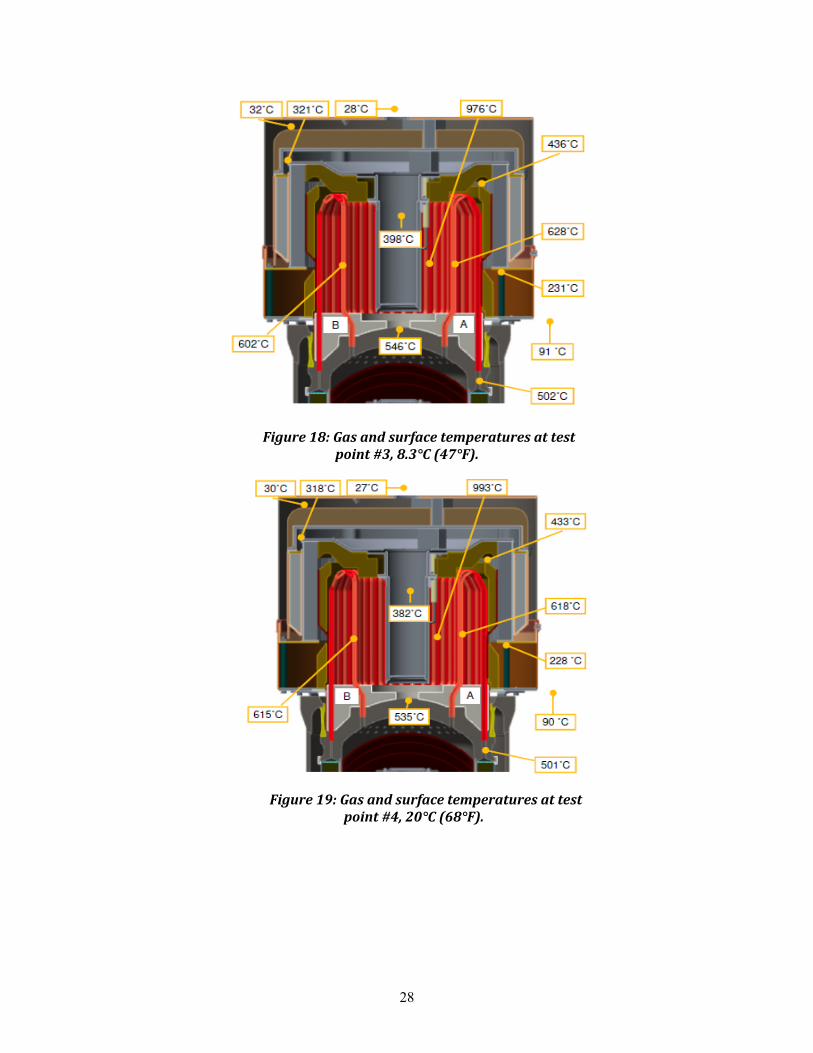
Multiple gas and component temperatures were collected at the four test conditions using the instrumentation that was installed within the TCHP™ by ThermoLift. These temperatures are shown in Figure 15 and pictorially in Figure 16 – Figure 19 (also summarized in Table 5).
Table 5: Summary of test conditions for four cold coolant inlet temperatures.
Test point #1 #2 #3 #4
Cold coolant inlet temperature, °C (°F) -25°C (-13°F)
-8.3°C (17°F)
8.3°C (47°F)
20°C (68°F)
Lambda (stoichiometry of the air-fuel mixture) 1.16 1.16 1.16 1.16Natural Gas Gross Heat Input (kW) 9.35 8.30 8.44 7.62
Cycle frequency, Hz 3.08 3.22 3.03 3.18
Air inlet at blower inside heater cowl 28°C (82°F)
28°C (82°F)
28°C (82°F)
27°C (81°F)
Gas
te
mpe
rat
ures
°C
(°F) Air/fuel mixture (after blower inside heat
cowl)33°C
(91°F)31°C
(88°F)31°C
(88°F)30°C
(86°F)
Figure 14: Cycle COP of TCHP™ measured in two laboratories in July and August of 2018
25
Air/fuel mixture (after recuperator) 320°C (608°F)
321°C (610°F)
326°C (619°F)
318°C (604°F)
Air/fuel mixture (inside burner diffuser) 406°C (763°F)
398°C (784°F)
397°C (747°F)
382°C (720°F)
Exhaust gas (outside of burner surface) 930°C (1706°F)
976°C (1789°F)
976°C (1789°F)
993°C (1819°F)
Exhaust gas (before recuperator) 434°C (813°F)
436°C (817°F)
446°C (835°F)
433°C (811°F)
Exhaust gas (after recuperator) 235°C (455°F)
231°C (448°F)
229 (444°F)
228°C (442°F)
Exhaust gas (after condenser) 89°C (192°F)
91°C (196°F)
87°C (189°F)
90°C (194°F)
Hot tube surface, B side 586°C (1087°F)
602°C (1116°F)
620°C (1148°F)
615°C (1139°F)
Hot tube surface, A side 602°C (1116°F)
628°C (1162°F)
618°C (1144°F)
618°C (1144°F)
Hot dome surface 543°C (1009°F)
546°C (1015°F)
541°C (1006°F)
535°C (995°F)
Surf
ace
tem
p. °C
(°F)
Hot helium temperature (below hot tube) 498°C (928°F)
502°C (936°F)
501°C (934°F)
501°C (934°F)

26
Figure 15: Temperatures in the ThermoLift heat pump over the test duration on August 6, 2018; test points 1, 2, 3, and 4 identified by green dotted line
27
Figure 16: Gas and surface temperatures at test point #1, −25°C (−13°F).
Figure 17: Gas and surface temperatures at test point #4, 20°C (68°F).
28
Figure 18: Gas and surface temperatures at test point #3, 8.3°C (47°F).
Figure 19: Gas and surface temperatures at test point #4, 20°C (68°F).
29
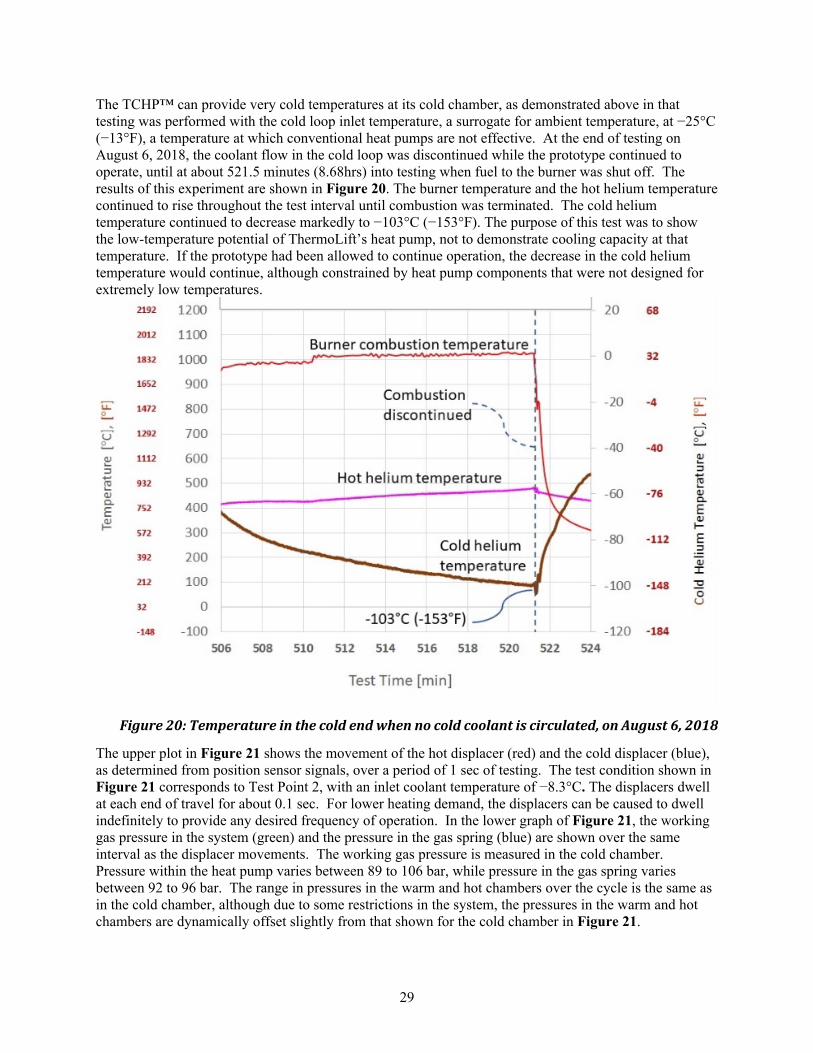
The TCHP™ can provide very cold temperatures at its cold chamber, as demonstrated above in that testing was performed with the cold loop inlet temperature, a surrogate for ambient temperature, at −25°C (−13°F), a temperature at which conventional heat pumps are not effective. At the end of testing on August 6, 2018, the coolant flow in the cold loop was discontinued while the prototype continued to operate, until at about 521.5 minutes (8.68hrs) into testing when fuel to the burner was shut off. The results of this experiment are shown in Figure 20. The burner temperature and the hot helium temperature continued to rise throughout the test interval until combustion was terminated. The cold helium temperature continued to decrease markedly to −103°C (−153°F). The purpose of this test was to show the low-temperature potential of ThermoLift’s heat pump, not to demonstrate cooling capacity at that temperature. If the prototype had been allowed to continue operation, the decrease in the cold helium temperature would continue, although constrained by heat pump components that were not designed for extremely low temperatures.
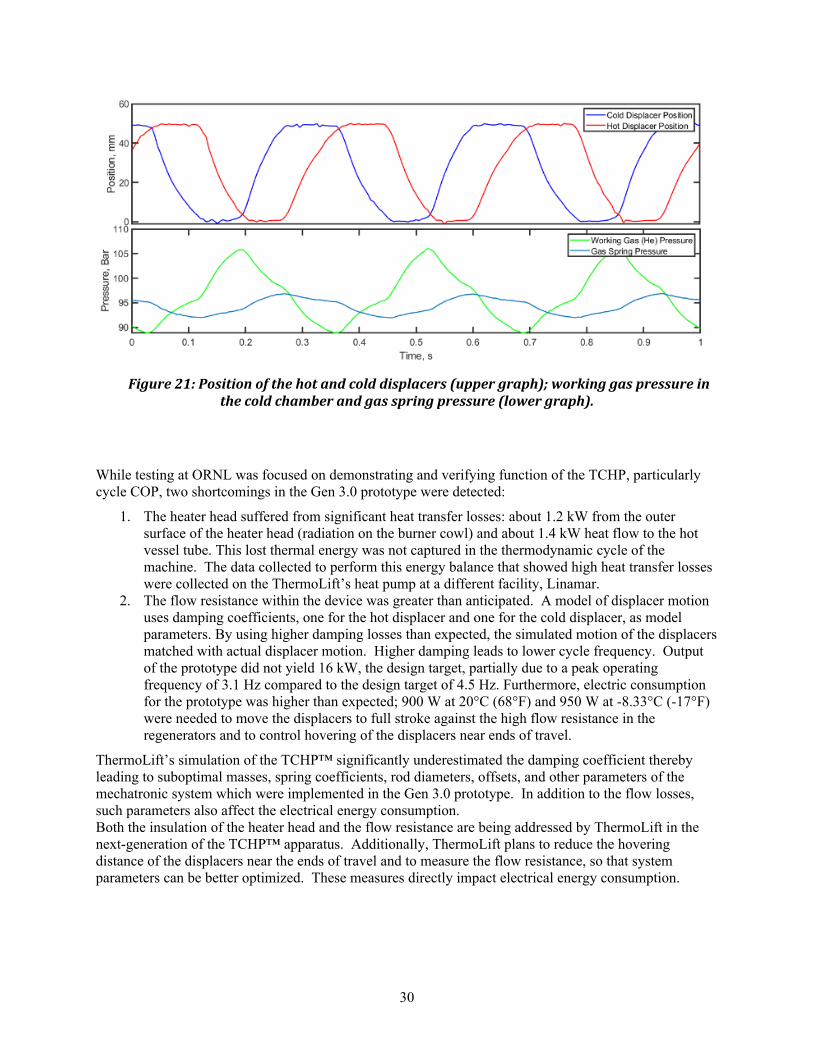
The upper plot in Figure 21 shows the movement of the hot displacer (red) and the cold displacer (blue), as determined from position sensor signals, over a period of 1 sec of testing. The test condition shown in Figure 21 corresponds to Test Point 2, with an inlet coolant temperature of −8.3°C. The displacers dwell at each end of travel for about 0.1 sec. For lower heating demand, the displacers can be caused to dwell indefinitely to provide any desired frequency of operation. In the lower graph of Figure 21, the working gas pressure in the system (green) and the pressure in the gas spring (blue) are shown over the same interval as the displacer movements. The working gas pressure is measured in the cold chamber. Pressure within the heat pump varies between 89 to 106 bar, while pressure in the gas spring varies between 92 to 96 bar. The range in pressures in the warm and hot chambers over the cycle is the same as in the cold chamber, although due to some restrictions in the system, the pressures in the warm and hot chambers are dynamically offset slightly from that shown for the cold chamber in Figure 21.
Figure 20: Temperature in the cold end when no cold coolant is circulated, on August 6, 2018
30
While testing at ORNL was focused on demonstrating and verifying function of the TCHP, particularly cycle COP, two shortcomings in the Gen 3.0 prototype were detected:
1. The heater head suffered from significant heat transfer losses: about 1.2 kW from the outer surface of the heater head (radiation on the burner cowl) and about 1.4 kW heat flow to the hot vessel tube. This lost thermal energy was not captured in the thermodynamic cycle of the machine. The data collected to perform this energy balance that showed high heat transfer losses were collected on the ThermoLift’s heat pump at a different facility, Linamar.
2. The flow resistance within the device was greater than anticipated. A model of displacer motion uses damping coefficients, one for the hot displacer and one for the cold displacer, as model parameters. By using higher damping losses than expected, the simulated motion of the displacers matched with actual displacer motion. Higher damping leads to lower cycle frequency. Output of the prototype did not yield 16 kW, the design target, partially due to a peak operating frequency of 3.1 Hz compared to the design target of 4.5 Hz. Furthermore, electric consumption for the prototype was higher than expected; 900 W at 20°C (68°F) and 950 W at -8.33°C (-17°F) were needed to move the displacers to full stroke against the high flow resistance in the regenerators and to control hovering of the displacers near ends of travel.
ThermoLift’s simulation of the TCHP™ significantly underestimated the damping coefficient thereby leading to suboptimal masses, spring coefficients, rod diameters, offsets, and other parameters of the mechatronic system which were implemented in the Gen 3.0 prototype. In addition to the flow losses, such parameters also affect the electrical energy consumption.Both the insulation of the heater head and the flow resistance are being addressed by ThermoLift in the next-generation of the TCHP™ apparatus. Additionally, ThermoLift plans to reduce the hovering distance of the displacers near the ends of travel and to measure the flow resistance, so that system parameters can be better optimized. These measures directly impact electrical energy consumption.
Figure 21: Position of the hot and cold displacers (upper graph); working gas pressure in the cold chamber and gas spring pressure (lower graph).

31
14. CONCLUSIONS
On August 6th, 2018, Oak Ridge National Laboratory (ORNL) completed a performance evaluation of the Thermal Compression Heat Pump (TCHP) Gen 3.0 prototype developed by ThermoLift. The performance evaluation was conducted at four ambient temperatures, where the inlet temperature to the cold heat exchanger (HX) of the TCHP prototype was used as a surrogate for ambient temperature in the laboratory setting. Uninterrupted operation of the prototype heat pump demonstrated coefficients of performance (COP) for the cycle that well exceeded the DOE’s target COPs for cold-climate heat pumps. Furthermore, due to the nature of the TCHP, there is no significant capacity decrease as the inlet temperature to the cold HX decreases. Over the four test conditions, the average heating capacity of the TCHP was found to be 11.7 kW at -25°C. The measured performance of the TCHP prototype is summarized in Table 6.
Table 6: COP and capacity of the TCHP compared to DOE targets.
Inlet temperature to the cold
HX
DOE target COP (for
natural gas fired heat
pump)³
TCHPCycle COP
DOE target maximum capacity
reduction from nominal4
Measured heating output TCHP capacity reduction from
nominal
-25°C (-17°F) 1.0 1.30 50% 11.7 -4.5%
-8.3°C (17°F) 1.15 1.46 20% 10.3 8.0%
8.3°C (47°F) 1.30 1.52 0% 11.2 0%20°C (68°F) No target 1.61 No target 10.5 No target
15. REFERENCES
AHRI. 2008. AHRI Standard 210/240: Standard for Performance Rating of Unitary Air-Conditioning and Air-Source Heat Pump Equipment. Arlington, VA: Air-Conditioning, Heating, and Refrigeration Institute (AHRI).ISO. 1998. ISO 13256-2: Water-Source Heat Pumps – Testing and Rating for Performance – Part 2: Water-to-Water and Brine-to-Water Heat Pumps. Geneva, Switzerland: International Organization for Standardization (ISO).
4 BTO’s Heat Pump Research Efforts,” U.S. Department of Energy, Building Technology Office (BTO), Antonio M. Bouza, March 2016.