Embed Size (px)
Citation preview
Ocean Lecture & Educator’s Night May 16, 2012
Conditions at Sea
Below is an overview of the activity Conditions at Sea: Background, Making Waves, and Data Activity (NANOOS) to incorporate information learned from Dr. Herrington’s presentation and subsequent discussion.
Lesson Overview Students learn about the process of wave formation and the forces that cause waves, access real-time data to make predictions about sea conditions, and analyze the relationship between the ocean and the atmosphere.
Lesson Rationale Forecasting the conditions at sea is an important tool for sailors, fishermen, maritime transportation, anyone on the water. Students gain an understanding that wave formation is primarily caused by wind and that the characteristics of waves can be forecasted from wind data. Through participating in a forecasting activity students learn how it happens and the importance of forecasting for anyone on the water. Through the activities, students learn about the concepts of wave formation and forecasting, conduct an in-class wave-making activity, and access near real-time and real-time data from ocean observing buoys to investigate the relationship between wind and wave height, and predict the actual conditions out at sea using the Beaufort scale.
Key Concept Students learn about wave formation and forecasting of waves, and access real-time data to predict actual conditions at sea.
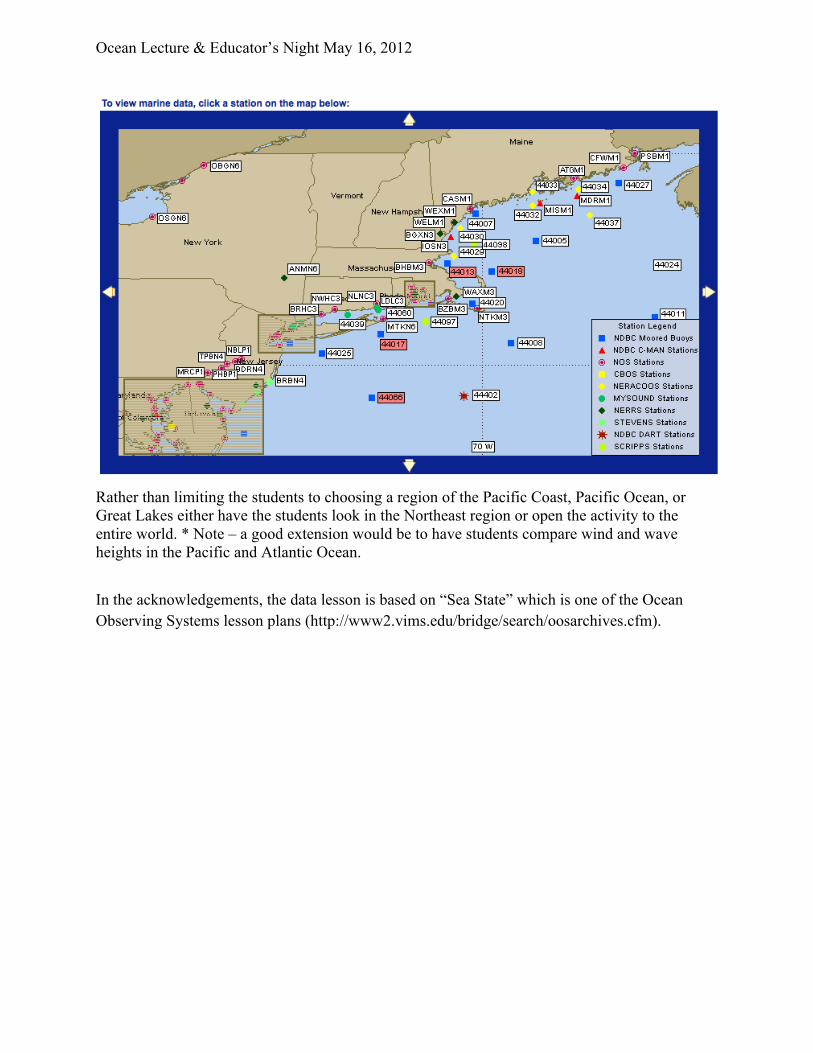
Adjustments to Data Activity: Procedure In step 2, have the students visit http://www.ndbc.noaa.gov/maps/Northeast.shtml to access buoy data for the Northeast (Virginia to Maine). If you are interested in having the students look at buoy data from throughout the world and/or United States, have the students visit http://www.ndbc.noaa.gov/rmd.shtml.
Ocean Lecture & Educator’s Night May 16, 2012
Rather than limiting the students to choosing a region of the Pacific Coast, Pacific Ocean, or Great Lakes either have the students look in the Northeast region or open the activity to the entire world. * Note – a good extension would be to have students compare wind and wave heights in the Pacific and Atlantic Ocean.
In the acknowledgements, the data lesson is based on “Sea State” which is one of the Ocean Observing Systems lesson plans (http://www2.vims.edu/bridge/search/oosarchives.cfm).
Lesson Plan: Conditions at Sea Background
Summary
Forecastingtheconditionsatseaisanimportanttoolforsailors,fishers,
maritimetransportation,anyoneonthewater.InConditionsatSea,athree‐part
series,studentsfirstlearnabouttheconceptsofwaveformationandforecasting,
conductanin‐classwave‐makingactivity,andaccessnearreal‐timeandreal‐
timedatafromoceanobservingbuoystoinvestigatetherelationshipbetween
windandwaveheight,andpredicttheactualconditionsoutatseausingthe
Beaufortscale.
Subject Area PhysicalScience/Earthscience Grade Level 6‐12 Key Concepts
� Oceanwaveformationisprimarilycausedbywind.
� Wavecharacteristicscanbeforecastedfromwinddata.
� Forecastingisanimportanttoolformariners
Objectives
� Explaintheprocessofwaveformationandtheforcesthatcausewaves.
� Accessandusenearreal‐timedatatomakepredictionsonseaconditions.
� Analyzetherelationshipbetweentheoceanandtheatmosphere.
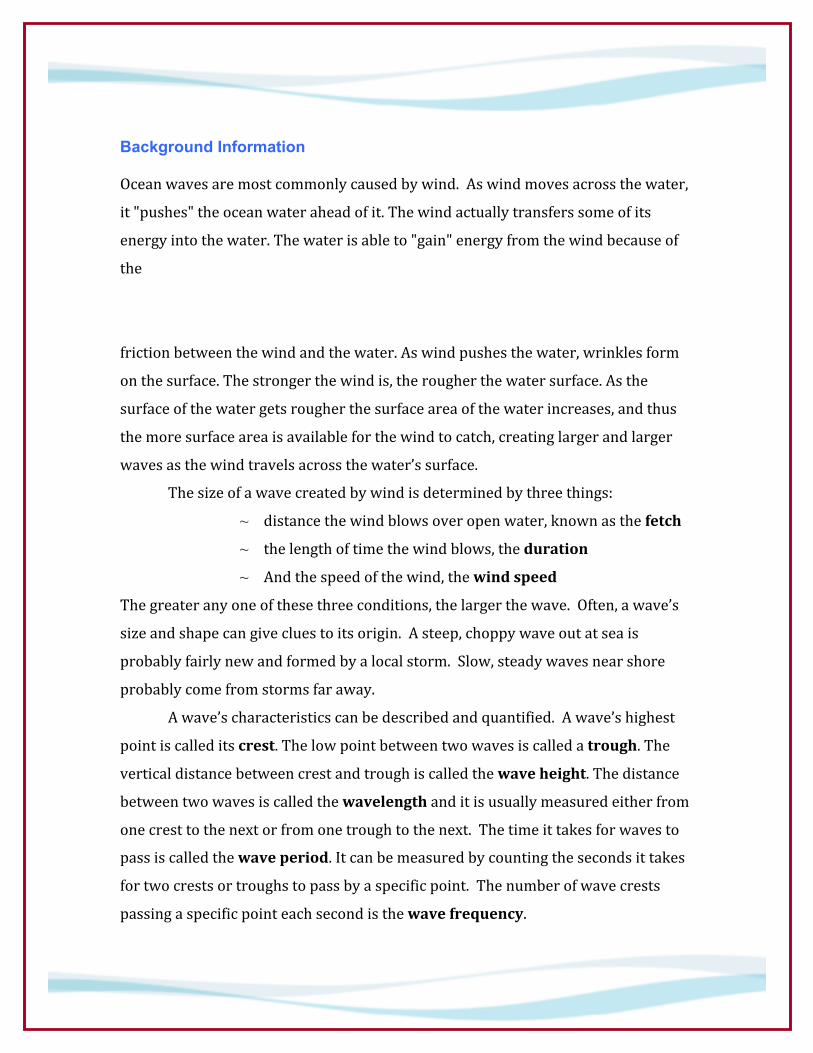
Background Information Oceanwavesaremostcommonlycausedbywind.Aswindmovesacrossthewater,
it"pushes"theoceanwateraheadofit.Thewindactuallytransferssomeofits
energyintothewater.Thewaterisableto"gain"energyfromthewindbecauseof
the
frictionbetweenthewindandthewater.Aswindpushesthewater,wrinklesform
onthesurface.Thestrongerthewindis,therougherthewatersurface.Asthe
surfaceofthewatergetsrougherthesurfaceareaofthewaterincreases,andthus
themoresurfaceareaisavailableforthewindtocatch,creatinglargerandlarger
wavesasthewindtravelsacrossthewater’ssurface.
Thesizeofawavecreatedbywindisdeterminedbythreethings:
~ distancethewindblowsoveropenwater,knownasthefetch
~ thelengthoftimethewindblows,theduration
~ Andthespeedofthewind,thewindspeed
Thegreateranyoneofthesethreeconditions,thelargerthewave.Often,awave’s
sizeandshapecangivecluestoitsorigin.Asteep,choppywaveoutatseais
probablyfairlynewandformedbyalocalstorm.Slow,steadywavesnearshore
probablycomefromstormsfaraway.
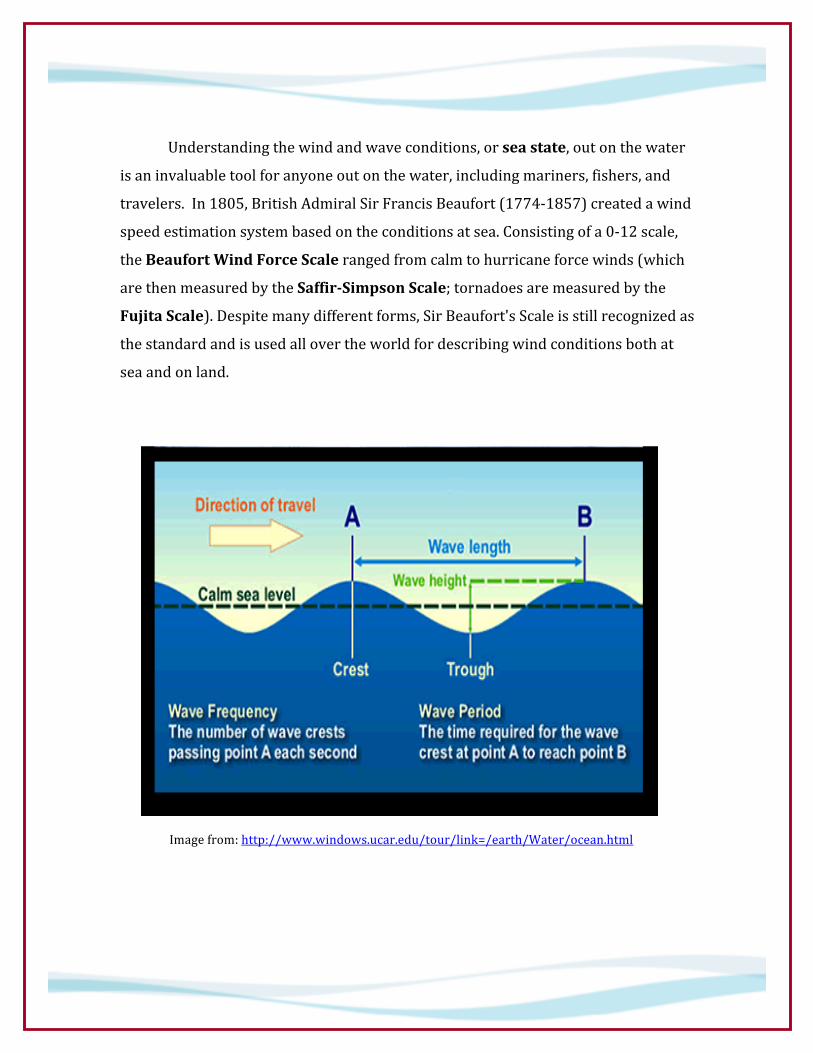
Awave’scharacteristicscanbedescribedandquantified.Awave’shighest
pointiscalleditscrest.Thelowpointbetweentwowavesiscalledatrough.The
verticaldistancebetweencrestandtroughiscalledthewaveheight.Thedistance
betweentwowavesiscalledthewavelengthanditisusuallymeasuredeitherfrom
onecresttothenextorfromonetroughtothenext.Thetimeittakesforwavesto
passiscalledthewaveperiod.Itcanbemeasuredbycountingthesecondsittakes
fortwocrestsortroughstopassbyaspecificpoint.Thenumberofwavecrests
passingaspecificpointeachsecondisthewavefrequency.
Understandingthewindandwaveconditions,orseastate,outonthewater
isaninvaluabletoolforanyoneoutonthewater,includingmariners,fishers,and
travelers.In1805,BritishAdmiralSirFrancisBeaufort(1774‐1857)createdawind
speedestimationsystembasedontheconditionsatsea.Consistingofa0‐12scale,
theBeaufortWindForceScalerangedfromcalmtohurricaneforcewinds(which
arethenmeasuredbytheSaffirSimpsonScale;tornadoesaremeasuredbythe
FujitaScale).Despitemanydifferentforms,SirBeaufort'sScaleisstillrecognizedas
thestandardandisusedallovertheworldfordescribingwindconditionsbothat
seaandonland.
Imagefrom:http://www.windows.ucar.edu/tour/link=/earth/Water/ocean.html
Oceanobservingsystemsmaintainbuoysalongourcoastsandoffshoreto
recordconditionsoutontheocean,andareabletotransmitthisinformation,via
satellite,inreal‐timeornearreal‐time.Manyofthesebuoysmeasureparameters
includingwindspeed,andwaveheight,whichcanprovidevaluableinformationon
seaconditionstoanyonewhoisconsideringbeingoutonthewater.
Lesson Plan: Conditions at Sea
Introductory Activity, Making Waves Summary
Forecastingtheconditionsatseaisanimportanttoolforsailors,fishers,
maritimetransportation,anyoneonthewater.InConditionsatSea,athree‐part
series,studentsfirstlearnabouttheconceptsofwaveformationandforecasting,
conductanin‐classwave‐makingactivity,andaccessnearreal‐timeandreal‐
timedatafromoceanobservingbuoystoinvestigatetherelationshipbetween
windandwaveheight,andpredicttheactualconditionsoutatseausingthe
Beaufortscale.
Subject Area PhysicalScience/Earthscience Grade Level 6‐12 Key Concepts
� Oceanwaveformationisprimarilycausedbywind.
� Wavecharacteristicscanbeforecastedfromwinddata.
� Forecastingisanimportanttoolformariners
Objective
� Explaintheprocessofwaveformationandtheforcesthatcausewaves.
Materials
� hair dryer � aquarium, clear glass or plastic rectangular container � ring stand or doll stand (to hold and position hair dryer)
� erasable markers � ruler � water � tape � clock or watch
Safety note: do not let any part of the dryer touch the water!!! Procedure 1. Place the aquarium or
glass/plastic container on a
firm surface.
2. Fill the container about three
fourths full of water.
3. Allow the water to settle into a smooth
surface
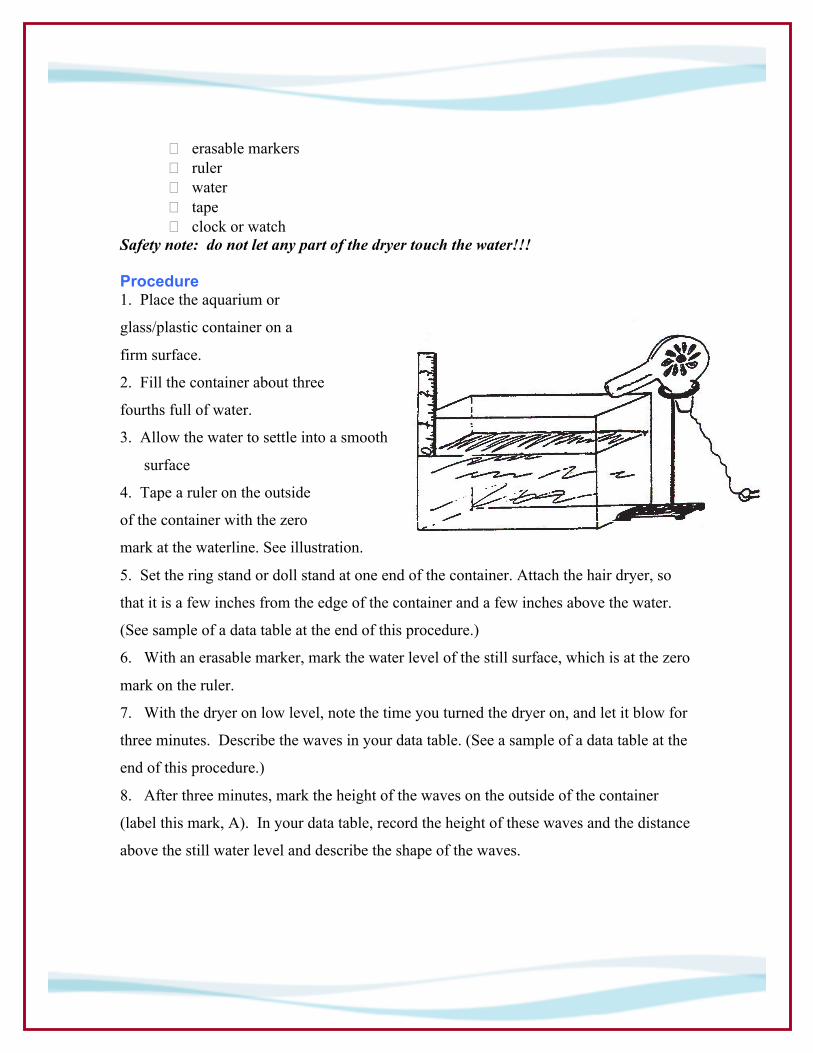
4. Tape a ruler on the outside
of the container with the zero
mark at the waterline. See illustration.
5. Set the ring stand or doll stand at one end of the container. Attach the hair dryer, so
that it is a few inches from the edge of the container and a few inches above the water.
(See sample of a data table at the end of this procedure.)
6. With an erasable marker, mark the water level of the still surface, which is at the zero
mark on the ruler.
7. With the dryer on low level, note the time you turned the dryer on, and let it blow for
three minutes. Describe the waves in your data table. (See a sample of a data table at the
end of this procedure.)
8. After three minutes, mark the height of the waves on the outside of the container
(label this mark, A). In your data table, record the height of these waves and the distance
above the still water level and describe the shape of the waves.
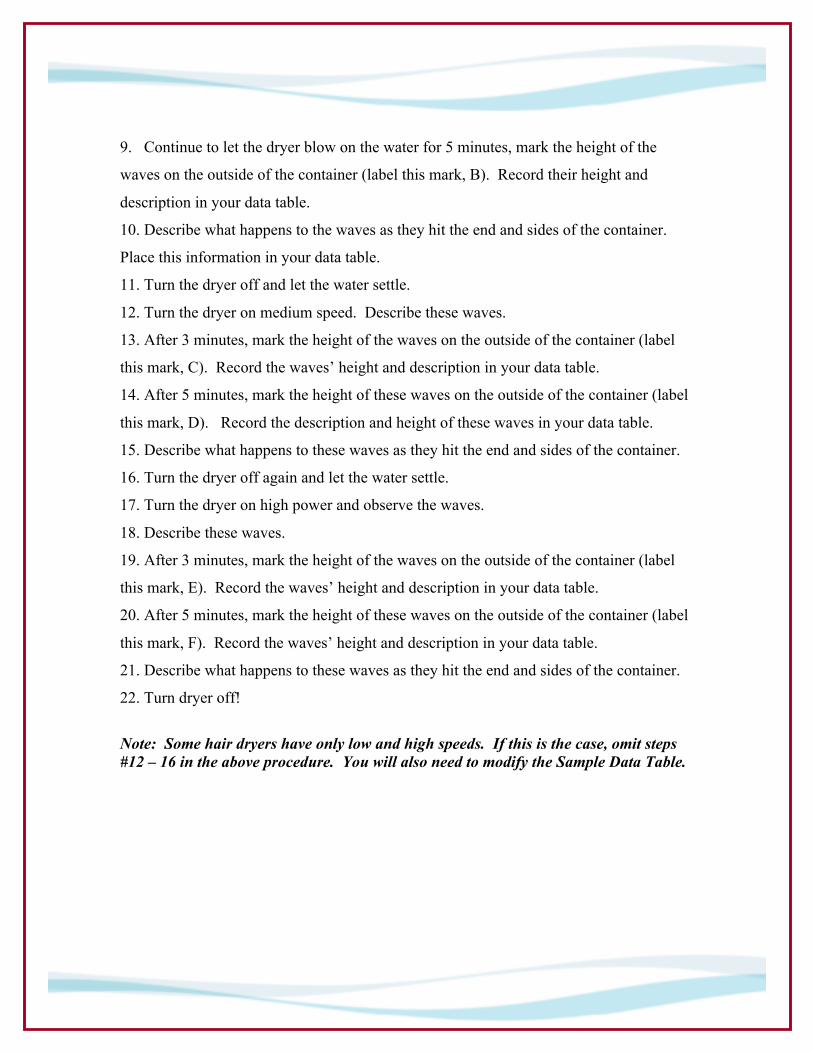
9. Continue to let the dryer blow on the water for 5 minutes, mark the height of the
waves on the outside of the container (label this mark, B). Record their height and
description in your data table.
10. Describe what happens to the waves as they hit the end and sides of the container.
Place this information in your data table.
11. Turn the dryer off and let the water settle.
12. Turn the dryer on medium speed. Describe these waves.
13. After 3 minutes, mark the height of the waves on the outside of the container (label
this mark, C). Record the waves’ height and description in your data table.
14. After 5 minutes, mark the height of these waves on the outside of the container (label
this mark, D). Record the description and height of these waves in your data table.
15. Describe what happens to these waves as they hit the end and sides of the container.
16. Turn the dryer off again and let the water settle.
17. Turn the dryer on high power and observe the waves.
18. Describe these waves.
19. After 3 minutes, mark the height of the waves on the outside of the container (label
this mark, E). Record the waves’ height and description in your data table.
20. After 5 minutes, mark the height of these waves on the outside of the container (label
this mark, F). Record the waves’ height and description in your data table.
21. Describe what happens to these waves as they hit the end and sides of the container.
22. Turn dryer off!
Note: Some hair dryers have only low and high speeds. If this is the case, omit steps #12 – 16 in the above procedure. You will also need to modify the Sample Data Table.
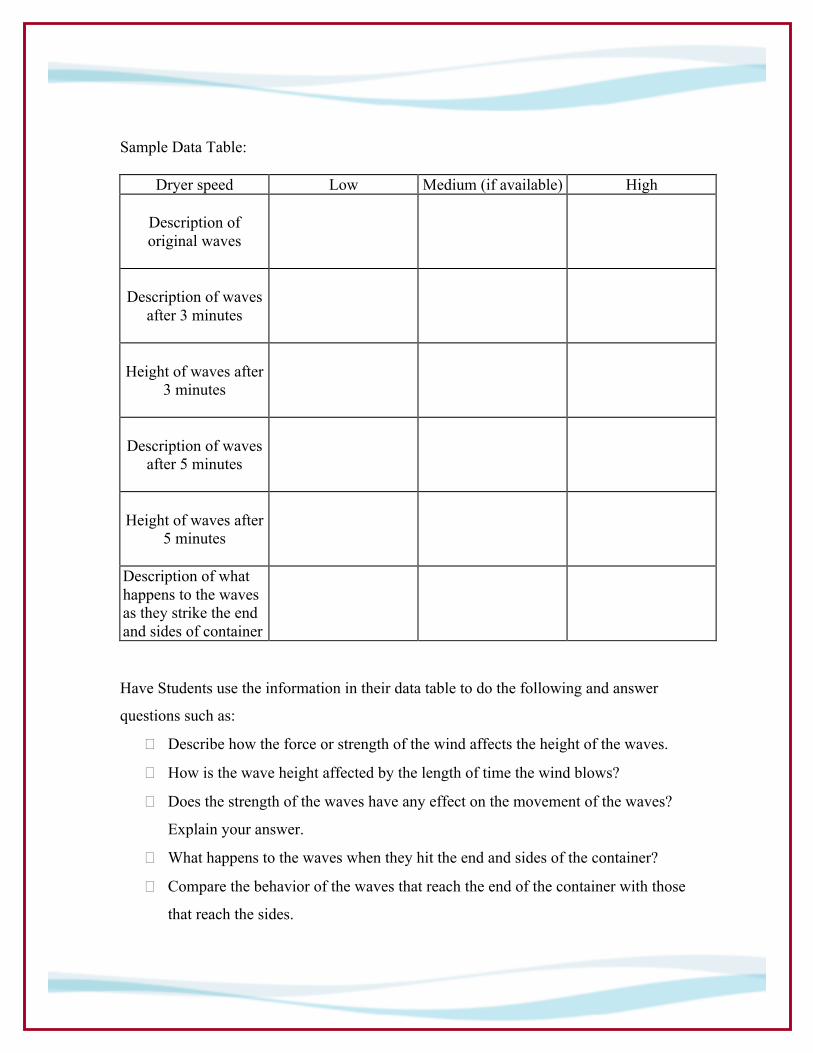
Sample Data Table:
Dryer speed Low Medium (if available) High
Description of original waves
Description of waves
after 3 minutes
Height of waves after
3 minutes
Description of waves
after 5 minutes
Height of waves after
5 minutes
Description of what happens to the waves as they strike the end and sides of container
Have Students use the information in their data table to do the following and answer
questions such as:
� Describe how the force or strength of the wind affects the height of the waves.
� How is the wave height affected by the length of time the wind blows?
� Does the strength of the waves have any effect on the movement of the waves?
Explain your answer.
� What happens to the waves when they hit the end and sides of the container?
� Compare the behavior of the waves that reach the end of the container with those
that reach the sides.
� If your container was twice as long, what effect do you think this extra length
would have on the behavior of the waves? (If a larger container is available - try
it and see!)
Assessment Have students write a few paragraphs and draw a diagram to explain how this
investigation demonstrates the factors that affect wind waves and how these factors affect
wave size.
Resources � NationalGeographicwavesimulator.Studentscanadjustwaveheight,wave
periodand/orwavelengthtoseehoweachaffectswaveformation:
http://www.nationalgeographic.com/volvooceanrace/interactives/waves/
� Backgroundinformationonwaves.WindowstotheUniverse:
http://www.windows.ucar.edu/tour/link=/earth/Water/ocean_waves.html
&edu=mid&back=/search/search_navigation.html
� OfficeofNavalResearch:
http://www.onr.navy.mil/Focus/ocean/motion/waves1.htm
Standards NSES (National Science Education Standards)
Oregon Science Standards
Washington State EALRs (Essential Academic Learning Requirements) and GLEs
(Grade Level Expectations)
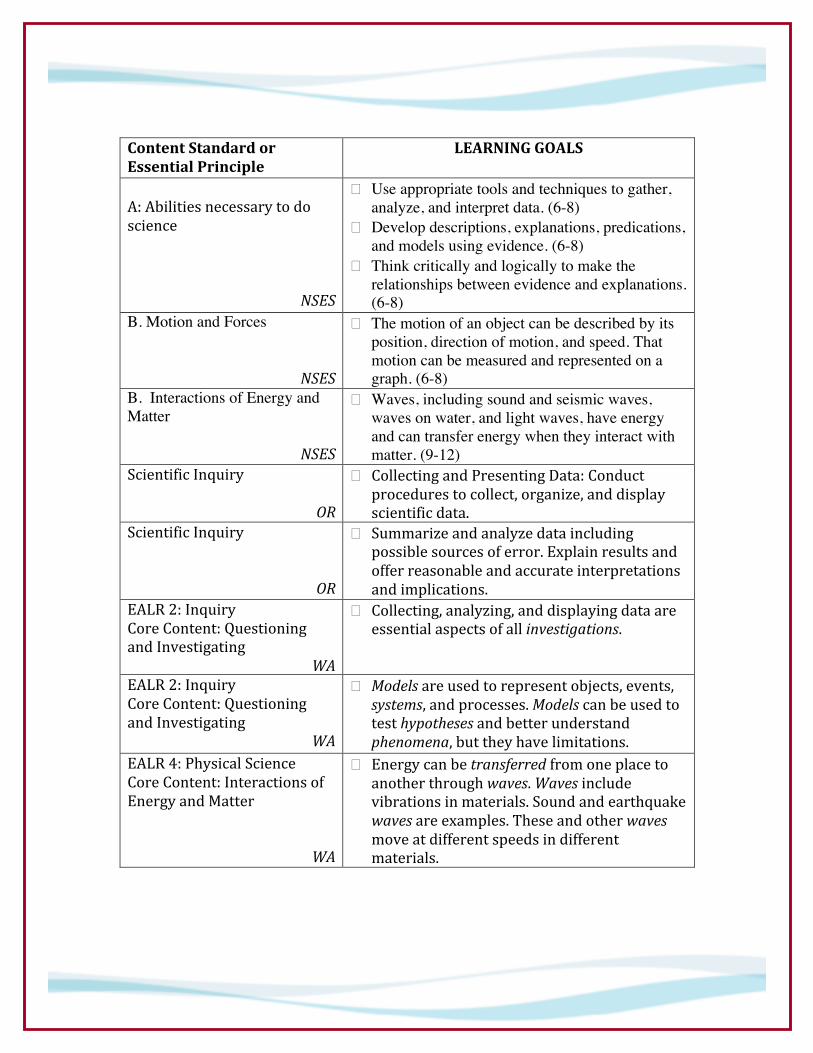
ContentStandardorEssentialPrinciple
LEARNINGGOALS
A:Abilitiesnecessarytodoscience
NSES
� Use appropriate tools and techniques to gather, analyze, and interpret data. (6-8)
� Develop descriptions, explanations, predications, and models using evidence. (6-8)
� Think critically and logically to make the relationships between evidence and explanations. (6-8)
B. Motion and Forces
NSES
� The motion of an object can be described by its position, direction of motion, and speed. That motion can be measured and represented on a graph. (6-8)
B. Interactions of Energy and Matter
NSES
� Waves, including sound and seismic waves, waves on water, and light waves, have energy and can transfer energy when they interact with matter. (9-12)
ScientificInquiry
OR
� CollectingandPresentingData:Conductprocedurestocollect,organize,anddisplayscientificdata.
ScientificInquiry
OR
� Summarizeandanalyzedataincludingpossiblesourcesoferror.Explainresultsandofferreasonableandaccurateinterpretationsandimplications.
EALR2:InquiryCoreContent:QuestioningandInvestigating
WA
� Collecting,analyzing,anddisplayingdataareessentialaspectsofallinvestigations.
EALR2:InquiryCoreContent:QuestioningandInvestigating
WA
� Modelsareusedtorepresentobjects,events,systems,andprocesses.Modelscanbeusedtotesthypothesesandbetterunderstandphenomena,buttheyhavelimitations.
EALR4:PhysicalScienceCoreContent:InteractionsofEnergyandMatter
WA
� Energycanbetransferredfromoneplacetoanotherthroughwaves.Wavesincludevibrationsinmaterials.Soundandearthquakewavesareexamples.Theseandotherwavesmoveatdifferentspeedsindifferentmaterials.
Lesson Plan: Conditions at Sea Data Activity
Summary
Forecastingtheconditionsatseaisanimportanttoolforsailors,fishers,
maritimetransportation,anyoneonthewater.InConditionsatSea,athree‐part
series,studentsfirstlearnabouttheconceptsofwaveformationandforecasting,
conductanin‐classwave‐makingactivity,andaccessnearreal‐timeandreal‐
timedatafromoceanobservingbuoystoinvestigatetherelationshipbetween
windandwaveheight,andpredicttheactualconditionsoutatseausingthe
Beaufortscale.
Subject Area PhysicalScience/Earthscience Grade Level 6‐12 Key Concepts
� Oceanwaveformationisprimarilycausedbywind.
� Wavecharacteristicscanbeforecastedfromwinddata.
� Forecastingisanimportanttoolformariners
Objectives
� Accessandusenearreal‐timedatatomakepredictionsonseaconditions.
� Analyzetherelationshipbetweentheoceanandtheatmosphere.
Materials � Computerlabwithinternetaccessorprojectionscreen
� Sciencejournalorsimilarforeachstudent
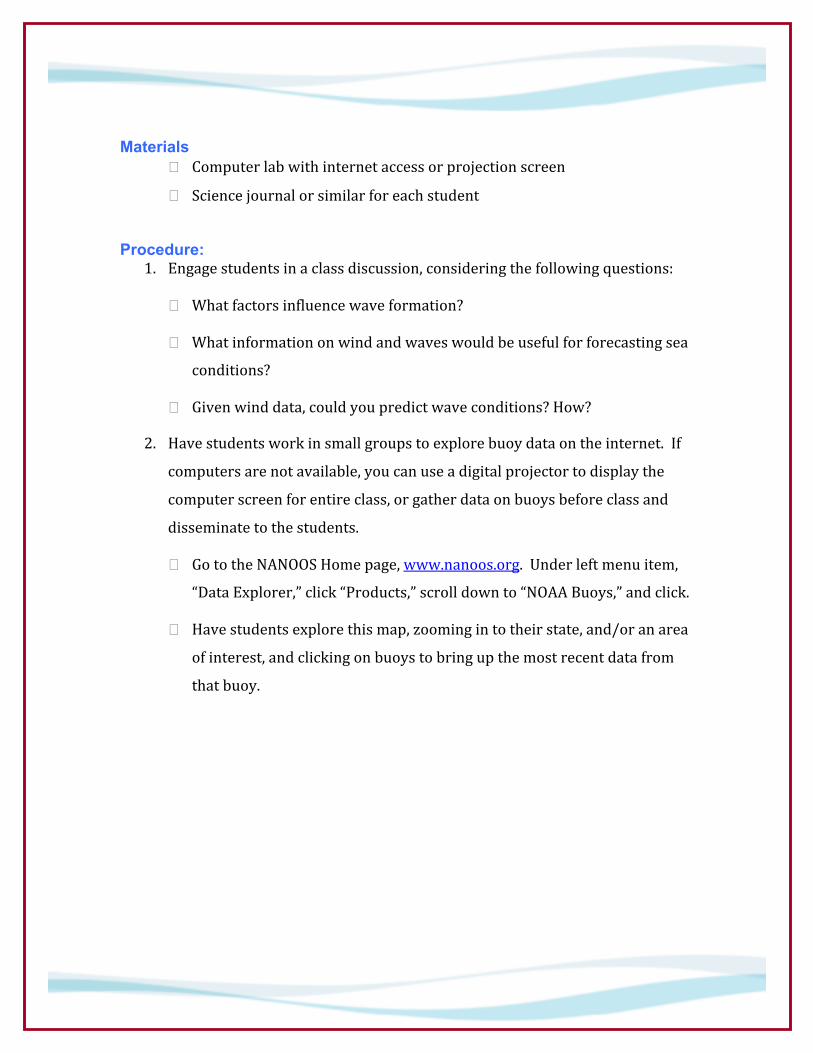
Procedure:
1. Engagestudentsinaclassdiscussion,consideringthefollowingquestions:
� Whatfactorsinfluencewaveformation?
� Whatinformationonwindandwaveswouldbeusefulforforecastingsea
conditions?
� Givenwinddata,couldyoupredictwaveconditions?How?
2. Havestudentsworkinsmallgroupstoexplorebuoydataontheinternet.If
computersarenotavailable,youcanuseadigitalprojectortodisplaythe
computerscreenforentireclass,orgatherdataonbuoysbeforeclassand
disseminatetothestudents.
� GototheNANOOSHomepage,www.nanoos.org.Underleftmenuitem,
“DataExplorer,”click“Products,”scrolldownto“NOAABuoys,”andclick.
� Havestudentsexplorethismap,zoomingintotheirstate,and/oranarea
ofinterest,andclickingonbuoystobringupthemostrecentdatafrom
thatbuoy.
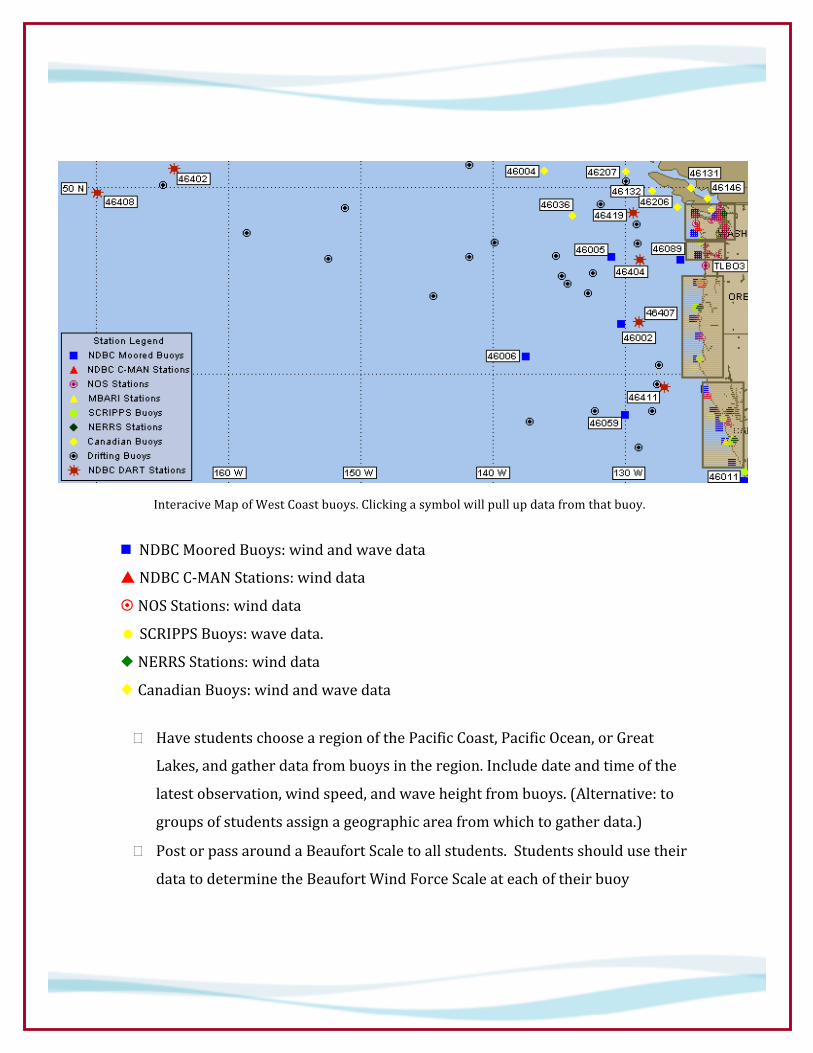
NDBCMooredBuoys:windandwavedata
NDBCC‐MANStations:winddata
NOSStations:winddata
SCRIPPSBuoys:wavedata.
NERRSStations:winddata
CanadianBuoys:windandwavedata
� HavestudentschoosearegionofthePacificCoast,PacificOcean,orGreat
Lakes,andgatherdatafrombuoysintheregion.Includedateandtimeofthe
latestobservation,windspeed,andwaveheightfrombuoys.(Alternative:to
groupsofstudentsassignageographicareafromwhichtogatherdata.)
� PostorpassaroundaBeaufortScaletoallstudents.Studentsshouldusetheir
datatodeterminetheBeaufortWindForceScaleateachoftheirbuoy
InteraciveMapofWestCoastbuoys.Clickingasymbolwillpullupdatafromthatbuoy.
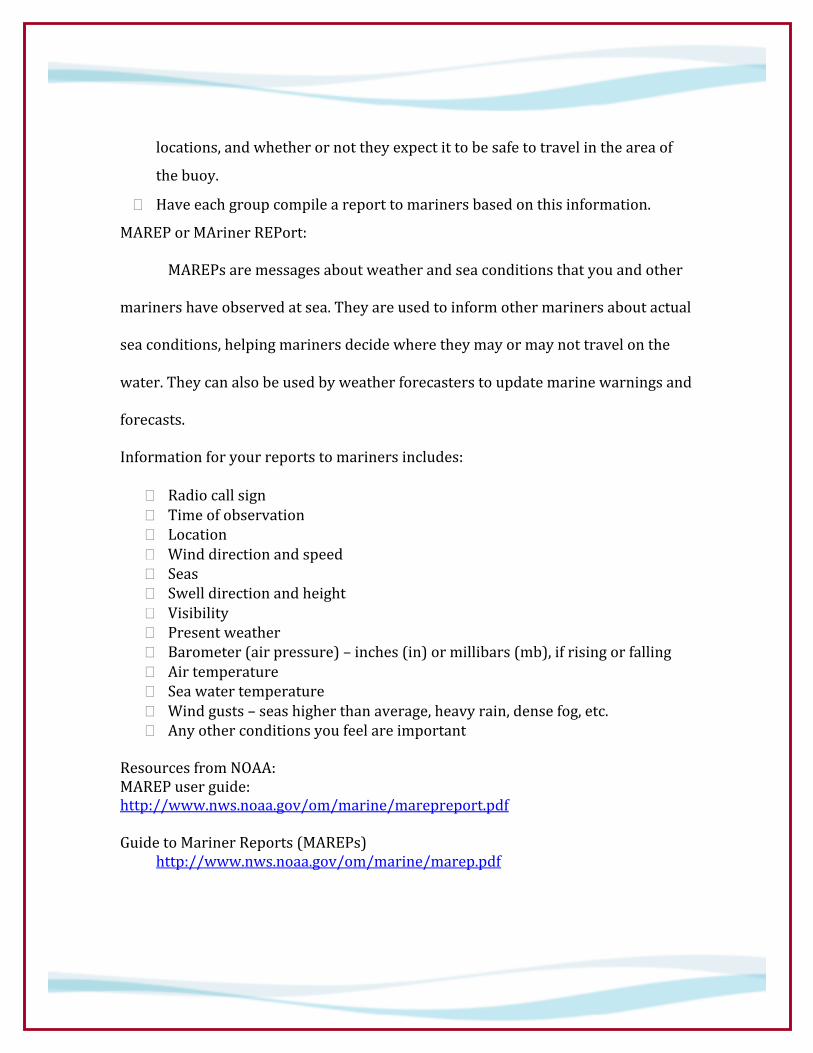
locations,andwhetherornottheyexpectittobesafetotravelintheareaof
thebuoy.
� Haveeachgroupcompileareporttomarinersbasedonthisinformation.
MAREPorMArinerREPort:
MAREPsaremessagesaboutweatherandseaconditionsthatyouandother
marinershaveobservedatsea.Theyareusedtoinformothermarinersaboutactual
seaconditions,helpingmarinersdecidewheretheymayormaynottravelonthe
water.Theycanalsobeusedbyweatherforecasterstoupdatemarinewarningsand
forecasts.
Informationforyourreportstomarinersincludes:
� Radiocallsign� Timeofobservation� Location� Winddirectionandspeed� Seas� Swelldirectionandheight� Visibility� Presentweather� Barometer(airpressure)–inches(in)ormillibars(mb),ifrisingorfalling� Airtemperature� Seawatertemperature� Windgusts–seashigherthanaverage,heavyrain,densefog,etc.� Anyotherconditionsyoufeelareimportant
ResourcesfromNOAA:MAREPuserguide:http://www.nws.noaa.gov/om/marine/marepreport.pdfGuidetoMarinerReports(MAREPs)
http://www.nws.noaa.gov/om/marine/marep.pdf
� Ifstudentswouldlikemoreinformationtoincludeintheirforecast,theycan
accesstheNationalWeatherService,at:http://www.nws.noaa.gov/tofind
informationontemperature,precipitation,andcloudcover.
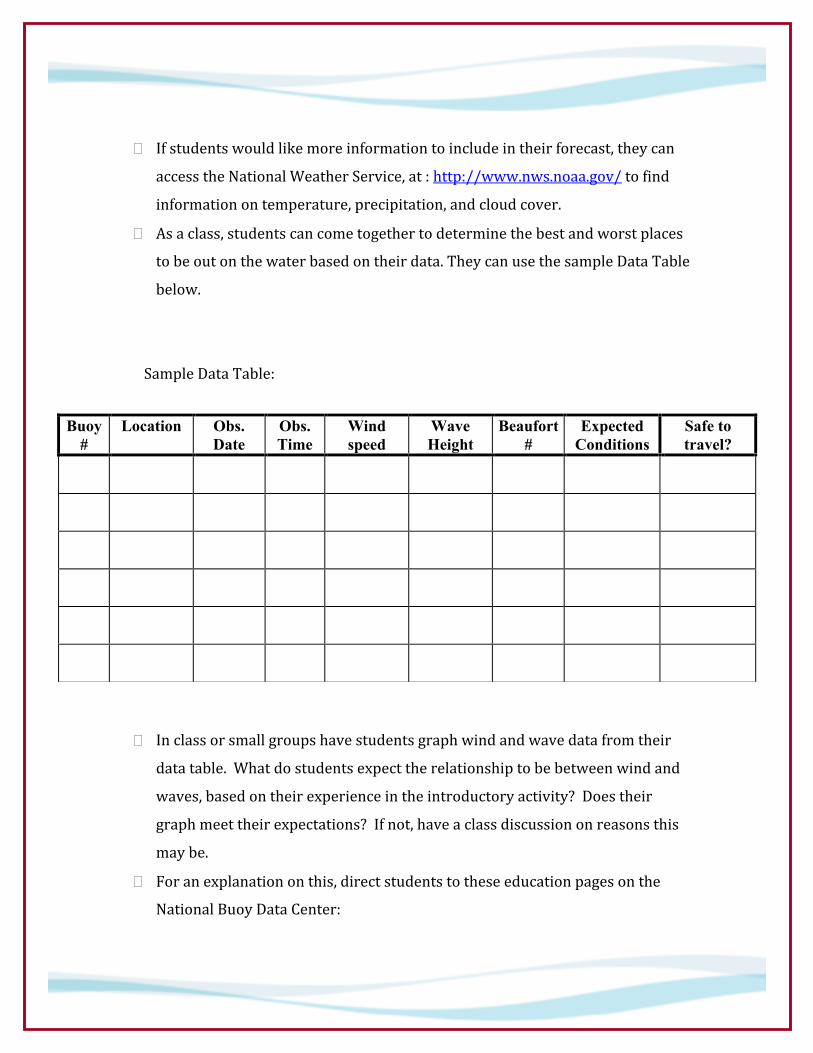
� Asaclass,studentscancometogethertodeterminethebestandworstplaces
tobeoutonthewaterbasedontheirdata.TheycanusethesampleDataTable
below.
SampleDataTable:
� Inclassorsmallgroupshavestudentsgraphwindandwavedatafromtheir
datatable.Whatdostudentsexpecttherelationshiptobebetweenwindand
waves,basedontheirexperienceintheintroductoryactivity?Doestheir
graphmeettheirexpectations?Ifnot,haveaclassdiscussiononreasonsthis
maybe.
� Foranexplanationonthis,directstudentstotheseeducationpagesonthe
NationalBuoyDataCenter:
Buoy #
Location Obs. Date
Obs. Time
Wind speed
Wave Height
Beaufort #
Expected Conditions
Safe to travel?
http://www.ndbc.noaa.gov/educate/pacwave.shtml.Makesurestudentsread
throughthepageandclick“Answer”atthebottomtogettheexplanationof
whywindandwavedatamaynotcorrelateasnicelyastheymightexpect.
Resources
� NationalGeographicwavesimulator.Studentscanadjustwaveheight,wave
periodwavelength.
http://www.nationalgeographic.com/volvooceanrace/interactives/waves/
� Backgroundinformationonwaves:
http://www.windows.ucar.edu/tour/link=/earth/Water/ocean_motion.html
� NDBCScienceEducationPage:
http://www.ndbc.noaa.gov/educate/pacwave.shtml
Standards OLEP (Ocean Literacy Essential Principles)
NSES (National Science Education Standards)
Washington State EALRs (Essential Academic Learning Requirements) and GLEs
(Grade Level Expectations)
Oregon Science Standards
ContentStandardorEssentialPrinciple
LEARNINGGOALS
A:Abilitiesnecessarytodoscience
NSES
� Develop descriptions, explanations, predications, and models using evidence. (6-8)
� Think critically and logically to make the relationships between evidence and explanations. (6-8)
7:Theoceanislargelyunexplored.
OLEP
� Understandingtheoceanismorethanamatterofcuriosity.Exploration,inquiry,andstudyarerequiredtobetterunderstandoceansystemsandprocesses.
� Newtechnologies,sensors,andtoolsareexpandingourabilitytoexploretheocean.Oceanscientistsarerelyingmoreandmoreon
satellites,drifters,buoys,subseaobservatoriesandunmannedsubmersibles.
ScientificInquiry
OR
� Summarizeandanalyzedataincludingpossiblesourcesoferror.Explainresultsandofferreasonableandaccurateinterpretationsandimplications.
EALR2:InquiryCoreContent:QuestioningandInvestigating
WA
� Collecting, analyzing, and displaying data are essential aspects of all investigations.
EALR3:ApplicationCoreContent:Science,Technology,andSociety
WA
� The ability to solve problems is greatly enhanced by use of mathematics and information technologies.
Acknowledgements
� IntroductorylessonmodifiedfromlessonbyMargaretOlsen,SouthEast
COSEE
� Datalessonbasedon“SeaState”lessonfromtheBridge:
http://www2.vims.edu/bridge/search/archives.cfm
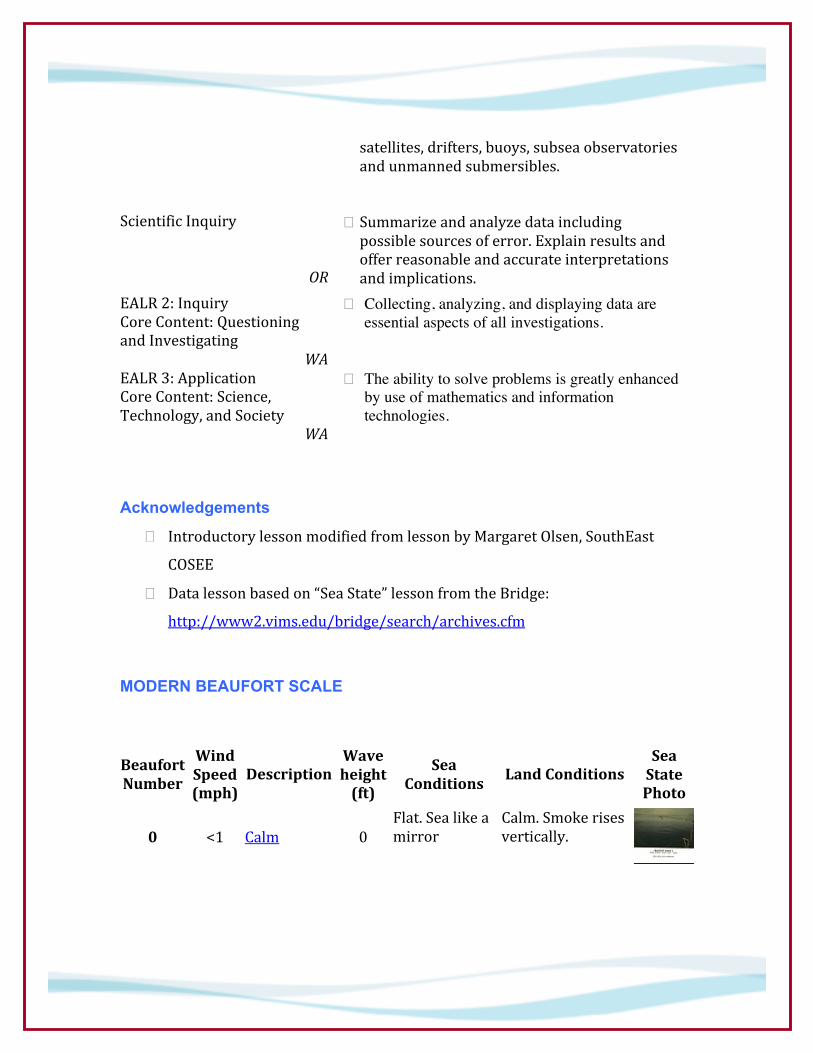
MODERN BEAUFORT SCALE
BeaufortNumber
WindSpeed(mph)
DescriptionWaveheight(ft)
SeaConditions
LandConditionsSeaStatePhoto
0 <1 Calm 0Flat.Sealikeamirror
Calm.Smokerisesvertically.
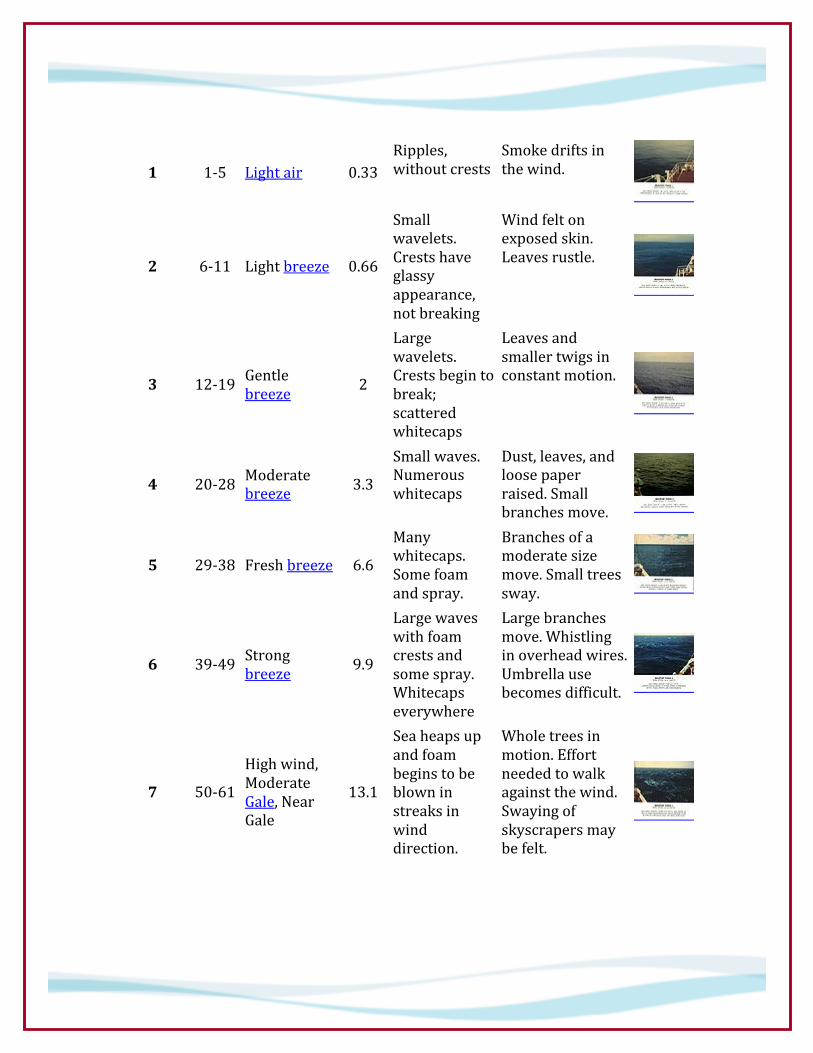
1 1‐5 Lightair 0.33Ripples,withoutcrests
Smokedriftsinthewind.
2 6‐11 Lightbreeze 0.66
Smallwavelets.Crestshaveglassyappearance,notbreaking
Windfeltonexposedskin.Leavesrustle.
3 12‐19 Gentlebreeze 2
Largewavelets.Crestsbegintobreak;scatteredwhitecaps
Leavesandsmallertwigsinconstantmotion.
4 20‐28 Moderatebreeze 3.3
Smallwaves.Numerouswhitecaps
Dust,leaves,andloosepaperraised.Smallbranchesmove.
5 29‐38 Freshbreeze 6.6
Manywhitecaps.Somefoamandspray.
Branchesofamoderatesizemove.Smalltreessway.
6 39‐49 Strongbreeze 9.9
Largewaveswithfoamcrestsandsomespray.Whitecapseverywhere
Largebranchesmove.Whistlinginoverheadwires.Umbrellausebecomesdifficult.
7 50‐61
Highwind,ModerateGale,NearGale
13.1
Seaheapsupandfoambeginstobeblowninstreaksinwinddirection.
Wholetreesinmotion.Effortneededtowalkagainstthewind.Swayingofskyscrapersmaybefelt.

8
62‐74 FreshGale 18
Moderatelyhighwaveswithbreakingcrestsformingspindrift.Streaksoffoam.
Twigsbrokenfromtrees.Carsveeronroad.
9 75‐88 StrongGale 23
Highwaveswithdensefoam.Seabeginstoroll.Considerablespray.
Largerbranchesbreakofftrees,andsmalltreesuprooted.Temporarysignsandbarricadesblowover.
10 89‐102
WholeGale/Storm 29.5
Veryhighwaveswithoverhangingcrests.Foamgivestheseaawhiteappearance.Airbornesprayreducesvisibility.
Treesarebrokenofforuprooted,saplingsbentanddeformed,Shinglesinpoorconditionpeeloffroofs.
11 103‐117
Violentstorm 37.7
Exceptionallyhighwaves.Foamcoversmuchoftheseasurface.Airbornesprayseverelyreducesvisibility.
Widespreaddamage.Damagetomostroofsurfaces,oldercurled/fracturedasphalttilesmaybreakawaycompletely.
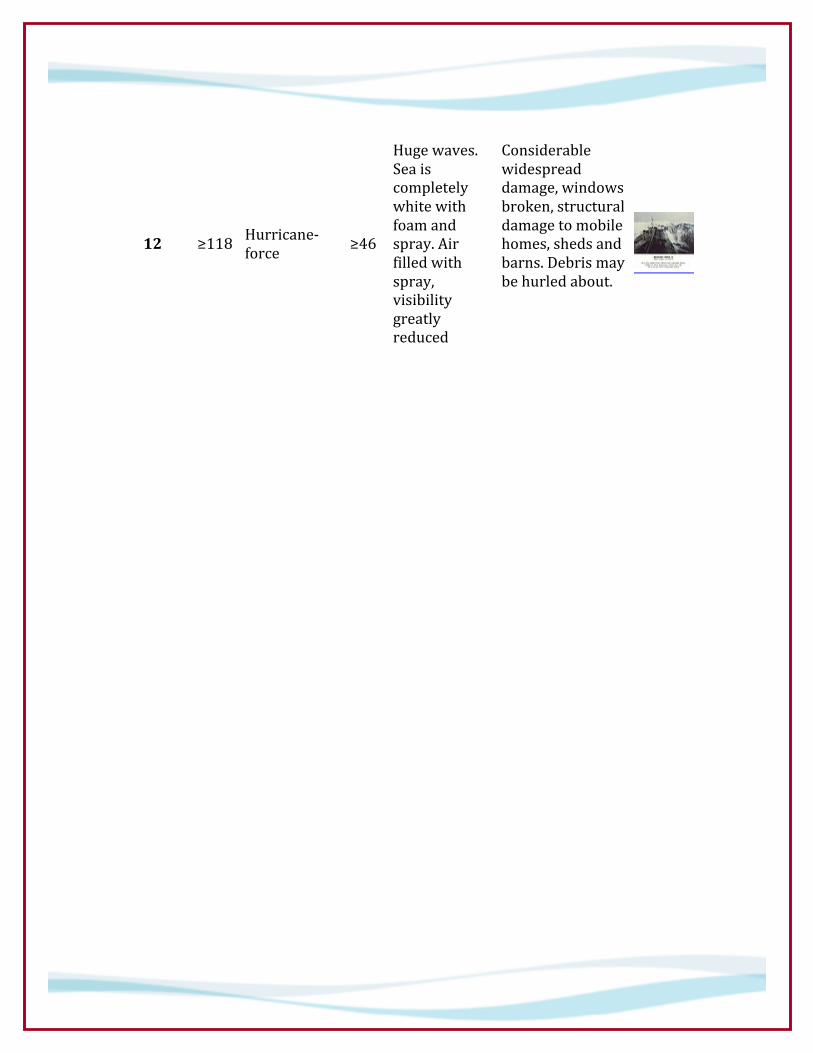
12 ≥118 Hurricane‐force ≥46
Hugewaves.Seaiscompletelywhitewithfoamandspray.Airfilledwithspray,visibilitygreatlyreduced
Considerablewidespreaddamage,windowsbroken,structuraldamagetomobilehomes,shedsandbarns.Debrismaybehurledabout.