Embed Size (px)
Citation preview
MANPOWER RESEARCH AND STATISTICS DEPARTMENT, MINISTRY OF MANPOWER 1
Conditions of Employment 2020
By:
Ng Bin Shen, Lucas
Manpower Research and Statistics Department
Singapore
March 2021
MANPOWER RESEARCH AND STATISTICS DEPARTMENT, MINISTRY OF MANPOWER 2
COPYRIGHT NOTICE
CONDITIONS OF EMPLOYMENT 2020
© Manpower Research and Statistics Department Ministry of Manpower Republic of Singapore
All rights reserved. Further reproduction of this material is prohibited without the written permission of the copyright holder. Application to reproduce any part of this publication should be addressed to: Director Manpower Research and Statistics Department Ministry of Manpower 18 Havelock Road #05-01 Singapore 059764 Republic of Singapore
Email: [email protected]
Please cite the source as “MRSD, MOM” when you extract and use the information/data from the publication.
MANPOWER RESEARCH AND STATISTICS DEPARTMENT, MINISTRY OF MANPOWER 3
Statistical activities conducted by the Manpower Research and Statistics Department (MRSD) are
governed by the provisions of the Statistics Act (Chapter 317). The Act guarantees the confidentiality
of information collected from individuals and companies. It spells out the legislative authority and
responsibility of the Director, Manpower Research and Statistics Department.
Statistics compiled and disseminated by the MRSD adhere to international standards on official statistics
set by the International Labour Organisation and International Monetary Fund.
For insights on the labour market, visit us at stats.mom.gov.sg.
MISSION
To provide timely and reliable
national statistical information on the labour market
to facilitate informed decision-making within the government and community-at-large
MANPOWER RESEARCH AND STATISTICS DEPARTMENT, MINISTRY OF MANPOWER 4
Contents
Highlights ............................................................................................................................................ 5
Introduction ........................................................................................................................................ 7
Flexible Work Arrangements .............................................................................................................. 8
Work-Week Pattern .......................................................................................................................... 11
Annual Leave Entitlement ................................................................................................................. 13
Non-Statutory Leave ......................................................................................................................... 15
Sickness Absenteeism ....................................................................................................................... 17
Concluding Remarks.......................................................................................................................... 18
Annex A: Survey Coverage and Methodology .................................................................................. 19
Annex B: Statistical Tables ................................................................................................................ 24
Notations: -: Nil or negligible No.: Number s: Data suppressed due to small number of observations List of Abbreviations: M&Es: Management & Executives RAF: Rank-And-File Sat: Saturday FWAs: Flexible Work Arrangements MC: Medical Certificate
MANPOWER RESEARCH AND STATISTICS DEPARTMENT, MINISTRY OF MANPOWER 5
Highlights
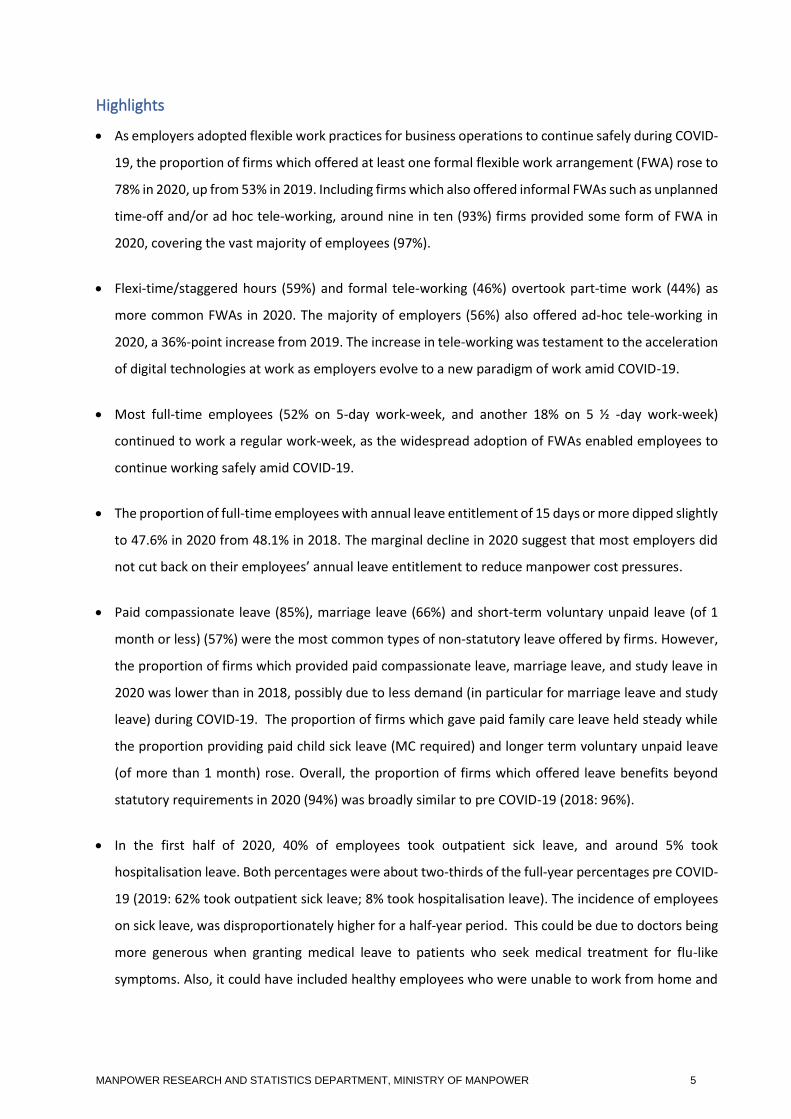
• As employers adopted flexible work practices for business operations to continue safely during COVID-
19, the proportion of firms which offered at least one formal flexible work arrangement (FWA) rose to
78% in 2020, up from 53% in 2019. Including firms which also offered informal FWAs such as unplanned
time-off and/or ad hoc tele-working, around nine in ten (93%) firms provided some form of FWA in
2020, covering the vast majority of employees (97%).
• Flexi-time/staggered hours (59%) and formal tele-working (46%) overtook part-time work (44%) as
more common FWAs in 2020. The majority of employers (56%) also offered ad-hoc tele-working in
2020, a 36%-point increase from 2019. The increase in tele-working was testament to the acceleration
of digital technologies at work as employers evolve to a new paradigm of work amid COVID-19.
• Most full-time employees (52% on 5-day work-week, and another 18% on 5 ½ -day work-week)
continued to work a regular work-week, as the widespread adoption of FWAs enabled employees to
continue working safely amid COVID-19.
• The proportion of full-time employees with annual leave entitlement of 15 days or more dipped slightly
to 47.6% in 2020 from 48.1% in 2018. The marginal decline in 2020 suggest that most employers did
not cut back on their employees’ annual leave entitlement to reduce manpower cost pressures.
• Paid compassionate leave (85%), marriage leave (66%) and short-term voluntary unpaid leave (of 1
month or less) (57%) were the most common types of non-statutory leave offered by firms. However,
the proportion of firms which provided paid compassionate leave, marriage leave, and study leave in
2020 was lower than in 2018, possibly due to less demand (in particular for marriage leave and study
leave) during COVID-19. The proportion of firms which gave paid family care leave held steady while
the proportion providing paid child sick leave (MC required) and longer term voluntary unpaid leave
(of more than 1 month) rose. Overall, the proportion of firms which offered leave benefits beyond
statutory requirements in 2020 (94%) was broadly similar to pre COVID-19 (2018: 96%).
• In the first half of 2020, 40% of employees took outpatient sick leave, and around 5% took
hospitalisation leave. Both percentages were about two-thirds of the full-year percentages pre COVID-
19 (2019: 62% took outpatient sick leave; 8% took hospitalisation leave). The incidence of employees
on sick leave, was disproportionately higher for a half-year period. This could be due to doctors being
more generous when granting medical leave to patients who seek medical treatment for flu-like
symptoms. Also, it could have included healthy employees who were unable to work from home and
MANPOWER RESEARCH AND STATISTICS DEPARTMENT, MINISTRY OF MANPOWER 6
have taken outpatient sick leave or hospitalisation leave to serve their Leave of Absence/ Stay-Home
Notice/ Home Quarantine Order.
MANPOWER RESEARCH AND STATISTICS DEPARTMENT, MINISTRY OF MANPOWER 7
1. Introduction
1.1 The Conditions of Employment report analyses employment conditions and
workplace practices against the backdrop of the COVID-19 situation. The 2020 data in this report are
from the Conditions of Employment Survey 2020 conducted by the Manpower Research and Statistics
Department in the middle of the year. As the conduct of the survey coincided with the Circuit Breaker
period, the data will be largely influenced by this situation and trend comparisons should be viewed
in light of this.
1.2 The survey covered establishments from both the private sector (each with at least
25 employees) and the public sector. A total of 3,800 establishments employing 1,289,300 employees
responded, yielding a response rate of 85.4%. Details of the survey coverage and methodology are in
Annex A.
MANPOWER RESEARCH AND STATISTICS DEPARTMENT, MINISTRY OF MANPOWER 8
2. Flexible Work Arrangements
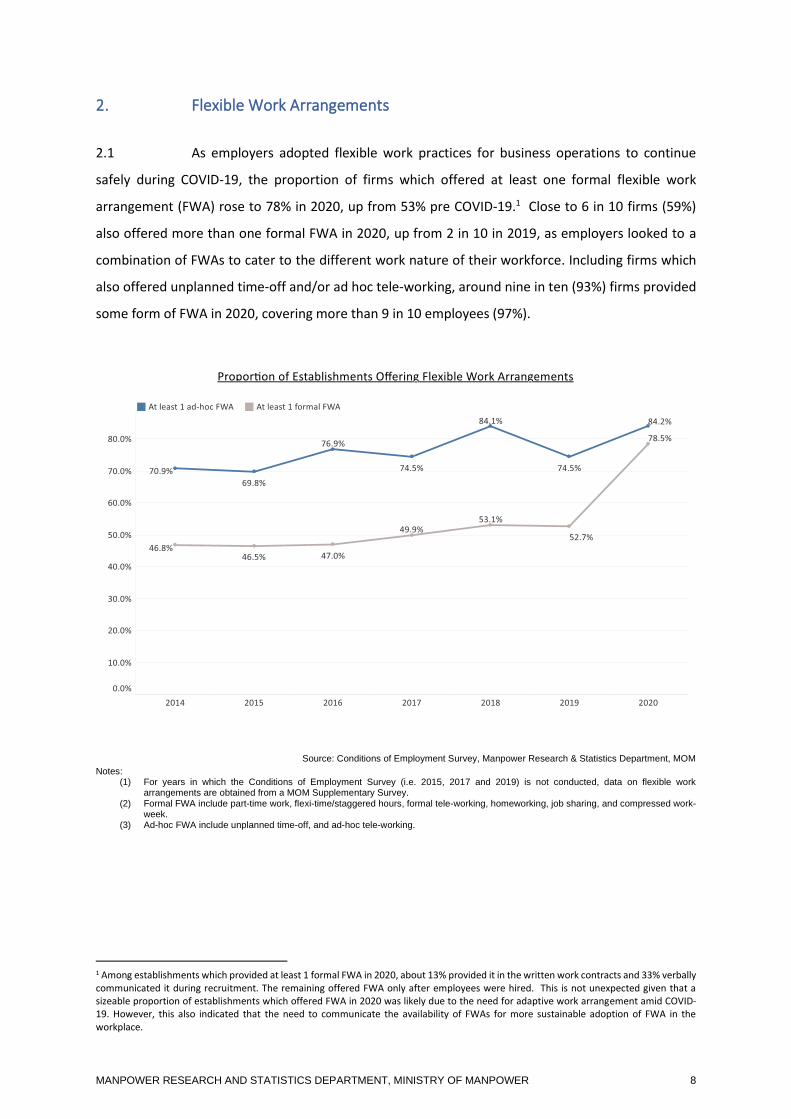
2.1 As employers adopted flexible work practices for business operations to continue
safely during COVID-19, the proportion of firms which offered at least one formal flexible work
arrangement (FWA) rose to 78% in 2020, up from 53% pre COVID-19.1 Close to 6 in 10 firms (59%)
also offered more than one formal FWA in 2020, up from 2 in 10 in 2019, as employers looked to a
combination of FWAs to cater to the different work nature of their workforce. Including firms which
also offered unplanned time-off and/or ad hoc tele-working, around nine in ten (93%) firms provided
some form of FWA in 2020, covering more than 9 in 10 employees (97%).
Source: Conditions of Employment Survey, Manpower Research & Statistics Department, MOM
Notes: (1) For years in which the Conditions of Employment Survey (i.e. 2015, 2017 and 2019) is not conducted, data on flexible work
arrangements are obtained from a MOM Supplementary Survey. (2) Formal FWA include part-time work, flexi-time/staggered hours, formal tele-working, homeworking, job sharing, and compressed work-
week. (3) Ad-hoc FWA include unplanned time-off, and ad-hoc tele-working.
1 Among establishments which provided at least 1 formal FWA in 2020, about 13% provided it in the written work contracts and 33% verbally communicated it during recruitment. The remaining offered FWA only after employees were hired. This is not unexpected given that a sizeable proportion of establishments which offered FWA in 2020 was likely due to the need for adaptive work arrangement amid COVID-19. However, this also indicated that the need to communicate the availability of FWAs for more sustainable adoption of FWA in the workplace.
MANPOWER RESEARCH AND STATISTICS DEPARTMENT, MINISTRY OF MANPOWER 9
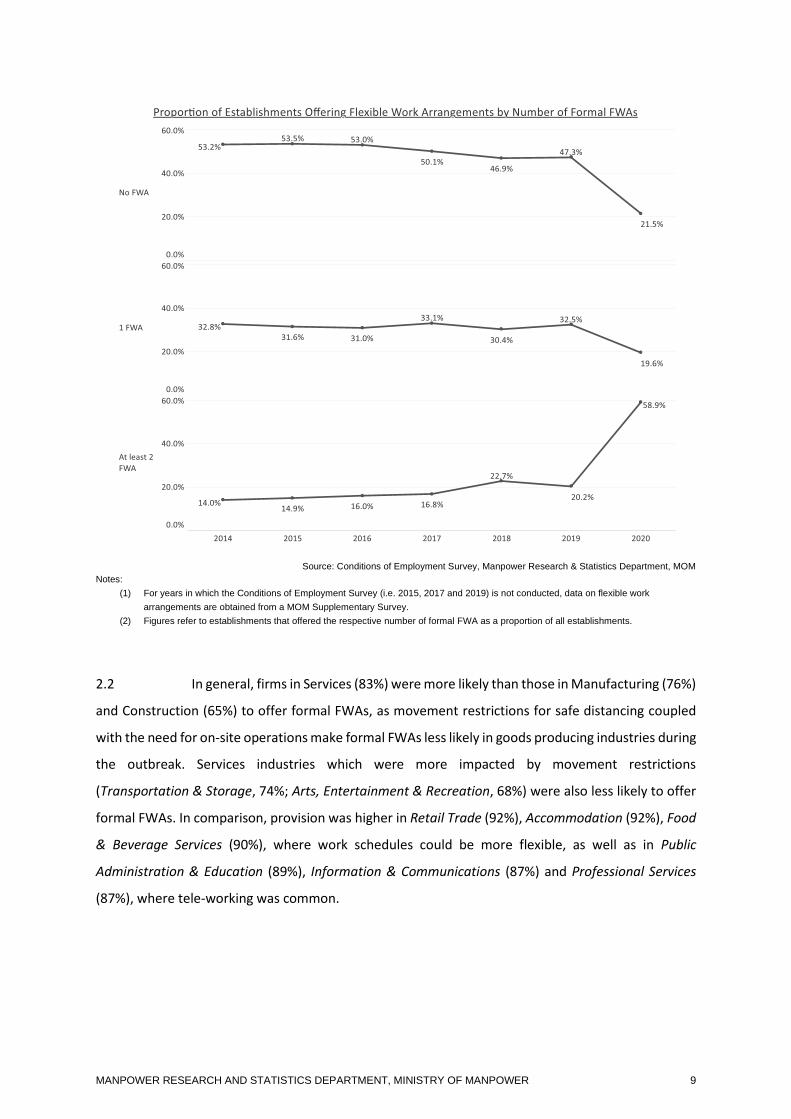
Source: Conditions of Employment Survey, Manpower Research & Statistics Department, MOM
Notes:
(1) For years in which the Conditions of Employment Survey (i.e. 2015, 2017 and 2019) is not conducted, data on flexible work
arrangements are obtained from a MOM Supplementary Survey.
(2) Figures refer to establishments that offered the respective number of formal FWA as a proportion of all establishments.
2.2 In general, firms in Services (83%) were more likely than those in Manufacturing (76%)
and Construction (65%) to offer formal FWAs, as movement restrictions for safe distancing coupled
with the need for on-site operations make formal FWAs less likely in goods producing industries during
the outbreak. Services industries which were more impacted by movement restrictions
(Transportation & Storage, 74%; Arts, Entertainment & Recreation, 68%) were also less likely to offer
formal FWAs. In comparison, provision was higher in Retail Trade (92%), Accommodation (92%), Food
& Beverage Services (90%), where work schedules could be more flexible, as well as in Public
Administration & Education (89%), Information & Communications (87%) and Professional Services
(87%), where tele-working was common.
MANPOWER RESEARCH AND STATISTICS DEPARTMENT, MINISTRY OF MANPOWER 10
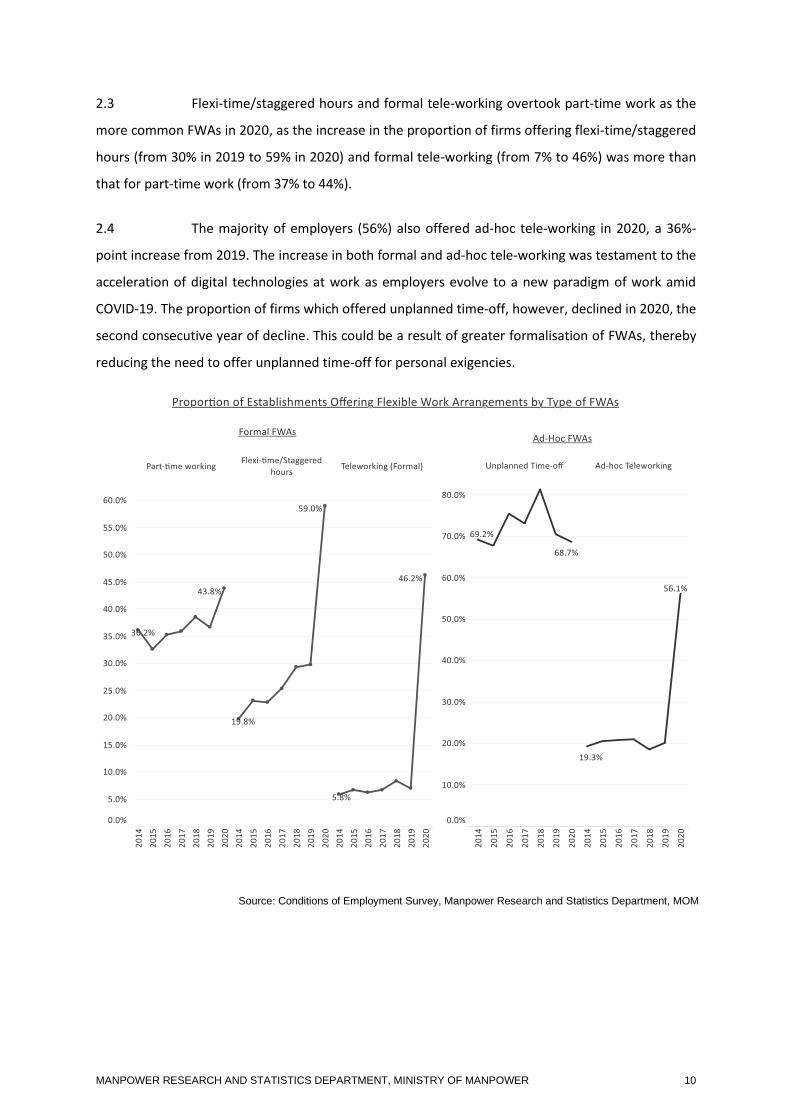
2.3 Flexi-time/staggered hours and formal tele-working overtook part-time work as the
more common FWAs in 2020, as the increase in the proportion of firms offering flexi-time/staggered
hours (from 30% in 2019 to 59% in 2020) and formal tele-working (from 7% to 46%) was more than
that for part-time work (from 37% to 44%).
2.4 The majority of employers (56%) also offered ad-hoc tele-working in 2020, a 36%-
point increase from 2019. The increase in both formal and ad-hoc tele-working was testament to the
acceleration of digital technologies at work as employers evolve to a new paradigm of work amid
COVID-19. The proportion of firms which offered unplanned time-off, however, declined in 2020, the
second consecutive year of decline. This could be a result of greater formalisation of FWAs, thereby
reducing the need to offer unplanned time-off for personal exigencies.
Source: Conditions of Employment Survey, Manpower Research and Statistics Department, MOM
MANPOWER RESEARCH AND STATISTICS DEPARTMENT, MINISTRY OF MANPOWER 11
3. Work-Week Pattern
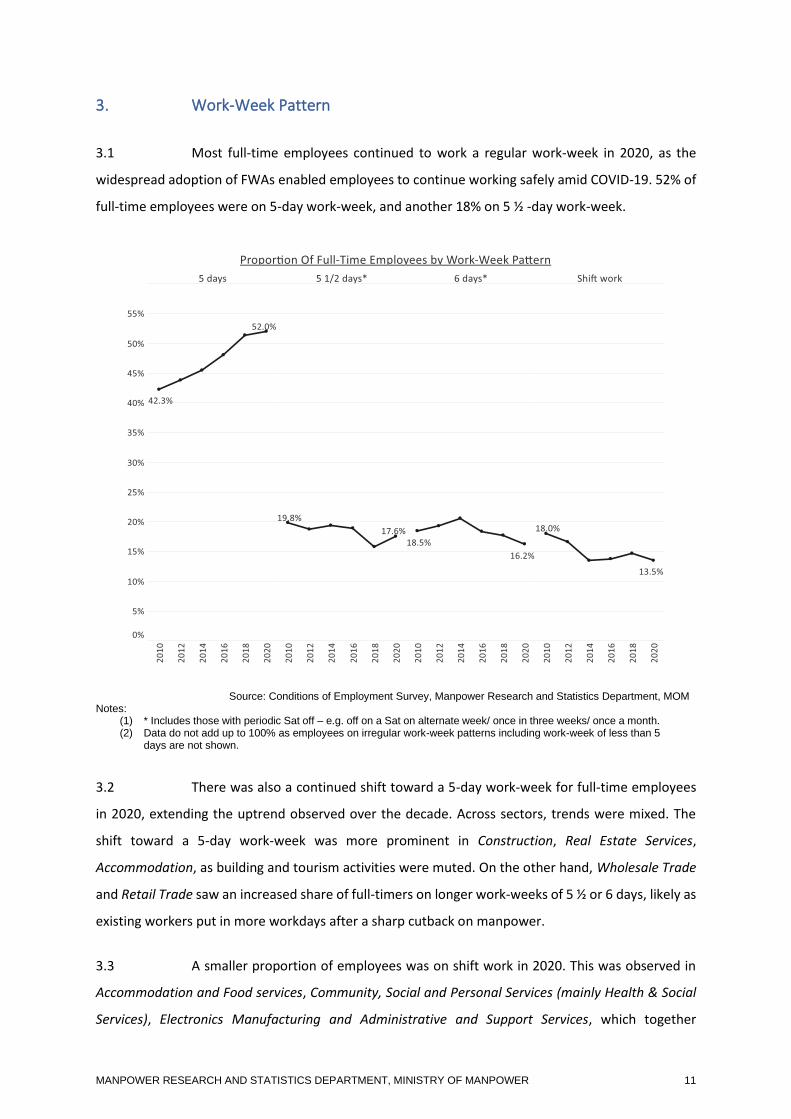
3.1 Most full-time employees continued to work a regular work-week in 2020, as the
widespread adoption of FWAs enabled employees to continue working safely amid COVID-19. 52% of
full-time employees were on 5-day work-week, and another 18% on 5 ½ -day work-week.
Source: Conditions of Employment Survey, Manpower Research and Statistics Department, MOM Notes:
(1) * Includes those with periodic Sat off – e.g. off on a Sat on alternate week/ once in three weeks/ once a month. (2) Data do not add up to 100% as employees on irregular work-week patterns including work-week of less than 5
days are not shown.
3.2 There was also a continued shift toward a 5-day work-week for full-time employees
in 2020, extending the uptrend observed over the decade. Across sectors, trends were mixed. The
shift toward a 5-day work-week was more prominent in Construction, Real Estate Services,
Accommodation, as building and tourism activities were muted. On the other hand, Wholesale Trade
and Retail Trade saw an increased share of full-timers on longer work-weeks of 5 ½ or 6 days, likely as
existing workers put in more workdays after a sharp cutback on manpower.
3.3 A smaller proportion of employees was on shift work in 2020. This was observed in
Accommodation and Food services, Community, Social and Personal Services (mainly Health & Social
Services), Electronics Manufacturing and Administrative and Support Services, which together
MANPOWER RESEARCH AND STATISTICS DEPARTMENT, MINISTRY OF MANPOWER 12
accounted for close to 50% of all employees on shift work. The decline was likely a result of the need
to minimise the number of employees performing shift work on-site during the Circuit Breaker period.
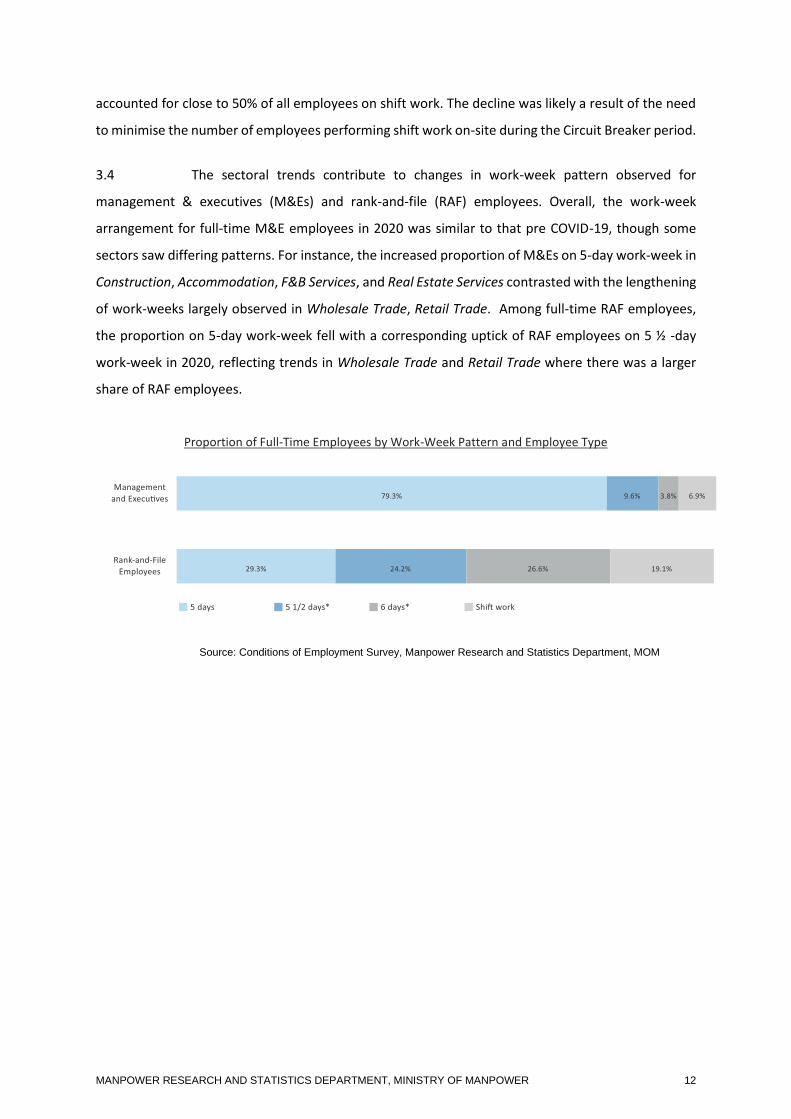
3.4 The sectoral trends contribute to changes in work-week pattern observed for
management & executives (M&Es) and rank-and-file (RAF) employees. Overall, the work-week
arrangement for full-time M&E employees in 2020 was similar to that pre COVID-19, though some
sectors saw differing patterns. For instance, the increased proportion of M&Es on 5-day work-week in
Construction, Accommodation, F&B Services, and Real Estate Services contrasted with the lengthening
of work-weeks largely observed in Wholesale Trade, Retail Trade. Among full-time RAF employees,
the proportion on 5-day work-week fell with a corresponding uptick of RAF employees on 5 ½ -day
work-week in 2020, reflecting trends in Wholesale Trade and Retail Trade where there was a larger
share of RAF employees.
Proportion of Full-Time Employees by Work-Week Pattern and Employee Type
Source: Conditions of Employment Survey, Manpower Research and Statistics Department, MOM
MANPOWER RESEARCH AND STATISTICS DEPARTMENT, MINISTRY OF MANPOWER 13
4. Annual Leave Entitlement
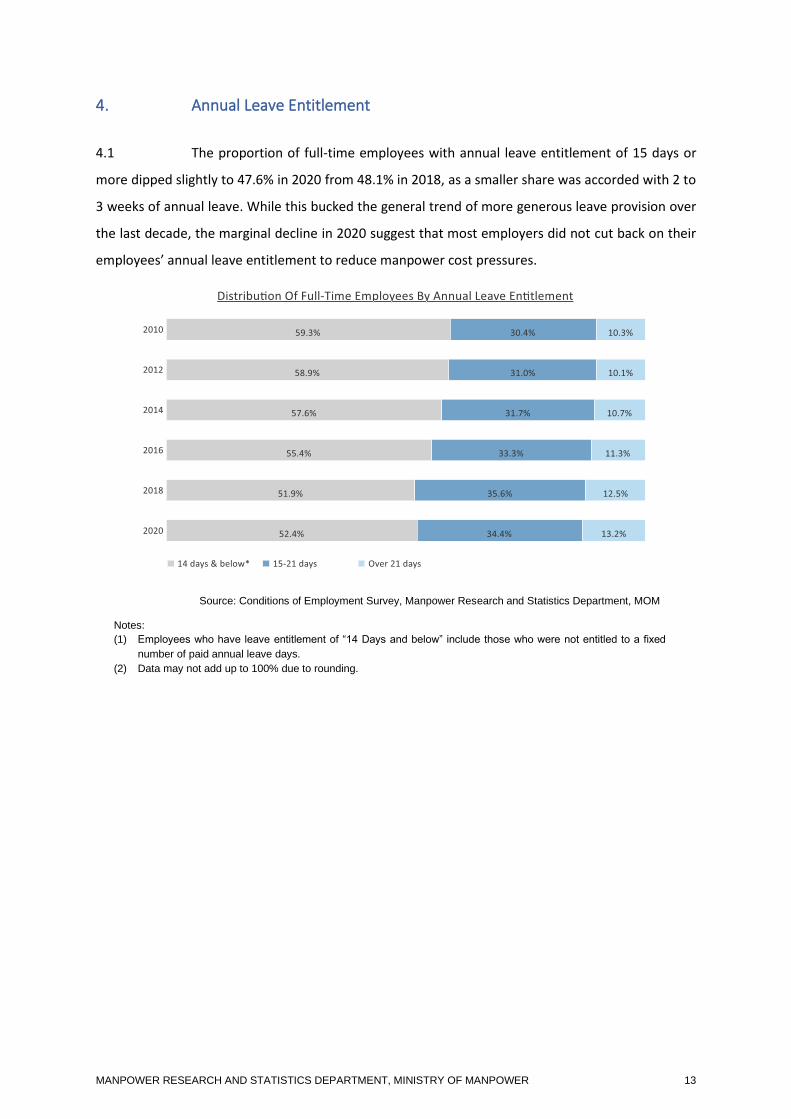
4.1 The proportion of full-time employees with annual leave entitlement of 15 days or
more dipped slightly to 47.6% in 2020 from 48.1% in 2018, as a smaller share was accorded with 2 to
3 weeks of annual leave. While this bucked the general trend of more generous leave provision over
the last decade, the marginal decline in 2020 suggest that most employers did not cut back on their
employees’ annual leave entitlement to reduce manpower cost pressures.
Source: Conditions of Employment Survey, Manpower Research and Statistics Department, MOM
Notes:
(1) Employees who have leave entitlement of “14 Days and below” include those who were not entitled to a fixed
number of paid annual leave days.
(2) Data may not add up to 100% due to rounding.
MANPOWER RESEARCH AND STATISTICS DEPARTMENT, MINISTRY OF MANPOWER 14
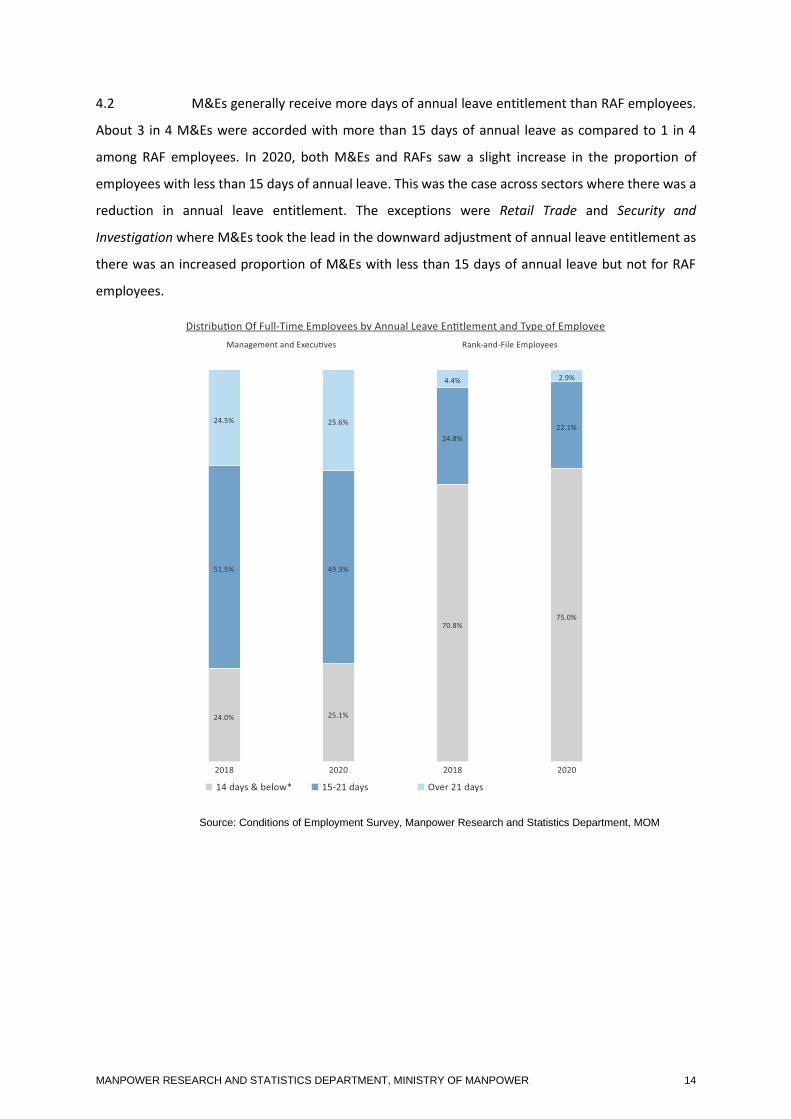
4.2 M&Es generally receive more days of annual leave entitlement than RAF employees.
About 3 in 4 M&Es were accorded with more than 15 days of annual leave as compared to 1 in 4
among RAF employees. In 2020, both M&Es and RAFs saw a slight increase in the proportion of
employees with less than 15 days of annual leave. This was the case across sectors where there was a
reduction in annual leave entitlement. The exceptions were Retail Trade and Security and
Investigation where M&Es took the lead in the downward adjustment of annual leave entitlement as
there was an increased proportion of M&Es with less than 15 days of annual leave but not for RAF
employees.
Source: Conditions of Employment Survey, Manpower Research and Statistics Department, MOM
MANPOWER RESEARCH AND STATISTICS DEPARTMENT, MINISTRY OF MANPOWER 15
5. Non-Statutory Leave
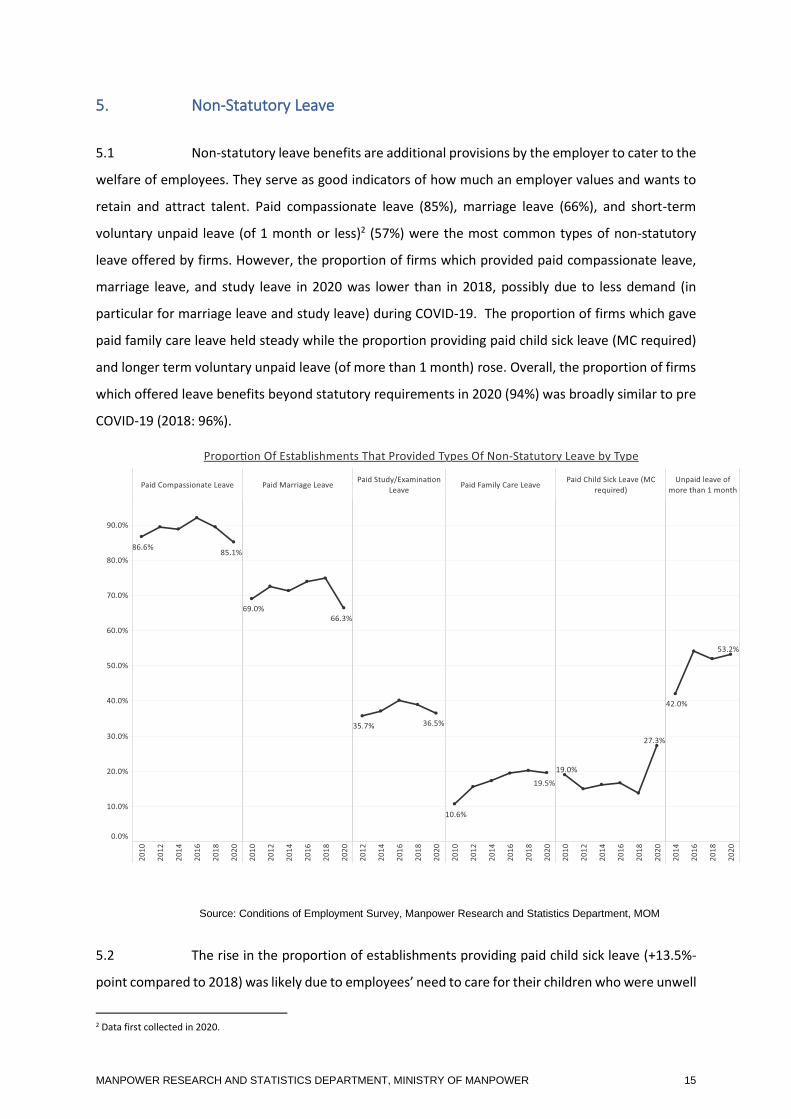
5.1 Non-statutory leave benefits are additional provisions by the employer to cater to the
welfare of employees. They serve as good indicators of how much an employer values and wants to
retain and attract talent. Paid compassionate leave (85%), marriage leave (66%), and short-term
voluntary unpaid leave (of 1 month or less)2 (57%) were the most common types of non-statutory
leave offered by firms. However, the proportion of firms which provided paid compassionate leave,
marriage leave, and study leave in 2020 was lower than in 2018, possibly due to less demand (in
particular for marriage leave and study leave) during COVID-19. The proportion of firms which gave
paid family care leave held steady while the proportion providing paid child sick leave (MC required)
and longer term voluntary unpaid leave (of more than 1 month) rose. Overall, the proportion of firms
which offered leave benefits beyond statutory requirements in 2020 (94%) was broadly similar to pre
COVID-19 (2018: 96%).
Source: Conditions of Employment Survey, Manpower Research and Statistics Department, MOM
5.2 The rise in the proportion of establishments providing paid child sick leave (+13.5%-
point compared to 2018) was likely due to employees’ need to care for their children who were unwell
2 Data first collected in 2020.
MANPOWER RESEARCH AND STATISTICS DEPARTMENT, MINISTRY OF MANPOWER 16
and/or required to stay-in on medical advice during the outbreak. The slight increase in the provision
of longer term voluntary unpaid leave (of more than 1 month) was mainly driven by firms in the
manufacturing of Petroleum, Chemical & Pharmaceutical Products and Accommodation, likely on the
back of business lull due to the COVID-19 situation. It is also worth noting that the provision of this
leave benefit is linearly related to firm size likely due to better financial position of larger firms.
MANPOWER RESEARCH AND STATISTICS DEPARTMENT, MINISTRY OF MANPOWER 17
6. Sickness Absenteeism
6.1 In a public health crisis like the COVID-19 outbreak, the provision and take-up of sick
leave at work is essential as it helps to contain the outbreak and safeguard employees’ health. During
normal times, it is also important to track employees’ sickness absenteeism as it enables the firm to
monitor overall employees’ well-being and act against intentional and habitual absences which could
affect productivity, morale and business goals.
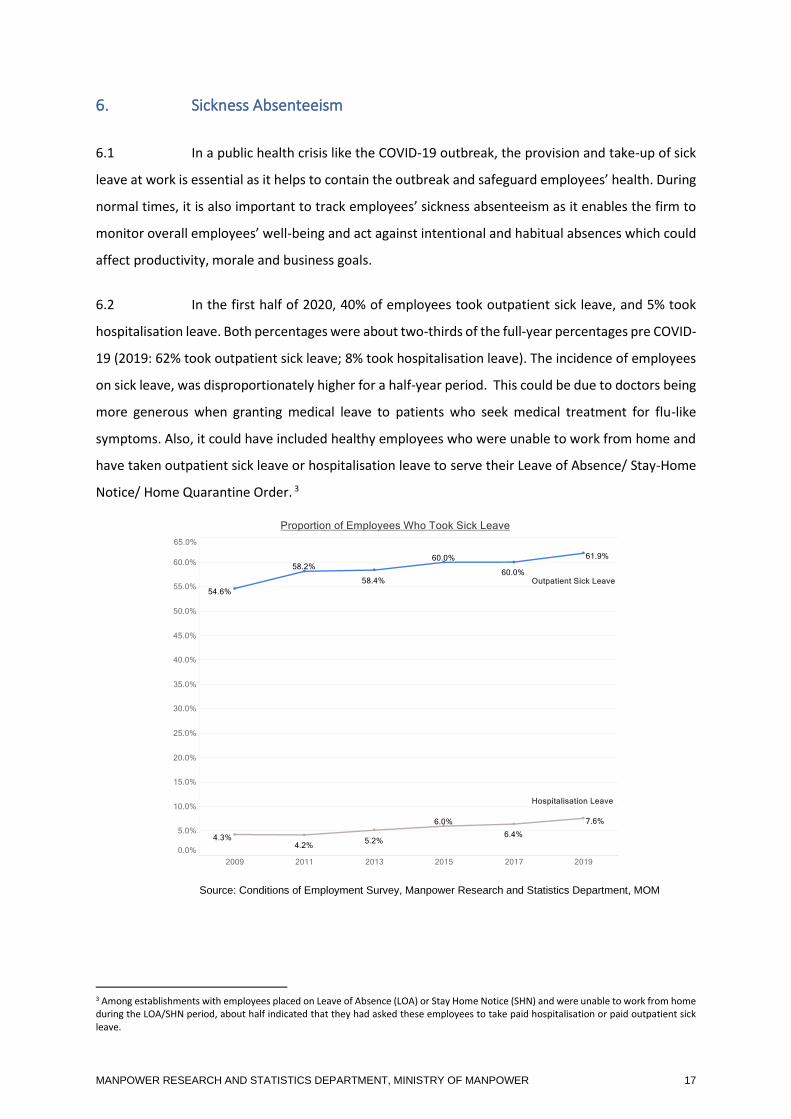
6.2 In the first half of 2020, 40% of employees took outpatient sick leave, and 5% took
hospitalisation leave. Both percentages were about two-thirds of the full-year percentages pre COVID-
19 (2019: 62% took outpatient sick leave; 8% took hospitalisation leave). The incidence of employees
on sick leave, was disproportionately higher for a half-year period. This could be due to doctors being
more generous when granting medical leave to patients who seek medical treatment for flu-like
symptoms. Also, it could have included healthy employees who were unable to work from home and
have taken outpatient sick leave or hospitalisation leave to serve their Leave of Absence/ Stay-Home
Notice/ Home Quarantine Order. 3
Source: Conditions of Employment Survey, Manpower Research and Statistics Department, MOM
3 Among establishments with employees placed on Leave of Absence (LOA) or Stay Home Notice (SHN) and were unable to work from home during the LOA/SHN period, about half indicated that they had asked these employees to take paid hospitalisation or paid outpatient sick leave.
MANPOWER RESEARCH AND STATISTICS DEPARTMENT, MINISTRY OF MANPOWER 18
6.3 The number of sick leave taken per absentee in the first half of 2020 was 3.6 days for
outpatient sick leave and 13.0 days for hospitalisation leave. The average number of hospitalisation
leave taken by mid-year was close to 2019’s full-year average (14.5 days), a consequence of employees
utilising their hospitalisation leave for their 14-day LOA/SHN/HQO. On the whole, the average number
of sick leave taken per absentee in the first half of 2020 remained within the statutory minimum (of
14 days outpatient sick leave, and 60 days hospitalisation leave), suggesting that most employees
would have sufficient sick leave for the year. The total number of days not worked among all absentees
translated to about 29 working days lost due to sickness for every 1,000 available working days from
the entire workforce in the first half of 2020. This was higher than the 21 per 1,000 available working
days in 2019.
6.4 Industries with above-average incidence of employees who took outpatient sick leave
or hospitalisation leave in the first half of 2020 were broadly similar to that in 2019. Employees in
Health and Social Services were most likely to take outpatient sick leave (55%) and hospitalisation
leave (14%) in the first half of 2020. The increase could also be consequence of fatigue due to longer
working hours by healthcare workers to assist in Singapore’s effort in combating COVID-19.
6.5 Employees in Food & Beverage Services, Cleaning & Landscaping and Construction
were least likely to take sick leave. The reasons are multi-fold. First, there is usually a high
concentration of casual employees in these industries who tend not to have access to paid sick leave
and also possibly a reluctance to take it so as not to forgo earnings and/or allowances (e.g. for shift
work). Second, these industries tend to see a higher concentration of firms with smaller workforce
sizes where unwell employees may feel obligated to continue working as their absence may
inconvenience others.
7. Concluding Remarks
7.1 As employers sought to maintain business continuity safely during the COVID-19
outbreak, they have widely adopted flexible work arrangements, particularly in teleworking and
flexible hours. As a result, most full-time employees were able to work on regular work-week
arrangements. The pandemic has also sped up the adoption of digital technologies at work, likely
impacting the provision of flexible work arrangements in the years to come as firms have managed to
maintain productivity and output through remote working.
MANPOWER RESEARCH AND STATISTICS DEPARTMENT, MINISTRY OF MANPOWER 19
Annex A: Survey Coverage and Methodology
Introduction The Conditions of Employment Survey, 2020 was conducted by the Manpower Research and Statistics Department of the Ministry of Manpower under the Statistics Act (Chapter 317). The survey was conducted from 25 June 2020 to 11 September 2020. Objective The survey was conducted to study the general employment conditions and workplace practices covering flexible work arrangements, non-statutory family-friendly leave, annual leave entitlement, work-week pattern and sickness absenteeism. Coverage The survey covered private sector establishments each with at least 25 employees and the public sector comprising government ministries, organs of state and statutory boards. A total of 3,800 establishments employing 1,289,300 employees responded, yielding a response rate of 85.4%. The results were weighted to reflect the population of private sector establishments with at least 25 employees by using expansion factors based on sampling fraction. Mode of submission Respondents were notified of the survey by mail. They could submit their returns online, by post or by email, with clarifications made either over the phone or via email. Reference Period Most of the information provided in the survey returns was based on the establishments’ practices as at 30 June 2020, except for information on sickness absenteeism which was also based on data for calendar year 2019.
MANPOWER RESEARCH AND STATISTICS DEPARTMENT, MINISTRY OF MANPOWER 20
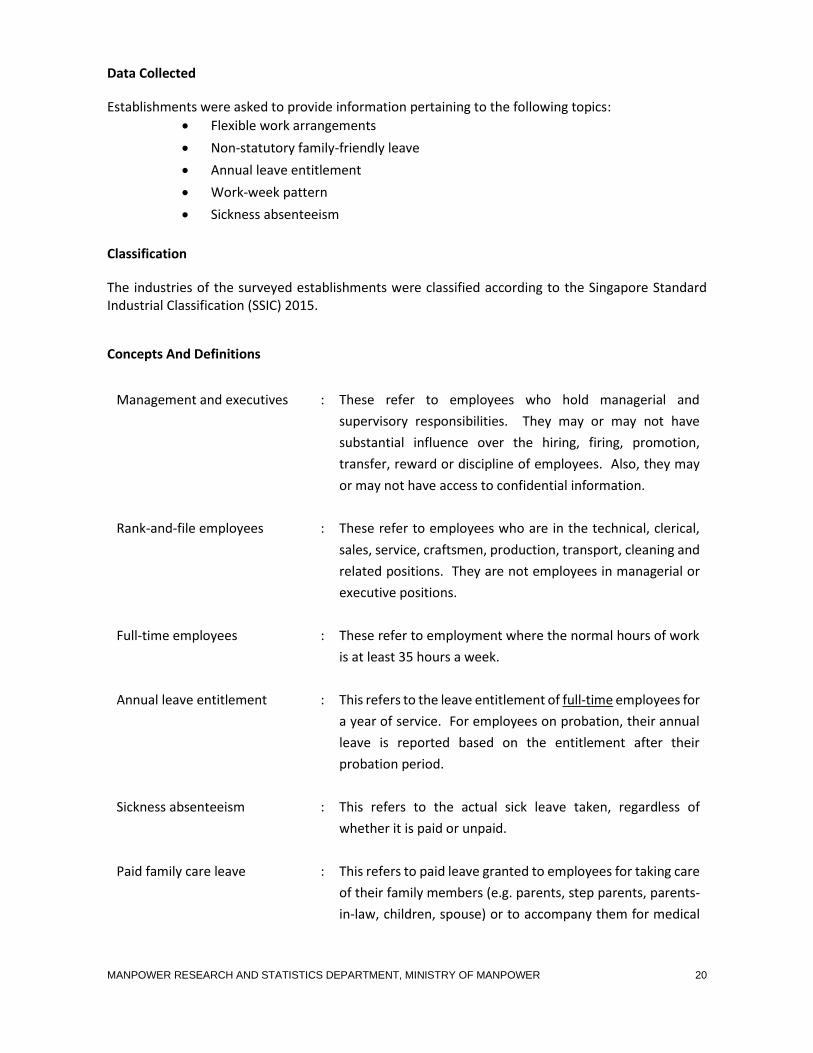
Data Collected
Establishments were asked to provide information pertaining to the following topics:
• Flexible work arrangements
• Non-statutory family-friendly leave
• Annual leave entitlement
• Work-week pattern
• Sickness absenteeism
Classification
The industries of the surveyed establishments were classified according to the Singapore Standard Industrial Classification (SSIC) 2015.
Concepts And Definitions
Management and executives : These refer to employees who hold managerial and
supervisory responsibilities. They may or may not have
substantial influence over the hiring, firing, promotion,
transfer, reward or discipline of employees. Also, they may
or may not have access to confidential information.
Rank-and-file employees : These refer to employees who are in the technical, clerical,
sales, service, craftsmen, production, transport, cleaning and
related positions. They are not employees in managerial or
executive positions.
Full-time employees : These refer to employment where the normal hours of work
is at least 35 hours a week.
Annual leave entitlement : This refers to the leave entitlement of full-time employees for
a year of service. For employees on probation, their annual
leave is reported based on the entitlement after their
probation period.
Sickness absenteeism : This refers to the actual sick leave taken, regardless of
whether it is paid or unpaid.
Paid family care leave : This refers to paid leave granted to employees for taking care
of their family members (e.g. parents, step parents, parents-
in-law, children, spouse) or to accompany them for medical
MANPOWER RESEARCH AND STATISTICS DEPARTMENT, MINISTRY OF MANPOWER 21
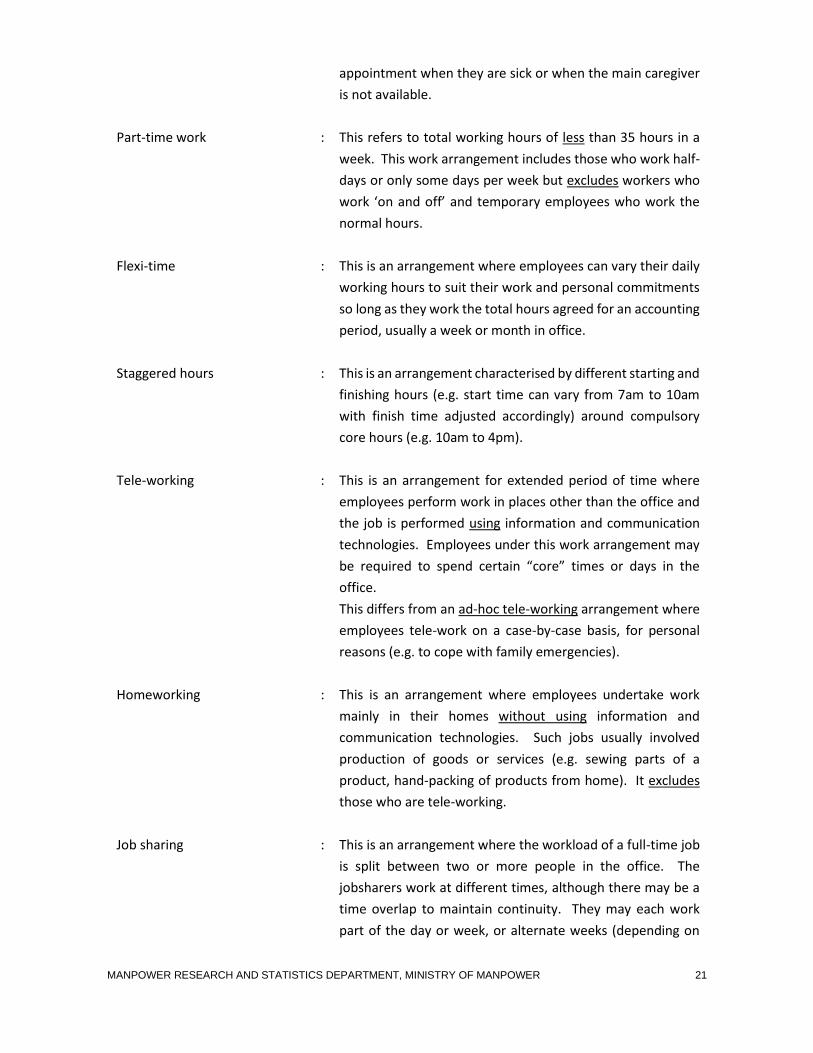
appointment when they are sick or when the main caregiver
is not available.
Part-time work : This refers to total working hours of less than 35 hours in a
week. This work arrangement includes those who work half-
days or only some days per week but excludes workers who
work ‘on and off’ and temporary employees who work the
normal hours.
Flexi-time : This is an arrangement where employees can vary their daily
working hours to suit their work and personal commitments
so long as they work the total hours agreed for an accounting
period, usually a week or month in office.
Staggered hours : This is an arrangement characterised by different starting and
finishing hours (e.g. start time can vary from 7am to 10am
with finish time adjusted accordingly) around compulsory
core hours (e.g. 10am to 4pm).
Tele-working : This is an arrangement for extended period of time where
employees perform work in places other than the office and
the job is performed using information and communication
technologies. Employees under this work arrangement may
be required to spend certain “core” times or days in the
office.
This differs from an ad-hoc tele-working arrangement where
employees tele-work on a case-by-case basis, for personal
reasons (e.g. to cope with family emergencies).
Homeworking : This is an arrangement where employees undertake work
mainly in their homes without using information and
communication technologies. Such jobs usually involved
production of goods or services (e.g. sewing parts of a
product, hand-packing of products from home). It excludes
those who are tele-working.
Job sharing : This is an arrangement where the workload of a full-time job
is split between two or more people in the office. The
jobsharers work at different times, although there may be a
time overlap to maintain continuity. They may each work
part of the day or week, or alternate weeks (depending on
MANPOWER RESEARCH AND STATISTICS DEPARTMENT, MINISTRY OF MANPOWER 22
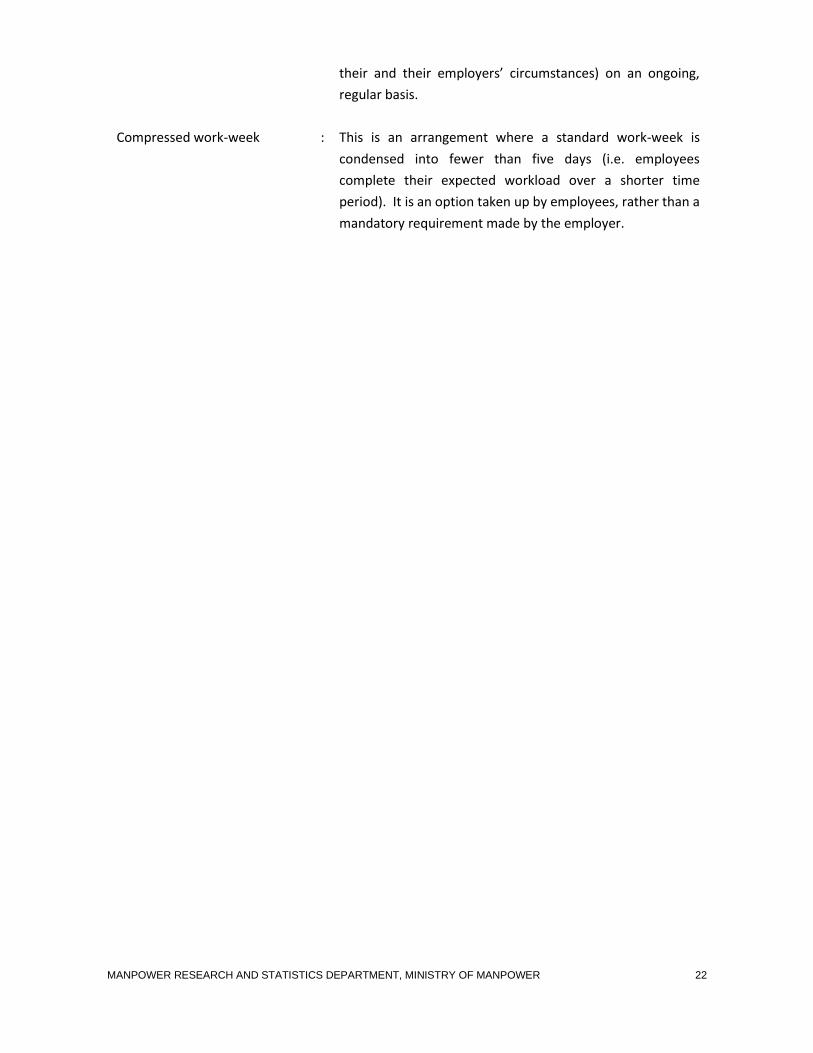
their and their employers’ circumstances) on an ongoing,
regular basis.
Compressed work-week : This is an arrangement where a standard work-week is
condensed into fewer than five days (i.e. employees
complete their expected workload over a shorter time
period). It is an option taken up by employees, rather than a
mandatory requirement made by the employer.
MANPOWER RESEARCH AND STATISTICS DEPARTMENT, MINISTRY OF MANPOWER 23
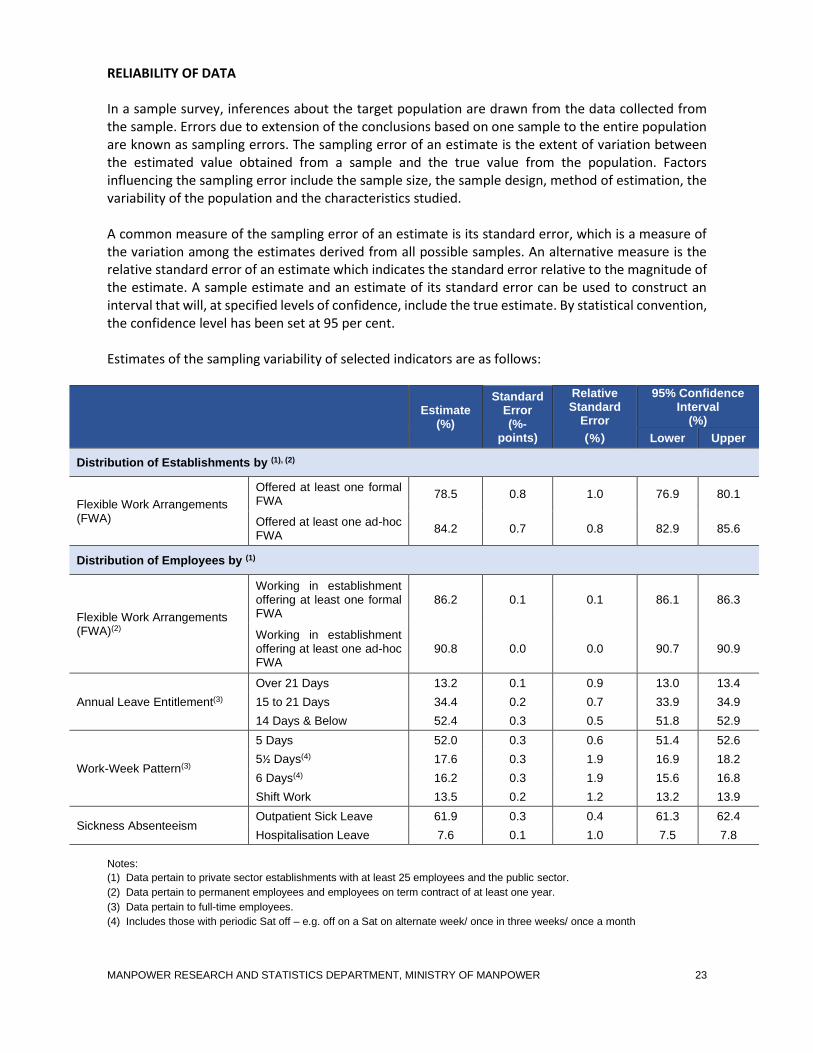
RELIABILITY OF DATA In a sample survey, inferences about the target population are drawn from the data collected from the sample. Errors due to extension of the conclusions based on one sample to the entire population are known as sampling errors. The sampling error of an estimate is the extent of variation between the estimated value obtained from a sample and the true value from the population. Factors influencing the sampling error include the sample size, the sample design, method of estimation, the variability of the population and the characteristics studied. A common measure of the sampling error of an estimate is its standard error, which is a measure of the variation among the estimates derived from all possible samples. An alternative measure is the relative standard error of an estimate which indicates the standard error relative to the magnitude of the estimate. A sample estimate and an estimate of its standard error can be used to construct an interval that will, at specified levels of confidence, include the true estimate. By statistical convention, the confidence level has been set at 95 per cent. Estimates of the sampling variability of selected indicators are as follows:
Estimate
(%)
Standard Error (%-
points)
Relative Standard
Error
(%)
95% Confidence Interval
(%)
Lower Upper
Distribution of Establishments by (1), (2)
Flexible Work Arrangements (FWA)
Offered at least one formal FWA
78.5 0.8 1.0 76.9 80.1
Offered at least one ad-hoc FWA 84.2 0.7 0.8 82.9 85.6
Distribution of Employees by (1)
Flexible Work Arrangements (FWA)(2)
Working in establishment offering at least one formal FWA
86.2 0.1 0.1 86.1 86.3
Working in establishment offering at least one ad-hoc FWA
90.8 0.0 0.0 90.7 90.9
Annual Leave Entitlement(3)
Over 21 Days 13.2 0.1 0.9 13.0 13.4
15 to 21 Days 34.4 0.2 0.7 33.9 34.9
14 Days & Below 52.4 0.3 0.5 51.8 52.9
Work-Week Pattern(3)
5 Days 52.0 0.3 0.6 51.4 52.6
5½ Days(4) 17.6 0.3 1.9 16.9 18.2
6 Days(4) 16.2 0.3 1.9 15.6 16.8
Shift Work 13.5 0.2 1.2 13.2 13.9
Sickness Absenteeism Outpatient Sick Leave 61.9 0.3 0.4 61.3 62.4
Hospitalisation Leave 7.6 0.1 1.0 7.5 7.8
Notes:
(1) Data pertain to private sector establishments with at least 25 employees and the public sector.
(2) Data pertain to permanent employees and employees on term contract of at least one year.
(3) Data pertain to full-time employees.
(4) Includes those with periodic Sat off – e.g. off on a Sat on alternate week/ once in three weeks/ once a month
MANPOWER RESEARCH AND STATISTICS DEPARTMENT, MINISTRY OF MANPOWER 24
Annex B: Statistical Tables
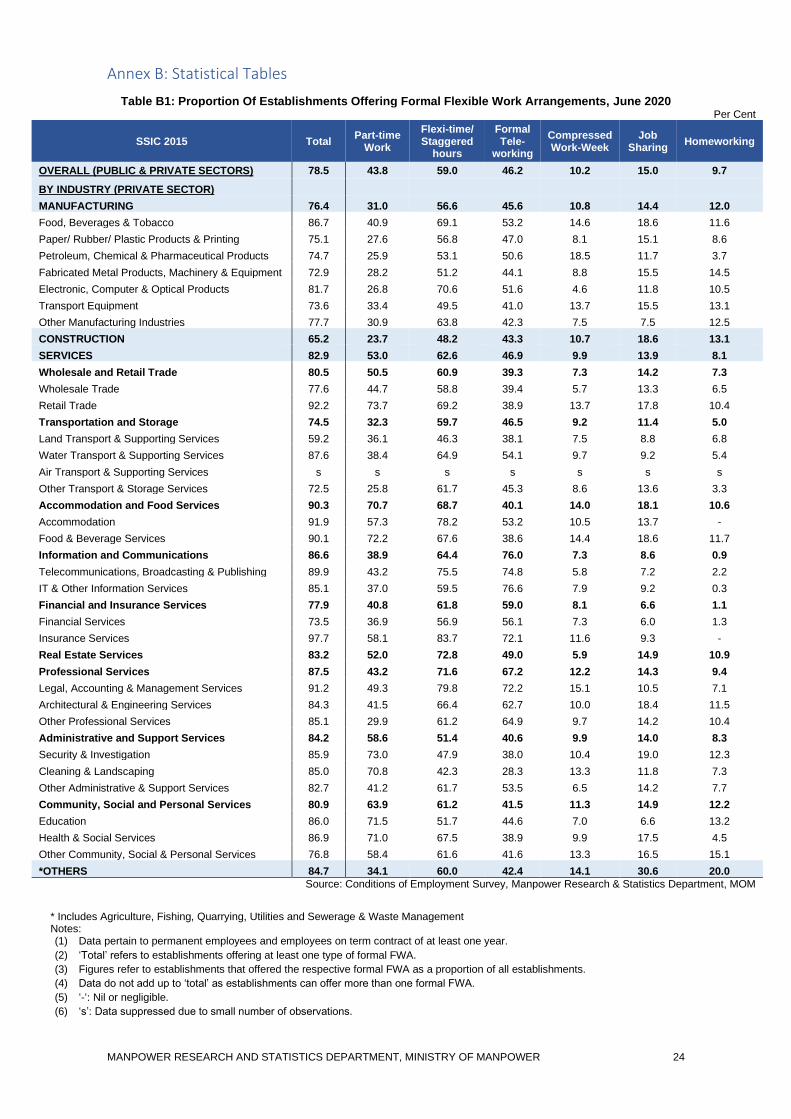
Table B1: Proportion Of Establishments Offering Formal Flexible Work Arrangements, June 2020
Per Cent
SSIC 2015 Total Part-time
Work
Flexi-time/ Staggered
hours
Formal Tele-
working
Compressed Work-Week
Job Sharing
Homeworking
OVERALL (PUBLIC & PRIVATE SECTORS) 78.5 43.8 59.0 46.2 10.2 15.0 9.7
BY INDUSTRY (PRIVATE SECTOR)
MANUFACTURING 76.4 31.0 56.6 45.6 10.8 14.4 12.0
Food, Beverages & Tobacco 86.7 40.9 69.1 53.2 14.6 18.6 11.6
Paper/ Rubber/ Plastic Products & Printing 75.1 27.6 56.8 47.0 8.1 15.1 8.6
Petroleum, Chemical & Pharmaceutical Products 74.7 25.9 53.1 50.6 18.5 11.7 3.7
Fabricated Metal Products, Machinery & Equipment 72.9 28.2 51.2 44.1 8.8 15.5 14.5
Electronic, Computer & Optical Products 81.7 26.8 70.6 51.6 4.6 11.8 10.5
Transport Equipment 73.6 33.4 49.5 41.0 13.7 15.5 13.1
Other Manufacturing Industries 77.7 30.9 63.8 42.3 7.5 7.5 12.5
CONSTRUCTION 65.2 23.7 48.2 43.3 10.7 18.6 13.1
SERVICES 82.9 53.0 62.6 46.9 9.9 13.9 8.1
Wholesale and Retail Trade 80.5 50.5 60.9 39.3 7.3 14.2 7.3
Wholesale Trade 77.6 44.7 58.8 39.4 5.7 13.3 6.5
Retail Trade 92.2 73.7 69.2 38.9 13.7 17.8 10.4
Transportation and Storage 74.5 32.3 59.7 46.5 9.2 11.4 5.0
Land Transport & Supporting Services 59.2 36.1 46.3 38.1 7.5 8.8 6.8
Water Transport & Supporting Services 87.6 38.4 64.9 54.1 9.7 9.2 5.4
Air Transport & Supporting Services s s s s s s s
Other Transport & Storage Services 72.5 25.8 61.7 45.3 8.6 13.6 3.3
Accommodation and Food Services 90.3 70.7 68.7 40.1 14.0 18.1 10.6
Accommodation 91.9 57.3 78.2 53.2 10.5 13.7 -
Food & Beverage Services 90.1 72.2 67.6 38.6 14.4 18.6 11.7
Information and Communications 86.6 38.9 64.4 76.0 7.3 8.6 0.9
Telecommunications, Broadcasting & Publishing 89.9 43.2 75.5 74.8 5.8 7.2 2.2
IT & Other Information Services 85.1 37.0 59.5 76.6 7.9 9.2 0.3
Financial and Insurance Services 77.9 40.8 61.8 59.0 8.1 6.6 1.1
Financial Services 73.5 36.9 56.9 56.1 7.3 6.0 1.3
Insurance Services 97.7 58.1 83.7 72.1 11.6 9.3 -
Real Estate Services 83.2 52.0 72.8 49.0 5.9 14.9 10.9
Professional Services 87.5 43.2 71.6 67.2 12.2 14.3 9.4
Legal, Accounting & Management Services 91.2 49.3 79.8 72.2 15.1 10.5 7.1
Architectural & Engineering Services 84.3 41.5 66.4 62.7 10.0 18.4 11.5
Other Professional Services 85.1 29.9 61.2 64.9 9.7 14.2 10.4
Administrative and Support Services 84.2 58.6 51.4 40.6 9.9 14.0 8.3
Security & Investigation 85.9 73.0 47.9 38.0 10.4 19.0 12.3
Cleaning & Landscaping 85.0 70.8 42.3 28.3 13.3 11.8 7.3
Other Administrative & Support Services 82.7 41.2 61.7 53.5 6.5 14.2 7.7
Community, Social and Personal Services 80.9 63.9 61.2 41.5 11.3 14.9 12.2
Education 86.0 71.5 51.7 44.6 7.0 6.6 13.2
Health & Social Services 86.9 71.0 67.5 38.9 9.9 17.5 4.5
Other Community, Social & Personal Services 76.8 58.4 61.6 41.6 13.3 16.5 15.1
*OTHERS 84.7 34.1 60.0 42.4 14.1 30.6 20.0
Source: Conditions of Employment Survey, Manpower Research & Statistics Department, MOM
* Includes Agriculture, Fishing, Quarrying, Utilities and Sewerage & Waste Management Notes: (1) Data pertain to permanent employees and employees on term contract of at least one year.
(2) ‘Total’ refers to establishments offering at least one type of formal FWA.
(3) Figures refer to establishments that offered the respective formal FWA as a proportion of all establishments.
(4) Data do not add up to ‘total’ as establishments can offer more than one formal FWA.
(5) ‘-‘: Nil or negligible.
(6) ‘s’: Data suppressed due to small number of observations.
MANPOWER RESEARCH AND STATISTICS DEPARTMENT, MINISTRY OF MANPOWER 25
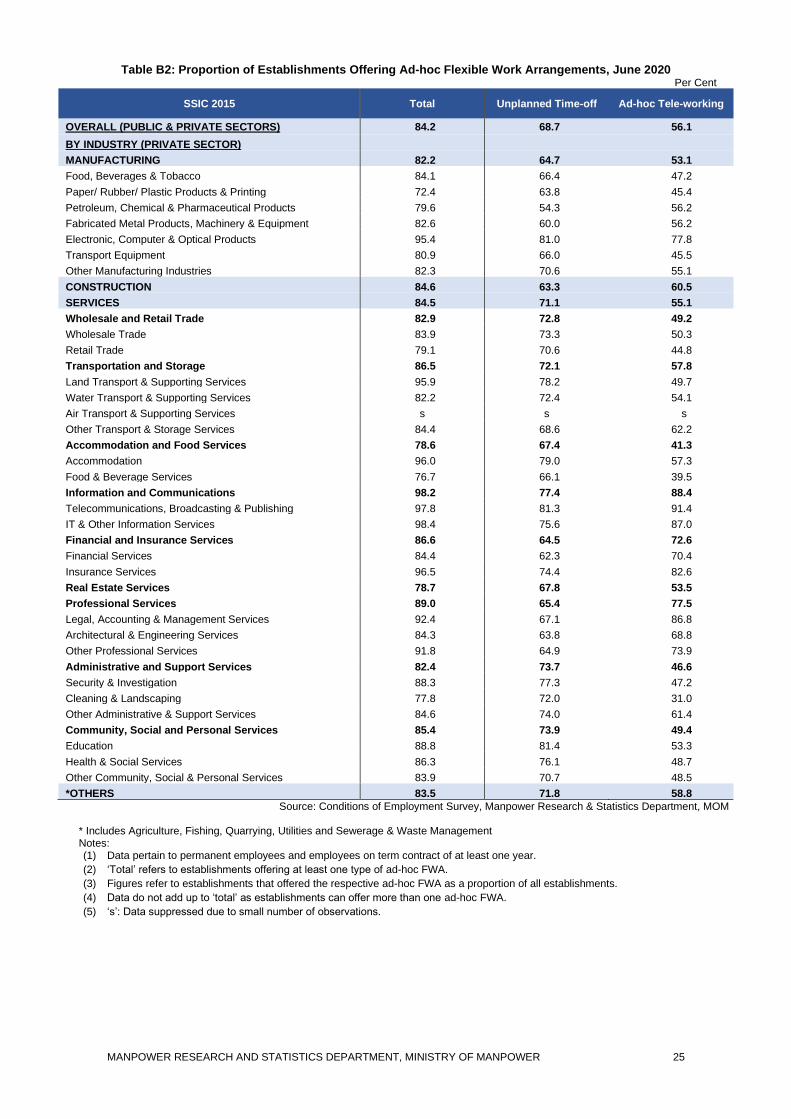
Table B2: Proportion of Establishments Offering Ad-hoc Flexible Work Arrangements, June 2020 Per Cent
SSIC 2015 Total Unplanned Time-off Ad-hoc Tele-working
OVERALL (PUBLIC & PRIVATE SECTORS) 84.2 68.7 56.1
BY INDUSTRY (PRIVATE SECTOR)
MANUFACTURING 82.2 64.7 53.1
Food, Beverages & Tobacco 84.1 66.4 47.2
Paper/ Rubber/ Plastic Products & Printing 72.4 63.8 45.4
Petroleum, Chemical & Pharmaceutical Products 79.6 54.3 56.2
Fabricated Metal Products, Machinery & Equipment 82.6 60.0 56.2
Electronic, Computer & Optical Products 95.4 81.0 77.8
Transport Equipment 80.9 66.0 45.5
Other Manufacturing Industries 82.3 70.6 55.1
CONSTRUCTION 84.6 63.3 60.5
SERVICES 84.5 71.1 55.1
Wholesale and Retail Trade 82.9 72.8 49.2
Wholesale Trade 83.9 73.3 50.3
Retail Trade 79.1 70.6 44.8
Transportation and Storage 86.5 72.1 57.8
Land Transport & Supporting Services 95.9 78.2 49.7
Water Transport & Supporting Services 82.2 72.4 54.1
Air Transport & Supporting Services s s s
Other Transport & Storage Services 84.4 68.6 62.2
Accommodation and Food Services 78.6 67.4 41.3
Accommodation 96.0 79.0 57.3
Food & Beverage Services 76.7 66.1 39.5
Information and Communications 98.2 77.4 88.4
Telecommunications, Broadcasting & Publishing 97.8 81.3 91.4
IT & Other Information Services 98.4 75.6 87.0
Financial and Insurance Services 86.6 64.5 72.6
Financial Services 84.4 62.3 70.4
Insurance Services 96.5 74.4 82.6
Real Estate Services 78.7 67.8 53.5
Professional Services 89.0 65.4 77.5
Legal, Accounting & Management Services 92.4 67.1 86.8
Architectural & Engineering Services 84.3 63.8 68.8
Other Professional Services 91.8 64.9 73.9
Administrative and Support Services 82.4 73.7 46.6
Security & Investigation 88.3 77.3 47.2
Cleaning & Landscaping 77.8 72.0 31.0
Other Administrative & Support Services 84.6 74.0 61.4
Community, Social and Personal Services 85.4 73.9 49.4
Education 88.8 81.4 53.3
Health & Social Services 86.3 76.1 48.7
Other Community, Social & Personal Services 83.9 70.7 48.5
*OTHERS 83.5 71.8 58.8
Source: Conditions of Employment Survey, Manpower Research & Statistics Department, MOM * Includes Agriculture, Fishing, Quarrying, Utilities and Sewerage & Waste Management Notes: (1) Data pertain to permanent employees and employees on term contract of at least one year.
(2) ‘Total’ refers to establishments offering at least one type of ad-hoc FWA.
(3) Figures refer to establishments that offered the respective ad-hoc FWA as a proportion of all establishments.
(4) Data do not add up to ‘total’ as establishments can offer more than one ad-hoc FWA.
(5) ‘s’: Data suppressed due to small number of observations.
MANPOWER RESEARCH AND STATISTICS DEPARTMENT, MINISTRY OF MANPOWER 26
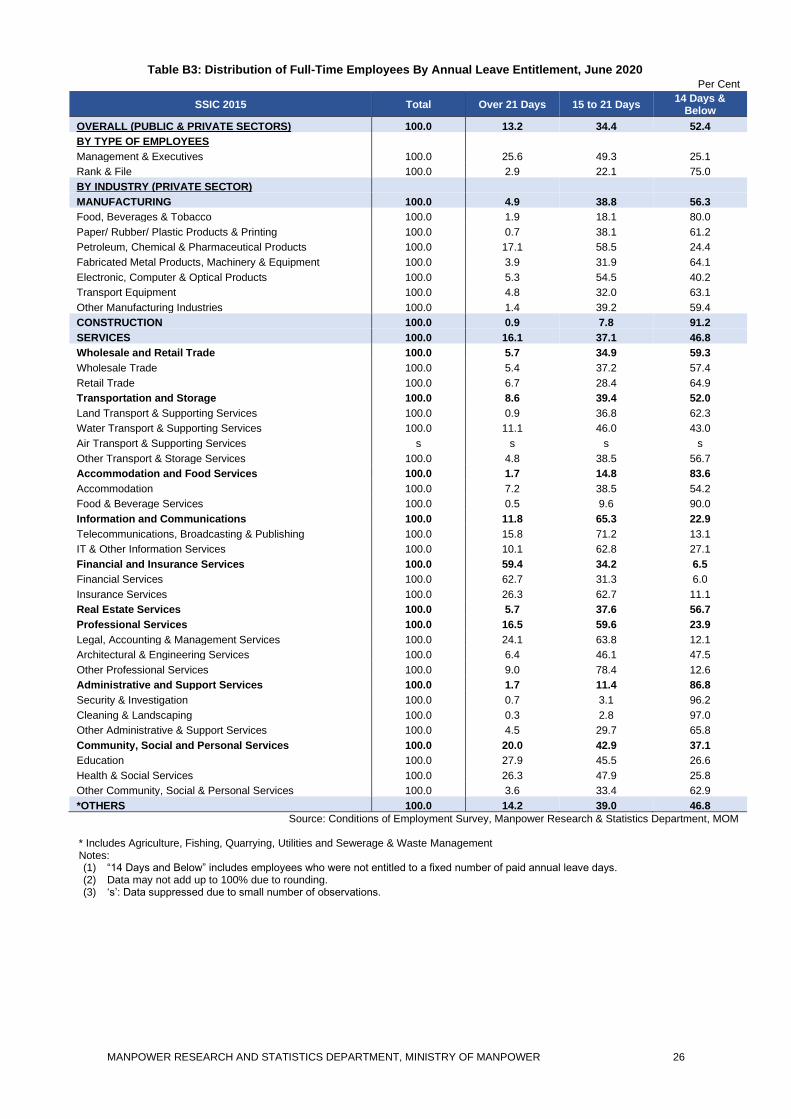
Table B3: Distribution of Full-Time Employees By Annual Leave Entitlement, June 2020
Per Cent
SSIC 2015 Total Over 21 Days 15 to 21 Days 14 Days &
Below
OVERALL (PUBLIC & PRIVATE SECTORS) 100.0 13.2 34.4 52.4
BY TYPE OF EMPLOYEES
Management & Executives 100.0 25.6 49.3 25.1
Rank & File 100.0 2.9 22.1 75.0
BY INDUSTRY (PRIVATE SECTOR)
MANUFACTURING 100.0 4.9 38.8 56.3
Food, Beverages & Tobacco 100.0 1.9 18.1 80.0
Paper/ Rubber/ Plastic Products & Printing 100.0 0.7 38.1 61.2
Petroleum, Chemical & Pharmaceutical Products 100.0 17.1 58.5 24.4
Fabricated Metal Products, Machinery & Equipment 100.0 3.9 31.9 64.1
Electronic, Computer & Optical Products 100.0 5.3 54.5 40.2
Transport Equipment 100.0 4.8 32.0 63.1
Other Manufacturing Industries 100.0 1.4 39.2 59.4
CONSTRUCTION 100.0 0.9 7.8 91.2
SERVICES 100.0 16.1 37.1 46.8
Wholesale and Retail Trade 100.0 5.7 34.9 59.3
Wholesale Trade 100.0 5.4 37.2 57.4
Retail Trade 100.0 6.7 28.4 64.9
Transportation and Storage 100.0 8.6 39.4 52.0
Land Transport & Supporting Services 100.0 0.9 36.8 62.3
Water Transport & Supporting Services 100.0 11.1 46.0 43.0
Air Transport & Supporting Services s s s s
Other Transport & Storage Services 100.0 4.8 38.5 56.7
Accommodation and Food Services 100.0 1.7 14.8 83.6
Accommodation 100.0 7.2 38.5 54.2
Food & Beverage Services 100.0 0.5 9.6 90.0
Information and Communications 100.0 11.8 65.3 22.9
Telecommunications, Broadcasting & Publishing 100.0 15.8 71.2 13.1
IT & Other Information Services 100.0 10.1 62.8 27.1
Financial and Insurance Services 100.0 59.4 34.2 6.5
Financial Services 100.0 62.7 31.3 6.0
Insurance Services 100.0 26.3 62.7 11.1
Real Estate Services 100.0 5.7 37.6 56.7
Professional Services 100.0 16.5 59.6 23.9
Legal, Accounting & Management Services 100.0 24.1 63.8 12.1
Architectural & Engineering Services 100.0 6.4 46.1 47.5
Other Professional Services 100.0 9.0 78.4 12.6
Administrative and Support Services 100.0 1.7 11.4 86.8
Security & Investigation 100.0 0.7 3.1 96.2
Cleaning & Landscaping 100.0 0.3 2.8 97.0
Other Administrative & Support Services 100.0 4.5 29.7 65.8
Community, Social and Personal Services 100.0 20.0 42.9 37.1
Education 100.0 27.9 45.5 26.6
Health & Social Services 100.0 26.3 47.9 25.8
Other Community, Social & Personal Services 100.0 3.6 33.4 62.9
*OTHERS 100.0 14.2 39.0 46.8
Source: Conditions of Employment Survey, Manpower Research & Statistics Department, MOM
* Includes Agriculture, Fishing, Quarrying, Utilities and Sewerage & Waste Management Notes: (1) “14 Days and Below” includes employees who were not entitled to a fixed number of paid annual leave days. (2) Data may not add up to 100% due to rounding. (3) ‘s’: Data suppressed due to small number of observations.
MANPOWER RESEARCH AND STATISTICS DEPARTMENT, MINISTRY OF MANPOWER 27
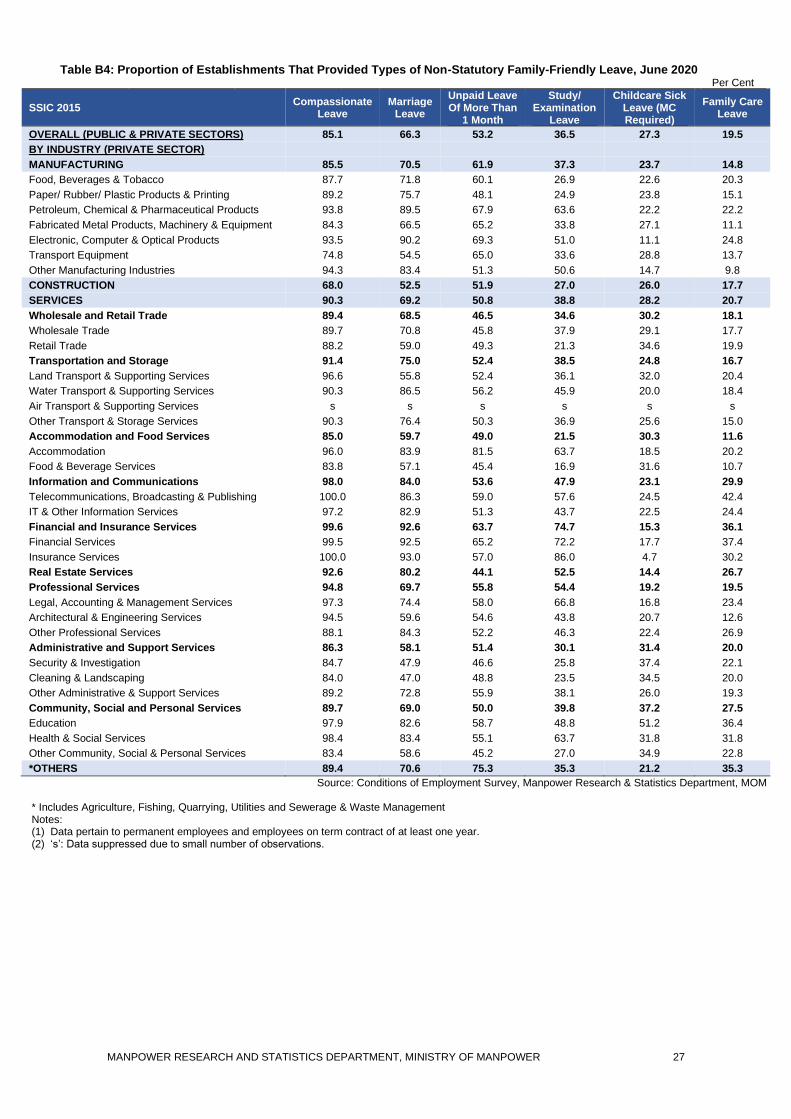
Table B4: Proportion of Establishments That Provided Types of Non-Statutory Family-Friendly Leave, June 2020 Per Cent
SSIC 2015 Compassionate
Leave Marriage
Leave
Unpaid Leave Of More Than
1 Month
Study/ Examination
Leave
Childcare Sick Leave (MC Required)
Family Care Leave
OVERALL (PUBLIC & PRIVATE SECTORS) 85.1 66.3 53.2 36.5 27.3 19.5
BY INDUSTRY (PRIVATE SECTOR)
MANUFACTURING 85.5 70.5 61.9 37.3 23.7 14.8
Food, Beverages & Tobacco 87.7 71.8 60.1 26.9 22.6 20.3
Paper/ Rubber/ Plastic Products & Printing 89.2 75.7 48.1 24.9 23.8 15.1
Petroleum, Chemical & Pharmaceutical Products 93.8 89.5 67.9 63.6 22.2 22.2
Fabricated Metal Products, Machinery & Equipment 84.3 66.5 65.2 33.8 27.1 11.1
Electronic, Computer & Optical Products 93.5 90.2 69.3 51.0 11.1 24.8
Transport Equipment 74.8 54.5 65.0 33.6 28.8 13.7
Other Manufacturing Industries 94.3 83.4 51.3 50.6 14.7 9.8
CONSTRUCTION 68.0 52.5 51.9 27.0 26.0 17.7
SERVICES 90.3 69.2 50.8 38.8 28.2 20.7
Wholesale and Retail Trade 89.4 68.5 46.5 34.6 30.2 18.1
Wholesale Trade 89.7 70.8 45.8 37.9 29.1 17.7
Retail Trade 88.2 59.0 49.3 21.3 34.6 19.9
Transportation and Storage 91.4 75.0 52.4 38.5 24.8 16.7
Land Transport & Supporting Services 96.6 55.8 52.4 36.1 32.0 20.4
Water Transport & Supporting Services 90.3 86.5 56.2 45.9 20.0 18.4
Air Transport & Supporting Services s s s s s s
Other Transport & Storage Services 90.3 76.4 50.3 36.9 25.6 15.0
Accommodation and Food Services 85.0 59.7 49.0 21.5 30.3 11.6
Accommodation 96.0 83.9 81.5 63.7 18.5 20.2
Food & Beverage Services 83.8 57.1 45.4 16.9 31.6 10.7
Information and Communications 98.0 84.0 53.6 47.9 23.1 29.9
Telecommunications, Broadcasting & Publishing 100.0 86.3 59.0 57.6 24.5 42.4
IT & Other Information Services 97.2 82.9 51.3 43.7 22.5 24.4
Financial and Insurance Services 99.6 92.6 63.7 74.7 15.3 36.1
Financial Services 99.5 92.5 65.2 72.2 17.7 37.4
Insurance Services 100.0 93.0 57.0 86.0 4.7 30.2
Real Estate Services 92.6 80.2 44.1 52.5 14.4 26.7
Professional Services 94.8 69.7 55.8 54.4 19.2 19.5
Legal, Accounting & Management Services 97.3 74.4 58.0 66.8 16.8 23.4
Architectural & Engineering Services 94.5 59.6 54.6 43.8 20.7 12.6
Other Professional Services 88.1 84.3 52.2 46.3 22.4 26.9
Administrative and Support Services 86.3 58.1 51.4 30.1 31.4 20.0
Security & Investigation 84.7 47.9 46.6 25.8 37.4 22.1
Cleaning & Landscaping 84.0 47.0 48.8 23.5 34.5 20.0
Other Administrative & Support Services 89.2 72.8 55.9 38.1 26.0 19.3
Community, Social and Personal Services 89.7 69.0 50.0 39.8 37.2 27.5
Education 97.9 82.6 58.7 48.8 51.2 36.4
Health & Social Services 98.4 83.4 55.1 63.7 31.8 31.8
Other Community, Social & Personal Services 83.4 58.6 45.2 27.0 34.9 22.8
*OTHERS 89.4 70.6 75.3 35.3 21.2 35.3
Source: Conditions of Employment Survey, Manpower Research & Statistics Department, MOM
* Includes Agriculture, Fishing, Quarrying, Utilities and Sewerage & Waste Management Notes: (1) Data pertain to permanent employees and employees on term contract of at least one year. (2) ‘s’: Data suppressed due to small number of observations.
MANPOWER RESEARCH AND STATISTICS DEPARTMENT, MINISTRY OF MANPOWER 28
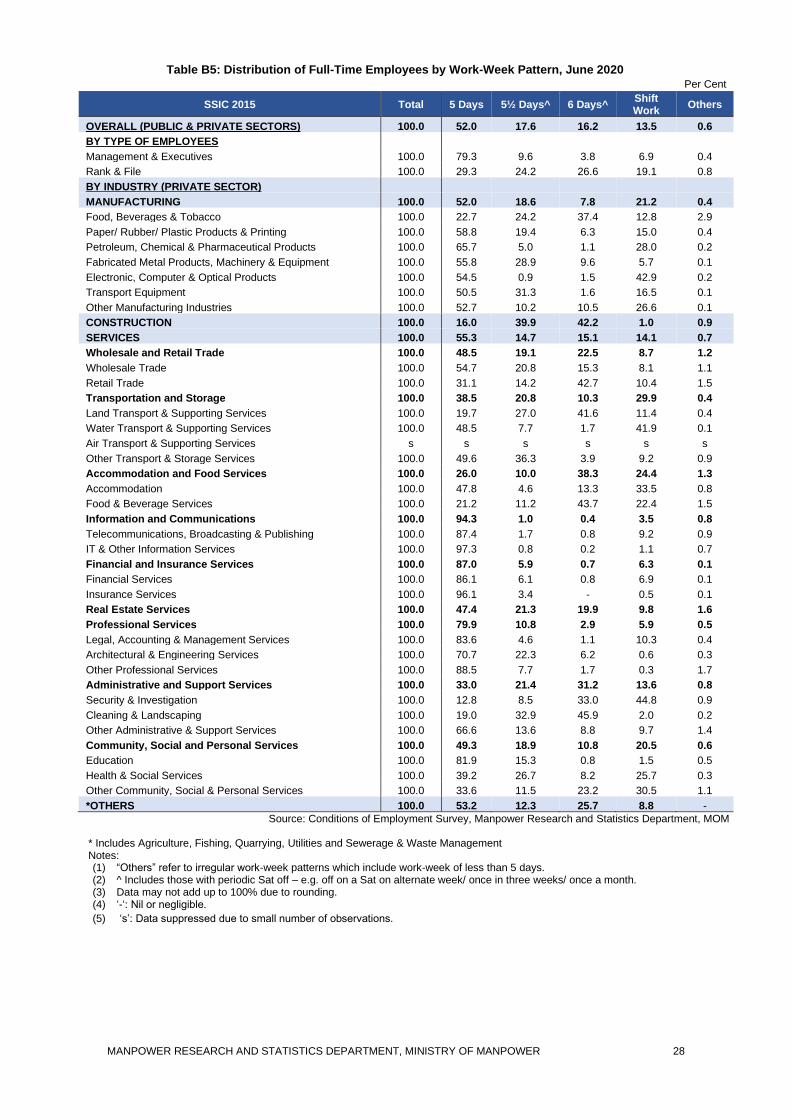
Table B5: Distribution of Full-Time Employees by Work-Week Pattern, June 2020
Per Cent
SSIC 2015 Total 5 Days 5½ Days^ 6 Days^ Shift Work
Others
OVERALL (PUBLIC & PRIVATE SECTORS) 100.0 52.0 17.6 16.2 13.5 0.6
BY TYPE OF EMPLOYEES
Management & Executives 100.0 79.3 9.6 3.8 6.9 0.4
Rank & File 100.0 29.3 24.2 26.6 19.1 0.8
BY INDUSTRY (PRIVATE SECTOR)
MANUFACTURING 100.0 52.0 18.6 7.8 21.2 0.4
Food, Beverages & Tobacco 100.0 22.7 24.2 37.4 12.8 2.9
Paper/ Rubber/ Plastic Products & Printing 100.0 58.8 19.4 6.3 15.0 0.4
Petroleum, Chemical & Pharmaceutical Products 100.0 65.7 5.0 1.1 28.0 0.2
Fabricated Metal Products, Machinery & Equipment 100.0 55.8 28.9 9.6 5.7 0.1
Electronic, Computer & Optical Products 100.0 54.5 0.9 1.5 42.9 0.2
Transport Equipment 100.0 50.5 31.3 1.6 16.5 0.1
Other Manufacturing Industries 100.0 52.7 10.2 10.5 26.6 0.1
CONSTRUCTION 100.0 16.0 39.9 42.2 1.0 0.9
SERVICES 100.0 55.3 14.7 15.1 14.1 0.7
Wholesale and Retail Trade 100.0 48.5 19.1 22.5 8.7 1.2
Wholesale Trade 100.0 54.7 20.8 15.3 8.1 1.1
Retail Trade 100.0 31.1 14.2 42.7 10.4 1.5
Transportation and Storage 100.0 38.5 20.8 10.3 29.9 0.4
Land Transport & Supporting Services 100.0 19.7 27.0 41.6 11.4 0.4
Water Transport & Supporting Services 100.0 48.5 7.7 1.7 41.9 0.1
Air Transport & Supporting Services s s s s s s
Other Transport & Storage Services 100.0 49.6 36.3 3.9 9.2 0.9
Accommodation and Food Services 100.0 26.0 10.0 38.3 24.4 1.3
Accommodation 100.0 47.8 4.6 13.3 33.5 0.8
Food & Beverage Services 100.0 21.2 11.2 43.7 22.4 1.5
Information and Communications 100.0 94.3 1.0 0.4 3.5 0.8
Telecommunications, Broadcasting & Publishing 100.0 87.4 1.7 0.8 9.2 0.9
IT & Other Information Services 100.0 97.3 0.8 0.2 1.1 0.7
Financial and Insurance Services 100.0 87.0 5.9 0.7 6.3 0.1
Financial Services 100.0 86.1 6.1 0.8 6.9 0.1
Insurance Services 100.0 96.1 3.4 - 0.5 0.1
Real Estate Services 100.0 47.4 21.3 19.9 9.8 1.6
Professional Services 100.0 79.9 10.8 2.9 5.9 0.5
Legal, Accounting & Management Services 100.0 83.6 4.6 1.1 10.3 0.4
Architectural & Engineering Services 100.0 70.7 22.3 6.2 0.6 0.3
Other Professional Services 100.0 88.5 7.7 1.7 0.3 1.7
Administrative and Support Services 100.0 33.0 21.4 31.2 13.6 0.8
Security & Investigation 100.0 12.8 8.5 33.0 44.8 0.9
Cleaning & Landscaping 100.0 19.0 32.9 45.9 2.0 0.2
Other Administrative & Support Services 100.0 66.6 13.6 8.8 9.7 1.4
Community, Social and Personal Services 100.0 49.3 18.9 10.8 20.5 0.6
Education 100.0 81.9 15.3 0.8 1.5 0.5
Health & Social Services 100.0 39.2 26.7 8.2 25.7 0.3
Other Community, Social & Personal Services 100.0 33.6 11.5 23.2 30.5 1.1
*OTHERS 100.0 53.2 12.3 25.7 8.8 -
Source: Conditions of Employment Survey, Manpower Research and Statistics Department, MOM * Includes Agriculture, Fishing, Quarrying, Utilities and Sewerage & Waste Management Notes: (1) “Others” refer to irregular work-week patterns which include work-week of less than 5 days. (2) ^ Includes those with periodic Sat off – e.g. off on a Sat on alternate week/ once in three weeks/ once a month. (3) Data may not add up to 100% due to rounding. (4) ‘-‘: Nil or negligible.
(5) ‘s’: Data suppressed due to small number of observations.
MANPOWER RESEARCH AND STATISTICS DEPARTMENT, MINISTRY OF MANPOWER 29
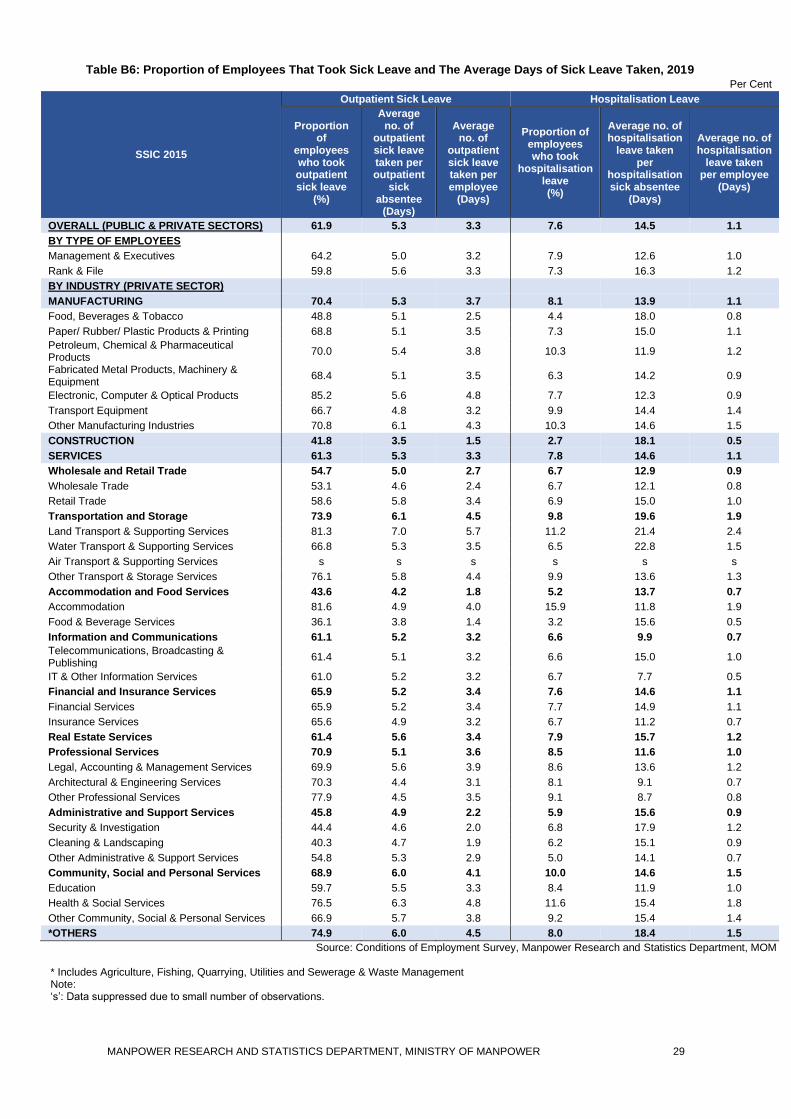
Table B6: Proportion of Employees That Took Sick Leave and The Average Days of Sick Leave Taken, 2019
Per Cent
SSIC 2015
Outpatient Sick Leave Hospitalisation Leave
Proportion of
employees who took outpatient sick leave
(%)
Average no. of
outpatient sick leave taken per outpatient
sick absentee
(Days)
Average no. of
outpatient sick leave taken per employee
(Days)
Proportion of employees who took
hospitalisation leave (%)
Average no. of hospitalisation
leave taken per
hospitalisation sick absentee
(Days)
Average no. of hospitalisation
leave taken per employee
(Days)
OVERALL (PUBLIC & PRIVATE SECTORS) 61.9 5.3 3.3 7.6 14.5 1.1
BY TYPE OF EMPLOYEES
Management & Executives 64.2 5.0 3.2 7.9 12.6 1.0
Rank & File 59.8 5.6 3.3 7.3 16.3 1.2
BY INDUSTRY (PRIVATE SECTOR)
MANUFACTURING 70.4 5.3 3.7 8.1 13.9 1.1
Food, Beverages & Tobacco 48.8 5.1 2.5 4.4 18.0 0.8
Paper/ Rubber/ Plastic Products & Printing 68.8 5.1 3.5 7.3 15.0 1.1
Petroleum, Chemical & Pharmaceutical Products
70.0 5.4 3.8 10.3 11.9 1.2
Fabricated Metal Products, Machinery & Equipment
68.4 5.1 3.5 6.3 14.2 0.9
Electronic, Computer & Optical Products 85.2 5.6 4.8 7.7 12.3 0.9
Transport Equipment 66.7 4.8 3.2 9.9 14.4 1.4
Other Manufacturing Industries 70.8 6.1 4.3 10.3 14.6 1.5
CONSTRUCTION 41.8 3.5 1.5 2.7 18.1 0.5
SERVICES 61.3 5.3 3.3 7.8 14.6 1.1
Wholesale and Retail Trade 54.7 5.0 2.7 6.7 12.9 0.9
Wholesale Trade 53.1 4.6 2.4 6.7 12.1 0.8
Retail Trade 58.6 5.8 3.4 6.9 15.0 1.0
Transportation and Storage 73.9 6.1 4.5 9.8 19.6 1.9
Land Transport & Supporting Services 81.3 7.0 5.7 11.2 21.4 2.4
Water Transport & Supporting Services 66.8 5.3 3.5 6.5 22.8 1.5
Air Transport & Supporting Services s s s s s s
Other Transport & Storage Services 76.1 5.8 4.4 9.9 13.6 1.3
Accommodation and Food Services 43.6 4.2 1.8 5.2 13.7 0.7
Accommodation 81.6 4.9 4.0 15.9 11.8 1.9
Food & Beverage Services 36.1 3.8 1.4 3.2 15.6 0.5
Information and Communications 61.1 5.2 3.2 6.6 9.9 0.7
Telecommunications, Broadcasting & Publishing
61.4 5.1 3.2 6.6 15.0 1.0
IT & Other Information Services 61.0 5.2 3.2 6.7 7.7 0.5
Financial and Insurance Services 65.9 5.2 3.4 7.6 14.6 1.1
Financial Services 65.9 5.2 3.4 7.7 14.9 1.1
Insurance Services 65.6 4.9 3.2 6.7 11.2 0.7
Real Estate Services 61.4 5.6 3.4 7.9 15.7 1.2
Professional Services 70.9 5.1 3.6 8.5 11.6 1.0
Legal, Accounting & Management Services 69.9 5.6 3.9 8.6 13.6 1.2
Architectural & Engineering Services 70.3 4.4 3.1 8.1 9.1 0.7
Other Professional Services 77.9 4.5 3.5 9.1 8.7 0.8
Administrative and Support Services 45.8 4.9 2.2 5.9 15.6 0.9
Security & Investigation 44.4 4.6 2.0 6.8 17.9 1.2
Cleaning & Landscaping 40.3 4.7 1.9 6.2 15.1 0.9
Other Administrative & Support Services 54.8 5.3 2.9 5.0 14.1 0.7
Community, Social and Personal Services 68.9 6.0 4.1 10.0 14.6 1.5
Education 59.7 5.5 3.3 8.4 11.9 1.0
Health & Social Services 76.5 6.3 4.8 11.6 15.4 1.8
Other Community, Social & Personal Services 66.9 5.7 3.8 9.2 15.4 1.4
*OTHERS 74.9 6.0 4.5 8.0 18.4 1.5
Source: Conditions of Employment Survey, Manpower Research and Statistics Department, MOM
* Includes Agriculture, Fishing, Quarrying, Utilities and Sewerage & Waste Management Note: ‘s’: Data suppressed due to small number of observations.
FEEDBACK FORM Report Title: Conditions of Employment 2020
1. How would you rate this report in terms of : Excellent Good Average Poor
a) Relevance to your work b) Providing useful insights on prevailing labour market trends/development c) Ease of understanding
2. Which area(s) of the report do you find most useful? Please provide reasons. 3. How do you find the length of the report?
Too detailed Just right Too brief
Excellent Good Average Poor
4. Overall, how would you rate this report? 5. What additional information (if any) would you like us to include in our future issues? 6. Any other comments or suggestions you wish to bring to our attention?
Thank you for your valuable feedback
Name : Email/Contact No:
Company/Designation :
Please return the above to: Director Manpower Research and Statistics Department
Ministry of Manpower 18 Havelock Road #05-01 Singapore 059764 Republic of Singapore Fax : 6317 1804 Email : [email protected]